week three. map of the day data: terrorist plots and drone strike locations in yemen goal: 1 map...
TRANSCRIPT

WEEK THREE

Map of the Day
• Data: Terrorist Plots AND Drone Strike Locations in Yemen
• Goal: 1 map that shows both
• 2000-2012
• What does your map look like?


Principles of Symbolization
•EMR 21
•September 19, 2012
•Chapter 5 / Slocum Text

What’s the point?
• The Basic Principles of Symbolizing Phenomena
• The Congruence Principle
• Lots of ways to think about and differentiate geographic phenomena
• Different kinds of phenomena need different kinds of maps

Diagnose your data
• Different data require different visual treatments

Diagnose your data
• Different data require different visual treatments
• Build a visual structure that mimics the nature of your data’s structure
• Qualitative vs. Quantitative / Discrete vs. Continuous / Abrupt vs. Smooth
• Points, Lines, Polygons, Volumes
• Levels of Measurement
• Visual Variables
The thematic map
• Also called the “statistical map,” “single-topic map,” or the “special-purpose” map
• Less literal than a general-reference map
• Two groups of thematic maps: qualitative and quantitative

The 2 kinds of thematic maps
•Qualitative thematic maps
• Show the spatial distribution or location of kind
• Land use
• Soil types
• Languages
• Restaurants
• These maps are concerned with kinds, names, types (nominal data)

The 2 kinds of thematic maps
•Quantitative thematic maps
• Spatial aspects of numerical data
• Corn yield
• Per Capita Income
• Number of Tornadoes
• Population Density
• These maps are concerned with amounts, or quantities
• Can you tell the difference?
• Is the attribute a quantity or a quality?

This here is a Thematic map: Lung cancer in white males, by Brewer
Qualitative or Quantitative?

Qualitative or Quantitative?

Why Does This Matter?

Qualitative or Quantitative?


Geographic Phenomena
•The things we want to map
•5 geometric models of geographic phenomena
•Differentiated by spatial dimensions

Spatial Arrangement of Data
•5 types of geographic phenomena
•differentiated by spatial dimensions
•Zero-dimensional – ?
•One-dimensional - ?
•Two-dimensional - ?

Spatial Arrangement of Data
• 5 types of geographic phenomena
• Separated by spatial dimensions
•Zero-dimensional – points
•One-dimensional - lines
•Two-dimensional – areas
•2.5-dimensional - ?
•Three-dimensional - ?

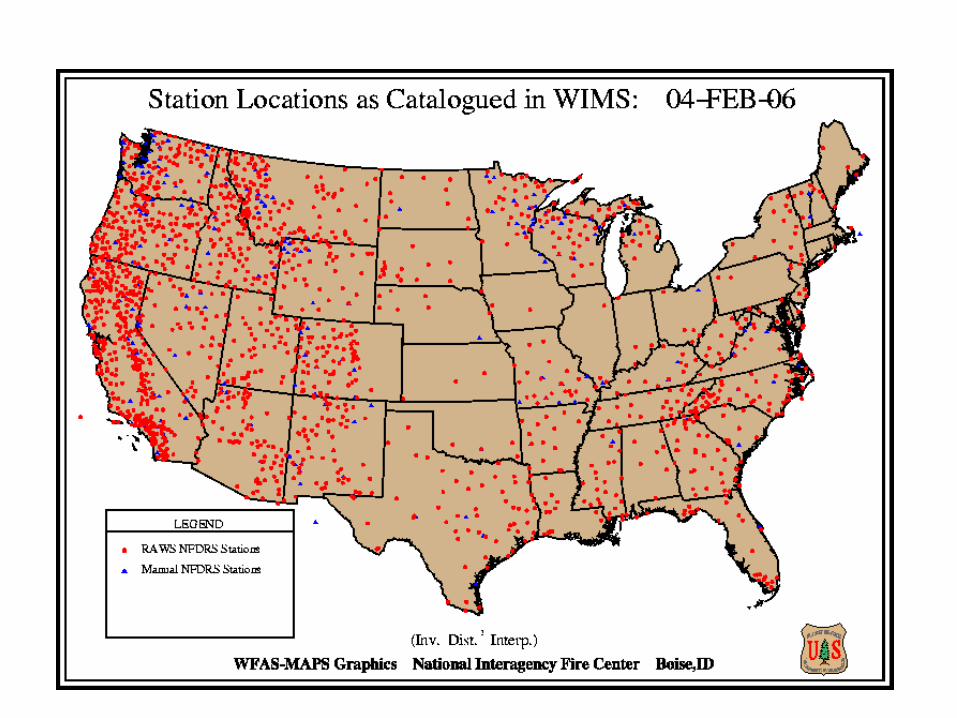
Point Phenomena
•Points have no spatial-extent: zero-dimensional

Point Phenomena
•Points have no spatial-extent: zero-dimensional
•Examples of geographic point data?

Point Phenomena
•Points have no spatial-extent: zero-dimensional
•Examples of geographic point data?
•Weather stations, oil wells, eagle nesting sites
•Location described by coordinates
•(X,Y)
•(X,Y,Z)


Linear Phenomena
•Lines have 1 dimension: length, but no width
•Examples of geographic lines?

Linear Phenomena
•Lines have 1 dimension: length, but no width
•Examples of geographic lines?
•Borders between countries
•Flight lines

Linear Phenomena
•Lines have 1 dimension: length, but no width
•Examples of geographic lines?
•Borders between countries
•Flight lines
•Described by a series of coordinate locations


Areal Data
•2-dimensional in spatial extent: length and width
•Examples of geographic areas?

Areal Data
•2-dimensional in spatial extent: length and width
•Examples of geographic areas?
•Lakes, political areas…
•Described using a series of coordinates that close a region


Volumetric Phenomena
•2.5-Dimensional Phenomena
•3-Dimensional Phenomena

Volumetric Phenomena
•2.5-Dimensional Phenomena
•1 x value, 1 y value, 1 z value
•Every x,y pair has a single value associated with it
•“A surface” – example: elevation
•3-Dimensional Phenomena

Volumetric Phenomena
• 2.5-Dimensional Phenomena
•1 x value, 1 y value, 1 z value
•Every x,y pair has a single value associated with it
• “A surface” – example: elevation
• 3-Dimensional Phenomena
•True 3-D data are multivalued
•Each x,y pair can have many z values

True 3-D phenomena
• 4 important values
1. X-value
2. Y-value
3. Z-value (height above or below)

True 3-D phenomena
• 4 important values
1. X-value
2. Y-value
3. Z-value (height above or below)
4. Measured value of Phenomenon

True 3-D phenomena
• 4 important values
1. X-value
2. Y-value
3. Z-value (height above or below)
4. Measured value of Phenomenon
• The first 3 are locational coordinates, the last describes the attribute
• EXAMPLES?

How does map scale influence spatial
dimension?•Map Scale and cities?
•Map Scale and rivers?
•Models of geographic phenomena
•Reducing geographic realities to geometric primitives

Other phenomenal characteristics
•Discrete v. Continuous
•Abrupt v. Smooth

Discrete Phenomena
•Occur at distinct location
•With space in between
•Examples: people living in a city – as points, space between
•Weather stations
•Restaurants

Continuous Phenomena
•Continuous phenomena are defined everywhere:
•Examples: elevation, air pressure, temperature, land cover

How do they change?
•Phenomenon can change two main ways over space…
•Abruptly or Smoothly

What things change abruptly?

What things change abruptly?
•Tax rates
•Spending on public school students
•Number of postal employees
•# of electoral votes

What things change smoothly?

What things change smoothly?
•Precipitation levels
•Influenza cases
•See figure 4.1 in your book.

Discrete/ContinuousAbrupt/Smooth
• Who cares??

Ratio of Unmarried Men to Unmarried Women in US
(Census)
• Who cares??


Terrorist Plots and Drone Strikes in Yemen 2000-2012
• Who cares??


NBA Field Goal Percentage
• Who cares??


