weekly coronavirus disease 2019 (covid 19) surveillance report … · year: 2020 week: 26community...
TRANSCRIPT

1
Weekly Coronavirus Disease 2019 (COVID-19) Surveillance Report
Summary of COVID-19 surveillance systems
Year: 2020 Week: 26
This report summarises the information from the surveillance systems which are used to monitor
the Coronavirus Disease 2019 (COVID-19) pandemic in England. More information on the
surveillance systems are available here.
The report is based on week 25 (data between 15 June and 21 June 2020) and where available
daily data up to 24 June 2020. References to COVID-19 represent the disease name and SARS-
CoV-2 represent the virus name.
Summary
COVID-19 activity continued to decline in England across a range of surveillance indicators during week 25.
The rate of decline in laboratory confirmed case detections has slowed with close to 5,700 cases detected in week 25 compared to just over 6,500 in week 24. Over 70% of cases are now detected through testing outside of hospitals. Case detections remain highest in the north of the country and there have been increases in case detections through outside of hospital testing in Yorkshire and Humber over the past 2 weeks. At a local authority level, activity was highest in parts of West Yorkshire, Greater Manchester and in Leicester. Case detections remain highest in older age groups.
There was a small increase in the total number of suspected or confirmed acute respiratory infection outbreaks in week 25, with little change in the number of outbreaks in care homes, hospitals or ‘other settings’ but an increase in the number of suspected or confirmed school outbreaks. School outbreaks have increased over the past 2 weeks from 15 in week 23, to 24 in week 24, to 44 in week 25. This coincides with wider school reopening since week 23 but also an expansion of testing and contact tracing.
Community and syndromic surveillance indicators, while not specific for COVID-19, tend to be early indicators of changes in respiratory viral activity. The majority of these indicators have remained stable. There was an increase in GP out-of-hours contacts for difficulty breathing/wheeze/asthma last week, which is likely linked with thunderstorm activity and associated ‘thunderstorm asthma’.
There were no detections in week 25 through GP sentinel swabbing, though the number of people swabbed through the GP sentinel scheme has declined in recent weeks. This is likely due to increased access to testing through other routes.
Emergency department attendances with a COVID-19-like diagnosis and hospitalisations and critical care admissions for confirmed COVID-19 continue to decline slowly.
COVID-19 deaths also continue to decline and, while delays to death registrations can impact on the most recent data, there was no detectable excess mortality in week 24 in any age group or region.
Data based on samples from blood donors suggests that seroprevalence is plateauing. Seroprevalence remains highest in London, with an adjusted prevalence of around 15% based on samples from week 21). New data from samples collected in the Midlands and North East in week 24 are included in this week’s report, with seroprevalence plateauing at around 6-7% in these regions. Seroprevalence remains highest in younger adults, though there have been relatively greater increases in prevalence in older adults over time, suggesting these age groups being affected later. These patterns may reflect differences in behaviour and mixing pat-terns in the different age groups.
© Crown copyright 2020

2
Year: 2020 Week: 26 Confirmed cases in England
As of 09:00 on 24 June 2020, a total of 1,374,773 people have been tested under Pillar 1. A to-
tal of 238,911 have been confirmed positive for COVID-19 in England under Pillar 1 and 2.
Figures 1 to 4, 6 and 8 to 10 and Tables 1 and 2 reflect cases tested under Pillar 1 (primarily in
hospital testing of patients and some healthcare workers) and Pillar 2 (out of hospital testing).
Figures 5 and 7 reflect cases tested under Pillar 1 only.
Overall case numbers and positivity continue to decrease in week 25. The highest number of
cases continued to be seen in the older age groups, in particular in the 85+ age group. Rates
and positivity of cases continue to be highest in the North and Central regions of England.
Figure 1: Laboratory confirmed COVID-19 cases tested under Pillar 1 (n=159,435) and
Pillar 2 (n=79,476), based on sample week with overall positivity for Pillar 1 only (%)
* For the most recent week, more samples are expected therefore the decrease seen in this graph should be interpreted
with caution. The data are shown by the week the specimen was taken from the person being tested. This gives the
most accurate analysis of this time progression, but it does mean that the latest days’ figures may be incomplete.

3
Confirmed cases in England
Figure 4: Weekly laboratory confirmed COVID-19 case rates per 100,000, tested under (a)
Pillar 1 and (b) Pillar 2 , by age group
Figure 3: Weekly laboratory confirmed COVID-19 case rates per 100,000, tested under
(a) Pillar 1 and (b) Pillar 2, by gender
Figure 2: Age/sex pyramids for laboratory confirmed COVID-19 cases tested through (a)
Pillar 1 (n=157,101) and (b) Pillar 2 (n=78,616)
(a) (b)
Age and gender
(a) (b)
(a) (b)
Year: 2020 Week: 26

4
Confirmed cases in England
Figure 5: Weekly positivity (%) of laboratory confirmed COVID-19 cases tested un-
der Pillar 1, (a) overall and by gender and (b) by male and age group (c) by female
and age group (SGSS and Respiratory DataMart)
(a) Overall positivity % and by gender
(b) Male (c) Female
Year: 2020 Week: 26

5
Year: 2020 Week: 26 Confirmed cases in England
Table 1: Cumulative number of cases under Pillar 1 (n=152,880) and Pillar 2 (n=77,927)
and total number of people tested under Pillar 1 (n=1,247,854) by PHE Centres
Figure 6: Weekly laboratory confirmed COVID-19 case rates per 100,000 population
tested under (a) Pillar 1 and (b) Pillar 2, by PHE Centres and sample week
Figure 7: Weekly positivity of laboratory confirmed COVID-19 cases tested under Pillar 1
(%) by PHE Centres and sample week, (SGSS and Respiratory DataMart)
PHE Centres and upper-tier local authority (UTLA)
(a) (b)

6
Year: 2020 Week: 26 Confirmed cases in England
Figure 8: Cumulative rate of COVID-19 cases per 100,000 population tested under Pil-
lar 1 and 2, by upper-tier local authority, England (box shows enlarged maps of Lon-
don area)
Figure 9: Weekly rate of COVID-19 cases per 100,000 population tested under Pillar 1
and 2, by upper-tier local authority, England (box shows enlarged maps of London ar-
ea)

7
Year: 2020 Week: 26 Confirmed cases in England
Figure 10: Ethnic group of cumulative laboratory confirmed COVID-19 cases tested under
Pillar 1 and 2 (n=199,137)
Table 2: Number of cases tested under Pillar 1 and 2, and percentage (%) by ethnic
group and week
Ethnicity

8
Year: 2020 Week: 26 Community surveillance
This section summarises the monitoring of acute respiratory outbreaks and internet based sur-
veillance systems for COVID-19.
Acute respiratory outbreaks, England
223 new acute respiratory outbreaks have been reported in week 25 (Figure 11): • 106 outbreaks were from care homes where 75 tested positive for SARS-CoV-2 • 28 outbreaks were from hospitals where 24 tested positive for SARS-CoV-2 • 44 outbreaks were from schools where 23 tested positive for SARS-CoV-2 • 2 outbreaks were from prisons where 1 tested positive for SARS-CoV-2 • 43 outbreaks were from the Other Settings category where 28 tested positive for SARS-
CoV-2
Figure 11: Number of acute respiratory outbreaks by institution, England
Information on acute respiratory infection outbreaks is based on situations being managed by PHE Health Protection Teams. These include suspected as well as confirmed outbreaks.

9
Year: 2020 Week: 26 Community surveillance
NHS 111 The NHS 111 service monitors daily trends in phone calls made to the service in England, to capture trends in infectious diseases such as influenza and norovirus. Up to 21 June 2020, the daily percentage of NHS 111 ‘potential COVID-19-like’ calls (as a per-centage of total NHS 111 calls) remained stable (Figure 12). The daily number of NHS 111 ‘potential COVID-19’ completed online assessments decreased (Figure 13). Please note that NHS 111 callers (from 11 May) and NHS 111 online users (from 11 June 2020), who are assessed as having probable COVID-19 symptoms are now triaged using symptom spe-cific pathways e.g. cold/flu, which are included in routine syndromic indicators. Further information about these caveats is available from the PHE Remote Health Advice Syn-dromic Surveillance bulletin.
Figure 12 (a-b): NHS 111 telephony indicators (and 7-day moving average), England
(a) Daily potential COVID-19 calls as a percent-
age of total calls, all ages
(b) Daily cold/flu calls as a percentage of total
calls, all ages
(a) Daily ‘potential COVID-19’ online assessments
as the number of completed online assessments,
all ages
Figure 13 (a-b): NHS 111 completed online assessments (and 7-day moving average),
England
(b) Daily cold/flu online assessments as the num-
ber of completed online assessments, all ages

10
Year: 2020 Week: 26 Community surveillance
Internet based surveillance
This is a web-based syndromic surveillance system which uses daily search query frequency statistics obtained from the Google Health Trends API [1]. This model focuses on search queries about COVID-19 symptoms as well as generic queries about “coronavirus” (e.g. “covid-19”). The search query frequency time series has been weighted based on symptom frequency as report-ed in other data sources. Frequency of searches for symptoms is compared with a baseline cal-culated from historical daily data.
The overall and media-debiasing weighted scores remained stable throughout week 25 with small increases noted towards the end of the week (Figure 14).
[1] For more information about this model, please see https://arxiv.org/abs/2003.08086
Google search queries
Figure 14: Normalised Google search score for COVID-19 symptoms, with weighted
score for media-debiasing and historical trend, England
PHE’s internet based surveillance systems aim to monitor the volume of people searching for typical symptoms of COVID-19 on the internet as well as tracking self-reported respiratory symp-toms and health seeking behaviour patterns related to COVID-19.

11
Year: 2020 Week: 26 Community surveillance
Internet based surveillance
An internet based surveillance system has been developed based on FluSurvey. FluSurvey is a web tool survey designed to monitor trends of influenza like illness (ILI) in the community using self-reported respiratory symptoms from registered participants. The platform has been adapted to capture respiratory symptoms, exposure risk and healthcare seeking behaviours among reg-istered participants to contribute to national surveillance of COVID-19 activity. A total of 3,530 participants completed the weekly COVID-19 surveillance survey in week 25, of which 102 (2.9%) reported fever or cough, a slight decrease to 3.5% reported in week 24. There had been an increase in the number of participants visiting their GP/GP nurse since week 21 however this decreased in the week, with the most commonly reported method of access to healthcare services remaining through telephone services (Figure 15).
Figure 15: Rate of contact with different healthcare services among FluSurvey partici-
pants reporting fever or cough symptoms, week 09 to 25, England
FluSurvey

12
Year: 2020 Week: 26 Primary care surveillance
Figure 16 (a-b): GPIH clinical indicators, England
GP In Hours (GPIH) and GP Out of Hours (GPOOH), Syndromic surveillance
The GP In Hours (GPIH) syndromic surveillance system monitors the number of GP visits dur-ing regular hours of known clinical indicators. The GP Out of Hours (GPOOH) syndromic sur-veillance system monitors the numbers of daily unscheduled visits and calls to GPs during eve-nings, overnight, on weekends and on public holidays. Both systems cover around 55% of Eng-land’s population.
Up to 21 June 2020, GPIH consultations for potential COVID-19-like and ILI consultations re-mained stable (Figure 16). Through GPOOH consultations (up to 21 June 2020), the daily per-centage (as a percentage of total contacts with a Read code) for ILI decreased and the spike in difficulty breathing/wheeze/asthma contacts is likely linked with recent thunderstorm activity. (Figure 17). Please note GP data should be interpreted with caution due to changes in advice regarding ac-cessing GP surgeries due to COVID-19. Influenza-like-illness (ILI) rates are now approaching baseline levels after a recent change in the use of a new COVID-19 Care Pathway template which had affected recording of influenza-like illness from mid-April (Figure 12(a)). Further infor-mation about these caveats is available from the PHE GP In Hours Syndromic Surveillance bul-letin.
Figure 17 (a-b) : GPOOH contacts indicators, England
(a) potential COVID-19 GP consultations, daily
incidence rates per 100,000 population, all ages
(b) Influenza-like illness consultations, daily inci-
dence rates per 100,000 population, all ages
(a) Difficulty breathing/wheeze/asthma, daily con-
tacts (%), all ages
(b) Influenza-like illness, daily contacts (%), all
ages
13
Year: 2020 Week: 26 Primary care surveillance
RCGP Swabbing Scheme
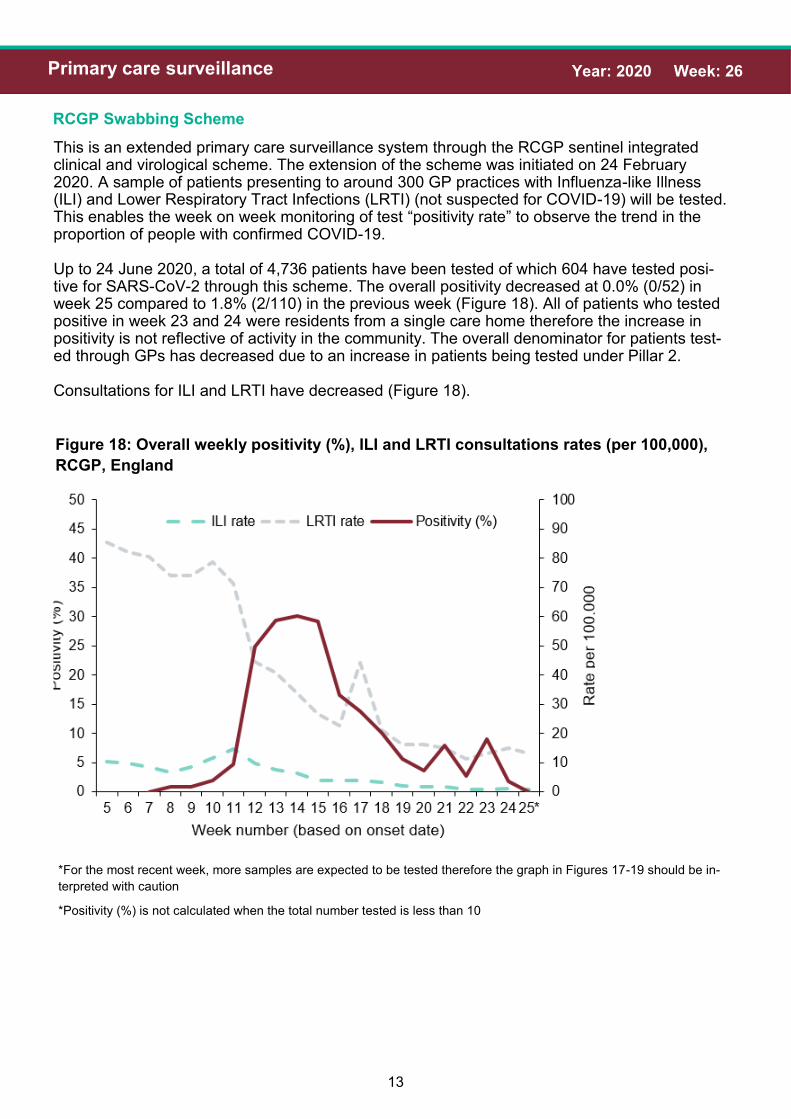
This is an extended primary care surveillance system through the RCGP sentinel integrated clinical and virological scheme. The extension of the scheme was initiated on 24 February 2020. A sample of patients presenting to around 300 GP practices with Influenza-like Illness (ILI) and Lower Respiratory Tract Infections (LRTI) (not suspected for COVID-19) will be tested. This enables the week on week monitoring of test “positivity rate” to observe the trend in the proportion of people with confirmed COVID-19. Up to 24 June 2020, a total of 4,736 patients have been tested of which 604 have tested posi-tive for SARS-CoV-2 through this scheme. The overall positivity decreased at 0.0% (0/52) in week 25 compared to 1.8% (2/110) in the previous week (Figure 18). All of patients who tested positive in week 23 and 24 were residents from a single care home therefore the increase in positivity is not reflective of activity in the community. The overall denominator for patients test-ed through GPs has decreased due to an increase in patients being tested under Pillar 2. Consultations for ILI and LRTI have decreased (Figure 18).
Figure 18: Overall weekly positivity (%), ILI and LRTI consultations rates (per 100,000),
RCGP, England
*For the most recent week, more samples are expected to be tested therefore the graph in Figures 17-19 should be in-
terpreted with caution
*Positivity (%) is not calculated when the total number tested is less than 10

14
Year: 2020 Week: 26 Primary care surveillance
RCGP Swabbing Scheme
Figure 20: Positivity (%) (weekly) by (a) age group and (b) gender, England (RCGP)
(a)
(b)
Figure 19: Overall positivity (%) (weekly) by PHE Region, England (RCGP)
*For the most recent week, more samples are expected to be tested therefore the graph in Figures 17-19 should be in-
terpreted with caution
*Positivity (%) is not calculated when the total number tested is less than 10
15
Year: 2020 Week: 26 Secondary care surveillance
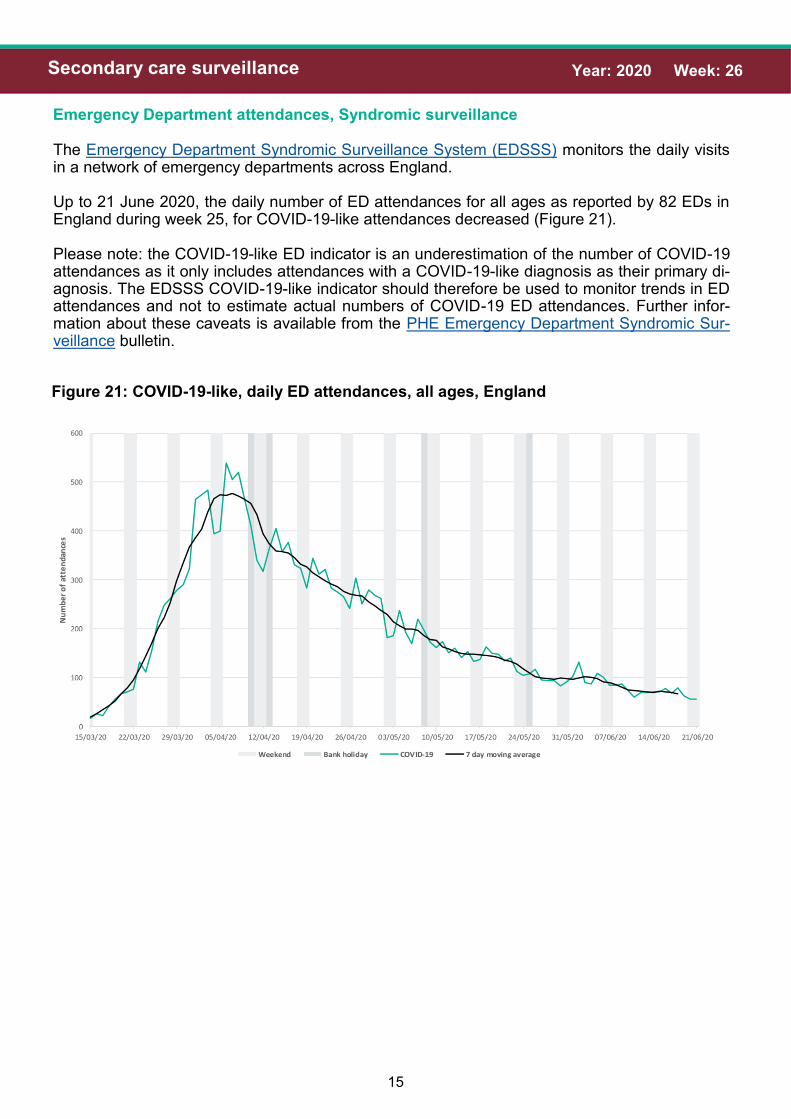
Figure 21: COVID-19-like, daily ED attendances, all ages, England
Emergency Department attendances, Syndromic surveillance
The Emergency Department Syndromic Surveillance System (EDSSS) monitors the daily visits in a network of emergency departments across England. Up to 21 June 2020, the daily number of ED attendances for all ages as reported by 82 EDs in England during week 25, for COVID-19-like attendances decreased (Figure 21). Please note: the COVID-19-like ED indicator is an underestimation of the number of COVID-19 attendances as it only includes attendances with a COVID-19-like diagnosis as their primary di-agnosis. The EDSSS COVID-19-like indicator should therefore be used to monitor trends in ED attendances and not to estimate actual numbers of COVID-19 ED attendances. Further infor-mation about these caveats is available from the PHE Emergency Department Syndromic Sur-veillance bulletin.

16
Year: 2020 Week: 26 Secondary care surveillance
COVID-19 Hospitalisation in England Surveillance System (CHESS)
The CHESS surveillance system monitors daily new acute respiratory infections (ARI) and new laboratory confirmed COVID-19 admissions to hospital including critical care (ICU/HDU). Trends in hospital and critical care admission rates need to be interpreted in the context of test-ing recommendations. A total of 134 NHS Trusts are now participating, although the number of Trusts reporting varies by day. The weekly rate of new admissions of COVID-19 cases is based on the trust catchment population of those NHS Trusts who made a new return. This may differ from other published figures such as the total number of people currently in hospital with COVID-19. In week 25, the weekly admission rates for both hospitalisations and ICU/HDU COVID-19 ad-missions decreased. The hospitalisation rate was at 2.55 per 100,000 in week 25 compared to 3.09 per 100,000 in the previous week. The ICU/HDU rate was at 0.22 per 100,000 in week 25 compared to 0.24 per 100,000 in the previous week (Figure 22). By NHS regions, the highest hospitalisation rate continues to be observed in the North West and the highest ICU/HDU rate was observed in the North East (Figure 23). By age group, the highest hospitalisation rate was seen in the 85+ year olds and the highest ICU/HDU rate was observed in the 65-74 year olds (Figure 24).
Figure 22: Weekly overall hospital and ICU/HDU admission rates per 100,000 of new
COVID-19 positive cases reported through CHESS, England

17
Year: 2020 Week: 26 Secondary care surveillance
COVID-19 Hospitalisation in England Surveillance System (CHESS)
(a) (b)
Figure 23: Weekly admission rate for (a) hospital admissions and (b) ICU/HDU admis-
sions by NHS regions of new COVID-19 positive cases reported through CHESS
(a) (b)
Figure 24: Weekly admission rate for (a) hospital admissions and (b) ICU/HDU admis-
sions by NHS regions of new COVID-19 positive cases reported through CHESS

18
Year: 2020 Week: 26 Secondary care surveillance
COVID-19 Hospitalisation in England Surveillance System (CHESS)
Figure 25: Age/sex pyramid of new (a) hospital (lower level of care) (n=9,314) and (b) ICU/
HDU (n=4,364) COVID-19 cases reported through CHESS, England
(a)
(b)
Figure 25 and 26 are based on individual patient level data which are provided to CHESS from a subset of NHS Acute Trusts, therefore the data should be interpreted with caution as the distribution of age, sex and ethnic group may not be representative of all hospitalised patients.

19
Year: 2020 Week: 26 Secondary care surveillance
COVID-19 Hospitalisation in England Surveillance System (CHESS)
Figure 26: Ethnic group of new hospitalisations (lower level of care) (n=8,476) and ICU/
HDU (n=3,676) COVID-19 cases reported through CHESS, England
UK Severe Respiratory Failure (SRF) centres admissions
Between 03 March and 22 June 2020, a total of 216 laboratory confirmed COVID-19 admissions
have been reported from the 5 SRFs in England. There was one laboratory confirmed COVID-19
admission reported in week 25 compared to 4 admissions in week 24 (Figure 27).
Figure 27: Laboratory confirmed ECMO admissions (COVID-19 and non-COVID-19 con-
firmed) to SRFs, England

20
Year: 2020 Week: 26 Mortality surveillance
Cumulative deaths
As of 5pm on 23 June 2020, a total of 38,568 cases under Pillar 1 and 2 with confirmed COVID-19 have died in England.
Figure 28: Cumulative number of deaths by week of death and age group, England
(n=38,568)
* For the most recent week, more deaths will be reported therefore the decrease seen in this graph should be in-
terpreted with caution
Table 3: Cumulative number of deaths (Pillar 1 and 2) by PHE Centres (n=38,228)

21
Year: 2020 Week: 26 Mortality surveillance
Cumulative deaths
Figure 29: Age/sex pyramid of laboratory confirmed COVID-19 (Pillar 1 and 2) deaths
(n=38,568)
Figure 30: Ethnic group of confirmed COVID-19 (Pillar 1 and 2) deaths, England
(n= 38,150)
22
Year: 2020 Week: 26 Mortality surveillance
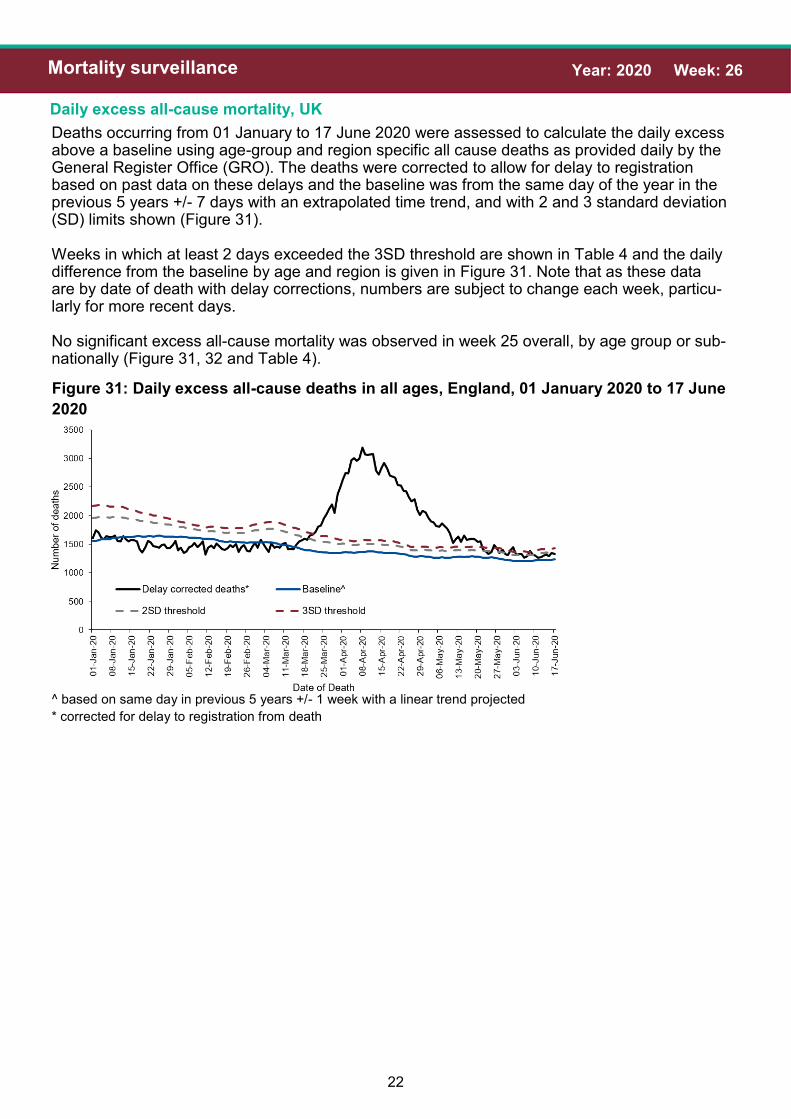
Figure 31: Daily excess all-cause deaths in all ages, England, 01 January 2020 to 17 June
2020
Daily excess all-cause mortality, UK
Deaths occurring from 01 January to 17 June 2020 were assessed to calculate the daily excess above a baseline using age-group and region specific all cause deaths as provided daily by the General Register Office (GRO). The deaths were corrected to allow for delay to registration based on past data on these delays and the baseline was from the same day of the year in the previous 5 years +/- 7 days with an extrapolated time trend, and with 2 and 3 standard deviation (SD) limits shown (Figure 31). Weeks in which at least 2 days exceeded the 3SD threshold are shown in Table 4 and the daily difference from the baseline by age and region is given in Figure 31. Note that as these data are by date of death with delay corrections, numbers are subject to change each week, particu-larly for more recent days. No significant excess all-cause mortality was observed in week 25 overall, by age group or sub-nationally (Figure 31, 32 and Table 4).
^ based on same day in previous 5 years +/- 1 week with a linear trend projected
* corrected for delay to registration from death

23
Year: 2020 Week: 26 Mortality surveillance
Daily excess all-cause mortality, UK
Table 4: Excess all-cause deaths by (a) age group and (b) PHE centres , England
(a)
(b)

24
Year: 2020 Week: 26 Mortality surveillance
Daily excess all-cause mortality, UK
Figure 32: Daily excess all-cause deaths by (a) age group and (b) PHE centres , Eng-
land, 01 March 2020 to 17 June 2020
(a)
(b)

25
Year: 2020 Week: 26 Sero-prevalence surveillance
Sero-prevalence epidemiology, England
Sero-epidemiological surveillance/studies enable the identification of the true number of infections within the general population and provides the ability to detect asymptomatic and mild infections. More infor-mation on this is available here. In this week’s report updated results from the testing of samples provided by healthy blood donors aged 17-69 years, supplied by the NHS Blood and Transplant (NHS BT collection) are summarised. Donor sam-ples from different geographic regions (approximately 1000 samples per region) in England are tested each week. The results presented here are based on testing using the Euroimmun assay for samples col-lected between weeks 13-24. Figure 33 shows the overall prevalence in each region over time which has been adjusted for the accuracy of the Euroimmun assay (sensitivity and specificity). It is important to note that the sensitivity and specificity of assays are subject to change as further data becomes available.
Additional data from the fourth sampling in the Midlands and the third set of sampling from the North East regions are included in this week’s report (collected in week 24).
Adjusted prevalence estimates vary across the country and over time. In London where prevalence esti-mates are highest, overall adjusted prevalence increased from 1.5% (week 13) to 10.5% (weeks 15-16) to 14.5% (week 18) to 15.4% (week 21) and remains stable at 14.9% in the most recent data (week 24). Giv-en that antibody response takes at least two weeks to become detectable, those displaying a positive re-sult in week 18 are likely to have become infected before mid-April. The plateauing observed between weeks 18-21 demonstrates the impact of lock down measures on new infections.
The lower prevalence in samples from other regions including the South East, South West and North East regions is consistent with data from other surveillance systems. In the most recent data from week 24, ad-justed prevalence amongst donors in the Midlands has plateaued at 6.9% in week 24 and 5.8% in week 20. A similar trend has been observed in the North East of England with adjusted prevalence at 6.3% in week 24 compared with 7.0% in week 20.
In some regions prevalence estimates are slightly lower in recent weeks. For example, the adjusted preva-lence in the North West of England is slightly lower at 8.8% in week 23 compared with 10.6% in week 19. A more pronounced change was noted in the East of England with a lower adjusted prevalence of 4.2% (week 22) compared with 8.1% (week 19). This is likely driven by some changes in the precise locations of sampling over time with the most recent set of samples from both regions containing significantly fewer samples from higher prevalence areas e.g. in the most recent set from East of England, there were signifi-cantly less samples from areas of higher prevalence with a trend of increased prevalence with proximity to London observed.
Age specific prevalence estimates have changed over time with prevalence notably higher in young adults when the increases were first observed in areas experiencing the outbreak earlier (Figure 34). Over time, however there has been a relatively greater increase in prevalence amongst older adults, suggesting these age groups being affected later. These patterns may reflect differences in behaviour and mixing pat-terns in the different age groups.

26
Year: 2020 Week: 26 Sero-prevalence surveillance
Sero-prevalence epidemiology, England
Figure 33: Overall SARS-CoV-2 antibody seroprevalence (%) in blood donors by PHE
centres, using Euroimmun test adjusted for sensitivity (82.5%) and specificity (99.1%) and
95% confidence intervals (dashed lines)
Figure 34: SARS-CoV-2 antibody seroprevalence in blood donors by age group, using
Euroimmun test adjusted for sensitivity (82.5%) and specificity (99.1%); error bars show
95% confidence intervals

27
Year: 2020 Week: 26 International situation
Global situation
Globally, up to 24 June 2020, a total of 9,190,746 cases of COVID-19 infection have been re-ported worldwide, including 476,425 COVID-19 related deaths.
Figure 35: Global map of cumulative COVID-19 cases

28
Year: 2020 Week: 26 International situation
Global situation
Figure 36: Global map of weekly COVID-19 case incidence rate per 100,000, week 25 2020
PHE has delegated authority, on behalf of the Secretary of State, to process Patient Confidential Data under Regulation 3 The Health Service (Control of Patient Information) Regulations 2002
http://www.legislation.gov.uk/uksi/2002/1438/regulation/3/made. Regulation 3 makes provision for the processing of patient information for the recognition, control and prevention of communicable disease and other risks to public health.