weekly highlights -...
TRANSCRIPT

Weekly Market Review
Talking Points
Weekly Highlights
• Stock prices plunged this week, caused by a double‐whammy of poor results of retailers and tumbling commodity prices. Retail stock prices were hit hard as several major department stores released poor results. Commodity prices, from energy to precious metals to grains, continued to fall with many breaking or approaching multi‐year lows.
• U.S. Treasury yields were only slightly lower, despite weak economic data and plunging commodity prices. Hawkish comments by Fed officials reaffirmed market view that a rate hike will happen in December.
• Commodity indices reached multi-year lows, as all major commodities continued to tumble. Weak global economic data and the high likelihood of a Fed rate hike in December drove investors away from commodities.
Chart of the Week
November 18, 2015
• Among equities, small caps underperformed large caps, value stocks essentially matched the returns of growth stocks, and domestic stocks underperformed international equities. Developed markets outperformed emerging markets.
• Treasury prices were slightly higher this week. The yield on the 10‐year T‐note fell on weak retail sales data.
• Commodity indices continued to slide, reaching multi‐year lows.
• The dollar index was essentially flat after surging the previous week.
• Among economic data released this week, retail sales continued to disappoint, echoing recent poor results and downbeat guidance of major retailers. While jobless claims numbers were in line with expectation, producer prices unexpectedly fell for a second consecutive month.
0.0
50.0
100.0
150.0
200.0
250.0
300.0
350.0
400.0
450.0
Nov‐14 Jan‐15 Mar‐15 May‐15 Jul‐15 Sep‐15
%
Non‐Farm Payrolls ‐ Trailing 12 Months
Source: Bloomberg
Weekly Market ReviewNovember 13, 2015
1

LCP Weekly Market Review
2
November 13, 2015
MARKET DASHBOARD
L
S
Source: B loomberg
‐3.48% ‐3.56% ‐3.63%
‐3.56% ‐3.80% ‐4.03%
‐1.70%‐4.83%‐7.99%
One Week
Value Growth
‐4.32% ‐4.43% ‐4.55%
YTD
Value Growth
‐6.18% ‐0.89% 4.46%
‐6.61% ‐4.34% ‐2.20%
% Wgt in
S&P 500
Week %
Chg. YTD % Chg.
Consumer Discretionary 13.0 ‐4.59% 7.6%
Consumer Staples 9.6 ‐2.75% ‐1.8%
Energy 7.0 ‐5.97% ‐17.6%
Financials 16.5 ‐3.37% ‐3.6%
Health Care 14.6 ‐3.15% 1.4%
Industrials 10.3 ‐2.30% ‐4.3%
Information Technology 20.8 ‐4.61% 3.1%
Materials 3.0 ‐2.16% ‐8.8%
Telecom Services 2.3 ‐2.89% ‐6.5%
Utilities 2.9 0.33% ‐10.5%
Source: Bloomberg
Sector Performance:
S&P/Global Industry Classification Sectors (GICS)
Last Price Change % Chg. YTD % Last Price Change % Chg. YTD %
S&P 500 2,023.04 ‐76.16 ‐3.63% ‐1.7% Russell Global EM 2,693.73 ‐58.37 ‐2.17% ‐11.6%
Dow Industrials 17,245.24 ‐665.09 ‐3.71% ‐3.2% 10-Year US Treas. 2.28 ‐5 bps NM NM
Nasdaq 4,927.88 ‐219.24 ‐4.26% 4.1% DJ UBS Comm. Idx. 82.43 ‐2.80 ‐3.29% ‐21.0%
Russell 2000 1,146.55 ‐53.20 ‐4.43% ‐4.8% Gold $1,083.55 ‐$6.54 ‐0.60% ‐8.5%
Euro Stoxx Index 369.53 ‐10.42 ‐2.74% 7.9% Crude Oil $40.80 ‐$3.50 ‐7.90% ‐31.4%
Shanghai Composite 3,580.84 ‐9.19 ‐0.26% 10.7% Dollar Index 98.93 ‐0.23 ‐0.24% 9.6%
Russell Global 1,672.01 ‐34.41 ‐2.02% ‐3.2% VIX Index 20.08 5.75 40.13% 4.6%Source: B loomberg; Index % change is based on price.

LCP Weekly Market Review
3
November 13, 2015
ECONOMIC DATA

LCP Weekly Market Review November 13, 2015
EUROZONE
4
Last Change % Chg. YTD % Last Change % Chg. YTD %
Germany 10-Yr. Govt. 0.56 13 bps NM NM France 10-Yr. Govt. 0.87 14 bps NM NM
Greece 10-Yr. Govt. 7.08 30 bps NM NM Ireland 10-Yr. Govt. 1.09 18 bps NM NM
Italy 10-Yr. Govt. 1.56 21 bps NM NM Portugal 10-Yr. Govt. 2.75 -7 bps NM NM
Spain 10-Yr. Govt. 1.79 12 bps NM NM Netherlands 10-Yr. Govt. 0.72 12 bps NM NM
Belgium 10-Yr. Govt. 0.84 12 bps NM NM U.K. 10-Yr. Govt. 1.98 5 bps NM NM
SELECTED EUROPEAN SOVEREIGN YIELD PERFORMANCE
Source: Bloomberg
Basis points (bps)

LCP Weekly Market Review November 13, 2015
EQUITIES
5
Last Change % Chg. YTD % Last Change % Chg. YTD %
S&P 500 2,023.04 -76.16 -3.63% -1.74% Swiss Market Index 8,749.84 -220.43 -2.46% -2.60%
Dow Industrials 17,245.24 -665.09 -3.71% -3.24% CAC 40 Index (France) 4,807.95 -176.20 -3.54% 12.53%
Nasdaq Composite 4,927.88 -219.24 -4.26% 4.05% DAX Index (Germany) 10,708.40 -279.63 -2.54% 9.21%
Russell Global 1,672.01 -34.41 -2.02% -3.2% Irish Overall Index 6,475.76 -124.53 -1.89% 23.95%
Russell Global EM 2,693.73 -58.37 -2.17% -11.6% Nikkei 225 19,596.91 331.31 1.72% 12.30%
S&P/TSX (Canada) 13,075.40 -477.90 -3.53% -10.64% Hang Seng Index 22,396.14 -471.19 -2.06% -5.12%
Mexico IPC 43,617.73 -1626.12 -3.59% 1.09% Shanghai Composite 3,580.84 -9.19 -0.26% 10.70%
Brazil Bovespa 46,517.04 -401.48 -0.86% -6.98% Kospi Index (S. Korea) 1,973.29 -67.78 -3.32% 3.01%
Euro Stoxx 600 369.53 -10.42 -2.74% 7.88% Taiwan Taiex Index 8,329.50 -364.07 -4.19% -10.51%
FTSE 100 6,118.28 -235.55 -3.71% -6.82% Tel Aviv 25 Index 1,557.49 -24.30 -1.54% 6.31%
IBEX 35 (Spain) 10,111.40 -341.80 -3.27% -1.64% MICEX Index (Russia) 1,728.17 -26.19 -1.49% 23.74%
WORLD MARKET PERFORMANCE
Source: B loomberg; Index % change is based on price.
LCP Weekly Market Review November 13, 2015
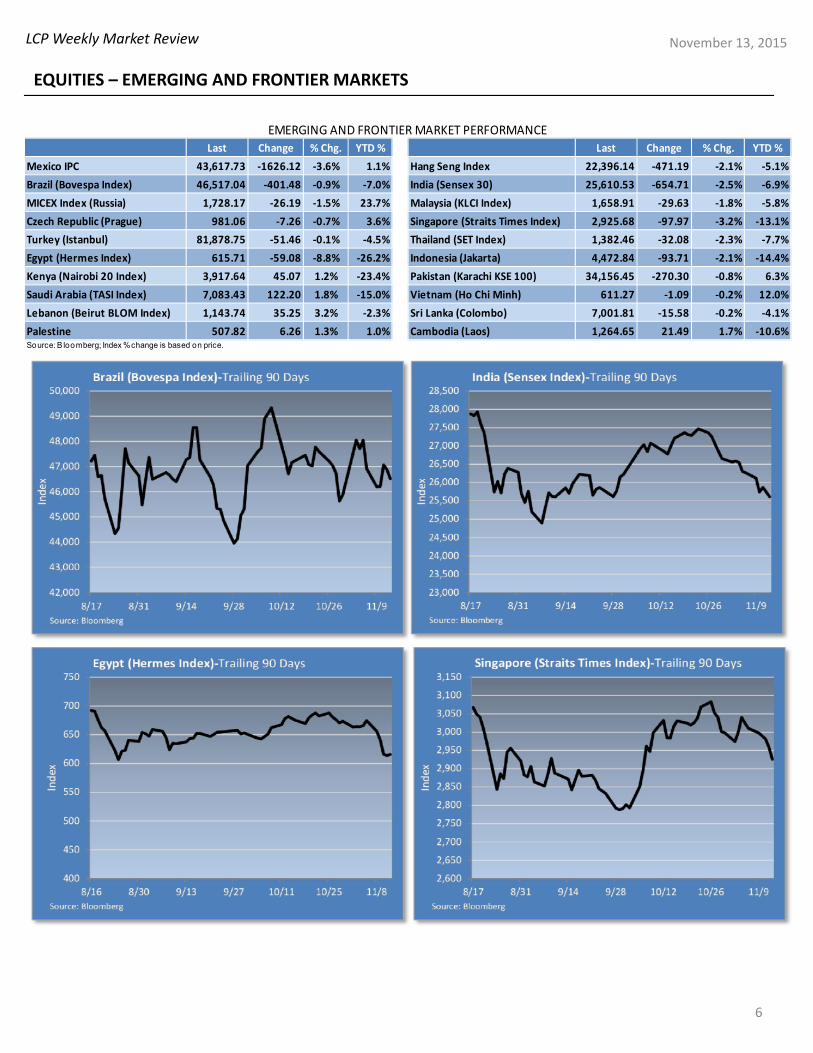
EQUITIES – EMERGING AND FRONTIER MARKETS
6
Last Change % Chg. YTD % Last Change % Chg. YTD %
Mexico IPC 43,617.73 -1626.12 -3.6% 1.1% Hang Seng Index 22,396.14 -471.19 -2.1% -5.1%
Brazil (Bovespa Index) 46,517.04 -401.48 -0.9% -7.0% India (Sensex 30) 25,610.53 -654.71 -2.5% -6.9%
MICEX Index (Russia) 1,728.17 -26.19 -1.5% 23.7% Malaysia (KLCI Index) 1,658.91 -29.63 -1.8% -5.8%
Czech Republic (Prague) 981.06 -7.26 -0.7% 3.6% Singapore (Straits Times Index) 2,925.68 -97.97 -3.2% -13.1%
Turkey (Istanbul) 81,878.75 -51.46 -0.1% -4.5% Thailand (SET Index) 1,382.46 -32.08 -2.3% -7.7%
Egypt (Hermes Index) 615.71 -59.08 -8.8% -26.2% Indonesia (Jakarta) 4,472.84 -93.71 -2.1% -14.4%
Kenya (Nairobi 20 Index) 3,917.64 45.07 1.2% -23.4% Pakistan (Karachi KSE 100) 34,156.45 -270.30 -0.8% 6.3%
Saudi Arabia (TASI Index) 7,083.43 122.20 1.8% -15.0% Vietnam (Ho Chi Minh) 611.27 -1.09 -0.2% 12.0%
Lebanon (Beirut BLOM Index) 1,143.74 35.25 3.2% -2.3% Sri Lanka (Colombo) 7,001.81 -15.58 -0.2% -4.1%
Palestine 507.82 6.26 1.3% 1.0% Cambodia (Laos) 1,264.65 21.49 1.7% -10.6%
EMERGING AND FRONTIER MARKET PERFORMANCE
Source: B loomberg; Index % change is based on price.
LCP Weekly Market Review November 13, 2015
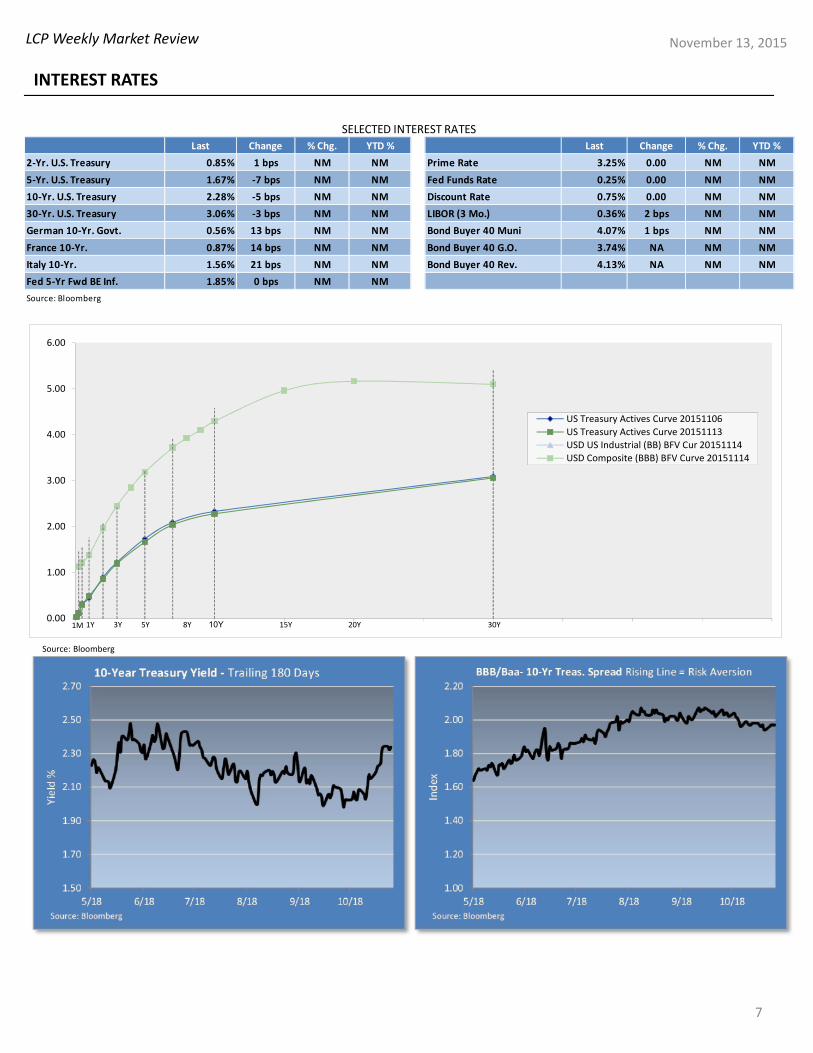
INTEREST RATES
YIELD CURVES
7
Last Change % Chg. YTD % Last Change % Chg. YTD %
2-Yr. U.S. Treasury 0.85% 1 bps NM NM Prime Rate 3.25% 0.00 NM NM
5-Yr. U.S. Treasury 1.67% -7 bps NM NM Fed Funds Rate 0.25% 0.00 NM NM
10-Yr. U.S. Treasury 2.28% -5 bps NM NM Discount Rate 0.75% 0.00 NM NM
30-Yr. U.S. Treasury 3.06% -3 bps NM NM LIBOR (3 Mo.) 0.36% 2 bps NM NM
German 10-Yr. Govt. 0.56% 13 bps NM NM Bond Buyer 40 Muni 4.07% 1 bps NM NM
France 10-Yr. 0.87% 14 bps NM NM Bond Buyer 40 G.O. 3.74% NA NM NM
Italy 10-Yr. 1.56% 21 bps NM NM Bond Buyer 40 Rev. 4.13% NA NM NM
Fed 5-Yr Fwd BE Inf. 1.85% 0 bps NM NM
SELECTED INTEREST RATES
Source: Bloomberg
1M 1Y 3Y 5Y 8Y 10Y 15Y 20Y 30Y0.00
1.00
2.00
3.00
4.00
5.00
6.00
US Treasury Actives Curve 20151106
US Treasury Actives Curve 20151113
USD US Industrial (BB) BFV Cur 20151114
USD Composite (BBB) BFV Curve 20151114
Source: Bloomberg
LCP Weekly Market Review November 13, 2015
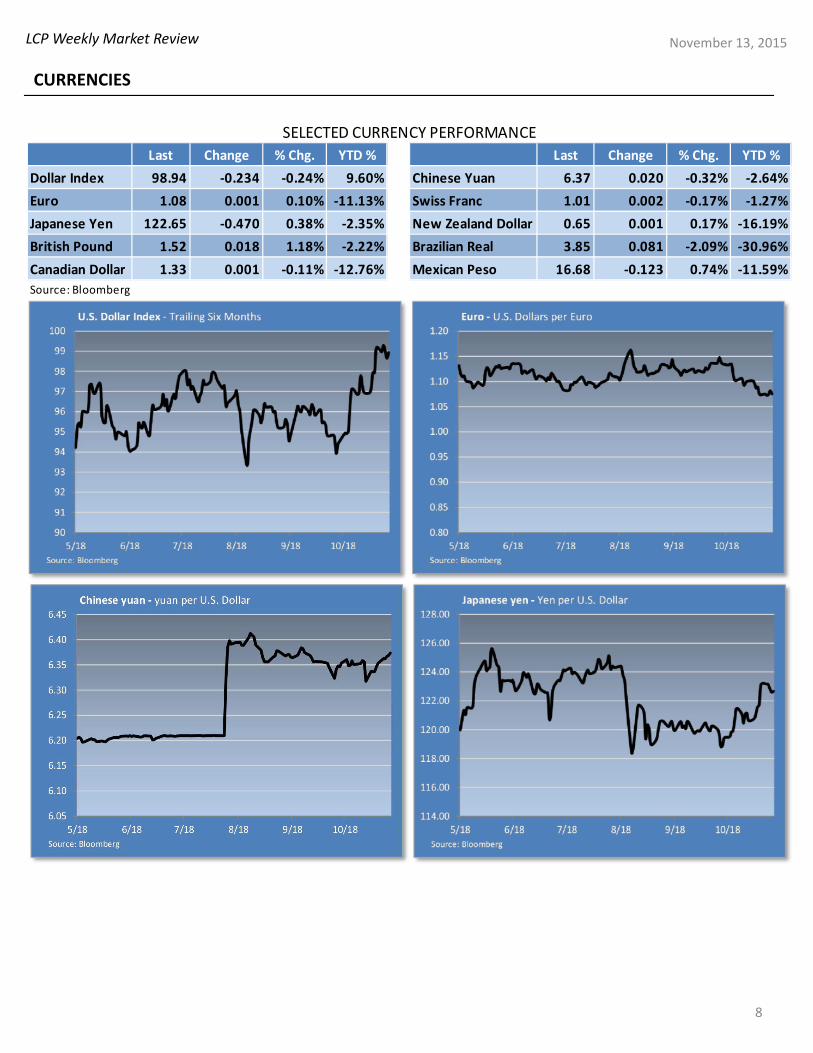
CURRENCIES
8
Last Change % Chg. YTD % Last Change % Chg. YTD %
Dollar Index 98.94 -0.234 -0.24% 9.60% Chinese Yuan 6.37 0.020 -0.32% -2.64%
Euro 1.08 0.001 0.10% -11.13% Swiss Franc 1.01 0.002 -0.17% -1.27%
Japanese Yen 122.65 -0.470 0.38% -2.35% New Zealand Dollar 0.65 0.001 0.17% -16.19%
British Pound 1.52 0.018 1.18% -2.22% Brazilian Real 3.85 0.081 -2.09% -30.96%
Canadian Dollar 1.33 0.001 -0.11% -12.76% Mexican Peso 16.68 -0.123 0.74% -11.59%
SELECTED CURRENCY PERFORMANCE
Source: Bloomberg
LCP Weekly Market Review November 13, 2015
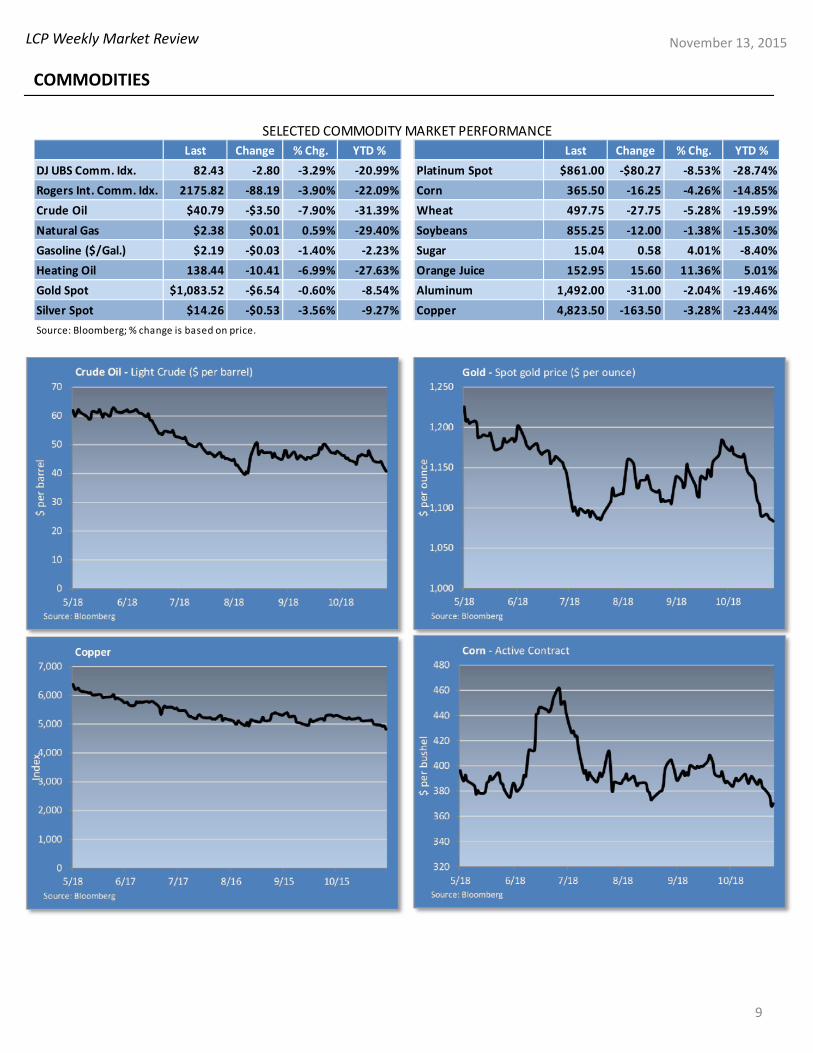
COMMODITIES
9
Last Change % Chg. YTD % Last Change % Chg. YTD %
DJ UBS Comm. Idx. 82.43 -2.80 -3.29% -20.99% Platinum Spot $861.00 -$80.27 -8.53% -28.74%
Rogers Int. Comm. Idx. 2175.82 -88.19 -3.90% -22.09% Corn 365.50 -16.25 -4.26% -14.85%
Crude Oil $40.79 -$3.50 -7.90% -31.39% Wheat 497.75 -27.75 -5.28% -19.59%
Natural Gas $2.38 $0.01 0.59% -29.40% Soybeans 855.25 -12.00 -1.38% -15.30%
Gasoline ($/Gal.) $2.19 -$0.03 -1.40% -2.23% Sugar 15.04 0.58 4.01% -8.40%
Heating Oil 138.44 -10.41 -6.99% -27.63% Orange Juice 152.95 15.60 11.36% 5.01%
Gold Spot $1,083.52 -$6.54 -0.60% -8.54% Aluminum 1,492.00 -31.00 -2.04% -19.46%
Silver Spot $14.26 -$0.53 -3.56% -9.27% Copper 4,823.50 -163.50 -3.28% -23.44%
Source: Bloomberg; % change is based on price.
SELECTED COMMODITY MARKET PERFORMANCE

LCP Weekly Market Review November 13, 2015
ALTERNATIVE INVESTMENTS
10
Last Change % Chg. YTD % Last Change % Chg. YTD %
HFRX Global Hedge Fund Index 1198.79 -9.87 -0.82% -2.42% HFRX Distressed Index 962.54 -6.08 -0.63% -5.42%
HFRX Equity Market Neutral 1037.82 0.86 0.08% 5.35% HFRX Merger Arbitrage Index 1717.05 1.36 0.08% 6.96%
HFRX Equity Hedge Index 1167.10 -10.92 -0.93% -1.96% HFRX Convertible Arbitrage Index 718.60 1.92 0.27% 2.12%
HFRX Event-Driven Index 1447.10 -18.72 -1.29% -5.70% HFRX Macro CTA Index 1168.58 5.96 0.51% -1.28%
HFRX Absolute Return Index 1034.93 -1.63 -0.16% 3.68% IQ Fixed Income Beta Arb Index 1378.84 -0.35 -0.03% -0.63%
SELECTED ALTERNATIVE INVESTMENT INDEX PERFORMANCE
Source: Bloomberg; Index % change is based on price.

LCP Weekly Market Review November 13, 2015
11
PORTFOLIO CONSTRUCTION

LCP Weekly Market Review November 13, 2015
12
PORTFOLIO CONSTRUCTION (cont’d.)

LCP Weekly Market Review
13
November 13, 2015
The Relative Strength Matrix provides an indication of how the various asset classes have performed relative to one another over the past 30 days. A number greater than 1.0 indicates that the asset class in the far left column has outperformed the corresponding asset class in the top row over the past 30 days. A number below 1.0 means the asset class on the left has underperformed the asset class at the top. The green shading indicates outperformance, and the red shading indicates underperformance.
Source: Bloomberg
Large Cap
Core
Large Cap
Growth
Large Cap
Value
Mid Cap
Core
Mid Cap
Growth
Mid Cap
Value
Small Cap
Core
Small Cap
Growth
Small Cap
Value
Int'l .
Developed
Emerging
Markets REITs Comm. Int. Bond High Yield
Large Cap Core 1.00 0.97 1.03 1.12 1.10 1.13 1.09 1.09 1.09 1.11 1.12 1.06 1.46 1.22 1.54
Large Cap Growth 1.03 1.00 1.06 1.15 1.13 1.16 1.12 1.12 1.12 1.14 1.16 1.09 1.50 1.26 1.58
Large Cap Value 0.97 0.94 1.00 1.08 1.06 1.09 1.06 1.06 1.06 1.07 1.09 1.03 1.42 1.19 1.49
Mid Cap Core 0.90 0.87 0.92 1.00 0.98 1.01 0.98 0.98 0.98 0.99 1.01 0.95 1.31 1.10 1.38
Mid Cap Growth 0.91 0.89 0.94 1.02 1.00 1.03 0.99 0.99 0.99 1.01 1.02 0.96 1.33 1.11 1.40
Mid Cap Value 0.89 0.86 0.91 0.99 0.97 1.00 0.97 0.97 0.97 0.98 1.00 0.94 1.30 1.08 1.37
Small Cap Core 0.92 0.89 0.94 1.02 1.01 1.03 1.00 1.00 1.00 1.01 1.03 0.97 1.34 1.12 1.41
Small Cap Growth 0.92 0.89 0.95 1.02 1.01 1.03 1.00 1.00 1.00 1.01 1.03 0.97 1.34 1.12 1.41
Small Cap Value 0.92 0.89 0.95 1.02 1.01 1.04 1.00 1.00 1.00 1.01 1.03 0.97 1.34 1.12 1.41
Int'l. Developed 0.90 0.88 0.93 1.01 0.99 1.02 0.99 0.99 0.99 1.00 1.02 0.96 1.32 1.11 1.39
Emerging Markets 0.89 0.87 0.92 0.99 0.98 1.00 0.97 0.97 0.97 0.98 1.00 0.94 1.30 1.09 1.37
REITs 0.95 0.92 0.97 1.05 1.04 1.07 1.03 1.03 1.03 1.05 1.06 1.00 1.38 1.16 1.46
Commodities 0.68 0.66 0.70 0.76 0.75 0.77 0.75 0.75 0.74 0.76 0.77 0.72 1.00 0.83 1.05
Int. Bond 0.82 0.80 0.84 0.91 0.90 0.92 0.89 0.89 0.89 0.90 0.92 0.87 1.20 1.00 1.26
High Yield 0.65 0.63 0.67 0.72 0.71 0.73 0.71 0.71 0.71 0.72 0.73 0.69 0.95 0.79 1.00
RELATIVE STRENGTH MATRIX (BASED ON 30‐DAY RSI)
8/27 9/3 9/10 9/17 9/24 10/1 10/8 10/15 10/22 10/29 11/5 11/12
Large Cap
(R200)‐2.30% ‐1.90% 0.10% 1.94% ‐2.79% ‐0.41% 4.51% 0.69% 1.51% 2.16% 0.43% ‐2.44%
Small Cap
(R2000)‐1.61% ‐0.73% 0.69% 2.40% ‐3.66% ‐3.51% 5.99% ‐0.04% ‐0.71% 0.96% 2.15% ‐3.01%
MSCI EAFE ‐3.57% ‐1.56% 0.36% 1.27% ‐5.35% 0.96% 4.75% 1.17% 0.33% ‐0.01% ‐0.06% ‐1.69%
MSCI Em.
Mkts.‐2.07% ‐1.43% 0.33% 2.90% ‐5.05% 1.52% 6.36% 1.93% ‐0.76% ‐1.40% 2.13% ‐3.52%
BarCap Agg.
(AGG)‐0.43% ‐0.05% ‐0.10% 0.24% 0.10% 0.15% ‐0.04% 0.42% 0.05% ‐0.71% ‐0.36% ‐0.40%
High Yield
(JNK)0.38% ‐0.32% 0.62% ‐0.40% ‐1.87% ‐2.40% 2.63% ‐0.22% 0.64% 0.03% ‐0.49% ‐2.15%
DJ UBS Index ‐1.69% 1.94% ‐0.31% ‐0.13% ‐1.30% ‐0.84% 3.69% ‐0.56% ‐1.85% ‐1.48% ‐1.20% ‐3.45%
Hedge Funds
(HFRX Global)‐0.65% ‐0.21% ‐0.10% 0.22% ‐1.14% ‐0.77% 0.89% ‐0.10% ‐0.27% 0.91% ‐0.02% ‐0.82%
60/40* ‐1.62% ‐0.99% 0.16% 1.22% ‐2.32% ‐0.32% 3.10% 0.61% 0.44% 0.43% 0.29% ‐1.71%
48/32/20
(w/Alts.)**‐1.43% ‐0.83% 0.11% 1.02% ‐2.08% ‐0.41% 2.66% 0.47% 0.30% 0.52% 0.23% ‐1.53%
Source: Bloomberg; *60/40 portfolio = 30% Large Cap/10% Small Cap/15% EAFE/5% Emerging Markets/35% BarCap Agg./5% High Yield.
**48/32/20 portfolio = 24% Large Cap/8% Small Cap/12% EAFE/4% Emerging Markets/28% BarCap Agg./4% High Yield/20% HFRX Global Index.
WEEKLY ASSET CLASS PERFORMANCE (Prior 12 weeks ending Thursday)
Alternatives
Asset Allocation
Domestic
Equity
Int'l.
Equity
Fixed Income
Commodities
Equity

LCP Weekly Market Review November 13, 2015
14
INDEX OVERVIEW & KEY DEFINITIONS Fed, The Fed or FED refers to the Federal Reserve System, the central bank of the United States. The Federal Open Market Committee (FOMC) is the monetarypolicymaking body of the Federal Reserve System. Fed Funds Rate, the interest rate at which a depository institution lends funds maintained at the Federal Reserveto another depository institution overnight. The European Central Bank (ECB) is the central bank for Europe's single currency, the euro. The ECB’s main task is tomaintain the euro's purchasing power and thus price stability in the euro area. The euro area comprises the 19 European Union countries that have introduced theeuro since 1999. The Gross Domestic Product (GDP) rate is a measurement of the output of goods and services produced by labor and property located in theUnited States. Basis Point(s) is a unit that is equal to 1/100th of 1%, and is used to denote the change in a financial instrument. The basis point is commonly used forcalculating changes in interest rates, equity indexes and the yield of a fixed‐income security. A separately managed account (SMA) is an individual managedinvestment account offered typically by a brokerage firm through one of their brokers or financial consultants and managed by independent investmentmanagement firms (often called money managers for short) and have varying fee structures. The Consumer Price Index (CPI) measures the change in the cost of afixed basket of products and services. The Producer Price Index (PPI) program measures the average change over time in the selling prices received by domesticproducers for their output. The prices included in the PPI are from the first commercial transaction for many products and some services. Core CPI is an additionalCPI Index, excludes energy and food item price changes, and measures the “core” or “underlying” rate of inflation. The PCE (Personal Consumption Expenditure)Index of Prices is a US‐‐wide indicator of the average increase in prices for all domestic personal consumption. Using a variety of data including U.S. Consumer PriceIndex and Producer Price Index prices, it is derived from personal consumption expenditures; essentially a measure of goods and services targeted towardsindividuals and consumed by individuals.
The Dow Jones Industrial Average (DOW or DJIA) is an unmanaged index of 30 common stocks comprised of 30 actively traded blue chip stocks, primarily industrialsand assumes reinvestment of dividends. The S&P 500 Index is an unmanaged index comprised of 500 widely held securities considered to be representative of thestock market in general. The S&P/Case-Shiller Home Price Indices measure the residential housing market, tracking changes in the value of the residential realestate market in 20 metropolitan regions across the United States. The Nasdaq Composite Index is a stock market index of the common stocks and similar securitieslisted on the NASDAQ stock market. The US Dollar Index is a measure of the value of the United States dollar relative to a basket of foreign currencies. It is aweighted geometric mean of the dollar's value relative to other select currencies (Euro, Japanese yen, Pound sterling, Canadian dollar, Swedish krona (SEK) & Swissfranc). The Nikkei Index (Nikkei 225 or Nikkei) is a stock market index for the Tokyo Stock Exchange calculated daily by the Nihon Keizai Shimbun (Nikkei) newspapersince 1950. It is a price‐weighted index (the unit is yen), and the components are reviewed once a year. The FTSE 100 Index (FTSE 100) is a share index of the 100companies listed on the London Stock Exchange (LSE) with the highest market capitalization. The Bloomberg Commodity Index (formerly the Dow Jones-UBSCommodity Index) tracks prices of futures contracts on physical commodities on the commodity markets and is designed to minimize concentration in any onecommodity or sector (currently 22 commodity futures in seven sectors). The Barclays Capital US Credit Index is an unmanaged index considered representative ofpublicly issued, SEC‐registered US corporate and specified foreign debentures and secured notes. The Barclays Capital US Aggregate Bond Index is a marketcapitalization‐weighted index of investment‐grade, fixed‐rate debt issues, including government, corporate, asset‐backed, and mortgage‐backed securities, withmaturities of at least one year. The Barclays Capital US Corporate High Yield Index covers the USD‐denominated, non‐investment grade, fixed‐rate, taxablecorporate bond market. Securities are classified as high‐yield if the middle rating of Moody’s, Fitch and S&P is Ba1/BB+/BB+ or below. The index may includeemerging market debt. The Barclays Capital Municipal Bond Index is an unmanaged index comprised of investment‐grade, fixed‐rate municipal securitiesrepresentative of the tax‐exempt bond market in general. The Barclays Capital US Treasury Total Return Index is an unmanaged index of public obligations of the USTreasury with a remaining maturity of one year or more. The Barclays Capital Global Aggregate ex-U.S. Index is a market capitalization‐weighted index, meaning thesecurities in the index are weighted according to the market size of each bond type. Most U.S. traded investment grade bonds are represented. Municipal bonds,and Treasury Inflation‐Protected Securities are excluded, due to tax treatment issues. The index includes Treasury securities, Government agency bonds, Mortgage‐backed bonds, Corporate bonds, and a small amount of foreign bonds traded in U.S. The Barclays Capital U.S. 5-10 Year Corporate Bond Index measures theinvestment return of U.S. dollar denominated, investment‐grade, fixed rate, taxable securities issued by industrial, utility, and financial companies with maturitiesbetween 5 and 10 years. Treasury securities, mortgage‐backed securities (MBS) foreign bonds, government agency bonds and corporate bonds are some of thecategories included in the index. The Barclays Capital U.S Corporate High-Yield Index is composed of fixed‐rate, publicly issued, non‐investment grade debt. TheBarclays Capital U.S. Corporate 5-10 Year Index includes U.S. dollar‐denominated, investment‐grade, fixed‐rate, taxable securities issued by industrial, utility, &financial companies, with maturities between 5 & 10 years. The DJ-UBS Commodity Index Total Return SM measures the collateralized returns from a basket of 19commodity futures contracts representing the energy, precious metals, industrial metals, grains, softs and livestock sectors. The Russell 1000 Index is a marketcapitalization‐weighted benchmark index made up of the 1000 largest U.S. companies in the Russell 3000 Index. The Russell 1000 Growth Index is an unmanagedindex considered representative of large‐cap growth stocks. The Russell 1000 Value Index is an unmanaged index considered representative of large‐cap valuestocks. The Russell 2000 Index is an unmanaged index considered representative of small‐cap stocks. The Russell 2000 Growth Index is an unmanaged indexconsidered representative of small‐cap growth stocks. The Russell 2000 Growth Index is an unmanaged index considered representative of small‐cap value stocks.The Russell 3000 Index is an unmanaged index considered representative of the US stock market. The Russell Midcap Index is a subset of the Russell 1000 Index. Itincludes approximately 800 of the smallest securities based on a combination of their market cap and current index membership. The Russell Midcap Growth Indexis an unmanaged index considered representative of mid‐cap growth stocks. The Russell Midcap Value Index is an unmanaged index considered representative ofmid‐cap value stocks. The HFRX Indices are a series of benchmarks of hedge fund industry performance which are engineered to achieve representativeperformance of a larger universe of hedge fund strategies. Hedge Fund Research, Inc. employs the HFRX Methodology (UCITS compliant), a proprietary and highlyquantitative process by which hedge funds are selected as constituents for the HFRX Indices. The University of Michigan Consumer Sentiment Index (MCSI) is asurvey of consumer confidence conducted by the University of Michigan using telephone surveys to gather information on consumer expectations regarding theoverall economy. The CBOE Volatility Index (VIX) is an up‐to‐the‐minute market estimate of expected volatility that is calculated by using real‐time S&P 500 Indexoption bid/ask quotes. The Index uses nearby and second nearby options with at least 8 days left to expiration and then weights them to yield a constant, 30‐daymeasure of the expected volatility of the S&P 500 Index. The MSCI EAFE Index is designed to measure the equity market performance of developed markets outsideof the U.S. & Canada. The MSCI EAFE Growth Index is an unmanaged index considered representative of growth stocks of Europe, Australasia and the Far East. TheMSCI EAFE Value Index is an unmanaged index considered representative of value stocks of Europe, Australasia and the Far East. The MSCI EM (Emerging Markets)Latin America Index is a free float‐adjusted market capitalization weighted index that is designed to measure the equity market performance of emerging markets inLatin America. The MSCI World ex-U.S. Index captures large and mid‐cap representation across 22 of 23 Developed Markets (DM) countries ‐ excluding the US. With1,002 constituents, the index covers approximately 85% of the free float‐adjusted market capitalization in each country. (DM countries include: Australia, Austria,Belgium, Canada, Denmark, Finland, France, Germany, Hong Kong, Ireland, Israel, Italy, Japan, Netherlands, New Zealand, Norway, Portugal, Singapore, Spain,Sweden, Switzerland and the UK.) The MSCI Japan Index is designed to measure the performance of the large and mid‐cap segments of the Japanese market. With320 constituents, the index covers approximately 85% of the free float‐adjusted market capitalization in Japan. The MSCI Emerging Markets Index is a free float‐adjusted market capitalization index that is designed to measure equity market performance in the global emerging markets. The MSCI Europe Index is anunmanaged index considered representative of stocks of developed European countries. The MSCI Pacific Index is a free float‐adjusted market capitalizationweighted index that is designed to measure the equity market performance of the developed markets in the Pacific region. The Barclays Intermediate USGovernment/Credit Bond Index is a market capitalization‐weighted index of investment‐grade, fixed‐rate debt issues, including Treasuries, government‐related andU.S. corporate securities, with maturities of at least one year and less than 10 years.
LCP Weekly Market Review November 13, 2015
15
The information, analysis, and opinions expressed herein are for general and educational purposes only. Nothing contained in thisweekly review is intended to constitute legal, tax, accounting, securities, or investment advice, nor an opinion regarding theappropriateness of any investment, nor a solicitation of any type. All investments carry a certain risk, and there is no assurance thatan investment will provide positive performance over any period of time. An investor may experience loss of principal. Investmentdecisions should always be made based on the investor’s specific financial needs and objectives, goals, time horizon, and risktolerance. The asset classes and/or investment strategies described may not be suitable for all investors and investors shouldconsult with an investment advisor to determine the appropriate investment strategy. Past performance is not indicative of futureresults.
Information obtained from third party sources are believed to be reliable but not guaranteed. LCP™ makes no representationregarding the accuracy or completeness of information provided herein. All opinions and views constitute our judgments as of thedate of writing and are subject to change at any time without notice.
Investments in smaller companies carry greater risk than is customarily associated with larger companies for various reasons suchas volatility of earnings and prospects, higher failure rates, and limited markets, product lines or financial resources. Investingoverseas involves special risks, including the volatility of currency exchange rates and, in some cases, limited geographic focus,political and economic instability, and relatively illiquid markets. Income (bond) securities are subject to interest rate risk, which isthe risk that debt securities in a portfolio will decline in value because of increases in market interest rates.
Exchange Traded Funds (ETFs) are subject to risks similar to those of stocks, such as market risk. Investing in ETFs may bear indirectfees and expenses charged by ETFs in addition to its direct fees and expenses, as well as indirectly bearing the principal risks ofthose ETFs. ETFs may trade at a discount to their net asset value and are subject to the market fluctuations of their underlyinginvestments. Investing in commodities can be volatile and can suffer from periods of prolonged decline in value and may not besuitable for all investors.
Index Performance is presented for illustrative purposes only and does not represent the performance of any specific investmentproduct or portfolio. An investment cannot be made directly into an index.
Alternative Investments may have complex terms and features that are not easily understood and are not suitable for all investors.You should conduct your own due diligence to ensure you understand the features of the product before investing. Alternativeinvestment strategies may employ a variety of hedging techniques and non‐traditional instruments such as inverse and leveragedproducts. Certain hedging techniques include matched combinations that neutralize or offset individual risks such as mergerarbitrage, long/short equity, convertible bond arbitrage and fixed‐income arbitrage. Leveraged products are those that employfinancial derivatives and debt to try to achieve a multiple (for example two or three times) of the return or inverse return of astated index or benchmark over the course of a single day. Inverse products utilize short selling, derivatives trading, and otherleveraged investment techniques, such as futures trading to achieve their objectives, mainly to track the inverse of theirbenchmarks. As with all investments, there is no assurance that any investment strategies will achieve their objectives or protectagainst losses.
Neither Lakeview nor its representatives render tax, accounting or legal advice. Any tax statements contained herein are notintended or written to be used, and cannot be used, for the purpose of avoiding U.S. federal, state, or local tax penalties. Taxpayersshould always seek advice based on their own particular circumstances from an independent tax advisor.
Lakeview Capital Partners, LLC is an independent investment adviser registered with the U.S. Securities and Exchange Commissionunder the Investment Advisers Act of 1940, as amended. More information about Lakeview including its investment strategies, feesand investment personnel can be found in its Form ADV Part 2, which is available upon request by [email protected]. Any tax statements contained herein are not intended or written to be used, and cannot be used,for the purpose of avoiding U.S. federal, state, or local tax penalties. Taxpayers should always seek advice based on their ownparticular circumstances from an independent tax advisor.
All information presented is based on data as of November 13, 2015. LCP reserves the right to modify its current investmentstrategies and techniques based on changing market dynamics or client needs.
© 2015 Lakeview Capital Partners, LLC. All rights reserved. LCP‐15‐171