weekly sport : 10th / 11th january, 2015
DESCRIPTION
Professional football tips and detailed match prediction analysis are published inside of each edition of Weekly Sport betting magazine.TRANSCRIPT

BETTINGTIPS
10th - 11th January 2015

Each English Premier League game hastwo pages including: likely startingline-ups and formation, Betting
Forecast (average odds and true odds for1X2, Double Chance and Draw No Betmarkets) and Goals Analysis. The true oddsallows the bettor to determine if a certainbookmaker is giving value or not and theseodds (or greater) should be taken, withlesser odds being left.
The Goals Analysis gives the expected goalsfor each team and these are used with thePoisson Formula (see Glossary) to give achance for each likely correct score, which inturn creates the Over/Under and BothTeams to Score markets.
Odds are given as decimal odds (EuropeanOdds format). These odds are easier for thebettor to understand than fractional odds(UK Odds format), although there is anOdds Ready Reckoner in the back of thispublication.
A Football Betting Magazinewith a betting analysis of eachEnglish Premier League game.
Contents
Sunderland v Liverpool
Burnley v QPR
Chelsea v Newcastle United
Everton v Manchester City
Leicester City v Aston Villa
Swansea v West Ham United
WBA v Hull City
Crystal Palace v Tottenham Hotspur
Arsenal v Stoke City
Manchester United v Southampton
Odds Ready Reckoner
Glossary
4
6
8
10
12
14
16
18
20
22
24
25
P r e d i c t e d L i n e - u pP r e d i c t e d L i n e - u p
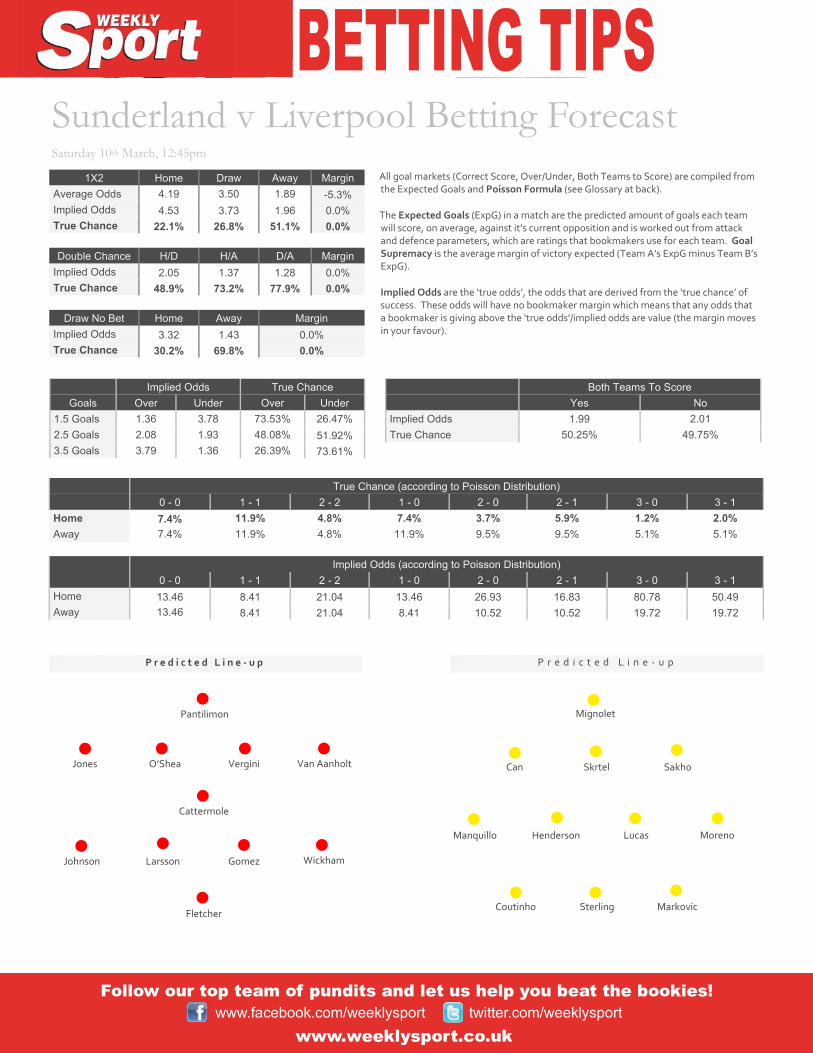
1X2 Home Draw Away MarginAverage Odds 4.19 3.50 1.89 -5.3%Implied Odds 4.53 3.73 1.96 0.0%True Chance 22.1% 26.8% 51.1% 0.0%
Double Chance H/D H/A D/A MarginImplied Odds 2.05 1.37 1.28 0.0%True Chance 48.9% 73.2% 77.9% 0.0%
Draw No Bet Home Away MarginImplied Odds 3.32 1.43 0.0%True Chance 30.2% 69.8% 0.0%
Implied Odds True ChanceGoals Over Under Over Under
1.5 Goals 1.36 3.78 73.53% 26.47%2.5 Goals 2.08 1.93 48.08% 51.92%3.5 Goals 3.79 1.36 26.39% 73.61%
True Chance (according to Poisson Distribution)0 - 0 1 - 1 2 - 2 1 - 0 2 - 0 2 - 1 3 - 0 3 - 1
Home 7.4% 11.9% 4.8% 7.4% 3.7% 5.9% 1.2% 2.0%Away 7.4% 11.9% 4.8% 11.9% 9.5% 9.5% 5.1% 5.1%
Implied Odds (according to Poisson Distribution)0 - 0 1 - 1 2 - 2 1 - 0 2 - 0 2 - 1 3 - 0 3 - 1
Home 13.46 8.41 21.04 13.46 26.93 16.83 80.78 50.49Away 13.46 8.41 21.04 8.41 10.52 10.52 19.72 19.72
Both Teams To ScoreYes No
Implied Odds 1.99 2.01True Chance 50.25% 49.75%
Sunderland v Liverpool Betting ForecastAll goal markets (Correct Score, Over/Under, Both Teams to Score) are compiled fromthe Expected Goals and Poisson Formula (see Glossary at back).
The Expected Goals (ExpG) in a match are the predicted amount of goals each teamwill score, on average, against it’s current opposition and is worked out from attackand defence parameters, which are ratings that bookmakers use for each team. GoalSupremacy is the average margin of victory expected (Team A’s ExpG minus Team B’sExpG).
Implied Odds are the ‘true odds’, the odds that are derived from the ‘true chance’ ofsuccess. These odds will have no bookmaker margin which means that any odds thata bookmaker is giving above the ‘true odds’/implied odds are value (the margin movesin your favour).
Saturday 10th March, 12:45pm
Mignolet
Sakho
Markovic
Lucas
Coutinho
Moreno
Skrtel
Sterling
HendersonManquillo
Can
Pantilimon
Vergini Van Aanholt
Johnson
O’Shea
Fletcher
Larsson
Cattermole
WickhamGomez
Jones

22.1%
26.8%
51.1%
0 - 0 1 - 1 2 - 2 1 - 0 2 - 0 2 - 1 3 - 0 3 - 1
7.4%
11.9%
4.8%
7.4%
3.7%
5.9%
1.2%2.0%
7.4%
11.9%
4.8%
11.9%
9.5% 9.5%
5.1% 5.1%
38.46%
61.54%
1.00 1.60
30.2% 69.8%
H v A
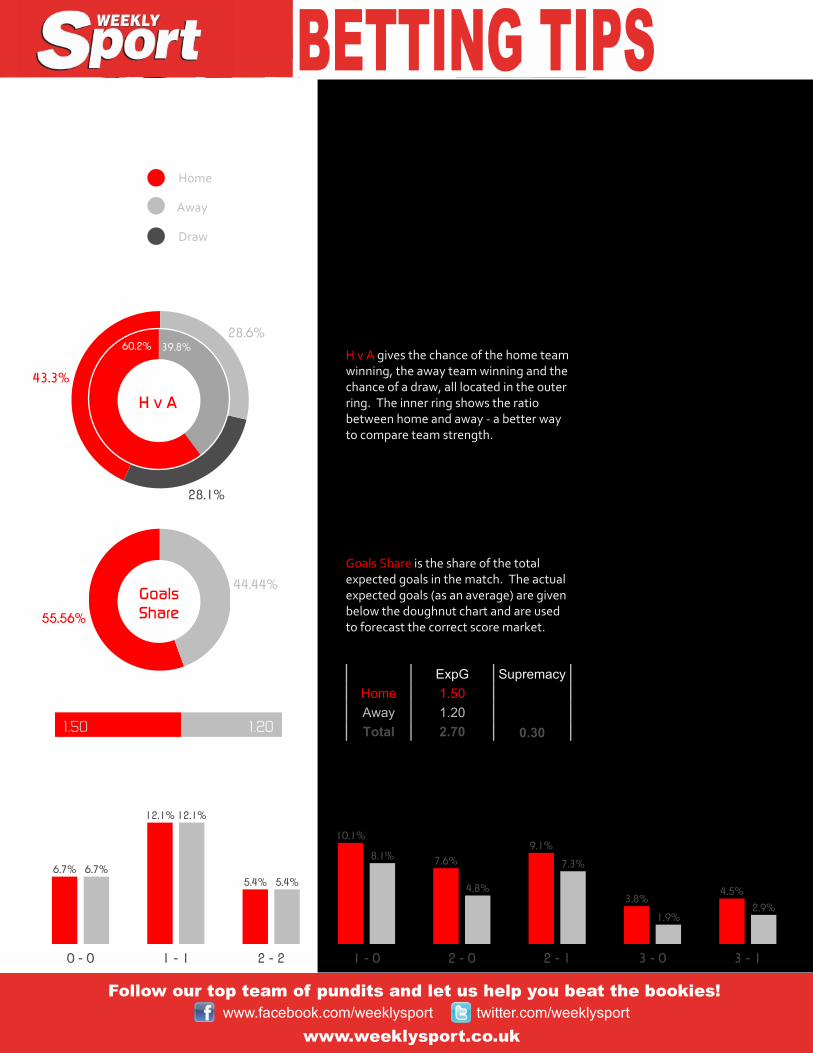
H v A gives the chance of the home teamwinning, the away team winning and thechance of a draw, all located in the outerring. The inner ring shows the ratiobetween home and away - a better wayto compare team strength.
Goals Share is the share of the totalexpected goals in the match. The actualexpected goals (as an average) are givenbelow the doughnut chart and are usedto forecast the correct score market.
ExpG SupremacyHome 1.00Away 1.60Total 2.60 -0.60
GoalsShare
Home
Away
Draw

P r e d i c t e d L i n e - u pP r e d i c t e d L i n e - u p
1X2 Home Draw Away MarginAverage Odds 2.16 3.33 3.44 -5.4%Implied Odds 2.25 3.54 3.67 0.0%True Chance 44.5% 28.2% 27.3% 0.0%
Double Chance H/D H/A D/A MarginImplied Odds 1.37 1.39 1.80 0.0%True Chance 72.7% 71.8% 55.5% 0.0%
Draw No Bet Home Away MarginImplied Odds 1.61 2.63 0.0%True Chance 62.0% 38.0% 0.0%
Implied Odds True ChanceGoals Over Under Over Under
1.5 Goals 1.40 3.50 71.43% 28.57%2.5 Goals 2.19 1.84 45.66% 54.34%3.5 Goals 4.13 1.32 24.21% 75.79%
True Chance (according to Poisson Distribution)0 - 0 1 - 1 2 - 2 1 - 0 2 - 0 2 - 1 3 - 0 3 - 1
Home 8.2% 12.6% 4.9% 11.5% 8.0% 8.8% 3.8% 4.1%Away 8.2% 12.6% 4.9% 9.0% 5.0% 7.0% 1.8% 2.5%
Implied Odds (according to Poisson Distribution)0 - 0 1 - 1 2 - 2 1 - 0 2 - 0 2 - 1 3 - 0 3 - 1
Home 12.18 7.91 20.55 8.70 12.43 11.30 26.64 24.22Away 12.18 7.91 20.55 11.07 20.14 14.38 54.92 39.23
Both Teams To ScoreYes No
Implied Odds 1.99 2.01True Chance 50.25% 49.75%
Burnley v QPR Betting ForecastAll goal markets (Correct Score, Over/Under, Both Teams to Score) are compiled fromthe Expected Goals and Poisson Formula (see Glossary at back).
The Expected Goals (ExpG) in a match are the predicted amount of goals each teamwill score, on average, against it’s current opposition and is worked out from attackand defence parameters, which are ratings that bookmakers use for each team. GoalSupremacy is the average margin of victory expected (Team A’s ExpG minus Team B’sExpG).
Implied Odds are the ‘true odds’, the odds that are derived from the ‘true chance’ ofsuccess. These odds will have no bookmaker margin which means that any odds thata bookmaker is giving above the ‘true odds’/implied odds are value (the margin movesin your favour).
Saturday 140h March, 3pm
Mee
Jones
Heaton
ShackellDuff
Barnes
Arfield Marney Boyd
Trippier
Ings
Green
Caulker Hill
Barton
Onuoha
HenrtVargas
Isla
Zamora
Fer
Austin

44.5%
28.2%
27.3%
0 - 0 1 - 1 2 - 2 1 - 0 2 - 0 2 - 1 3 - 0 3 - 1
8.2%
12.6%
4.9%
11.5%
8.0%8.8%
3.8% 4.1%
8.2%
12.6%
4.9%
9.0%
5.0%
7.0%
1.8%2.5%
56.00%
44.00%
1.40 1.10
62.0% 38.0%
H v A
H v A gives the chance of the home teamwinning, the away team winning and thechance of a draw, all located in the outerring. The inner ring shows the ratiobetween home and away - a better wayto compare team strength.
Goals Share is the share of the totalexpected goals in the match. The actualexpected goals (as an average) are givenbelow the doughnut chart and are usedto forecast the correct score market.
ExpG SupremacyHome 1.40Away 1.10Total 2.50 0.30
GoalsShare
Home
Away
Draw

P r e d i c t e d L i n e - u pP r e d i c t e d L i n e - u p
1X2 Home Draw Away MarginAverage Odds 1.19 6.80 15.27 -5.3%Implied Odds 1.22 7.73 20.89 0.0%True Chance 82.3% 12.9% 4.8% 0.0%
Double Chance H/D H/A D/A MarginImplied Odds 1.05 1.15 5.64 0.0%True Chance 95.2% 87.1% 17.7% 0.0%
Draw No Bet Home Away MarginImplied Odds 1.06 18.19 0.0%True Chance 94.5% 5.5% 0.0%
Implied Odds True ChanceGoals Over Under Over Under
1.5 Goals 1.21 5.76 82.64% 17.36%2.5 Goals 1.61 2.64 62.11% 37.89%3.5 Goals 2.52 1.66 39.68% 60.32%
True Chance (according to Poisson Distribution)0 - 0 1 - 1 2 - 2 1 - 0 2 - 0 2 - 1 3 - 0 3 - 1
Home 4.1% 6.4% 2.5% 10.6% 13.8% 8.3% 11.9% 7.2%Away 4.1% 6.4% 2.5% 2.4% 0.7% 1.9% 0.1% 0.4%
Implied Odds (according to Poisson Distribution)0 - 0 1 - 1 2 - 2 1 - 0 2 - 0 2 - 1 3 - 0 3 - 1
Home 24.53 15.73 40.32 9.44 7.26 12.10 8.37 13.96Away 24.53 15.73 40.32 40.89 136.29 52.42 681.46 262.10
Both Teams To ScoreYes No
Implied Odds 2.40 1.71True Chance 41.67% 58.33%
Chelsea v Newcastle United Betting ForecastAll goal markets (Correct Score, Over/Under, Both Teams to Score) are compiled fromthe Expected Goals and Poisson Formula (see Glossary at back).
The Expected Goals (ExpG) in a match are the predicted amount of goals each teamwill score, on average, against it’s current opposition and is worked out from attackand defence parameters, which are ratings that bookmakers use for each team. GoalSupremacy is the average margin of victory expected (Team A’s ExpG minus Team B’sExpG).
Implied Odds are the ‘true odds’, the odds that are derived from the ‘true chance’ ofsuccess. These odds will have no bookmaker margin which means that any odds thata bookmaker is giving above the ‘true odds’/implied odds are value (the margin movesin your favour).
Saturday 10h March, 3pm
Courtois
Terry
Hazard
Cahill
Fabregas Matic
Ivanovic
Oscar
Azpilicueta
Costa
Willian
Krul
Dummett
Gouffran
Coloccini
Colback Haidara
Janmaat
Sissoko
Santon
Armstrong
Ayoze Perez

82.3%
12.9%4.8%
0 - 0 1 - 1 2 - 2 1 - 0 2 - 0 2 - 1 3 - 0 3 - 1
4.1%
6.4%
2.5%
10.6%
13.8%
8.3%
11.9%
7.2%
4.1%
6.4%
2.5% 2.4%
0.7%1.9%
0.1% 0.4%
81.25%
18.75%
2.60 0.60
94.5% 5.5%
H v A
H v A gives the chance of the home teamwinning, the away team winning and thechance of a draw, all located in the outerring. The inner ring shows the ratiobetween home and away - a better wayto compare team strength.
Goals Share is the share of the totalexpected goals in the match. The actualexpected goals (as an average) are givenbelow the doughnut chart and are usedto forecast the correct score market.
ExpG SupremacyHome 2.60Away 0.60Total 3.20 2.00
GoalsShare
Home
Away
Draw

P r e d i c t e d L i n e - u pP r e d i c t e d L i n e - u p
1X2 Home Draw Away MarginAverage Odds 4.14 3.61 1.87 -5.3%Implied Odds 4.47 3.86 1.93 0.0%True Chance 22.4% 25.9% 51.7% 0.0%
Double Chance H/D H/A D/A MarginImplied Odds 2.07 1.35 1.29 0.0%True Chance 48.3% 74.1% 77.6% 0.0%
Draw No Bet Home Away MarginImplied Odds 3.31 1.43 0.0%True Chance 30.2% 69.8% 0.0%
Implied Odds True ChanceGoals Over Under Over Under
1.5 Goals 1.25 5.00 80.00% 20.00%2.5 Goals 1.73 2.37 57.80% 42.20%3.5 Goals 2.83 1.55 35.34% 64.66%
True Chance (according to Poisson Distribution)0 - 0 1 - 1 2 - 2 1 - 0 2 - 0 2 - 1 3 - 0 3 - 1
Home 5.0% 10.8% 5.8% 6.0% 3.6% 6.5% 1.4% 2.6%Away 5.0% 10.8% 5.8% 9.0% 8.1% 9.7% 4.8% 5.8%
Implied Odds (according to Poisson Distribution)0 - 0 1 - 1 2 - 2 1 - 0 2 - 0 2 - 1 3 - 0 3 - 1
Home 20.09 9.30 17.22 16.74 27.90 15.50 69.74 38.75Away 20.09 9.30 17.22 11.16 12.40 10.33 20.66 17.22
Both Teams To ScoreYes No
Implied Odds 1.73 2.37True Chance 57.80% 42.20%
Everton v Manchester City Betting ForecastAll goal markets (Correct Score, Over/Under, Both Teams to Score) are compiled fromthe Expected Goals and Poisson Formula (see Glossary at back).
The Expected Goals (ExpG) in a match are the predicted amount of goals each teamwill score, on average, against it’s current opposition and is worked out from attackand defence parameters, which are ratings that bookmakers use for each team. GoalSupremacy is the average margin of victory expected (Team A’s ExpG minus Team B’sExpG).
Implied Odds are the ‘true odds’, the odds that are derived from the ‘true chance’ ofsuccess. These odds will have no bookmaker margin which means that any odds thata bookmaker is giving above the ‘true odds’/implied odds are value (the margin movesin your favour).
Saturday 10th March, 3pm
Hart
Managala ClichyDemichelis
Navas NasriFernando
Jovetic
Silva
Fernandinho
Zabaleta
Robles
Jagielka BainesStonesColeman
Mirallax
Barry
Barkley
Lukaku
Besic
Naismith

22.4%
25.9%
51.7%
0 - 0 1 - 1 2 - 2 1 - 0 2 - 0 2 - 1 3 - 0 3 - 1
5.0%
10.8%
5.8% 6.0%
3.6%
6.5%
1.4%2.6%
5.0%
10.8%
5.8%
9.0%8.1%
9.7%
4.8%5.8%
40.00%
60.00%
1.20 1.80
30.2% 69.8%
H v A
H v A gives the chance of the home teamwinning, the away team winning and thechance of a draw, all located in the outerring. The inner ring shows the ratiobetween home and away - a better wayto compare team strength.
Goals Share is the share of the totalexpected goals in the match. The actualexpected goals (as an average) are givenbelow the doughnut chart and are usedto forecast the correct score market.
ExpG SupremacyHome 1.20Away 1.80Total 3.00 -0.60
GoalsShare
Home
Away
Draw

P r e d i c t e d L i n e - u pP r e d i c t e d L i n e - u p
1X2 Home Draw Away MarginAverage Odds 2.16 3.24 3.52 -5.6%Implied Odds 2.25 3.45 3.77 0.0%True Chance 44.4% 29.0% 26.6% 0.0%
Double Chance H/D H/A D/A MarginImplied Odds 1.36 1.41 1.80 0.0%True Chance 73.4% 71.0% 55.6% 0.0%
Draw No Bet Home Away MarginImplied Odds 1.60 2.67 0.0%True Chance 62.6% 37.4% 0.0%
Implied Odds True ChanceGoals Over Under Over Under
1.5 Goals 1.49 3.04 67.11% 32.89%2.5 Goals 2.48 1.68 40.32% 59.68%3.5 Goals 4.98 1.25 20.08% 79.92%
True Chance (according to Poisson Distribution)0 - 0 1 - 1 2 - 2 1 - 0 2 - 0 2 - 1 3 - 0 3 - 1
Home 10.0% 12.9% 4.1% 13.5% 9.4% 8.7% 4.1% 3.9%Away 10.0% 12.9% 4.1% 9.5% 4.5% 6.1% 1.4% 1.9%
Implied Odds (according to Poisson Distribution)0 - 0 1 - 1 2 - 2 1 - 0 2 - 0 2 - 1 3 - 0 3 - 1
Home 9.97 7.78 24.26 7.39 10.59 11.52 24.32 25.60Away 9.97 7.78 24.26 10.50 22.10 16.37 69.80 51.70
Both Teams To ScoreYes No
Implied Odds 2.20 1.83True Chance 45.45% 54.55%
Leicester City v Aston Villa Betting ForecastAll goal markets (Correct Score, Over/Under, Both Teams to Score) are compiled fromthe Expected Goals and Poisson Formula (see Glossary at back).
The Expected Goals (ExpG) in a match are the predicted amount of goals each teamwill score, on average, against it’s current opposition and is worked out from attackand defence parameters, which are ratings that bookmakers use for each team. GoalSupremacy is the average margin of victory expected (Team A’s ExpG minus Team B’sExpG).
Implied Odds are the ‘true odds’, the odds that are derived from the ‘true chance’ ofsuccess. These odds will have no bookmaker margin which means that any odds thata bookmaker is giving above the ‘true odds’/implied odds are value (the margin movesin your favour).
Saturday 10th March, 3pm
Hamer
Wasilewski Morgan
Ulloa
HammondJames
Konchesky
Vardy
Nugent
Simpson
Albrighton
Guzan
Okore CissokhoClark
Weimann
CleverleySanchezWestwood
Benteke Agbonlahor
Hutton

44.4%
29.0%
26.6%
0 - 0 1 - 1 2 - 2 1 - 0 2 - 0 2 - 1 3 - 0 3 - 1
10.0%
12.9%
4.1%
13.5%
9.4%8.7%
4.1% 3.9%
10.0%
12.9%
4.1%
9.5%
4.5%
6.1%
1.4% 1.9%
58.70%
41.30%
1.35 0.95
62.6% 37.4%
H v A
H v A gives the chance of the home teamwinning, the away team winning and thechance of a draw, all located in the outerring. The inner ring shows the ratiobetween home and away - a better wayto compare team strength.
Goals Share is the share of the totalexpected goals in the match. The actualexpected goals (as an average) are givenbelow the doughnut chart and are usedto forecast the correct score market.
ExpG SupremacyHome 1.35Away 0.95Total 2.30 0.40
GoalsShare
Home
Away
Draw

P r e d i c t e d L i n e - u pP r e d i c t e d L i n e - u p
1X2 Home Draw Away MarginAverage Odds 2.22 3.34 3.29 -5.4%Implied Odds 2.31 3.55 3.50 0.0%True Chance 43.3% 28.1% 28.6% 0.0%
Double Chance H/D H/A D/A MarginImplied Odds 1.40 1.39 1.76 0.0%True Chance 71.4% 71.9% 56.7% 0.0%
Draw No Bet Home Away MarginImplied Odds 1.66 2.51 0.0%True Chance 60.2% 39.8% 0.0%
Implied Odds True ChanceGoals Over Under Over Under
1.5 Goals 1.33 4.03 75.19% 24.81%2.5 Goals 1.97 2.03 50.76% 49.24%3.5 Goals 3.50 1.40 28.57% 71.43%
True Chance (according to Poisson Distribution)0 - 0 1 - 1 2 - 2 1 - 0 2 - 0 2 - 1 3 - 0 3 - 1
Home 6.7% 12.1% 5.4% 10.1% 7.6% 9.1% 3.8% 4.5%Away 6.7% 12.1% 5.4% 8.1% 4.8% 7.3% 1.9% 2.9%
Implied Odds (according to Poisson Distribution)0 - 0 1 - 1 2 - 2 1 - 0 2 - 0 2 - 1 3 - 0 3 - 1
Home 14.88 8.27 18.37 9.92 13.23 11.02 26.45 22.04Away 14.88 8.27 18.37 12.40 20.67 13.78 51.67 34.44
Both Teams To ScoreYes No
Implied Odds 1.85 2.18True Chance 54.05% 45.95%
Swansea City v West Ham Utd Betting ForecastAll goal markets (Correct Score, Over/Under, Both Teams to Score) are compiled fromthe Expected Goals and Poisson Formula (see Glossary at back).
The Expected Goals (ExpG) in a match are the predicted amount of goals each teamwill score, on average, against it’s current opposition and is worked out from attackand defence parameters, which are ratings that bookmakers use for each team. GoalSupremacy is the average margin of victory expected (Team A’s ExpG minus Team B’sExpG).
Implied Odds are the ‘true odds’, the odds that are derived from the ‘true chance’ ofsuccess. These odds will have no bookmaker margin which means that any odds thata bookmaker is giving above the ‘true odds’/implied odds are value (the margin movesin your favour).
Saturday 10th March, 5:30pm
Fabianski
Williams TaylorFernandezRangel
Routledge
Britton Carroll
Gomis
Dyer Sigurdsson
Adrian
Reid CresswellCollins
Downing
Song
Nolan
Jenkinson
Noble
CarrollValencia
43.3%
28.1%
28.6%
0 - 0 1 - 1 2 - 2 1 - 0 2 - 0 2 - 1 3 - 0 3 - 1
6.7%
12.1%
5.4%
10.1%
7.6%9.1%
3.8%4.5%
6.7%
12.1%
5.4%
8.1%
4.8%
7.3%
1.9%2.9%
55.56%
44.44%
1.50 1.20
60.2% 39.8%
H v A
H v A gives the chance of the home teamwinning, the away team winning and thechance of a draw, all located in the outerring. The inner ring shows the ratiobetween home and away - a better wayto compare team strength.
Goals Share is the share of the totalexpected goals in the match. The actualexpected goals (as an average) are givenbelow the doughnut chart and are usedto forecast the correct score market.
ExpG SupremacyHome 1.50Away 1.20Total 2.70 0.30
GoalsShare
Home
Away
Draw

P r e d i c t e d L i n e - u pP r e d i c t e d L i n e - u p
1X2 Home Draw Away MarginAverage Odds 2.02 3.27 3.95 -5.4%Implied Odds 2.10 3.47 4.25 0.0%True Chance 47.7% 28.8% 23.5% 0.0%
Double Chance H/D H/A D/A MarginImplied Odds 1.31 1.40 1.91 0.0%True Chance 76.5% 71.2% 52.3% 0.0%
Draw No Bet Home Away MarginImplied Odds 1.49 3.03 0.0%True Chance 67.0% 33.0% 0.0%
Implied Odds True ChanceGoals Over Under Over Under
1.5 Goals 1.49 3.04 67.11% 32.89%2.5 Goals 2.48 1.68 40.32% 59.68%3.5 Goals 4.98 1.25 20.08% 79.92%
True Chance (according to Poisson Distribution)0 - 0 1 - 1 2 - 2 1 - 0 2 - 0 2 - 1 3 - 0 3 - 1
Home 10.0% 12.6% 4.0% 14.0% 9.8% 8.8% 4.6% 4.1%Away 10.0% 12.6% 4.0% 9.0% 4.1% 5.7% 1.2% 1.7%
Implied Odds (according to Poisson Distribution)0 - 0 1 - 1 2 - 2 1 - 0 2 - 0 2 - 1 3 - 0 3 - 1
Home 9.97 7.92 25.13 7.12 10.18 11.31 21.81 24.23Away 9.97 7.92 25.13 11.08 24.63 17.59 82.09 58.64
Both Teams To ScoreYes No
Implied Odds 2.24 1.81True Chance 44.64% 55.36%
WBA v Hull City Betting ForecastAll goal markets (Correct Score, Over/Under, Both Teams to Score) are compiled fromthe Expected Goals and Poisson Formula (see Glossary at back).
The Expected Goals (ExpG) in a match are the predicted amount of goals each teamwill score, on average, against it’s current opposition and is worked out from attackand defence parameters, which are ratings that bookmakers use for each team. GoalSupremacy is the average margin of victory expected (Team A’s ExpG minus Team B’sExpG).
Implied Odds are the ‘true odds’, the odds that are derived from the ‘true chance’ ofsuccess. These odds will have no bookmaker margin which means that any odds thata bookmaker is giving above the ‘true odds’/implied odds are value (the margin movesin your favour).
Saturday 10th March, 3pm
McGregor
Davies DawsonChester
JelavicHernandez
MeylerHuddlestone
BradyElmohamady
Livermore
Foster
Lescott Baird
Sessegnon Gardner
McAuley
Morrison
Berahino
Brunt
Wisdom
Dorrans
47.7%
28.8%
23.5%
0 - 0 1 - 1 2 - 2 1 - 0 2 - 0 2 - 1 3 - 0 3 - 1
10.0%
12.6%
4.0%
14.0%
9.8%8.8%
4.6% 4.1%
10.0%
12.6%
4.0%
9.0%
4.1%
5.7%
1.2% 1.7%
60.87%
39.13%
1.40 0.90
67.0% 33.0%
H v A
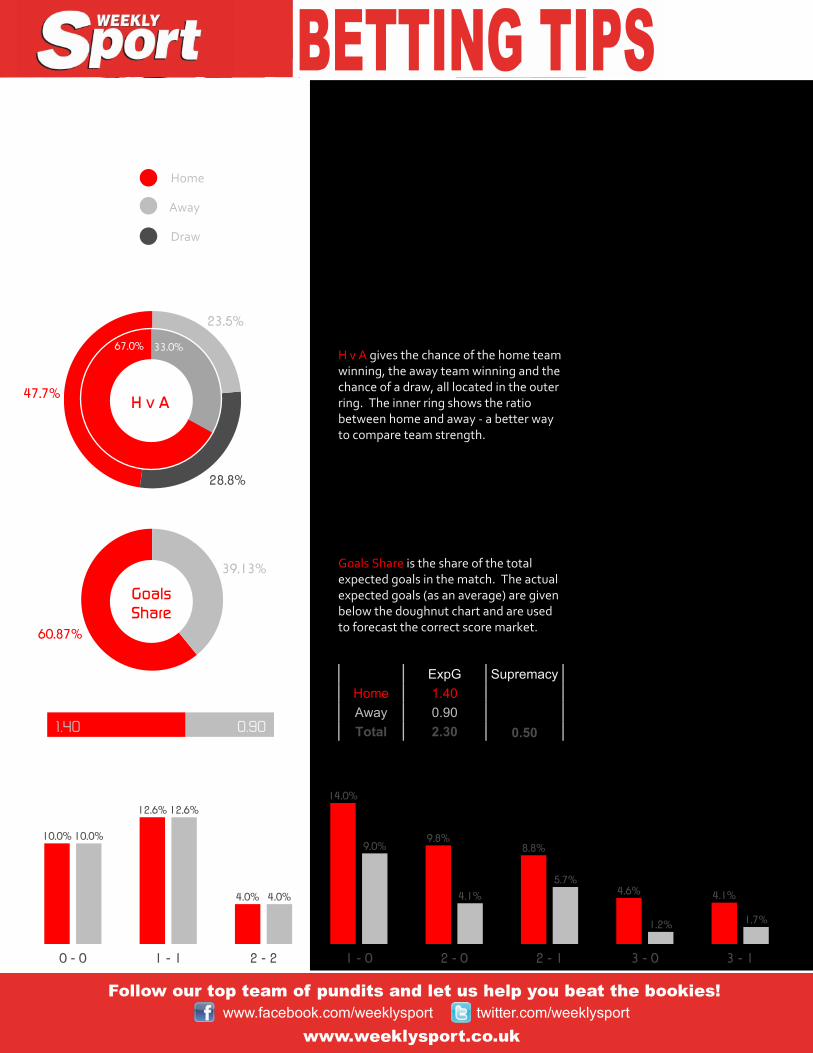
H v A gives the chance of the home teamwinning, the away team winning and thechance of a draw, all located in the outerring. The inner ring shows the ratiobetween home and away - a better wayto compare team strength.
Goals Share is the share of the totalexpected goals in the match. The actualexpected goals (as an average) are givenbelow the doughnut chart and are usedto forecast the correct score market.
ExpG SupremacyHome 1.40Away 0.90Total 2.30 0.50
GoalsShare
Home
Away
Draw

P r e d i c t e d L i n e - u pP r e d i c t e d L i n e - u p
1X2 Home Draw Away MarginAverage Odds 3.47 3.34 2.14 -5.5%Implied Odds 3.71 3.56 2.23 0.0%True Chance 27.0% 28.1% 44.9% 0.0%
Double Chance H/D H/A D/A MarginImplied Odds 1.81 1.39 1.37 0.0%True Chance 55.1% 71.9% 73.0% 0.0%
Draw No Bet Home Away MarginImplied Odds 2.66 1.60 0.0%True Chance 37.5% 62.5% 0.0%
Implied Odds True ChanceGoals Over Under Over Under
1.5 Goals 1.38 3.63 72.46% 27.54%2.5 Goals 2.13 1.88 46.95% 53.05%3.5 Goals 3.95 1.34 25.32% 74.68%
True Chance (according to Poisson Distribution)0 - 0 1 - 1 2 - 2 1 - 0 2 - 0 2 - 1 3 - 0 3 - 1
Home 7.8% 12.5% 5.0% 8.6% 4.7% 6.8% 1.7% 2.5%Away 7.8% 12.5% 5.0% 11.3% 8.2% 9.0% 4.0% 4.4%
Implied Odds (according to Poisson Distribution)0 - 0 1 - 1 2 - 2 1 - 0 2 - 0 2 - 1 3 - 0 3 - 1
Home 12.81 8.03 20.14 11.64 21.17 14.60 57.73 39.82Away 12.81 8.03 20.14 8.83 12.18 11.08 25.21 22.91
Both Teams To ScoreYes No
Implied Odds 1.97 2.03True Chance 50.76% 49.24%
Crystal Palace v Tottenham Betting ForecastAll goal markets (Correct Score, Over/Under, Both Teams to Score) are compiled fromthe Expected Goals and Poisson Formula (see Glossary at back).
The Expected Goals (ExpG) in a match are the predicted amount of goals each teamwill score, on average, against it’s current opposition and is worked out from attackand defence parameters, which are ratings that bookmakers use for each team. GoalSupremacy is the average margin of victory expected (Team A’s ExpG minus Team B’sExpG).
Implied Odds are the ‘true odds’, the odds that are derived from the ‘true chance’ ofsuccess. These odds will have no bookmaker margin which means that any odds thata bookmaker is giving above the ‘true odds’/implied odds are value (the margin movesin your favour).
Saturday 10th March, 5:30pm
Lloris
Vertonghen RoseFazio
EriksenTownsend
Kane
Stambouli
Walker
Mason
Chadli
Speroni
Delaney Ward
McArthur
ZahaPuncheon
Ledley
Dann
Bannan
Campbell
Kelly

27.0%
28.1%
44.9%
0 - 0 1 - 1 2 - 2 1 - 0 2 - 0 2 - 1 3 - 0 3 - 1
7.8%
12.5%
5.0%
8.6%
4.7%
6.8%
1.7%2.5%
7.8%
12.5%
5.0%
11.3%
8.2%9.0%
4.0% 4.4%
43.14%
56.86%
1.10 1.45
37.5% 62.5%
H v A
H v A gives the chance of the home teamwinning, the away team winning and thechance of a draw, all located in the outerring. The inner ring shows the ratiobetween home and away - a better wayto compare team strength.
Goals Share is the share of the totalexpected goals in the match. The actualexpected goals (as an average) are givenbelow the doughnut chart and are usedto forecast the correct score market.
ExpG SupremacyHome 1.10Away 1.45Total 2.55 -0.35
GoalsShare
Home
Away
Draw

P r e d i c t e d L i n e - u pP r e d i c t e d L i n e - u p
1X2 Home Draw Away MarginAverage Odds 1.44 4.41 7.37 -5.7%Implied Odds 1.48 4.81 8.57 0.0%True Chance 67.5% 20.8% 11.7% 0.0%
Double Chance H/D H/A D/A MarginImplied Odds 1.13 1.26 3.08 0.0%True Chance 88.3% 79.2% 32.5% 0.0%
Draw No Bet Home Away MarginImplied Odds 1.17 6.79 0.0%True Chance 85.3% 14.7% 0.0%
Implied Odds True ChanceGoals Over Under Over Under
1.5 Goals 1.27 4.70 78.74% 21.26%2.5 Goals 1.80 2.25 55.56% 44.44%3.5 Goals 3.03 1.49 33.00% 67.00%
True Chance (according to Poisson Distribution)0 - 0 1 - 1 2 - 2 1 - 0 2 - 0 2 - 1 3 - 0 3 - 1
Home 5.5% 9.2% 3.9% 11.6% 12.1% 9.7% 8.5% 6.8%Away 5.5% 9.2% 3.9% 4.4% 1.8% 3.7% 0.5% 1.0%
Implied Odds (according to Poisson Distribution)0 - 0 1 - 1 2 - 2 1 - 0 2 - 0 2 - 1 3 - 0 3 - 1
Home 18.17 10.82 25.76 8.65 8.24 10.30 11.77 14.72Away 18.17 10.82 25.76 22.72 56.79 27.04 212.98 101.42
Both Teams To ScoreYes No
Implied Odds 2.08 1.93True Chance 48.08% 51.92%
Arsenal v Stoke City Betting ForecastAll goal markets (Correct Score, Over/Under, Both Teams to Score) are compiled fromthe Expected Goals and Poisson Formula (see Glossary at back).
The Expected Goals (ExpG) in a match are the predicted amount of goals each teamwill score, on average, against it’s current opposition and is worked out from attackand defence parameters, which are ratings that bookmakers use for each team. GoalSupremacy is the average margin of victory expected (Team A’s ExpG minus Team B’sExpG).
Implied Odds are the ‘true odds’, the odds that are derived from the ‘true chance’ ofsuccess. These odds will have no bookmaker margin which means that any odds thata bookmaker is giving above the ‘true odds’/implied odds are value (the margin movesin your favour).
Sunday 11th March, 1:30pm
Debuchy
Szczesny
Gibbs
Flamini
Mertesacker
Cazorla
Koscielny
Chamberlaiin
Coquelin
SanchezGiroud
Begovic
Muniesa PietersShawcross
Crouch
Walters
WhelanN’Zonzi
Bojan Arnautovic
Cameron

67.5%
20.8%
11.7%
0 - 0 1 - 1 2 - 2 1 - 0 2 - 0 2 - 1 3 - 0 3 - 1
5.5%
9.2%
3.9%
11.6% 12.1%
9.7%8.5%
6.8%5.5%
9.2%
3.9% 4.4%
1.8%
3.7%
0.5% 1.0%
72.41%
27.59%
2.10 0.80
85.3% 14.7%
H v A
H v A gives the chance of the home teamwinning, the away team winning and thechance of a draw, all located in the outerring. The inner ring shows the ratiobetween home and away - a better wayto compare team strength.
Goals Share is the share of the totalexpected goals in the match. The actualexpected goals (as an average) are givenbelow the doughnut chart and are usedto forecast the correct score market.
ExpG SupremacyHome 2.10Away 0.80Total 2.90 1.30
GoalsShare
Home
Away
Draw

P r e d i c t e d L i n e - u pP r e d i c t e d L i n e - u p
1X2 Home Draw Away MarginAverage Odds 1.80 3.61 4.51 -5.4%Implied Odds 1.86 3.86 4.91 0.0%True Chance 53.7% 25.9% 20.4% 0.0%
Double Chance H/D H/A D/A MarginImplied Odds 1.26 1.35 2.16 0.0%True Chance 79.6% 74.1% 46.3% 0.0%
Draw No Bet Home Away MarginImplied Odds 1.38 3.64 0.0%True Chance 72.5% 27.5% 0.0%
Implied Odds True ChanceGoals Over Under Over Under
1.5 Goals 1.36 3.78 73.53% 26.47%2.5 Goals 2.08 1.93 48.08% 51.92%3.5 Goals 3.79 1.36 26.39% 73.61%
True Chance (according to Poisson Distribution)0 - 0 1 - 1 2 - 2 1 - 0 2 - 0 2 - 1 3 - 0 3 - 1
Home 7.4% 11.6% 4.6% 12.3% 10.1% 9.6% 5.6% 5.3%Away 7.4% 11.6% 4.6% 7.1% 3.4% 5.5% 1.1% 1.8%
Implied Odds (according to Poisson Distribution)0 - 0 1 - 1 2 - 2 1 - 0 2 - 0 2 - 1 3 - 0 3 - 1
Home 13.46 8.59 21.92 8.16 9.89 10.41 17.98 18.93Away 13.46 8.59 21.92 14.17 29.84 18.08 94.22 57.10
Both Teams To ScoreYes No
Implied Odds 2.02 1.98True Chance 49.50% 50.50%
Manchester Utd v Saints Betting ForecastAll goal markets (Correct Score, Over/Under, Both Teams to Score) are compiled fromthe Expected Goals and Poisson Formula (see Glossary at back).
The Expected Goals (ExpG) in a match are the predicted amount of goals each teamwill score, on average, against it’s current opposition and is worked out from attackand defence parameters, which are ratings that bookmakers use for each team. GoalSupremacy is the average margin of victory expected (Team A’s ExpG minus Team B’sExpG).
Implied Odds are the ‘true odds’, the odds that are derived from the ‘true chance’ ofsuccess. These odds will have no bookmaker margin which means that any odds thata bookmaker is giving above the ‘true odds’/implied odds are value (the margin movesin your favour).
Monday 11th March, 4pm
De Gea
Smalling ShawEvans
Herrera
Jones
Carrick
Rooney
Van PersieFalcao
Di Maria
Forster
Alderweireld Bertrand
Schneiderlin Tadic
Fonte
Davis
WanyamaWard-Prowse
Clyne
Pelle

53.7%
25.9%
20.4%
0 - 0 1 - 1 2 - 2 1 - 0 2 - 0 2 - 1 3 - 0 3 - 1
7.4%
11.6%
4.6%
12.3%
10.1% 9.6%
5.6% 5.3%
7.4%
11.6%
4.6%
7.1%
3.4%
5.5%
1.1%1.8%
63.46%
36.54%
1.65 0.95
72.5% 27.5%
H v A
H v A gives the chance of the home teamwinning, the away team winning and thechance of a draw, all located in the outerring. The inner ring shows the ratiobetween home and away - a better wayto compare team strength.
Goals Share is the share of the totalexpected goals in the match. The actualexpected goals (as an average) are givenbelow the doughnut chart and are usedto forecast the correct score market.
ExpG SupremacyHome 1.65Away 0.95Total 2.60 0.70
GoalsShare
Home
Away
Draw

Decimal Fraction ImpliedProbability
1.2 1/5 83.3%1.22 2.9 82.0%1.25 1/4 80.0%1.28 2/7 78.1%1.3 3/10 76.9%1.33 1/3 75.2%1.35 7/20 74.1%1.36 4/11 73.5%1.4 2/5 71.4%1.44 4/9 69.4%1.45 9/20 69.0%1.47 40/85 68.0%1.5 1/2 66.7%1.53 8/15 65.4%1.57 4/7 63.7%1.6 3/5 62.5%1.62 8/13 61.7%1.63 5/8 61.3%1.66 4/6 60.2%1.7 7/10 58.8%1.72 8/11 58.1%1.8 4/5 55.6%1.83 5/6 54.6%1.9 9/10 52.6%1.91 10/11 52.4%1.95 20/21 51.3%2 1/1 50.0%2.05 21/20 48.8%2.1 11/10 47.6%2.2 6/5 45.5%2.25 5/4 44.4%2.3 13/10 43.5%2.38 11/8 42.0%2.4 7/5 41.7%2.5 6/4 40.0%2.6 8/5 38.5%
Decimal Fraction ImpliedProbability
2.63 13/8 38.0%2.7 17/10 37.0%2.75 7/4 36.4%2.8 9/5 35.7%2.88 15/8 34.7%2.9 19/10 34.5%3 2/1 33.3%3.1 21/10 32.3%3.13 85/40 31.9%3.2 11/5 31.3%3.25 9/4 30.8%3.3 23/10 30.3%3.33 100/30 30.0%3.38 95/40 29.6%3.4 12/5 29.4%3.5 5/2 28.6%3.6 13/5 27.8%3.75 11/4 26.7%3.8 14/5 26.3%4 3/1 25.0%4.2 16/5 23.8%4.33 10/3 23.1%4.5 7/2 22.2%4.6 18/5 21.7%5 4/1 20.0%5.5 9/2 18.2%6 5/1 16.7%6.5 11/2 15.4%7 6/1 14.3%7.5 13/2 13.3%8 7/1 12.5%8.5 15/2 11.8%9 8/1 11.1%9.5 17/2 10.5%10 9/1 10.0%11 10/1 9.1%
Odds Ready Reckoner
Example: Decimal odds of 3.10 are equivalent to 2.1/1(written as 21/10 in fractional odds).
decimal odds (3.10) - 1 = fractional odds (2.1/1 or 21/10)
Fractional odds to decimal odds:
(21 ÷ 10) + 1 = 3.1
Now you can convert this to the implied probability:
1 (100%) ÷ 3.1 = 0.3226 (32.26%)
How much will I win?
If you put £10.00 on odds of 8/13 (1.62), you would get£16.20 back including your stake, so a £6.20 profit.
If you put £1.00 on odds of 15/2 (8.5), you would get£8.50 back, so a £7.50 profit.
Staking Strategy
The Odds Ready Reckoner is ideal as a simple butuseful staking tool. If you want to win £100.00 fromeach bet you place, then all you need to do is place thepercentage equivalent. E.G. If a team is 3/1 to win, youplace £25.00 (as the odds represent 25%) and you willget £100.00 back. This is a better way to use yourbetting money as the amount you are risking isproportional to the chance of winning.

Average Odds
The average odds from various bookmakersWorldwide.
Expected/Predicted Goals
A team’s estimated goals that it should score in thegiven game on average.
Implied Odds
An assumed chance, written as odds, that an event hasof happening.
Mean Average
The mean average is the average which we use in basicmaths. It is calculated by dividing the total number ofsomething by how many events. For example, ifChelsea had conceded 1, 0, 0, 1, 1 and 2 goals in theirlast six games, the average goals they have concededis 0.83.
5 (the total goals) divided by 6 (the number ofmatches).
Poisson Distribution
A statistical model that uses the mean to calculate thechance of absolute numbers. For example, ifManchester United’s average goals per game is 2.08(their mean average), then the Poisson formula willcalculate the chance of them scoring 0, 1, 2 and so on.
True Odds/Chance
These are the odds that do not have a bookmaker’smargin applied. After the bookmakers haveincorporated their profit margin into the odds, theyare lower than what the true chance reflects.
Glossary