wef residuals and biosolids conference 2017 piloting to establish performance criteria ... ·...
TRANSCRIPT

Piloting to Establish Performance Criteria at Miami’s South District WWTP Terry Goss1; Brian, Stitt1; Manuel Moncholi2; Mohammad Abu-Orf3; Ismael Diaz4
1AECOM Water, 2Miami-Dade Water and Sewer Department, 3Formally AECOM Water, 4Gannett Fleming ABSTRACT A six-month centrifuge thickening, digestion and centrifuge dewatering pilot study was conducted at Miami-Dade’s South District Wastewater Treatment Plant (SDWWTP). The pilot study was set up to simulate future thickening, digestion and dewatering operating conditions to establish future thickening and dewatering performance criteria. Full scale piloting was conducted in three phases. Phase 1 operation, focusing on thickening performance began in November 2015. The testing showed that the centrifuge could reliably produce thickened solids at 5-6% total solids (TS) and achieve greater than 95% solids recovery. Testing was conducted using both dry and emulsion polymers. The dry polymer required 2.5 to 3.5 gram per dry kilogram (g/kg) or 5-7 pound per dry ton (lb/DT) active compared to 0.5-1.5 g/kg (1-3 lb/DT) active emulsion. It was also possible to thicken the sludge to 5-6% TS without the use of polymer but this reduced hydraulic throughput by about 50% to allow solids recoveries to remain above 90%. During Phase 2 operation, which began in December 2015, the sludge feed to the thickening centrifuge was switched to thickened sludge from the gravity concentrators to increase centrifuge solids throughput. The centrifuge thickened sludge was fed to Digester 9 which was isolated to receive only mechanically thickened biosolids at 5-7% TS. The solids content in Digester 9 was increased from approximately 2% to approximately 3.5% TS and the volatile solids reduction (VSR) in Digester 9 averaged 46%. Phase 3 of the pilot operation focused on the centrifuge dewatering of the digested biosolids from Digester 9. Testing was conducted using both dry and emulsion polymers with multiple polymer injection points. The testing showed that 16-18% TS cake could be achieved with 10 to 15 g/kg (20-30 lb/DT) active dry polymer. The pilot testing showed that the dewatered cake solids was lower than the preliminary design value of 20% TS with a presumed 12.5 g/kg (25 lb/DT) active dry polymer dose. Dryer cake at 20-22% TS could be produced using emulsion polymer but required higher active polymer dosages above 20 g/kg (40 lb/DT). KEYWORDS Biosolids, Thickening, Dewatering, Anaerobic Digestion, Centrifuges, Pilot Testing INTRODUCTION As part of the Consent Decree Project for Miami Dade’s South District Wastewater Treatment Plant (SDWWTP), the Program Management and Construction Management (PMCM) team conducted pilot testing of centrifuge thickening prior to anaerobic digestion and centrifuge dewatering post anaerobic digestion. The pilot dewatering testing used digested biosolids from the digester receiving only mechanically thickened biosolids at high solids input concentration after steady state operation was achieved. The pilot testing established performance criteria to be used for the design build documents and associated process performance guarantee.
613Copyright© 2017 by the Water Environment Federation
WEF Residuals and Biosolids Conference 2017

SDWWTP is located in the southeastern portion of Miami-Dade County and serves the southern and southwestern portion of the county. The SDWWTP is a high purity activated sludge secondary treatment facility with a permitted capacity of 112.5 million gallons per day (mgd) or 17,740 cubic meters per hour (m3/h). SDWWTP produces only waste activated sludge (WAS) and wasting is controlled using a modulating valve and flow meter that is tapped off the return activated sludge pumps. The WAS is mixed with polymer in the piping and sent to four 55 feet (16.8 meter) diameter gravity thickeners with a 13 feet (4.0 meter) side-water depth. The gravity thickeners thicken the solids to 2-3% total solids (TS) before being stabilized in twelve 105 feet (32 meter) diameter anaerobic digesters each with a nominal operating volume of 1.5 million gallons (5,700 cubic meters). The digesters are arranged in three clusters of four digesters per cluster, where two digesters per cluster operate as primary digesters and two operate as secondary digesters. Digester Cluster 3 normally operates with two of the digesters acting as sludge storage tanks before dewatering. Digester 9 is located in Cluster 3 and acts as a primary digester that discharges to Digester 10 which acts as a secondary digester. The digested biosolids are further dewatered using four (4) Alfa Laval PM 75000 centrifuges which achieve 18-22% TS. The sludge fed to the centrifuges is currently conditioned using a dry polymer type system. SDWWTP is replacing the existing gravity thickeners with new centrifuge thickeners which are expected to improve the performance and increase the capacity in the existing digestion complex. The existing dewatering centrifuges are also near the end of their useful service life and the design includes replacing the system with a new centrifuge dewatering complex. PILOT STUDY OVERVIEW AND OBJECTIVES To better establish performance criteria for the new thickening and dewatering centrifuges, a six-month centrifuge thickening, digestion and centrifuge dewatering pilot study was conducted at Miami-Dade’s SDWWTP. The pilot study was set up to simulate future thickening, digestion and dewatering operating conditions to establish thickening and dewatering performance criteria. Figure 1 shows a plan view layout of the site and identifies the locations for the centrifuge thickening and dewatering pilot trailers. Figure 2 provides photos of the pilot testing trailers provided by Centrisys which were selected after a competitive bidding process. The PMCM team oversaw the piloting effort with outstanding support from the SDWWTP staff. Periodic samples collected throughout the pilot operation were all analyzed for TS. During Phase 2 and Phase 3, the PMCM team regularly monitored the volatile solids (VS) content of the thickened sludge fed to the digester and digested biosolids samples. Digested biosolids pH was also measured. The centrate samples were also analyzed for total suspended solids (TSS). College interns were trained to perform the sampling and laboratory analysis throughout the duration of pilot testing period. The pilot operation began in November 2015, and was conducted in three distinct Phases as outlined in Table 1.
614Copyright© 2017 by the Water Environment Federation
WEF Residuals and Biosolids Conference 2017

Figure 1: Site Plan Showing Centrifuge Installation, Overall (top), Zoomed In (bottom)
615Copyright© 2017 by the Water Environment Federation
WEF Residuals and Biosolids Conference 2017

Figure 2: Photos of Pilot Equipment, Thickening (left), Dewatering (right)
Table 1: Summary of Pilot Testing Phases
Pilot Phase Objective Duration Sample measurements
Phase 1: Thickening pilot operating with unthickened waste activated sludge (WAS)
Determine centrifuge WAS thickening performance criteria
4 weeks TS – all TSS - centrate
Phase 2: Thickening pilot operating with gravity thickened WAS
Simulate high rate anaerobic digestion to monitor performance and prepare sludge for Phase 3
5 months TS – all VS/TS – digester feed & digested biosolids pH – digested biosolids
Phase 3: Dewatering pilot operating with anaerobically digested biosolids following Phase 2 Thickening
Determine centrifuge dewatering performance criteria with centrifuge thickened anaerobically digested WAS
4 weeks TS – all TSS - centrate
PHASE 1: THICKENING PILOT TESTING Phase 1 piloting operation was based on feeding unthickened WAS to the pilot thickening centrifuge. The purpose of Phase 1 operation was to determine the optimum polymer design conditions and performance of the centrifuge thickening. The overall target for the centrifuge thickening performance, as stated in the basis of design and specifications, was to thicken the WAS to 5.5% TS while maintaining greater than 95% solids recovery. Determining the necessary polymer dose to achieve this performance is also important. Parameters that were adjusted for the centrifuge thickening included the pool depth, bowl speed and differential scroll speed.
Thickening Pilot Testing - No Polymer Operation
The system initially started up on lower sludge flows with no polymer injection. Figure 3 summarizes the operation without polymer for a medium bowl speed equal to 2,590 revolutions
616Copyright© 2017 by the Water Environment Federation
WEF Residuals and Biosolids Conference 2017

per minute (RPM) and differential speed of 12 RPM with flow rates ranging from 40 to 100 gallons per minute (gpm) or 151 to 379 liters per minute (L/min). This operation showed that it was possible to thicken the sludge up to 6% TS without the use of polymer, but at higher throughputs (above 60 gpm or 227 L/min), the solids recovery was sacrificed. The tests were conducted at a deep pool depth, a medium pool depth and a shallow pool depth. The trend shows that at the shallowest pool depth solids recovery improved but total thickened solids was sacrificed. The thickened solids concentration at the deepest and medium pool depths were nearly the same but it should be noted that the feed solid content was lower when testing the deepest pool depth (0.9% TS) while the feed solids were closer to 1.4% solids when testing the medium pool depth. If testing was done on the same feed solids concentration, it would be expected that the solids would be thicker at the deepest pool depth. Results of the testing without polymer indicated that it is possible to maintain the desired thickened TS concentrations without the use of polymer. Although the operation without polymer may sacrifice solids recovery, future operation at this condition may be desired when sludge production is below design capacity as it could reduce operation and maintenance costs associated with polymer consumption.
Figure 3: No Polymer Operation, Medium Bowl Speed (2,590 RPM)
617Copyright© 2017 by the Water Environment Federation
WEF Residuals and Biosolids Conference 2017

Thickening Pilot Testing – Emulsion Polymer Setup and Initial Testing
The pilot unit was set up to allow injection of polymer at two locations as illustrated in Figure 4; either directly into the bowl of the unit (internal injection) or in the sludge feed line upstream of the centrifuge inlet (external injection). Polymer flow was measured during each sampling event using a calibration column located on the pilot trailer.
The initial polymer used was PRAESTOL® K144-L which is a cationic, high molecular weight emulsion polymer. Polymer dosage, using internal injection, was slowly increased at a constant throughput of 100 gpm (379 L/min) while visually monitoring the clarity of the centrate. The testing was conducted at the shallowest pool depth and a differential speed of 12 RPM. Once polymer was added, the bowl speeds were reduced from 2,590 RPM to between 1,900 to 2,100 RPM to keep the thickened solids from being too thick. The results showed that with the increased polymer dosages and reduction in bowl speed, the thickened solid content remained steady but the solids recovery improved. Once relatively clear centrate was achieved, the flowrate to the machine was increased to maximize throughput while optimizing solids recovery (based on visual observations of centrate quality). In addition, other cationic, high molecular weight emulsion polymers were tested in the machine. Optimization testing showed that the PRAESTOL K144L polymer worked the best.
Figure 4: Thickening Polymer Injection Point
Thickening Pilot Testing – Dry Polymer Setup
The Centrisys thickening unit contains an emulsion polymer system and is not set up with the provisions to operate on dry polymer so a creative solution was required to facilitate testing dry polymer in the pilot Centrifuge. In order to allow the testing, one of SDWWTP polymer make up systems, which was not currently in use, was used to make up the dry polymer solution which was pumped to a tote that was connected to a dedicated portable pump to meter the dry polymer
Internal Polymer Injection Point
External Polymer Injection Point
618Copyright© 2017 by the Water Environment Federation
WEF Residuals and Biosolids Conference 2017

solution into the centrifuge. Photos of set up are provided in Figure 5. The pump on the trailer used for emulsion polymer was too small to pump the dry polymer solution.
Figure 5: Temporary Dry Polymer Set Up
A calibration curve was developed for the polymer pump by a series of bucket tests conducted at different pump speeds and the curve was compared to the theoretical zero psi pump curve showing good convergence. The dry polymer used for testing was Polydyne C-3283 which is the polymer the plant currently uses in their dewatering centrifuges.
Thickening Pilot Testing – Results Pilot tests were run to further determine results for the centrifuge thickening operation. The results from the optimization trials showed that good performance could be achieved with medium bowl speeds of 2,400 to 2,600 RPM. At a lower flow rate of 100 gpm (379 L/min), an emulsion polymer dose of 1 pound per dry ton (lb/DT) or 0.5 grams per dry kilogram (g/kg) showed good results but as the flow was increased to 150 gpm (568 L/min), at least 2 lb/DT (1 g/kg) was needed. The higher polymer dose requirements at higher flows also correlated to the point where external polymer injection provided better results than internal polymer injection. The polymer curves and flow curves conducted during the performance testing period was to further test the limits for the operational parameters. Additional performance testing was conducted in March of 2016 using the plants dry polymer, which is Polydyne C-3283. The purpose was to repeat the November testing but with the dry polymer that more closely represents future operation. Thickening Pilot Testing – Polymer Curve Results Polymer curve tests were conducted by maintaining a constant volumetric throughput of sludge feed to the centrifuge but changing the polymer dose to measure the impact. With the exception of changing polymer dose, all other parameters on the centrifuge remained the same for each polymer curve test. In November 2015, three different polymer curves were generated for the 144-L emulsion polymer at 100 gpm (379 L/min), 150 gpm (568 L/min) and 170 gpm (644 L/min) WAS flow rates through the pilot centrifuge. In March 2016, an additional 144-L
619Copyright© 2017 by the Water Environment Federation
WEF Residuals and Biosolids Conference 2017

emulsion polymer curve was conducted at 130 gpm (492 L/min) and several dry polymer curves were conducted at 130, 150 and 170 gpm (492, 568, and 644 L/min). Figure 6 also shows the data for emulsion polymer curves at the 130 gpm (492 L/min) and 150 gpm (568 L/min) WAS feed, conducted at medium bowl speed (2,400 – 2,600 RPM). At 130 gpm (492 L/min) WAS feed, the curve was conducted with internal polymer injection and at 150 gpm (568 L/min) WAS feed, the curve was conducted with external polymer injection. The concentration of the WAS during this testing ranged from 1.1% to 1.5% TS.
Figure 6: Emulsion Polymer - 130 & 150 gpm WAS feed, Medium Bowl Speed
As shown in Figure 6, at 130 gpm (492 L/min) WAS feed with internal emulsion polymer injection and a deep pool depth, good performance is obtained for polymer doses greater than 1 lb/DT (0.5 g/kg) active achieving close to 6% TS. At polymer doses greater than 1 lb/DT (0.5 g/kg) active, close to 100% solids recovery was also achieved. Exceeding 1.0 lb/DT or 0.5 g/kg (up to 1.6 lb/DT or 0.8 g/kg active) did not have much of an impact on the solids concentration or the solids recovery.
620Copyright© 2017 by the Water Environment Federation
WEF Residuals and Biosolids Conference 2017

At 150 gpm (568 L/min) WAS feed with external emulsion polymer injection and a shallow pool depth, greater than 5% TS was achieved for all polymer doses tested. The solids recovery exceeded 95% for the two highest dosing points when active dosing was greater than 2.3 lb/DT (1.2 g/kg). The dry polymer curve for the WAS flow rate of 130 gpm (492 L/min) with both internal and external dry polymer injection is shown in Figure 7 for a medium bowl speed of 2,586 RPM and deep pool depth. The polymer concentration during these tests was approximately 0.8% TS. An additional 130 gpm (492 L/min) WAS polymer curve, also shown in Figure 7, used a 0.4% TS polymer solution (with internal dry polymer injection) at a bowl speed of 2,408 RPM and deep pool depth. For all tests, the feed averaged 1.2 to 1.4% TS.
Figure 7: Dry Polymer - 130 gpm WAS Feed, Internal and External Injection, Medium
Bowl Speed
For internal dry polymer injection with a 0.8% TS polymer solution, greater than 5.5 % TS was achieved for all polymer doses tested, however, only greater than 95% recovery was achieved at polymer doses greater than 5 lb/DT (2.5 g/kg). For external dry polymer injection with a 0.8% TS polymer solution, the active polymer dose ranging from 4.3 to 6.7 lb/DT (2.2 to 3.4 g/kg) did not show significant differences in centrifuge performance in terms of solids content. The thickened solids content ranged from 6.5 to 6.6 % TS and the solids recoveries were greater than 95% for all samples. The TSS sample analyzed for 4.3 lb/DT (2.4 g/kg) may also have had an error and it was noted that the centrate was visually dirtier than the samples with high polymer dosages. For internal dry polymer injection with a 0.4% polymer solution, greater than 5.5 % TS
621Copyright© 2017 by the Water Environment Federation
WEF Residuals and Biosolids Conference 2017

was achieved for all polymer doses tested and at polymer doses greater than 3.8 lb/DT (1.9 g/kg), the solids recovery was near the 95% target. The thickening pilot results show that at 130 gpm (492 L/min) WAS feed, approximately 5 lb/DT (2.5 g/kg) of the dry polymer is required to maintain greater than 95% recovery but at the settings tested, the thickened sludge exceeds the needed solids content and approaches 7% TS. Further optimization would be required to maintain the target of 5.5% TS such as lowering the pool depth. The dry polymer curves for the WAS flow rate of 150 gpm (568 L/min) with both internal and external dry polymer injection is shown in Figure 8 for a medium bowl speed of approximately 2,585 RPM and deep pool depth. The polymer concentration during these tests ranged between 0.7 to 0.8% TS. For all tests, the feed averaged 1.2 to 1.3% TS.
Figure 8: Dry Polymer - 150 gpm, Internal and External Injection, Medium Bowl Speed
For internal dry polymer injection, greater than 5% TS was achieved for all polymer doses tested, however, none of the points achieved greater than 95% recovery. Flocs were observed in the centrate for the external polymer injection testing so it was evident that this flow was too high for the internal polymer injection to work efficiently. For external injection, greater than 6% TS was achieved for all polymer doses tested. The solids recovery, however, was only greater than 95% for the highest active polymer dose which was 5.3 lb/DT (2.7 g/kg). It may have been possible to get more optimal performance (closer to 5.5 % TS with greater than 95% solids recovery) with a shallower pool depth.
622Copyright© 2017 by the Water Environment Federation
WEF Residuals and Biosolids Conference 2017

Thickening Pilot Testing - Extended Operation Results
After generating the polymer, flow and bowl speed curves, the unit was operated several days at a constant flowrate with optimized settings to test the stability of operation throughout the course of a day. During November 2015, these tests were conducted using the 144-L emulsion polymer at a WAS flow rate of 135 gpm (511 L/min), 165 gpm (625 L/min) and 200 gpm (757). In March 2016, the extended operation testing with dry polymer was repeated twice at 135 gpm (511 L/min). Samples were collected during these trials approximately once every hour. The results with emulsion polymer were stable throughout the course of a run but the results with the dry polymer showed more fluctuation with solid recovery degradation over time (see Figure 9). It was planned to again repeat the 135 gpm (511 L/min) extended operation testing using the dry polymer, however, the gearbox on the progressing cavity thickened sludge pump failed before this testing was completed. Due to the lead time to repair, it was not possible to conduct the additional testing in the schedule for the project. It is believed that limitations in the set-up and lack of mixing on the polymer tote contributed to the poor performance for the extended operation testing with dry polymer. The concentration of polymer samples collected throughout the extended run varied between 20 to 40% on both days tested. A comparison of the extended operation at 135 gpm (511 L/min) with emulsion and dry polymer is depicted in Figure 9. The runs with dry polymer at 4-7 lb/DT (2-3.5 g/kg) active polymer dosages were conducted with a deeper pool depth than the run with emulsion polymer conducted at 2-3 lb/DT (1-1.5 g/kg) active polymer dosages. The deeper pool depth is likely the reason the solid content was higher with the dry polymer testing than the emulsion polymer testing. The feed WAS concentration during all three runs ranged from 1.1 to 1.5% TS.
Figure 9: Extended Thickening Operation at 135 gpm
623Copyright© 2017 by the Water Environment Federation
WEF Residuals and Biosolids Conference 2017

The thickening pilot testing showed that the centrifuge could reliably produce solids at 5-6% TS and achieve greater than 95% solids recovery. Testing was conducted using both dry and emulsion polymers. The dry polymer required 5-7 lb/DT (2.5-3.5 g/kg) active dosing compared to 1-3 lb/DT (0.5-1.5 g/kg) active based on the emulsion. It was also possible to thicken the sludge to 5-6% TS without the use of polymer but this reduced hydraulic throughput by about 50% to allow solids recoveries to remain above 90%. PHASE 2 – CONTINUOUS THICKENING PILOT OPERATION During Phase 2 operation, mechanically thickened sludge was fed to Digester 9 to simulate future high rate digestion conditions and to increase the solids content of the digested biosolids for the Phase 3 dewatering pilot operations. The feed to the thickening pilot was switched to gravity thickened sludge to increase solids loading through the thickener to increase the turnover rate in Digester 9. This mode of operation started in December 2015, continued through March 2016, and remained running in parallel with the dewatering piloting conducted in Phase 3. During Phase 2 operation, the thickening centrifuge was fed approximately 100 to 150 gpm (379 to 568 L/min) of sludge from the gravity concentrator and operated continuously. Figure 10 summarizes the centrifuge performance during the Phase 2 operation. On March 21, 2016 the feed was switched back to the unthickened WAS when the additional thickening testing using dry polymer was conducted. During Phase 2 operation, the feed from the gravity concentrators averaged 2.2% TS but ranged between 1.5 to 3% TS. The concentration in the gravity concentrator measured by the pilot staff compared closely with the concentration based on the plant records. The thickened solids content averaged 6.2% TS but fluctuated between 5 to 7% TS. During the Phase 1 operation, it was found that the hydraulic pressures inside the machine would increase overtime, likely due to grit building up in the machine, and would shut down on an alarm if pressures reached too high of a level. In order to mitigate this, the machine was operated at a lower speed with higher polymer doses for most of the Phase 2 operation which allowed for the unit to operate continuously. Weekly cleaning and routine maintenance was conducted throughout operation. Throughout Phase 2 operation, the solids content in Digester 9 was increased to approximately 3.5% TS. In comparison during this period, the other operational digesters operated at 1.5 to 2% TS as shown in Figure 11.
624Copyright© 2017 by the Water Environment Federation
WEF Residuals and Biosolids Conference 2017

Figure 10: Phase 2 Continuous Thickening Operation
Figure 11: Digester Concentration Comparison, Digester 9 vs. Plant Records
625Copyright© 2017 by the Water Environment Federation
WEF Residuals and Biosolids Conference 2017

During the Phase 2 operation period, Digester 9 averaged approximately 46% volatile solids reduction (VSR) with raw undigested sludge averaging 87% VS/TS and digested biosolids averaging 77% VS/TS. Gas production averaged 16 ft3/lb VSR (1 m3/kg VSR) throughout the four months of operation. The Solids Retention Time (SRT) in the digesters averaged a little more than 30 days and solids loading rate (SLR) averaged 0.11 lb VS/ft3-d (1.8 kg VS/m3). When comparing the pilot data to the plant’s other digesters, the volatile solids feed matched the plant records but the digester SRT was shorter at approximately 20 days and digested biosolids volatile solids content was slightly lower with the plants VSR during this period averaging approximately 42%. Thus, it appears that operating digestion with longer SRT and higher thickened sludge increased the VSR by about four percentage points, reducing the biosolids for downstream dewatering and beneficial use. It was desired to have Digester 9 at a new steady state before starting the dewatering piloting, so dewatering was targeted to start after approximately 3 digester SRT’s have been achieved. Figure 12 confirms that the dewatering performance testing was conducted after three digester turnovers were achieved in Digester 9. The data in Figure 11 showed that the concentration in Digester 9 reached a consistent value of approximately 3.5% TS by March 2016.
Figure 12: Digester 9 Turnover Progress during Phase 2 Operation
PHASE 3 – DEWATERING PILOT TESTING The purpose of Phase 3 operation was to determine the optimal design conditions and performance of the dewatering centrifuge using the thickened biosolids fed from Digester 9. The overall target for the centrifuge dewatering performance as stated in the basis of design and
626Copyright© 2017 by the Water Environment Federation
WEF Residuals and Biosolids Conference 2017

specifications was to dewater the thickened digested biosolids to 20% TS while maintaining greater than 95% solids recovery. The necessary polymer dose to achieve this performance is also important to determine. The draft specifications indicate that active polymer dose should be less than 25 lb/DT. Textbook values for anaerobically digested WAS only biosolids are not readily available as most anaerobic digesters in industry digest WAS blended with primary sludge. Metcalf and Eddy 5th edition lists 16 to 25% TS expected for untreated WAS and lists 22 to 25% TS expected for anaerobically digested combined WAS and primary. For both untreated WAS and anaerobically digested WAS and primary, the polymer consumption is expected to be 15 to 30 lb/DT (7.5 to 15 g/kg) active and solids recoveries are expected to be 95% or greater (M&E 5th edition, 2014). Dewatering Pilot Testing – Emulsion Polymer Initial Testing
The initial testing started with emulsion polymers on March 2, 2016. Five cationic, high molecular weight emulsion polymers were tested in order to select the most effective two polymer types for further testing. The emulsion polymers were able to achieve 22 to 25% TS. Based on visual observation of cake dryness and centrate quality, Centrisys proceeded with purchasing more of the two candidate emulsion polymers (PRAESTOL 274 FLX and 290 FLX emulsion polymers). Dewatering Pilot Testing – Dry Polymer Setup The centrifuge trailer has a dry polymer feeding system that was rarely used and required some effort to make it functional. The polymer blending system did not provide adequate mixing of the dry polymer and left unmixed and residual portions of polymer in the tank. The dry polymer feed pump, however, provided suitable control to deliver a dry polymer solution to the centrifuge. SDWWTP also had a dry polymer make up system that was no longer used, however, was functional. Initially, dry polymer solution was metered from the plant’s make-up system directly to the dewatering centrifuge, however, the plant’s polymer pumps could not adequately control the polymer feed for testing. In order to conduct the testing, a hybrid of both systems was used. Polymer solution made up using the plant’s system was pumped into the dry polymer solution hopper on the Centrisys pilot dewatering centrifuge. The Centrisys pump was then used to meter the polymer to the centrifuge. The dry polymer used for the dewatering testing was Polydyne C-3283 which is currently used for the SDWWTP dewatering centrifuges. Dewatering Pilot Testing – Polymer Injection Location Optimization Polymer injection location in the biosolids is important in getting proper biosolids flocculation for the desired dewatering. Several injection locations were tested using the plant’s dry polymer. A mixed injection system, which included dosing a portion of the polymer in a static mixer in the interconnecting hose and the rest of the polymer injected at the grinder on the pilot trailer, was initially found to be the best method for polymer injection based on visual observations of the centrate clarity. However, later testing found that injecting polymer directly into the feed tube of the centrifuge provided better centrate quality. The first few weeks of testing were based primarily on the mixed polymer injection and the later testing was conducted using primarily the feed tube injection point.
627Copyright© 2017 by the Water Environment Federation
WEF Residuals and Biosolids Conference 2017

Dewatering Pilot Testing – Polymer Curve Results
Polymer curve tests were conducted by maintaining a constant volumetric throughput of digested biosolids feed to the centrifuge but changing the polymer dose to measure the impact. With the exception of changing polymer dose, most of the other parameters on the centrifuge remained the same for each polymer curve test. During some of the tests, however, the differential speed was adjusted to increase cake solids while still trying to maintain good quality centrate based on visual observations. Testing showed that reducing the differential speed would increase cake solids but could sacrifice centrate quality and solids recovery. Polymer curve tests were conducted using both emulsion and dry polymer with both mixed and feed tube polymer injection. All of the dry polymer curves conducted on thickened biosolids from Digester 9 are presented in Figure 13 and the data depicts the injection point and polymer concentration.
Figure 13: Compiled Dry Polymer Curves from Digester 91
1 “mix” represents “mixed polymer injection and “FT” represent “feed tube polymer injection”
628Copyright© 2017 by the Water Environment Federation
WEF Residuals and Biosolids Conference 2017
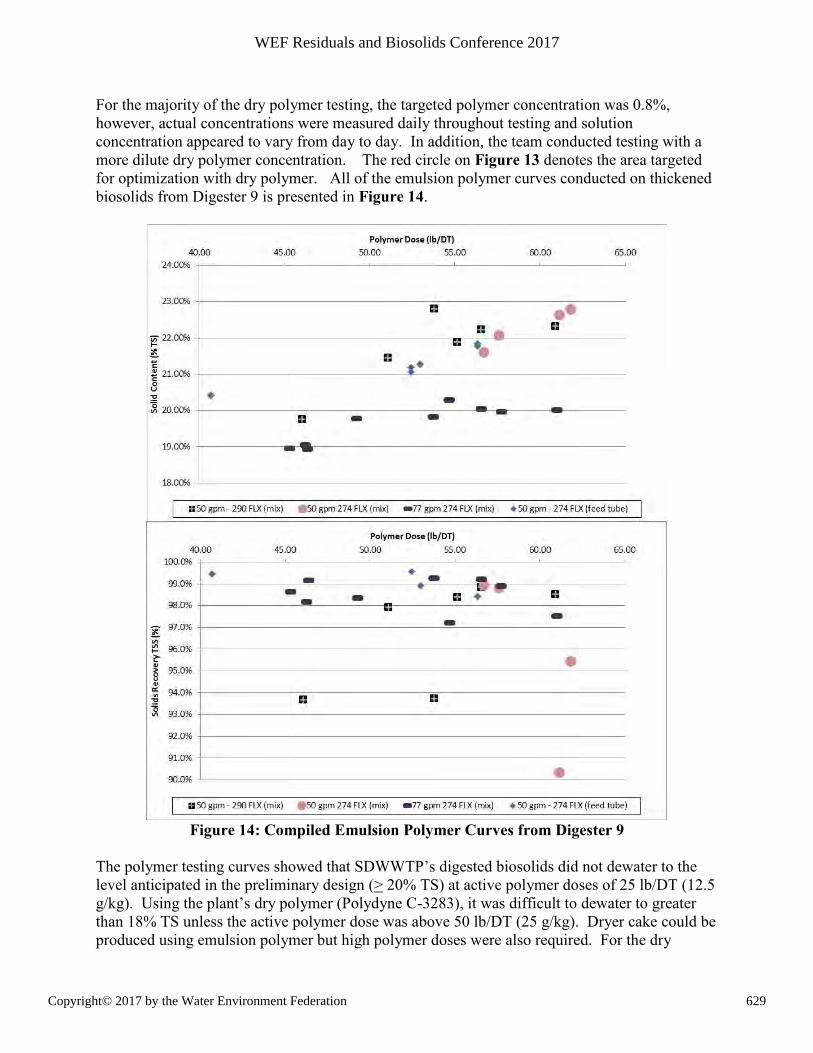
For the majority of the dry polymer testing, the targeted polymer concentration was 0.8%, however, actual concentrations were measured daily throughout testing and solution concentration appeared to vary from day to day. In addition, the team conducted testing with a more dilute dry polymer concentration. The red circle on Figure 13 denotes the area targeted for optimization with dry polymer. All of the emulsion polymer curves conducted on thickened biosolids from Digester 9 is presented in Figure 14.
Figure 14: Compiled Emulsion Polymer Curves from Digester 9
The polymer testing curves showed that SDWWTP’s digested biosolids did not dewater to the level anticipated in the preliminary design (> 20% TS) at active polymer doses of 25 lb/DT (12.5 g/kg). Using the plant’s dry polymer (Polydyne C-3283), it was difficult to dewater to greater than 18% TS unless the active polymer dose was above 50 lb/DT (25 g/kg). Dryer cake could be produced using emulsion polymer but high polymer doses were also required. For the dry
629Copyright© 2017 by the Water Environment Federation
WEF Residuals and Biosolids Conference 2017

polymer, using feed tube injection verses the external or mixed injection allowed for lower polymer doses while still maintaining recoveries above 95%.
Dewatering Pilot Testing - Extended Operation Results
In addition to polymer curve tests, the dewatering centrifuge was operated several days at a constant flowrate to test the stability of operation throughout the course of a day. Three tests were conducted at 50 gpm (189 L/min), two with dry polymer and one with 274-FLX emulsion polymer. Two tests were also conducted at 75 gpm (284 L/min), one with dry polymer and one with 274-FLX emulsion polymer. The extended runs using dry polymer are shown in Figure 15. The data showed stable performance with high recoveries (>98%) for lower active polymer doses of 19 to 23 lb/DT (9.5 to 11.5 g/kg) as compared to results from the polymer curve testing. The dewatered cake solids during the extended operation tests averaged 17 to 17.5% TS at 50 gpm (189 L/min) feed flow with 19 to 22 lb/DT (9.5 to 11 g/kg) active polymer dose. At 75 gpm (284 L/min) with an active polymer dose of 23 lb/DT (11.5 g/kg), the dewatered cake solids averaged 16 to 16.5% TS.
Figure 15: Extended Operation using Dry Polymer
The extended runs using emulsion 274 FLX polymer are shown in Figure 16. The data showed stable performance with high recoveries (>96%) for active polymer doses of 37 to 44 lb/DT (18.5 to 22 g/kg). The dewatered cake solids during this tests averages 20.5 to 21% TS at 50 gpm (189 L/min) feed flow with 44 lb/DT (22 g/kg) active polymer dose. At 75 gpm (284 L/min) with an active polymer dose of 37 lb/DT (18.5 g/kg), the dewatered cake solids averaged 19.3 to 19.6% TS.
630Copyright© 2017 by the Water Environment Federation
WEF Residuals and Biosolids Conference 2017

Figure 16: Extended Operation using Emulsion Polymer
The Phase 3 dewatering testing showed that 16-18% TS cake could be achieved with 20-30 lb/DT (10 to 15 g/kg) active dosing of dry polymer. The pilot testing showed that the dewatered cake solids were lower than the preliminary design value of 20% TS with a presumed 25 lb/DT (12.5 g/kg) active polymer when using dry polymer. Dryer cake at 20-22% TS could be produced using emulsion polymer but required higher dosages above 40 lb/DT active (20 g/kg).
CONCLUSIONS The Phase 1 thickening testing showed that the centrifuge could reliably produce solids at 5-6% TS and achieve greater than 95% solids recovery. Testing was conducted using both dry and emulsion polymers. The dry polymer required 5 to 7 lb/DT (2.5 to 3.5 g/kg) active dosing compared to 1 to 3 lb/DT (0.5 to 1.5 g/kg) based on the emulsion. It was also possible to thicken the sludge to 5 to 6% TS without the use of polymer but this reduced hydraulic throughput by about 50% to allow solids recovery to remain above 90%. During Phase 2, the solids content in Digester 9 was increased from approximately 2% to approximately 3.4 to 3.5% TS and the VSR in Digester 9 averaged 46% with a digester SRT of approximately 30 days. During the same period of time, the other digesters at the plant received gravity concentrated sludge at 1.5% to 3% TS and averaged approximately 42% VSR with a digester SRT of approximately 20 days. The increase in VSR was likely due to the longer SRT and higher solids concentration. The Phase 3 dewatering testing showed that 16 to 18% TS cake could be achieved with 20 to 30 lb/DT (10 to 15 g/kg) active dosing of dry polymer. The pilot testing showed that the dewatered cake solids were lower than the preliminary design value of 20% TS with a presumed 25 lb/DT (12.5 g/kg) active polymer when using dry polymer. Dryer cake at 20 to 22% TS could be produced using emulsion polymer but required higher dosages above 40 lb/DT (20 g/kg) active. The pilot dewatering results highlight the importance of piloting to refine design performance criteria.
631Copyright© 2017 by the Water Environment Federation
WEF Residuals and Biosolids Conference 2017

ACKNOWLEDGEMENTS The team would like to thank all of the plant staff at SDWWTP, especially Leo Pou and Mike Garcia for the outstanding support during this pilot testing. The team would also like to thank the staff from Centrisys and CNP for their commitment to making the testing a success. We also thank the interns Andres McEwen, Yareliz Negron, and Kate Ireland who helped make this project possible by monitoring pilot operations, collecting samples and running numerous laboratory tests. REFERENCES S-884 - SDWWTP SLUDGE THICKENING & DEWATERING BLDG CD 1.06, 1.08, Specification Section 46 71 36 – CENTRIFUGES, MWH, January 20, 2016. American Public Health Association, American Water Works Association, Water Environment Federation, “Standard Methods for the Examination of Water and Wastewater” 20th ed., 1999 Metcalf & Eddy. (2014). Wastewater Engineering Treatment and Reuse. 5th Edition.
632Copyright© 2017 by the Water Environment Federation
WEF Residuals and Biosolids Conference 2017