weight cutting: a biomechanical investigation of the
TRANSCRIPT

University of Lethbridge Research Repository
OPUS http://opus.uleth.ca
Theses Arts and Science, Faculty of
2013
Weight cutting a biomechanical
investigation of the effect on martial arts
striking performance
Evans, Jared, Scott
Lethbridge, Alta. University of Lethbridge, Dept. of Kinesiology
http://hdl.handle.net/10133/3569
Downloaded from University of Lethbridge Research Repository, OPUS

WEIGHT CUTTING:A BIOMECHANICAL INVESTIGATION OF THE EFFECT ON MARTIAL
ARTS STRIKING PERFORMANCE
JARED SCOTT EVANSBSc, Exercise Science, University of Lethbridge, 2008
A ThesisSubmitted to the School of Graduate Studies
of the University of Lethbridge in Partial Fulfilment of the
Requirements for the Degree
MASTER OF SCIENCE
Department of Kinesiology University of Lethbridge
LETHBRIDGE, ALBERTA, CANADA
© Jared Evans, 2013

Abstract
Weight cutting is a phenomenon that exists in combative weight-class-based sports. The
goal of this research was to investigate the effect of weight cutting on striking
performance parameters amongst mixed martial arts practitioners. Participants were
tested on common strikes using a method specifically developed for the investigation of
reaction time, power, and accuracy. These tests were performed prior to a self-selected
weight-cut procedure and 24 hours after making weight, with the hypothesis that weight
cutting would exhibit a negative effect on the tested parameters. The findings
demonstrated a negative effect on peripheral reaction time, a positive effect on central
reaction time, and mixed results on power and accuracy. No previous work has been
performed on weight cutting and reaction time or accuracy. Future research should look
to investigate the phenomenon closer to its real sport setting and to further the
investigation of reaction time and accuracy.
iii

Acknowledgements
There are many people who were involved with this study and deserve thanks.
Firstly I would like to thank Lee Mein, owner and operator of the Canadian Mixed
Martial Arts Center, and the athletes involved in local mixed martial arts. Without them,
this research would not be possible.
I wish to express my gratitude to Dr. Gongbing Shan for his mentorship,
expertise, support, patience, and guidance. Without the biomechanics laboratory,
equipment, and his belief in the research this would not have been possible. Also, a
thanks to all the students passing through the biomechanics laboratory who helped with
collection and analysis. A special thanks to my entire committee for their patience and
support.
I would also like to thank Shao-Tsung Chang for his help programming the
analysis software in matlab and helping with the collection. Without this program,
analysis by hand would have been near impossible. Thanks to Dr. Hua Li as well for his
support and patience with me in all things mathematical.
A special thanks to my parents, Dr. R. Scott Evans and Sarah Evans, for their
never-ending love, support, encouragement, editing, and statistical knowledge. When I
felt like giving up, they were there to push me forward.
Another special thanks to Karen Graham for her professional editing services and
patience with my writing. Without her, the final push would have been much harder.
These acknowledgements do not begin to express how thankful I am to this team
and more for helping me complete this project. Without this support network, I could not
have finished. Thank you from the bottom of my heart.
iv
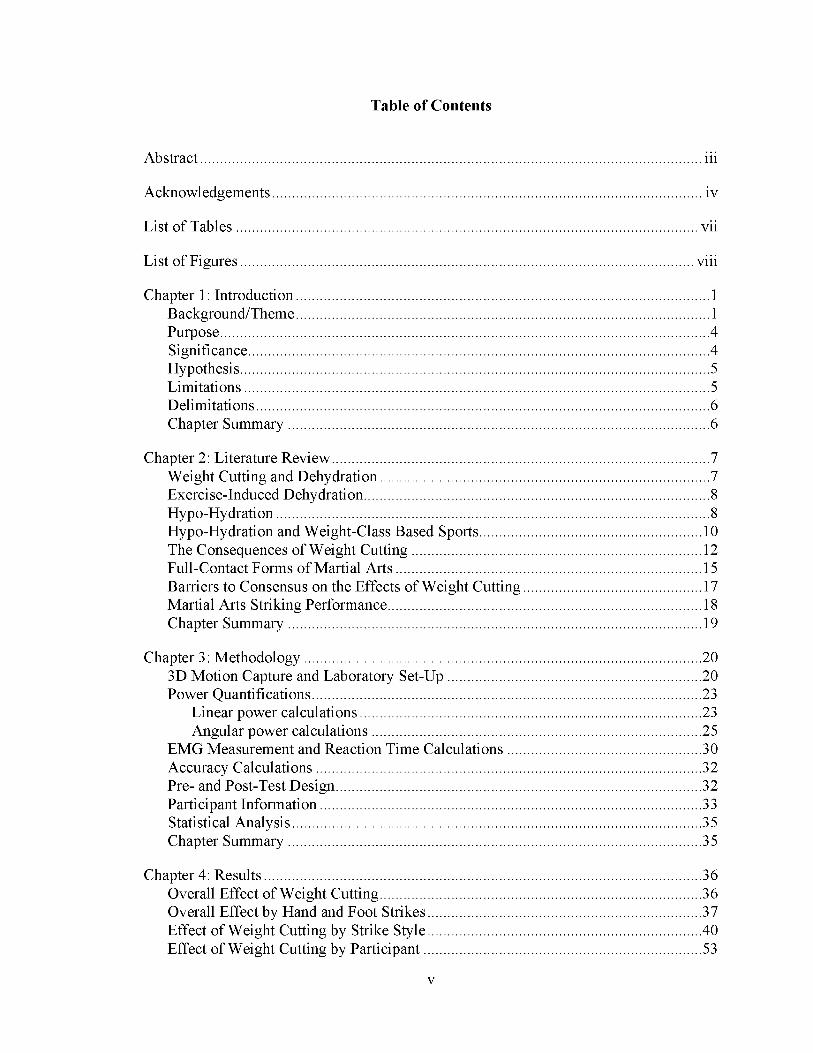
Table of Contents
Abstract ............................................................................................................................. iii
Acknowledgements ........................................................................................................... iv
List of Tables....................................................................................................................vii
List of Figures..................................................................................................................viii
Chapter 1: Introduction........................................................................................................1Background/Theme ........................................................................................................1Purpose.......................................................................................................................... 4Significance................................................................................................................... 4Hypothesis..................................................................................................................... 5Limitations.................................................................................................................... 5Delimitations................................................................................................................. 6Chapter Summary......................................................................................................... 6
Chapter 2: Literature Review.............................................................................................. 7Weight Cutting and Dehydration.................................................................................. 7Exercise-Induced Dehydration...................................................................................... 8Hypo-Hydration............................................................................................................ 8Hypo-Hydration and Weight-Class Based Sports........................................................10The Consequences of Weight Cutting.........................................................................12Full-Contact Forms of Martial Arts.............................................................................15Barriers to Consensus on the Effects of Weight Cutting.............................................17Martial Arts Striking Performance...............................................................................18Chapter Summary........................................................................................................19
Chapter 3: Methodology................................................................................................... 203D Motion Capture and Laboratory Set-Up............................................................... 20Power Quantifications................................................................................................. 23
Linear power calculations..................................................................................... 23Angular power calculations.................................................................................. 25
EMG Measurement and Reaction Time Calculations................................................ 30Accuracy Calculations................................................................................................ 32Pre- and Post-Test Design........................................................................................... 32Participant Information............................................................................................... 33Statistical Analysis...................................................................................................... 35Chapter Summary....................................................................................................... 35
Chapter 4: Results............................................................................................................. 36Overall Effect of Weight Cutting................................................................................ 36Overall Effect by Hand and Foot Strikes.................................................................... 37Effect of Weight Cutting by Strike Style.................................................................... 40Effect of Weight Cutting by Participant..................................................................... 53
v

Chapter 5: Discussion....................................................................................................... 61Pilot Investigation....................................................................................................... 61Overall Trends............................................................................................................ 61Trends by Hand and Foot Strikes................................................................................ 63Trends by Individual Strike........................................................................................ 63
Reaction time components.................................................................................... 63Power components................................................................................................ 64Accuracy............................................................................................................... 64
Trends by Individual Participant................................................................................. 65Conclusion.................................................................................................................. 66Implications for Practitioners...................................................................................... 67Implications for Future Research................................................................................ 68
References......................................................................................................................... 69
Appendix A: Ethics Application Approval....................................................................... 81
Appendix B: Consent Form.............................................................................................. 90
Appendix C: SPSS Statistical Results for Over All Effect............................................... 93
Appendix D: SPSS Tables for Overall Hand and Foot Strikes......................................... 95
Appendix E: Tables by Individual Strike Style................................................................ 99
Appendix F: Tables for Individual Participants...............................................................123
Chapter Summary....................................................................................................... 60
vi

List of Tables
Table 1. Participant Information................................................
Table 2. Results of the Overall Effect of Weight Cutting..........
Table 3. Results of the Overall Effect Isolated by Hand Strikes
Table 4. Results of the Overall Effect Isolated by Foot Strikes..
Table 5. Results of the Left Hooks to the Body N= 7 ...............
Table 6. Results of the Left Hooks to the Head.........................
Table 7. Results of the Left Straights to the Head.....................
Table 8. Results of the Right Hooks to the Body......................
Table 9. Results of the Right Hooks to the Head.......................
Table 10. Results of the Right Straights to the Head.................
Table 11. Results of the Left Kicks to the Head........................
Table 12. Results of the Left Kicks to the Leg..........................
Table 13. Results of the Left Kicks to the Body........................
Table 14. Results of the Right Kicks to the Head......................
Table 15. Results of the Right Kicks to the Leg........................
Table 16. Results of the Right Kicks to the Body......................
Table 17. Results of Participant 1..............................................
Table 18. Results of Participant 2 ..............................................
Table 19. Results of Participant 3 ..............................................
Table 20. Results of Participant 4 ..............................................
Table 21. Results of Participant 5 ..............................................
Table 22. Results of Participant 6 ..............................................
Table 23. Results of Participant 7 ..............................................
34
37
38
39
41
42
43
44
45
46
47
48
49
50
51
52
53
54
55
56
57
58
59
vii
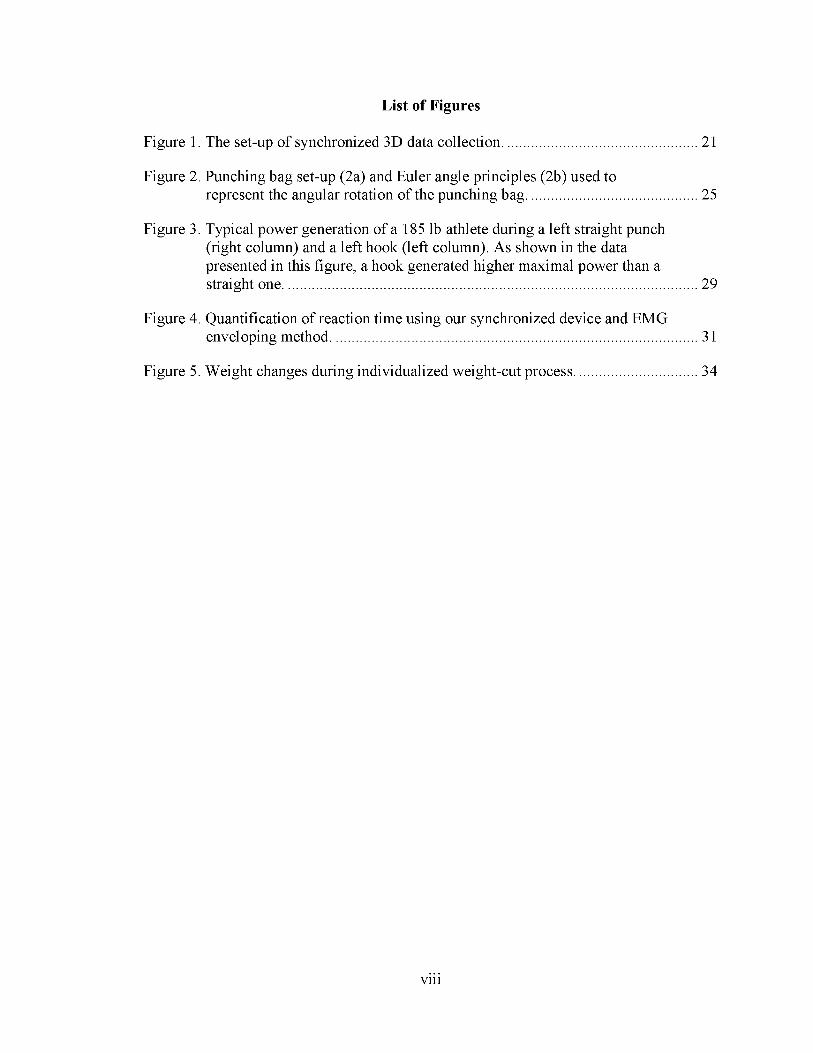
List of Figures
Figure 1. The set-up of synchronized 3D data collection................................................ 21
Figure 2. Punching bag set-up (2a) and Euler angle principles (2b) used torepresent the angular rotation of the punching bag...........................................25
Figure 3. Typical power generation of a 185 lb athlete during a left straight punch (right column) and a left hook (left column). As shown in the data presented in this figure, a hook generated higher maximal power than a straight one.........................................................................................................29
Figure 4. Quantification of reaction time using our synchronized device and EMGenveloping method.............................................................................................31
Figure 5. Weight changes during individualized weight-cut process................................34
viii

Chapter 1: Introduction
My goal for this chapter is to briefly introduce the phenomenon of weight cutting
in sport. I will also present the study purpose, significance, hypothesis, and limitations.
Background/Theme
The sport of mixed martial arts is a free-form, one-on-one combative sport that
has its origins in contests attempting to determine which martial art and/or fighting styles
were superior. Examples of commonly used styles or disciplines include, but are not
limited to, wrestling, boxing, Muay Thai kickboxing, judo, sambo, karate, tae kwon do,
and Brazilian jiu-jitsu. Three main areas of empty-handed combat are generally involved:
striking/stand up, take downs/throws, and grappling. This sport has developed into a full-
contact combat sport with regulations and sanctions, variations of which are becoming
popular all over the world. Athletes have shifted from a focus on singular disciplines and
have developed into a hybrid mixture of various styles or mixed martial arts. Over the
years, the sport of mixed martial arts has become increasingly popular in both
spectatorship and participation (Lenetsky & Harris, 2012; Ngai, Levy, & Hsu, 2008;
Seidenberg, 2011).
The phenomenon of weight cutting, or cycling, is associated with weight class-
based sports where athletes will “choose to reduce their body mass to a weight class
lower than their normal weight” (Horswill, 2009, p. 22). This is an intentional body mass
reduction prior to a competition’s weigh-in and subsequent regain of as much as possible,
if not all, of the mass between the weigh-in and the actual competition. Due to the weight
class-based nature of mixed martial arts competitions and approximate 24-hour time
window between weigh-ins and competition, weight cutting as a practice is deeply
1
embedded in the sport. Athletes who do not make their contracted weight class may be
subject to monetary penalty and/or disqualification. The practice of weight cutting is
sometimes discussed openly prior to and during competitions as well as in deciding
future match ups.
Weight manipulation practices were first mentioned in the 1940s in relation to
wrestling, and they are described as having changed little from that time despite the
increasing knowledge on the negative effects of such weight loss practices. While weight
classes exist to promote fair and matched competition, they also encourage athletes to
compete at lower classes in an attempt to increase the chances of success. As there was
very limited literature across combat sports, researchers noted the need for further
investigations into all areas related to the practice of weight cutting, including: health,
longitudinal effects, growth and maturation, performance, psychology, and general
success as well as safe practices (Brownell & Steen, 1992; Horswill, 2009; Steen &
Brownell, 1990).
Koral and Dosseville (2009) explained the phenomenon of body mass reduction
in weight class-based sports, summarizing,
Most athletes participating in combat sports with specific body mass categories such as wrestling, boxing, and judo can compete in a class 10% below their usual body mass. Thus body mass control may be as important an issue as performance. In sports in which body mass plays a decisive role, the athletes can resort to passive (sauna) and active sweating (through intensive exercise in plastic suits) as well as reducing the amount of food and liquids they consume. Rapid body mass loss (i.e., in 3-4 days) has been reported to be detrimental to performance in terms of power, force, resistance, flexibility, and skilfulness. . . . Moreover, such a procedure may influence cognitive performance and mood negatively. (p. 115)
The limited research across combat sports was not necessarily conclusive,
although Horswill (2009) stated that “short-duration high-intensity performance is less
likely to be affected adversely. If the effort is extended and repeated, i.e., requires an
2

element of endurance, performance deteriorates. For submaximal efforts of longer
duration, performance is clearly impacted in a negative way” (p. 29). This summary
demonstrated the need for more research in general and a move from laboratory-based
physical performance to sport-specific physical performance studies. It also demonstrated
the need to broaden and expand the combative sports studied: an example being that no
studies focused on mixed martial artists.
In the position paper on exercise and fluid replacement for the American College
of Sports Medicine, Sawka et al. (2007) wrote specifically on boxing and wrestling as
examples of weight-based sports at risk for dehydration. They went on to state that
“dehydration greater than 2% body weight degrades aerobic exercise and
cognitive/mental performance in temperate-warm-hot environments” (p. 381).
The act of weight cutting is not just a performance issue; in its extreme cases,
dehydration related to weight cutting may lead to serious medical issues such as heat-
related illnesses and stress on the kidneys (Horswill, 2009; Sawka et al., 2007). In 1997,
three NCAA wrestlers in different states died from complications associated with
dehydration from rapid weight loss procedures (Hoey, 1998; Remick et al., 1998). The
Team USA Olympic wrestling captain was barred from competition at the 2008 Beijing
Olympics given his deteriorated physical state at the weigh in. He claimed he would be
fine at the competition, but physicians barred him from competition (Mihoces, 2008).
There was even one alarming case of a 5-year-old wrestler receiving pressure to drop
weight (Sansone & Sawyer, 2005). Weight cutting is a very real part of combat sports,
and the practice continues today, even in extreme cases, in the presence of modern health
and athletic performance knowledge.
3
Athletes may ignore potential long-term health warnings or threats for a potential
increased chance of success. If weight cutting could be shown to decrease athletic
performance, prowess, or ability, as well as a potential negative health impact, then the
practice might possibly be curtailed.
This lead to the question: What is the influence of a self-selected weight
manipulation regimen on biomechanical parameters of martial arts striking performance
among mixed martial arts practitioners?
Purpose
The aim of this study was to initiate an investigation on the effect of weight
cutting on striking performance within a mixed martial artist population using state-of-
the-art biomechanical equipment. Parameters under exploration include 3D kinematics,
power, accuracy, reaction time, and balance. Also, no restrictions were placed on
subjects’ weight-loss protocols; the athletes were allowed to utilize their preferred
methods and timing strategies of weight reduction and regain. Such an effort preserved
the tested subjects’ normal “style” in a competitive preparation and made the results more
realistic.
Significance
Through this study, as the researcher, I looked to fill a gap where there has been
limited research on weight cutting across combat sports, even less on biomechanical
parameters and/or performance, and no existing literature focused on a mixed martial arts
population. Only one study to date has allowed the athletes to use their own methods of
weight reduction when researcher-imposed methods could be considered the largest
4

barrier to a research consensus (Timpmann, Oopik, Paasuke, Medijainen, & Ereline,
2008).
The research as carried out in the University of Lethbridge Biomechanics Lab in
the Kinesiology Department over a one-year period between May 2009 and December
2011. A portion of the subjects completed the testing around and for an actual
competition event. This became the first application of sport-specific performance-related
weight cutting research to the ongoing real-life phenomenon.
The knowledge gained could be useful in providing insight into the real-life
phenomenon as it is occurring, guiding future weight loss plans, changing the approach to
rapid weight loss, changing athlete’s attitudes towards weight cutting, and possibly even
leading to rule changes that prevent the “need” for dangerous procedures as was done in
the National Collegiate Athletic Association wrestling program (Davis et al., 2002;
Oppliger, Utter, Scott, Dick, & Klossner, 2006; Schnirring, 1998; Utter, 2001).
Hypothesis
A self-selected weight cutting regimen of 5% body weight will negatively affect
the chosen parameters of striking performance (i.e., the reaction would be slowed; the
explosive power generation ability, and the accuracy of punches and/or kicks, would be
reduced).
Limitations
1. It was assumed that the subjects accurately recorded their weight-loss
procedures and weights.
2. It was assumed that both professional and amateur mixed martial artists have a
consistency within their own striking habits and technical approaches.
5

Delimitations
1. Due to the small nature of this athletic population, the sample was limited to
12 male subjects in Southern Alberta of varying ages and weight classes.
Chapter Summary
This chapter presented a brief overview of the phenomenon of weight cutting. The
investigation was also introduced with its purpose, significance, and limitations. In the
next chapter, an in-depth review of appropriate literature will be conducted.
6
Chapter 2: Literature Review
In this chapter, the body of literature regarding intentional dehydration for
competitive purposes will be reviewed. This includes a description of the phenomenon of
weight cutting, why athletic populations are using such practices, and which athletic
populations are engaged in the practice. As well, I will discuss the prevalence and
magnitude of the practice, how the practice is utilized, and the effect of weight cutting on
a variety of physiologic, performance, and health variables. The limitations and barriers
to a consensus of opinion on effect will also be presented. Martial arts striking
performance is briefly summarized as a way of investigating the phenomenon of weight
cutting.
Weight Cutting and Dehydration
Dehydration can be assessed in many ways, and body weight reduction is one
such marker (Shirreffs, 2000). Even though weight cutting can and does involve more
than just water loss, caloric restriction for example, the weight loss is primarily water
weight (Timpmann et al., 2008). Therefore, a self-imposed reduction in body weight is
predominately a form of dehydration that can be exacerbated by caloric restriction and/or
heat exposure.
In relation to sport, exercise, and performance, dehydration can occur in two
forms: exercise-induced dehydration and hypo-hydration. Exercise-induced dehydration
is body weight loss during exercise brought on by sweating as a reaction to the exercise
itself. Hypo-hydration in this case is the situation where athletes intentionally dehydrate
themselves prior to competition or performance (Barr, 1999; Shirreffs, 2009).
7

Exercise-Induced Dehydration
Exercise-induced dehydration has been found to unequivocally affect
performance in a negative manner (American College of Sports Medicine, American
Dietetic Association, and Dietitians of Canada, 2000; Gauchard, Gangloff, Vouriot,
Mallie, & Perrin, 2002; McGregor, Nicholas, Lakomy, & Williams, 1999; Sawka,
Montain, & Latzka, 2001; von Duvillard, Arciero, Tietjen-Smith, & Alford, 2008;
Yoshida, Takanishi, Nakai, Yorimoto, & Morimoto, 2002). The body weight reduction of
approximately 2-3% through dehydration appears to be the threshold for a variety of
functional decrements, including: basketball skills, tennis skills/sprinting, throwing
accuracy, anaerobic strength/power, muscular power and endurance, aerobic endurance,
as well as general decreases in performance capacity (Barr, 1999; Casa et al., 2000;
Coyle, 2004; Devlin, Fraser, Barras, & Hawley, 2001; Dougherty, Baker, Chow, &
Kenney, 2006; Jones, Cleary, Lopez, Zuri, & Lopez, 2008; Magal et al., 2003; Maughan,
2003; Montain, 2008; Murray, 2007; Rodriguez, Di Marco, & Langley, 2009; Sawka et
al., 2007; Shirreffs, 2005, 2009; Walsh, Noakes, Hawley, & Dennis, 1994; “Water
Deprivation and Performance of Athletes,” 1974).
Hypo-Hydration
There is not a clear consensus about hypo-hydration as was found with exercise-
induced dehydration, but the practice has still been found to negatively affect many
aspects of performance. Hypo-hydration was found to negatively affect aerobic
performance (M. Fogelholm, 1994; Sawka et al., 2001), reaction time, balance, and
postural sway (American Academy of Pediatrics Committee on Sports & Fitness, 2005;
Patel, Mihalik, Notebaert, Guskiewicz, & Prentice, 2007). Hypo-hydration has also been
8

found to negatively affect general exercise performance (American Academy of
Pediatrics Committee on Sports & Fitness, 2005; Caldwell, 1987; Paik et al., 2009),
particularly in rowing (G. Slater et al., 2006; G. J. Slater et al., 2005; G. J. Slater et al.,
2006), and more specifically in basketball, rowing, and cycling performance with a 2%
body weight reduction (Baker, Dougherty, Chow, & Kenney, 2007; Burge, Carey, &
Payne, 1993; Walsh et al., 1994).
Intermittent sprint time has also been found to be negatively affected (Maxwell,
Gardner, & Nimmo, 1999) as well as explosive power. It should be noted that although
this particular study of explosive power found that 1-2% body weight reduction affected
women and not men, the researchers postulated that it would with more weight lost
(Gutierrez, Mesa, Ruiz, Chirosa, & Castillo, 2003). Muscular strength and endurance
have also been found to be decreased by hypo-hydration (G. M. Fogelholm, Koskinen,
Laakso, Rankinen, & Ruokonen, 1993), although these decreases have been found to be
far less detrimental to aerobically trained populations as compared with anaerobically
trained populations at a 3% body weight reduction (Caterisano, Camaione, Murphy, &
Gonino, 1988). More recently, hypo-hydration has been found to negatively impact
strength, power, resistance exercise, and high-intensity exercise performance (Judelson,
Maresh, Anderson, et al., 2007; Judelson, Maresh, Farrell, et al., 2007).
However, there was some contradiction about performance decrements within the
literature. Aerobic performance, anaerobic performance, rowing performance, muscular
strength, and endurance were found to recover with at least five hours of adequate
rehydration and re-feeding (G. M. Fogelholm et al., 1993; M. Fogelholm, 1994; G. J.
Slater et al., 2005). More confounding studies that detracted from a consensus included
9

finding that hypo-hydration decreases muscular endurance but not strength (Montain et
al., 1998) and that sprint or vertical jump performance were not impaired (Watson et al.,
2005). Furthermore, in direct contradiction, hypo-hydration has been found to both
increase oxidative stress and DNA damage (Paik et al., 2009), but also to not enhance
muscle damage after resistance exercise (Yamamoto et al., 2008).
Hypo-Hydration and Weight-Class Based Sports
This phenomenon of hypo-hydration or weight cutting has been explored directly
from many research angles in a variety of previously mentioned weight class sports, such
as wrestling, judo, boxing, tae kwon do, and MMA for example. Some of the research
streams included the effect of weight cutting on long-term growth and anthropometrics,
psychological measures, work capacities, metabolism, muscular strength, muscular
endurance, immune function, aerobic power, anaerobic power, physiological parameters
(blood metabolites for example), its relation to winning or success, and even to academic
grades. The bulk of this research has involved wrestling because it has the most common
and longest usage of the phenomenon. The practice received special interest after the
three NCAA deaths referred to in chapter one (Hoey, 1998; Remick et al., 1998). More
recently, judo is becoming more researched.
This intentional and purposeful loss of body weight to compete in a lower weight
class may be achieved through a variety of active or passive methods with the primary
objective of losing water weight, which involves the athlete rapidly reducing body weight
for a competitive weigh in to gain a size, leverage power, and/or strength advantage
(Brownell, Steen, & Wilmore, 1987; Horswill, 1992, 1993, 2009; Oopik et al., 2002;
Oppliger, Case, Horswill, Landry, & Shelter, 1996; Oppliger, Steen, & Scott, 2003;
10

“Water Deprivation and Performance of Athletes,” 1974; Wroble & Moxley, 1998b). As
mentioned, weight cutting exists in weight-class-based combative sports such as
wrestling, boxing, and martial arts such as judo, tae kwon do, karate, and mixed martial
arts. The practice even exists in non-combative weight-based sports such as power lifting,
rowing, and horse racing (Beljaeva & Oopik, 2001; Horswill, 1992; Kazemi, Shearer, &
Choung, 2005; Schoffstall, Branch, Leutholtz, & Swain, 2001; M. S. Smith, Dyson, Hale,
Harrison, & McManus, 2000; Waslen, McCargar, & Taunton, 1993).
Combative weight class athletes will routinely lose between 5 and 10% of their
body weight to compete in lower classes (American College of Sports Medicine, 1976;
Artioli et al., 2010; Brownell et al., 1987; Hall & Lane, 2001; Horswill, 1993; Kiningham
& Gorenflo, 2001; Ribisl, 1975; M. S. Smith et al., 2000; Steen & Brownell, 1990). This
weight loss is achieved through a variety of potential methods, including increased
exercise, decreased caloric intake/ energy restriction, fluid restriction, heat exposure (e.g.,
sauna/steam), exercising in heat exposure, diuretics, laxatives, and even vomiting
(Clarkson, Manore, Oppliger, Steen, & Walberg-Rankin, 1998; Horswill, 1992, 1993;
Kiningham & Gorenflo, 2001; Oppliger et al., 2003; Wroble & Moxley, 1998b).
Weight cutting can be very frequent, based on competitive needs. Essentially, the
prevalence of weight cutting will parallel the frequency of competition. The practice has
been described in wrestlers as occurring approximately 10 to 15 times per season with a
range of 2.0 to 2.9 kilograms lost on a weekly basis (Oppliger et al., 1996; Oppliger,
Landry, Foster, & Lambrecht, 1993; Oppliger, Landry, Foster, & Lambrecht, 1998;
Oppliger et al., 2003). Judokas were found to have reduced their weight roughly two to
11

five times a year, although many reduced their weight six to 10 times a year and were
found to have started the practice generally before 15 years old (Artioli et al., 2010).
The percentage of wrestlers who practice weight cutting has varied in research,
but with a range of 32% to 89%, the phenomenon is real and a part of weight class sports
(Artioli et al., 2010; Horswill, 1993; Kiningham & Gorenflo, 2001; Lakin, Steen, &
Oppliger, 1990; Oppliger et al., 1998; Steen & Brownell, 1990). Most recently, 82% of
judokas were found to engage in the practice (Artioli et al., 2010). Weight cutting is also
prevalent in boxing, tae kwon do, and general combative sports or mixed martial arts
(Hall & Lane, 2001; Kiningham & Gorenflo, 2001; M. Smith et al., 2001; M. S. Smith et
al., 2000).
The Consequences of Weight Cutting
Weight cutting has been found to have little or no effect on anthropometrical or
long-term growth in judokas (Waslen et al., 1993) and wrestlers (Housh et al., 1997;
Housh, Johnson, Stout, & Housh, 1993; Nelson, 1962; Nitzke, Voichick, & Olson, 1992;
Roemmich & Sinning, 1997; Singer & Weiss, 1968). Although it should be noted that
weight cutting has been linked to long-term weight development in boxers, wrestlers, and
weight lifters and that the practice may enhance weight gain or predispose to obesity in
later life (Saarni, Rissanen, Sarna, Koskenvuo, & Kaprio, 2006).
Weight cutting has been investigated in relation to success or winning in wrestlers
and found to have a mixed effect. Utter and Kang (1998) were the only researchers who
found no affect, while weight cutting was found to have a positive correlation to success
in two other studies (Wroble & Moxley, 1998a, 1998b). While weight cutting may have
12

contributed to winning, it had no effect on academic grades of wrestlers (Burcham,
Gerald, Hunt, & Pope, 2006).
There have been mixed results regarding the effect of weight cutting on
metabolism. While there was no effect found in judokas (Waslen et al., 1993) and for the
most part in wrestlers (McCargar & Crawford, 1992; Melby, Schmidt, & Corrigan, 1990;
Schmidt, Corrigan, & Melby, 1993), weight cutting has been found to slightly decrease
resting energy expenditure (Oopik et al., 1996; Steen, Oppliger, & Brownell, 1988).
In other research, weight cutting has been found to consistently have a negative
effect on psychological and cognitive function in judokas (Degoutte et al., 2006; Filaire,
Maso, Degoutte, Jouanel, & Lac, 2001; Koral & Dosseville, 2009; Yoshioka et al., 2006)
and in wrestlers (Choma, Sforzo, & Keller, 1998; Landry, 1998). It should be noted that
Landry (1998) found a decrease in psychological variables, but no change in cognitive
function.
Another stream of research with a consensus was that of various indices of
immune function. While it has not been well researched in wrestlers, with only one study
(Whiting, Gregor, & Finerman, 1988) finding a negative impact, this damaging effect has
been well documented in judokas (Finaud et al., 2006; Kowatari et al., 2001; Ohta et al.,
2002; Suzuki et al., 2003; Umeda, Nakaji, Shimoyama, Kojima, et al., 2004; Yaegaki et
al., 2007). A similar health-related stream of research that only appeared in studies
related to judokas is that of bone health. Unlike previous areas, results were mixed. Some
of the research documented the negative effect of weight cutting on bone health markers,
contrasted with no effect in light of mediation from heavy training (Prouteau, Benhamou,
& Courteix, 2006; Prouteau, Pelle, Collomp, Benhamou, & Courteix, 2006).
13
Yet another stream of research in uniform agreement was that of physiological
blood and substrate parameters. There was an undisputed negative effect in judo
(Degoutte et al., 2006; Filaire et al., 2001; Prouteau, Benhamou, & Courteix, 2006) as
well as in wrestling (Hickner et al., 1991; Horswill, Park, & Roemmich, 1990; Karila et
al., 2008; Strauss, Lanese, & Malarkey, 1985; Tarnopolsky et al., 1996; Webster, Rutt, &
Weltman, 1990).
Weight cutting has also been investigated in relation to performance measures.
The phenomenon has been found to have a unanimous negative effect on judo
performance (Degoutte et al., 2006; Filaire et al., 2001; Koral & Dosseville, 2009;
Prouteau, Ducher, Serbescu, Benhamou, & Courteix, 2007). It has been found to
negatively impact anaerobic output in both wrestlers and judokas (Maffulli, 1992;
Umeda, Nakaji, Shimoyama, Yamamoto, et al., 2004; Webster et al., 1990). There is also
an overwhelming negative impact found in relation to physical work capacity in wrestling
(Herbert & Ribisl, 1972; Hickner et al., 1991; Horswill, Hickner, Scott, Costill, & Gould,
1990; Klinzing & Karpowicz, 1986; Maffulli, 1992; Oopik et al., 1996; Oopik et al.,
2002; Rankin, Ocel, & Craft, 1996; Ribisl & Herbert, 1970). However, some studies have
found working capacity to not be affected (Kraemer et al., 2001; McMurray, Proctor, &
Wilson, 1991), or even improve with weight cutting (G. M. Fogelholm et al., 1993).
In relation to strength, the effect of weight cutting is uncertain. Both a negative
influence and mixed results have been found in relation to wrestlers (Maffulli, 1992;
Webster et al., 1990). Strength has also been investigated in power lifters, and it was
found that weight cutting negated strength (Schoffstall et al., 2001).
14

Full-Contact Forms of Martial Arts
The problem with this volume of research is that it comes from non-contact, non
striking forms of martial arts or sports as opposed to full-contact striking martial arts and
mixed martial arts. Some studies have been performed with mixed populations of both
contact and non-contact weight cyclers. Jauhiainen, Laitinen, Penttila, Nousiainen, and
Ahonen (1985) investigated the effect of a 5% weight cut by varying methods (e.g.,
sauna, diuretic, exercise, control) on blood physiology alterations in wrestlers, judokas,
boxers, and weight lifters. The researchers found that blood lipids and proteins increased
with sauna and diuretic dehydration, but not with exercise. This was most likely related to
the moderating effects from increased heavy training. An important note is that different
methods of weight loss cause different physiological alterations and that the levels of
aerobic and anaerobic training can also create variation. Roots, Timpmann, and Oopik
(2000) examined the role of weight cutting on the physiologic blood lipid profile and
found no adverse effect of the practice in karatekas, wrestlers, boxers, and judokas.
Timpmann et al. (2008) investigated the effect of a 5% weight cut on work, strength,
metabolites, and urea in wrestlers and karatekas. A key principle is that this study was
one of the first studies to focus on a “self-selected regimen” of weight loss rather than
one imposed by the researcher. It was concluded that weight cutting decreased work and
strength while increasing metabolites and urea (Jauhiainen et al., 1985; Roots et al., 2000;
Timpmann et al., 2008).
An even smaller field of research has been conducted exclusively on full-contact
striking combative sports. This included research into karate, boxing, tae kwon do,
general combative sports, and/or mixed martial arts.
15

In karate, a 5% weight reduction over five days decreased physical working
capacity, which was not maintained by creatine supplementation. However, creatine
appeared to maintain peak force and angular velocities as opposed to the decrease
observed in placebo trials (Oopik et al., 2002).
A 6% weight cut in tae kwon do practitioners was found to decrease exercise
time, peak blood lactate, maximal running time, heart rate, and muscular endurance.
While muscular endurance decreased, strength and power remained. Likewise, while
maximal running time and heart rate decreased, maximal oxygen uptake did not change
(Lee, 1997). Also, a 5% reduction was associated with a decrease of anaerobic high-
intensity performance in lightweight athletes as compared to heavyweights (Kijin &
Wookwang, 2004).
Although simulated sports performance has become more and more popular in
research related to weight cutting, this has not been fully realized in other sports as
compared with boxing. It was found that a loss of body mass diminished simulated
boxing performance; however, some athletes appeared predisposed to better handle
dehydration and not demonstrate performance decrements (M. S. Smith et al., 2000). In a
similar boxing performance task, a negative effect was found overall, but with a few
outliers who saw no decrement or even improvement (M. Smith et al., 2001). Lastly,
weight cutting was found to negatively impact mood and simulated performance (Hall &
Lane, 2001). Essentially, all three found performance decreases due to weight cutting.
Only one study to date has investigated weight cutting in general combative
sporting athletes. They were not designated mixed martial artists, but they were not
designated into other sports either. Timpmann, Oopik, Paasuke, Medijainen, and Ereline
16

(2004) examined the effect of a 5% weight cut on strength, work, and blood metabolites
in this undefined population of general combative athletes. It was concluded that there
was an increase in metabolites as well as urea from protein degradation. Also, work and
strength were impaired in a 3-minute variable intensity exercise, attempting to replicate
the high intensity and aerobic demands of combative sports (Timpmann et al., 2004).
Barriers to Consensus on the Effects of Weight Cutting
Unfortunately, there were barriers to a consensus on the effects of weight cutting.
These barriers included the methods used in varying research, researcher imposed
protocols, and differing rehydration times. Timpmann et al. (2008) suggested that the
main problem was researcher-imposed weight controls and, as such, were the only
researchers to use a self-selected weight-loss protocol. Results from previous studies may
have been confounded by the fact that the subjects were not allowed to use their own
developed and practiced procedure of weight loss. Instead, according to Timpmann et al.
(2008), subjects were to use prescribed methods they may not have preferred nor had
experience with. Another conflicting issue was the differing tests and measures of
performance; as well, these tests were not necessarily being sport specific. While one test
might accurately represent one sport, the results and trends may not transfer to a different
sport. The last major problem was differing rehydration times between weigh in and
competition between sports. Only mixed martial arts of the striking contact sports have
the large window of 24 hours. All other sports have resorted to shorter rehydration times;
therefore, again, results and trends are not applicable to other timelines from other sports.
Large timelines have been used for wrestling, but not the full 24 hours of rehydration as
is found in mixed martial arts.
17

Anaerobic power and strength have been vastly studied with mixed results in
relation to weight cutting because they have been described as the key to success in
wrestling (Horswill, 1992). However, anaerobic power and strength have not been
investigated relative to martial arts striking performance and parameters.
Dehydration has been associated with negative effects on reaction time and
accuracy. Reaction time has been described as negatively affected by dehydration, but
this link has not been established directly to hypo-hydration (American Academy of
Pediatrics Committee on Sports & Fitness, 2005). These parameters have not only been
ignored for the most part in hypo-hydration, they are also absent from research relating to
full contact combative striking sports. The effect of weight cutting on strike accuracy has
yet to be investigated in contact combative weight class sports such as mixed martial arts,
even though accuracy has been found to decrease in relation to exercise induced
dehydration (Devlin et al., 2001). Essentially, factors such as reaction time and accuracy
have not been fully investigated in relation to hypo-hydration for making weight.
Martial Arts Striking Performance
Power, speed, and timing are some of the most important factors for martial arts
striking performance. Power can be thought of as explosive force (i.e., the product of
force and speed) or an athlete exerting their strength quickly. Speed and timing include
both muscular speed and reaction time. Aspects of the fundamental parameters of power,
speed, and timing have been investigated through a wide variety of indirect and direct
methods. This body of literature has been summarized, including the existing limitations
(Chang, Evans, Crowe, Zhang, & Shan, 2011). It should be noted that none of this
18

summarized literature on martial arts striking performance investigated the phenomenon
of weight cutting in any way.
Chapter Summary
Dehydration negatively effects athletic performance, but the effect of self-induced
weight cutting with a subsequent rehydration period remains less clear. There were large
gaps across the literature and many barriers to a consensus on the effect of the
phenomenon. There was minimal research on weight cutting in general within mixed
martial artists as an athletic population, and only one study utilizing non researcher
imposed weight loss methods. Also, researchers have yet to utilize a sport-specific
performance test for mixed martial arts, with either common strikes, strike parameters, or
high-intensity intermittent exercise of five minutes representing one round of mixed
martial arts competition.
Weight cutting has been investigated from a variety of approaches in a variety of
weight-class-based sports; to date, no research has utilized a full-body, three-dimensional
motion capture system to quantify changes in striking mechanics and parameters in
relation to weight cutting. These striking parameters include velocities and accelerations,
which can be equated to strike power or force, reaction time, and accuracy.
19

Chapter 3: Methodology
My aim in this chapter is to present the materials and methods used to investigate
the effect of weight cutting on martial arts striking parameters. This includes the
laboratory set up of a synchronized motion capture system, electromyography unit, and
an optical trigger device. As well, I present an explanation of the quantification of power,
reaction time, and accuracy based on strike timing, 3D kinematic characteristics of the
punching bag and striking limbs, electromyography measurement, and the optical trigger
signal. Lastly, a description of the application of the quantifying methods to a pre- and
post-test design investigating weight cutting, the characteristics of the subjects tested, and
the statistical analysis will be presented.
3D Motion Capture and Laboratory Set-Up
Once ethical approval was received from the University of Lethbridge (see
Appendix A), the laboratory was set up with a 12-camera VICON 3D motion capture
system that was used to quantitatively determine the whole body kinematic
characteristics during each striking movement. VICON software (www.vicon.com) was
configured to capture movement at a rate of 200 frames per second. Calibration residuals
were determined in accordance with VICON’s guidelines and yielded positional data
accurate within 1 mm.
Each subject was fixed with 39 reflective markers with a diameter of 9 mm. The
markers reflected infrared light emitted from the cameras and their positional data were
recorded by said cameras. These markers were placed at specific bony and body
landmarks to create 15 segments and a full body biomechanical model using previously
20
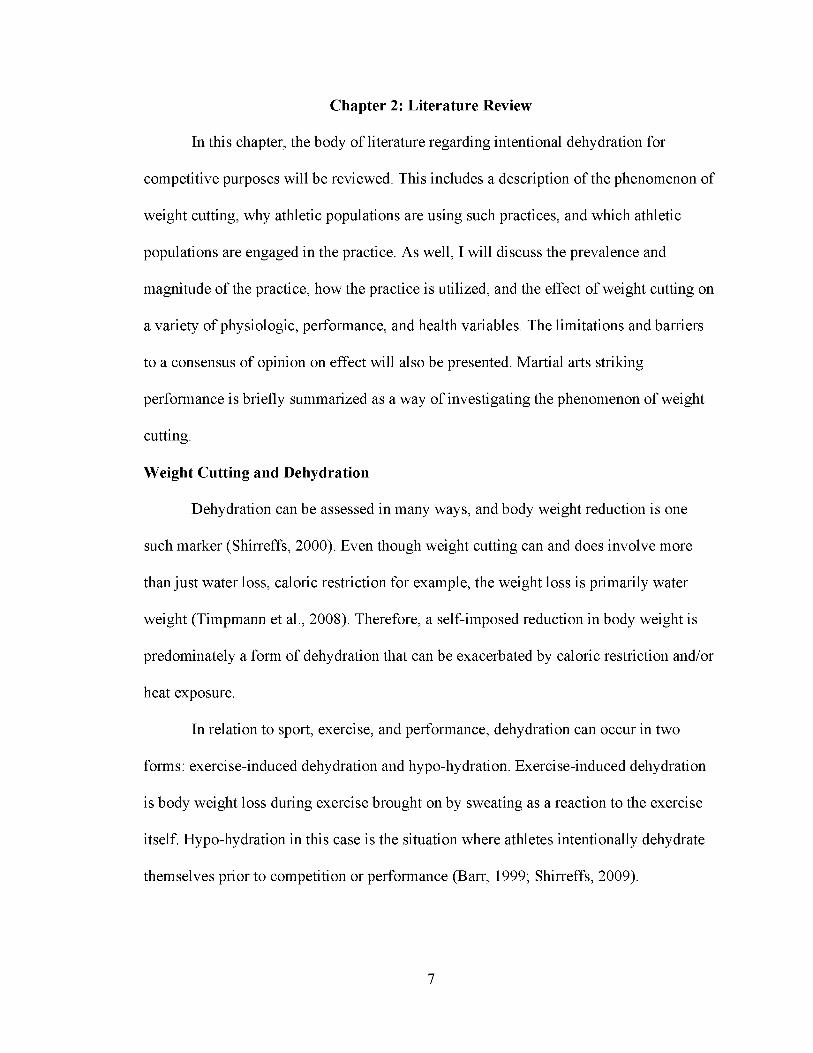
existing methods (Shan, Bohn, Sust, & Nicol, 2004; Shan & Westerhoff, 2005; see also
Figure 1).
Figure 1. The set-up of synchronized 3D data collection. 1
The segments consisted of the head and neck, upper trunk, lower trunk, two upper
arms, two lower arms, two hands, two thighs, two shanks, and two feet. To create the
head segment, markers were placed on the left and right temples and two on the posterior
portion of the parietal bone. The upper trunk and arm segments were created by markers
on the sternal notch, xiphoid process, C7 and T10 vertebrae, right back, left and right
acromion processes, left and right lateral epicondyles of the humerous, styloid processes
of the ulna and radius, right and left third metacarpophalangeal joints, as well as the right
and left upper and lower arms. The lower torso/pelvis and leg segments were created
1 From “An Innovative Approach for Real Time Determination of Power And Reaction Time in A Martial Arts Quasi-Training Environment Using 3D Motion Capture and EMG Measurements,” by S.-T. Chang, J. Evans, S. Crowe, X. Zhang, & G. B. Shan, 2011, Archives o f Budo, 7, p. 187. Copyright 2011 by Chang et al. Reproduced with permission.
21

from markers placed on both the right and left following landmarks: the anterior superior
iliac crest, posterior superior iliac crest, lateral condyle of the tibia, lateral malleolus of
the fibula, calcaneal tuberosity, head of hallucis, upper leg/thigh, and tibia. The raw
kinematic data were processed using a five-point smoothing filter (1-3-4-3-1 function).
In addition, a standard punching bag was outfitted with 15 markers. Four were
located on the top and four on the bottom to provide a frame for the bag. Another seven
markers were used as targets, with three vertical left markers, three vertical right markers,
and one front marker whose height matched the highest side markers. The frame markers
were used to determine the striking power of the athlete. The target markers corresponded
to the body targets of the most common strikes: left jab (left straight punch) and right
straight punch to the head, hooks to the head and body, as well as left and right kicks to
the head, body, or legs. These target markers, combined with the carefully placed striking
markers on the middle knuckle of the glove and lower shin, allowed for an investigation
of accuracy. The shin marker was placed at the lower third of the shank and then adjusted
based on the subjects’ preferred contact area. The height of the bag was standardized by
hanging it so that the subject’s lowest lateral rib matched the height of the middle or body
targets. The high/head and low/leg targets were placed at 20% of body height away from
midpoint marker, which was already located at the middle of the bag.
Kinematic data of the subject and bag were calculated based on the data collected
from the 3D motion capture system using previously mentioned methods. This data
included positional changes, velocities, and accelerations.
The optical signal system of three LED lights was synchronized to the system and
controlled by the researcher. These signal lights were used to initiate the time of strike as
22
well as to indicate to the subject the location of (or style of) strike. The lights were placed
at the top of the bag at eye level without interfering with the targets. This allowed for
random selection of the strike within the chosen style and when combined with
electromyography (EMG) and motion data allowed for a thorough investigation of
reaction time.2
Power Quantifications
Power and force were mathematically determined from the kinematic data using
the method proposed by Chang et al. (2011). This method was specifically developed for
this research project. Using this method, the movement of the punching bag was used to
determine the power in the strike. Treating the punching bag as a rigid body and utilizing
the related coordinate data, linear and angular power were able to be calculated and,
hence, the total power as well.
P T = P L + P A [1]
Where PTis the total power, PL and PA are the linear and angular powers respectively.
Linear power calculations. In order to determine linear power, the velocity of
the centre of the bag (v) and the force applied to the bag (F) needed to be quantified. The
eight frame markers of the punching bag provided this information. Since the cylindrical
punching bag had a uniform density and was symmetric in both vertical and horizontal
directions respectively, the centre of mass was determined with coordinates x, y, and z, in
their respective planes.
2 The approach and equations used in this presentation follow the collaborative research I completed as reported in “An Innovative Approach for Real Time Determination of Power And Reaction Time in A Martial Arts Quasi-Training Environment Using 3D Motion Capture and EMG Measurements,” by S.-T. Chang, J. Evans, S. Crowe, X. Zhang, & G. B. Shan, 2011, Archives o f Budo, 7(3), 185-196. Copyright 2011 by Chang et al.
23

Using the coordinate data, vectors were produced representing the movement/
position, velocity (first derivative of Equation 2), and acceleration (second derivative of
Equation 2) of the rigid body for each frame.
v = X
v2 = y
v3 = z
[2]
Vox Equation 2, v is the velocity vector of the centre of the punching bag, and Vi,
v2, and v3 are the velocities of the bag in their respective x, y, and z directions. Each
velocity was determined by the first derivatives: i , y and z, in their respective x, y, and z
directions.
Basic physics calculations were used to determine the linear force (F) exerted on
the bag (Newton’s 2nd Law, Equation 3) and using physics theory, the linear power was
able to be determined.
F = mvx
F2 = mv2
r-----
-- = mv3[3]
Vox Equation 3, F is the force vector applied to the punching bag, rn is the mass of
the punching bag, and Vg, v 2, and v3 are the accelerations in their respective x, y, and z
directions (or first derivatives of the previously obtained velocities). Accelerations as
stated were the derivative of velocities or the second derivative of the positional data.
24
Using Equation 3, Fi, Fz, and Fa were calculated: that is, the applied force in the x, y, and
z directions respectively. Therefore, the linear power equation was as follows:
PL = F -v = F f\ + F2v2 + F3v3 [4]
A program written in MATLAB was used to help determine the linear power.
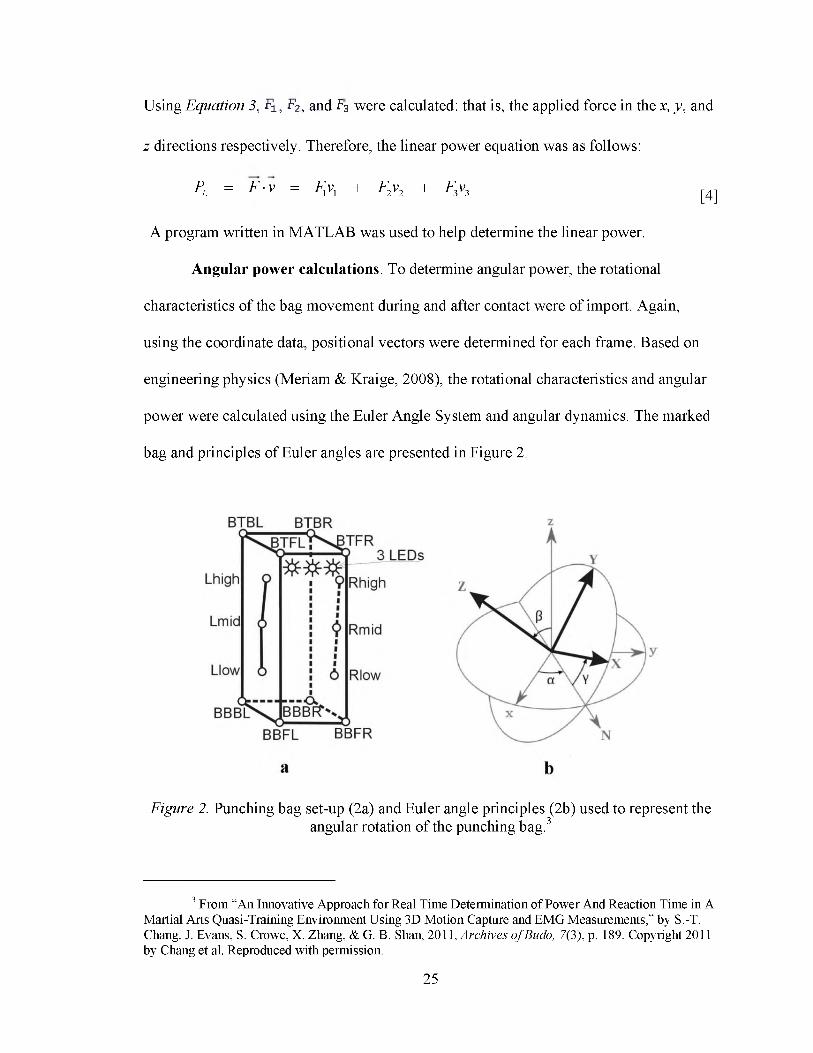
Angular power calculations. To determine angular power, the rotational
characteristics of the bag movement during and after contact were of import. Again,
using the coordinate data, positional vectors were determined for each frame. Based on
engineering physics (Meriam & Kraige, 2008), the rotational characteristics and angular
power were calculated using the Euler Angle System and angular dynamics. The marked
bag and principles of Euler angles are presented in Figure 2.
BTBL BTBR
3 LEDs
Lhigh Rhigh
Lmid Rmid
Low Rlow
..............BBBFT'hBBBL
BBFL BBFR
Figure 2. Punching bag set-up (2a) and Euler angle principles (2b) used to represent theangular rotation of the punching bag.3
3 From “An Innovative Approach for Real Time Determination of Power And Reaction Time in A Martial Arts Quasi-Training Environment Using 3D Motion Capture and EMG Measurements,” by S.-T. Chang, J. Evans, S. Crowe, X. Zhang, & G. B. Shan, 2011, Archives o f Budo, 7(3), p. 189. Copyright 2011 by Chang et al. Reproduced with permission.
25

The explanation of the bag marker set in Figure 2a is as follows: BTBL = bag top
back left, BTFL = bag top front left, BTBR = bag top back right, BTFR = bag top front
right, BBBL = bag bottom back left, BBFL = bag bottom front left, BBBR = bag bottom
back right, and BBFR = bag bottom front right represent the markers on the eight corners
of the bag. Markers were also placed on the sides to provide a target for the participant;
Lhigh, Lmid, and Llow, Rhigh, Rmid, and Rlow. The front marker matches the height of
the Rhigh and Lhigh markers and is not included in the figure due to overcrowding with
the signal lights.
The principles of Euler angles used to represent the angular rotation of the
punching bag are depicted in Figure 2b. Lower case letters x, y, and z represent the initial
axis of an object, and capital lettersX, Y and Z represent the axes after rotation. N
represents a common line between the position before and after rotation (an intersection
of the xy and the XY planes). The Euler angles a, P, and y represent the angle between the
x-axis and N, the angle between the z-axis and the Z-axis, and the angle between N and
the X-axis respectively.
Any three consecutive rotations of a rigid body can be represented with Euler
angles (a, P, and y). Based on previous methods (Trucco & Verri, 1998), an angle
between two consecutive vectors needed to be calculated in order to determine Euler
angles: that is, the time change of a selected vector. The specific vector chosen was from
the centre of the bag to the bag top back right marker (BTBR). As stated, positional
vectors were calculated for each frame from the coordinate data. These positional vectors
build a rotational matrix by Euler’s theorem, which states that any 3D rotation can be
represented by a rotation around a unit vector n = [«,, n2, n3f . The value for n can
26
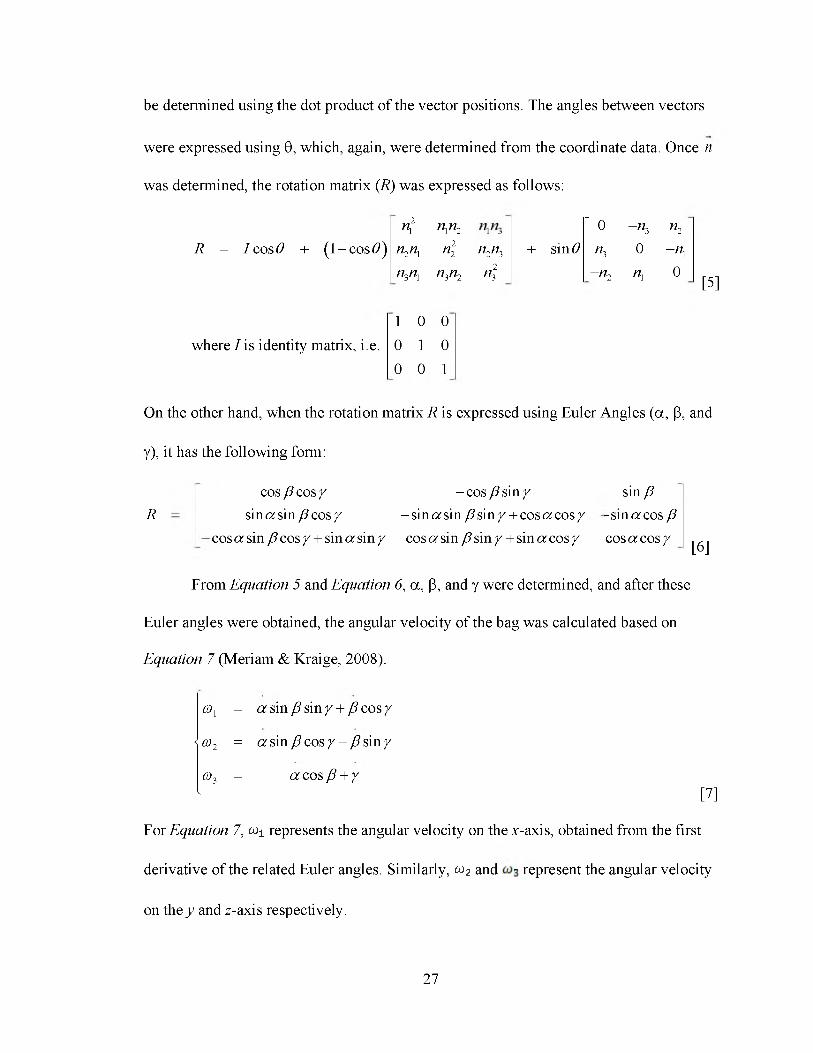
be determined using the dot product of the vector positions. The angles between vectors
were expressed using 9, which, again, were determined from the coordinate data. Once n
was determined, the rotation matrix (R) was expressed as follows:
R = I cos# + (1 - cos#)
where I is identity matrix, i.e.
n 2 nn2 " 0 - n n 2
nn n 22 n n + s in # n 0 - n 1
n n n3n2 n32 - n2 n1 0
1 0 0 0 1 0 0 0 1
[5]
On the other hand, when the rotation matrix R is expressed using Euler Angles (a, P, and
y), it has the following form:
Rcos P cos y - cos P sin y
sin a sin P cosy - sin a sin Psiny + cos a cosycosasin Pcosy + sinasiny cosasin Psiny + sinacosy
sin P-sin a cos P cos a cosy
[6]
From Equation 5 and Equation 6, a, P, and y were determined, and after these
Euler angles were obtained, the angular velocity of the bag was calculated based on
Equation 7 (Meriam & Kraige, 2008).
mx = a sin Psiny+ Pcosy
< a 2 = a sin P cos y - P sin y
cv3 = a cos P + y1 [7]
For Equation 7, ^ represents the angular velocity on the x-axis, obtained from the first
derivative of the related Euler angles. Similarly, wz and represent the angular velocity
on the y and z-axis respectively.
27

In order to calculate the angular power, the moment of inertia of the bag needed to
be determined. Again, treating the punching bag as a rigid body with a cylindrical shape
allowed the quantification of its moment of inertia.
I = I7 = 1 m(3r2 + h2)1 2 12<
L = mr2 [ 3 2
[8]
For Equation 8, m is the mass of the punching bag, r is radium of the bag, h is the
height of the bag, Ii, I2, and I3 are the moment of inertia in the medial-lateral, anterior-
posterior, and vertical directions respectively. Because of the symmetry of the punching
bag, they are equal to each other. After the determination of angular velocities (Equation
7) and the moments of inertia (Equation 8), the moment M (torque) applied to the bag
could be calculated using Euler equations (Equation 9):
M l = I Oj + (I3 - 12 )o2o3
< M 2 = I2 O2 + (I1 - I3)°3°1
M 3 = I3 <y3 + (12 - 1 )o o1 [9]
For Equation 9, M i, M2, and M3 represent the components of moment (or torque)
in the x, y, and r-axis respectively. //, I2, and I3 are the moments of inertia and OJ;. and
represent the angular velocities as previously calculated. The angular accelerations of
£%, and in the respective x, y, and z-axis were obtained by taking the first
derivative of z, and cug.
28

Finally, angular power (Pa) was calculated by multiplying these three torques (Mi,
M2, andMj) by the corresponding angular acceleration values (£%, £u2,£u3) to find the
magnitude of those vectors (see Equation 10).
PA = M-co = Mf ) ] + M 2co2 + M icoi
An example of the quantified components of power is presented in Figure 3.
[10]
Figure 3. Typical power generation of a 185 lb athlete during a left straight punch (right column) and a left hook (left column). As shown in the data presented in this figure, a hook generated higher maximal power than a straight one.4
4 From “An Innovative Approach for Real Time Determination of Power And Reaction Time in A Martial Arts Quasi-Training Environment Using 3D Motion Capture and EMG Measurements,” by S.-T. Chang, J. Evans, S. Crowe, X. Zhang, & G. B. Shan, Archives o f Budo, 7(3), p. 191. Copyright 2011 by Chang et al. Reproduced with permission.
29

EMG Measurement and Reaction Time Calculations
Similarly to power and force, reaction time was determined using the method
proposed by Chang et al. (2011). As previously stated, this method was specifically
developed for this research project. An eight-channel, wireless NORAXON
(www.noraxon.com) surface EMG with a gain of 1,000 was used to determine selected
muscle activity. NORAXON’s hardware specifications provided raw signal recordings at
a rate of 1,000 Hz with a band pass filter of 16-500 Hz. This EMG unit was synchronized
with the motion capture system, and this set-up allowed for an investigation of muscular
recruitment, activation, and onset differences. Muscles investigated included the right and
left biceps brachii, triceps brachii, vastus medialis, and biceps femoris.
The LED optical signal system was used to indicate to the subject to start the
appropriate strike. The signals were used for the breakdown of left and right hand strikes,
including straights to the head, hooks to the head, and hooks to the body. It also indicated
the appropriate height of a kicking strike to the head, body, or legs. This investigative set
up of synchronized 3D motion capture, EMG, and optical trigger system allowed for an
assessment and breakdown of reaction time. The breakdown of reaction time consisted of
two periods: (a) central nervous system (CNS) response time and (b) peripheral nervous
system (PNS) response time. Quantification of participants’ reaction time is presented in
Figure 4.
30

Original EMG Signal EMG Envelope Start Signal Initiation of EMG Bag Contact
1 1 1 1 TRT BCT
CNSRT PNSRT
-
m
- - - - - - - - - - - - - - - - - - - - - - - - i - - - - - - - - - - - - - - - - - - - - - - - - 1- - - - - - - - - - - - - - - - - - - - - ~ l - - - - - - - - - - - - - - - - - - - - - - - - 1- - - - - - - - - - - - - - - - - - - - - - - - I - - - - - - - - - - - - - - - - - - - - - - - -
TRT .BCTm - - - - - - - - - - - - - - - - - - - - - - - - 1- - - - - - - - - - - - - - - - - - - - - -
CNSRT PNSR1
-
111,-
i i p i _ _ _ i i l l | J1.6 1.8
— ► time (s)
Figure 4. Quantification of reaction time using our synchronized device and EMG enveloping method.5
The CNS response time was determined by the time elapsed from the start of the
stimulus (light signal onset) until the initiation of the PNS response (measured via EMG).
The initial muscle activation or onset of the PNS response was determined using existing
methods (Basmajian & De Luca, 1985): (a) obtain an EMG envelope using the
Butterworth filter; (b) calculate the mean and standard deviation values between the start
of the motion capture to the onset light signal (where there is minimal muscular activity);
5 From “An Innovative Approach for Real Time Determination of Power And Reaction Time in A Martial Arts Quasi-Training Environment Using 3D Motion Capture and EMG Measurements,” by S.-T. Chang, J. Evans, S. Crowe, X. Zhang, & G. B. Shan, 2011, Archives o f Budo, 7(3), p. 192. Copyright 2011 by Chang et al. Reproduced with permission.
31

and (c) assign the initiation of the PNS to the point where the EMG value exceeds p+
1.3a between the onset light signal until the maximum envelope value.
The PNS response time was measured from this calculated point of muscle
initiation until the point of initial contact of the striking limb with the punching bag,
which was obtained from the coordinate data. The sum of these two aspects (i.e., CNS
and PNS responses) provided an overall reaction time to the given stimulus.
Accuracy Calculations
Accuracy was determined by quantifying the minimum distance between the
appropriate target and strike marker using the Equation 11:
d = V [(xt-xs) 2+ (yt-ys) 2+ (zt-zs) 2] [11]
In using Equation 11, the positional coordinate data of the selected striking marker was
subtracted from the positional data of the proper target marker in each of the x, y, and z
directions. The individual x, y, and z component differences were squared and then
summed. The square root was then taken of this sum. This standard distance formula was
applied to every frame, and the minimum value was selected as the point of accuracy.
Pre- and Post-Test Design
This method of quantifying power, reaction time, and accuracy was applied to a
pre- and post-test design to investigate the effect of a self-selected weight cut regiment on
these parameters. As previously mentioned, a variety of strikes were used for a single
test: right and left straights to the head, right and left hooks to the head, right and left
hooks to the body, and right and left round-house kicks to the head, body, and legs. In
either test, the subject performed approximately five strikes for each selected style (i.e.,
five left hooks to the head and five right hooks to the head, and in the case of kicks, five
32

left kicks to the head, five to the body, and five to the leg). These strikes were
randomized by the researcher within the following categories: straights to the head, hooks
to the head, hooks to the body, left kicks, and finally right kicks.
The participants came to the lab and performed a pre-test where an initial weight
was recorded. Upon completion of this test, the subject was asked to reduce his body
weight by 5% using self-selected methods. The participants were given one to seven days
to complete the weight cut. In the cases of real competition, the subject lost the required
weight to achieve their weight class and no more. Upon achieving the desired weight
(i.e., 5% reduction or the necessary weight class), the subject was post-tested after a 24-
hour period of rehydration and re-feeding or as close to their real competition as was
feasible. Weigh in and post-test weights were also recorded as well as a loose guideline
of the methods used for reducing weight.
Participant Information
Participants were trained mixed martial artists from the local Canadian Martial
Arts Centre or martial artists who were interested in the study through word of mouth. I
am a member of the club and have personal contact with many of the athletes.
Additionally, the coach/owner of the club helped with recruitment. Recruitment was not
limited to this one club as all combat athletes were welcome. Experience and age were
not exclusionary factors in this research and participants’ inclusion was based on the
availability of the athletes. However, participation was limited to males to avoid
potentially confounding factors from sex differences.
While 12 participants were tested, only seven subjects’ data were used. This was
due to analysis issues, time constraints, and the quality of data collection. When errors
33

were discovered, testing could not be redone because of weight cutting and competition
timing. These participants were recruited from local mixed martial arts gyms, and each
participant signed a consent form prior to commencing research (see Appendix B). The
pertinent information is presented in Table 1, and their weight changes during
individualized weight-cut process are presented in Figure 5.
Table 1. Participant Information
pre weight (kg)
weigh in (kg)
postweight
(kg) height (cm)age
(years)years
trainingyears
professional
range 65.6 - 96.1 64 - 91.3 66.4 - 95.4 171 - 188.5 20 - 32 1.5 - 9
kO1o
mean 78.76 75.25 79.41 179.21 25.71 5.07 2.93SD 9.86 9.03 9.65 6.34 3.88 3.03 2.24
Figure 5. Weight changes during individualized weight-cut process.
Note: WL = weight loss during weight-cut processWR = weight regain during 24-hour interval after the weigh in WD = weight difference between the pre- and post-test
34

As shown in Figure 5, the data revealed: (a) Weight cutting is highly
individualized, (b) Most participants compete or test at a higher body weight when
compared to their pre-cut weight (i.e., WD in Figure 5), and (c) There were only a few
athletes who could not regain all their lost weight or approximately return to their pre
weights (i.e., WD in Figure 5).
Statistical Analysis
Descriptive statistics such as means and standard deviations were supplied, and
paired T-tests were performed on a variety of subgroups. These subgroups include the
overall effect, the effect by upper or lower body strikes, the effect by individual strike
style, and effect by individual participant. All statistical analysis was performed using
SPSS (see Appendix C).
Chapter Summary
In conclusion, the utilized method allowed for the quantification of total power,
power components (i.e., linear & angular powers), total reaction time, reaction
components (i.e., central and peripheral responses), and accuracy. These parameters were
tested in a pre- and post-test design to investigate the effect of cutting weight. The
corresponding results of this investigation are presented in the next chapter.
35

Chapter 4: Results
It is my aim in this chapter to present the results of this investigation, reporting
the descriptive statistics, T-test results, and the directionality of the effect. Three major
parameters were presented; reaction time, power, and accuracy. Total reaction time as
reported in seconds was divided into central and peripheral reactions. Total reaction time,
central reaction time, and peripheral reaction time are represented by TRT, CNS, and
PNS respectively. Total power as reported in Watts was separated into the maximum and
average of both linear and rotational components. Power components were depicted
accordingly; maximum linear power (Max LP), average linear power (Avg LP),
maximum rotational power (Max RP), average rotational power (Avg RP), maximum
total power (Max TP), and average total power (Avg TP). Accuracy was reported in
millimeters. As described in chapter three, these results were reported for four layers of
the investigation of weight cutting in a pre- and post-test design: (a) the overall effect by
strike, (b) the effect isolated by upper or lower body strikes, (c) the effect by individual
strike style, and (d) the effect by individual participants. All of the results demonstrating
significance were labeled with an asterisk (p-value < 5%) and two asterisks (P-value <
1%). P-values approaching significance (< 9%) were presented to allow for discussion.
Overall Effect of Weight Cutting
A comparison of all trials for all strikes by all subjects, pre- versus post-test, is
presented in Table 2. As demonstrated in Table 2, only the components of reaction time,
that is total reaction (TRT), central reaction (CNS), and peripheral reaction (PNS), held
significance when looking at the total effect of weight cutting. This was also highly
significant for all three reaction times. It is of interest that there was a positive effect on
36

the total and central reaction but a negative effect on the peripheral reaction. Accuracy
was also approaching significance with a negative effect.
Table 2. Results o f the Overall Effect o f Weight Cutting
Metric Test Mean SD P Value Effect
TRT Pre 0.806 0.202 **0.000 PositivePost 0.755 0.185
CNS Pre 0.549 0.213 **0.000 PositivePost 0.442 0.155
PNS Pre 0.259 0.152 **0.003 NegativePost 0.314 0.128
Max LP Pre 664.528 524.150 0.174 PositivePost 1745.196 5920.441
Avg LP Pre 424.996 323.286 0.176 PositivePost 836.453 2257.936
Max RP Pre 2720.526 3052.292 0.285 PositivePost 3033.568 3613.114
Avg RP Pre 1789.452 2211.606 0.746 NegativePost 1736.275 2039.300
Max TP Pre 3295.677 3173.176 0.188 PositivePost 4704.821 8183.933
Avg TP Pre 2214.449 2272.025 0.404 PositivePost 2572.729 3409.679
Accuracy Pre 97.687 67.242 0.058 NegativePost 104.972 74.310
Note: Results are based on collective strike total of all participants (N = 58)
Overall Effect by Hand and Foot Strikes
The overall effect of weight cutting as isolated to the upper body or hand strikes
and to the lower body or foot strikes is presented in this section. Similar trends to the
37

overall effect have been presented in Table 3. There was a highly significant positive
effect on total and central reaction, and a negative effect on peripheral reaction.
Table 3. Results o f the Overall Effect Isolated by Hand Strikes
Metric Test Mean SD P Value Effect
TRT Pre 0.756 0.214 **0.000 PositivePost 0.702 0.189
CNS Pre 0.500 0.220 **0.000 PositivePost 0.401 0.152
PNS Pre 0.257 0.164 *0.035 NegativePost 0.301 0.117
Max LP Pre 485.853 401.075 0.177 PositivePost 2005.947 7041.772
Avg LP Pre 333.080 275.107 0.186 PositivePost 902.543 2683.092
Max RP Pre 2429.657 3058.301 0.378 PositivePost 2785.409 3613.540
Avg RP Pre 1659.771 2346.485 0.641 NegativePost 1554.745 1995.528
Max TP Pre 2859.830 3183.502 0.214 PositivePost 4743.050 9502.096
Avg TP Pre 1992.852 2414.467 0.444 PositivePost 2457.288 3843.922
Accuracy Pre 59.810 27.904 0.122 NegativePost 65.200 28.653
Note: Results are based on collective strike total of all participants (N = 41).
As shown in Table 4, the overall trend was replicated again with total, central, and
peripheral reaction times showing significance. This repeated the overall trend, with a
38

highly significant positive effect on total and central reaction time. Also, matching the
global trend, there was a significant negative effect on peripheral reaction time.
Table 4. Results o f the Overall Effect Isolated by Foot Strikes
Metric Test Mean SD P Value Effect
TRT Pre 0.928 0.089 **0.002 PositivePost 0.884 0.091
CNS Pre 0.666 0.143 **0.009 PositivePost 0.539 0.116
PNS Pre 0.262 0.122 *0.043 NegativePost 0.345 0.152
Max LP Pre 1095.474 545.386 0.479 PositivePost 1116.327 557.332
Avg LP Pre 646.677 330.543 0.147 PositivePost 677.061 356.321
Max RP Pre 3422.035 3011.194 0.407 PositivePost 3632.068 3651.319
Avg RP Pre 2102.210 1874.275 0.628 PositivePost 2174.084 2138.248
Max TP Pre 4346.838 2978.838 0.299 PositivePost 4612.623 3587.115
Avg TP Pre 2748.887 1840.252 0.506 PositivePost 2851.144 2088.410
Accuracy Pre 189.038 40.227 0.255 NegativePost 200.891 61.572
Note: Results are based on collective strike total of all participants (N = 17).
39

Effect of Weight Cutting by Strike Style
Comparisons of all trials for all subjects as differentiated by strike style, pre
versus post-test, are presented in the following tables. Strikes investigated include left
and right hand strikes, such as hooks to the body, hooks to the head, and straights to the
head. Also included are left and right foot strikes, such as round house kicks to the head,
body, and legs. Presented first were left- and right-hand strikes followed by left- and
right-foot strikes.
It is worth noting that left hooks to the body reiterated some of the overall trends.
That is a highly significant positive effect on total reaction time and a significant positive
effect on central reaction (see Table 5).
Results for left hooks to the head are presented in Table 6. There were no
significant effects in any of the performance metrics.
40

Table 5. Results o f the Left H ooks to the Body
Metric Test Mean SD P Value Effect
TRT Pre 0.836 0.258 **0.005 PositivePost 0.763 0.224
CNS Pre 0.667 0.323 *0.035 PositivePost 0.453 0.177
PNS Pre 0.167 0.194 0.102 NegativePost 0.309 0.071
Max LP Pre 560.544 377.135 0.470 NegativePost 525.161 412.926
Avg LP Pre 374.866 277.921 0.553 NegativePost 359.897 296.801
Max RP Pre 318.034 237.347 0.149 NegativePost 219.377 225.870
Avg RP Pre 176.107 145.710 0.148 NegativePost 126.556 145.266
Max TP Pre 808.593 483.843 0.120 NegativePost 692.747 551.097
Avg TP Pre 550.976 373.054 0.140 NegativePost 486.451 413.981
Accuracy Pre 46.276 22.505 0.202 NegativePost 60.104 34.314
Note: Results are based on collective strike total of all participants.
41
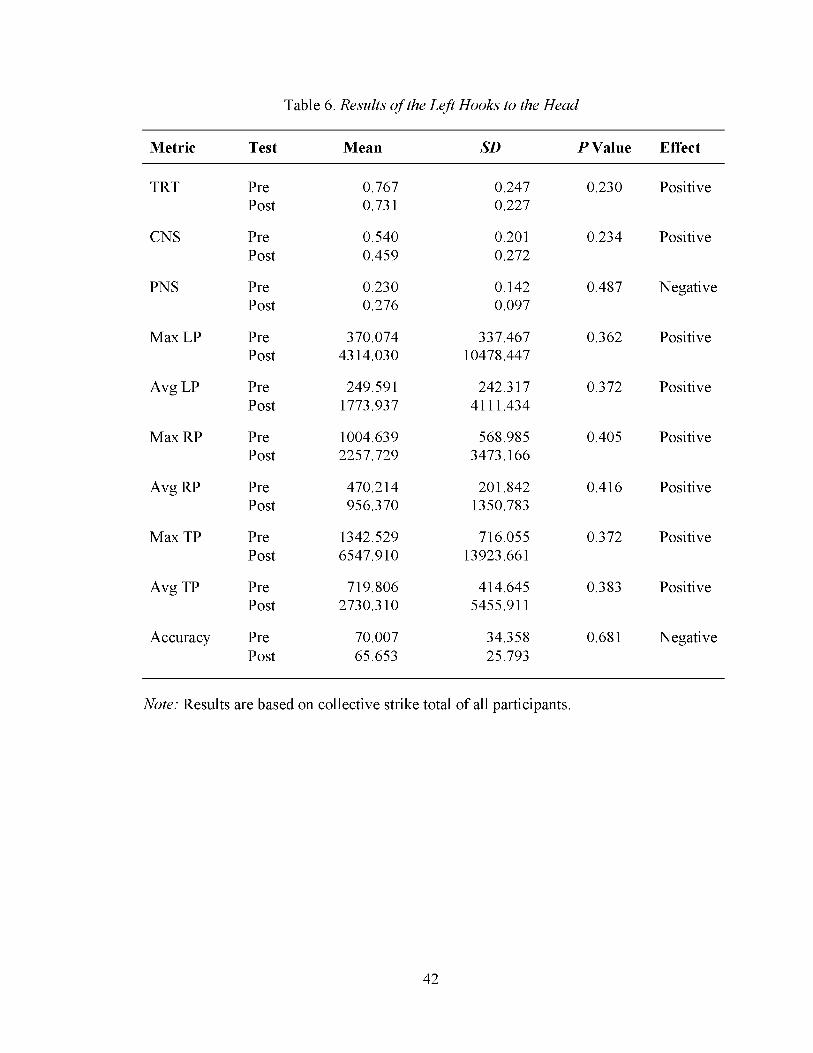
Table 6. Results o f the Left Hooks to the H ead
Metric Test Mean SD P Value Effect
TRT Pre 0.767 0.247 0.230 PositivePost 0.731 0.227
CNS Pre 0.540 0.201 0.234 PositivePost 0.459 0.272
PNS Pre 0.230 0.142 0.487 NegativePost 0.276 0.097
Max LP Pre 370.074 337.467 0.362 PositivePost 4314.030 10478.447
Avg LP Pre 249.591 242.317 0.372 PositivePost 1773.937 4111.434
Max RP Pre 1004.639 568.985 0.405 PositivePost 2257.729 3473.166
Avg RP Pre 470.214 201.842 0.416 PositivePost 956.370 1350.783
Max TP Pre 1342.529 716.055 0.372 PositivePost 6547.910 13923.661
Avg TP Pre 719.806 414.645 0.383 PositivePost 2730.310 5455.911
Accuracy Pre 70.007 34.358 0.681 NegativePost 65.653 25.793
Note: Results are based on collective strike total of all participants.
42

Left straight punches to the head demonstrated an approaching significant
negative effect on maximum linear power (see Table 7). There was no significance found
in any metric of the right hooks to the body as demonstrated in Table 8.
Table 7. Results o f the Left Straights to the Head
Metric Test Mean SD P Value Effect
TRT Pre 0.650 0.244 0.259 PositivePost 0.599 0.156
CNS Pre 0.544 0.287 0.112 PositivePost 0.416 0.131
PNS Pre 0.110 0.060 0.120 NegativePost 0.181 0.047
Max LP Pre 349.044 250.766 0.057 NegativePost 313.649 229.737
Avg LP Pre 201.547 119.776 0.444 NegativePost 193.076 133.511
Max RP Pre 1081.191 470.246 0.614 NegativePost 1019.314 439.239
Avg RP Pre 655.017 290.283 0.341 NegativePost 580.461 249.451
Max TP Pre 1313.283 564.894 0.482 NegativePost 1235.690 547.648
Avg TP Pre 856.566 362.292 0.268 NegativePost 773.537 352.948
Accuracy Pre 53.459 19.909 0.175 NegativePost 60.450 25.495
Note: Results are based on collective strike total of all participants.
43

Table 8. Results o f the Right Hooks to the Body
Metric Test Mean SD P Value Effect
TRT Pre 0.757 0.157 0.434 PositivePost 0.722 0.119
CNS Pre 0.405 0.128 0.443 PositivePost 0.360 0.072
PNS Pre 0.353 0.082 0.757 NegativePost 0.362 0.068
Max LP Pre 609.013 479.882 0.365 PositivePost 6651.842 14730.275
Avg LP Pre 462.477 385.689 0.365 PositivePost 2728.173 5464.906
Max RP Pre 304.828 338.262 0.335 PositivePost 2435.572 4796.890
Avg RP Pre 204.240 224.454 0.314 PositivePost 1045.803 1794.272
Max TP Pre 885.572 576.510 0.358 PositivePost 9046.593 19494.477
Avg TP Pre 666.718 449.817 0.351 PositivePost 3773.977 7215.257
Accuracy Pre 73.502 45.377 0.797 PositivePost 70.760 39.500
Note: Results are based on collective strike total of all participants.
44
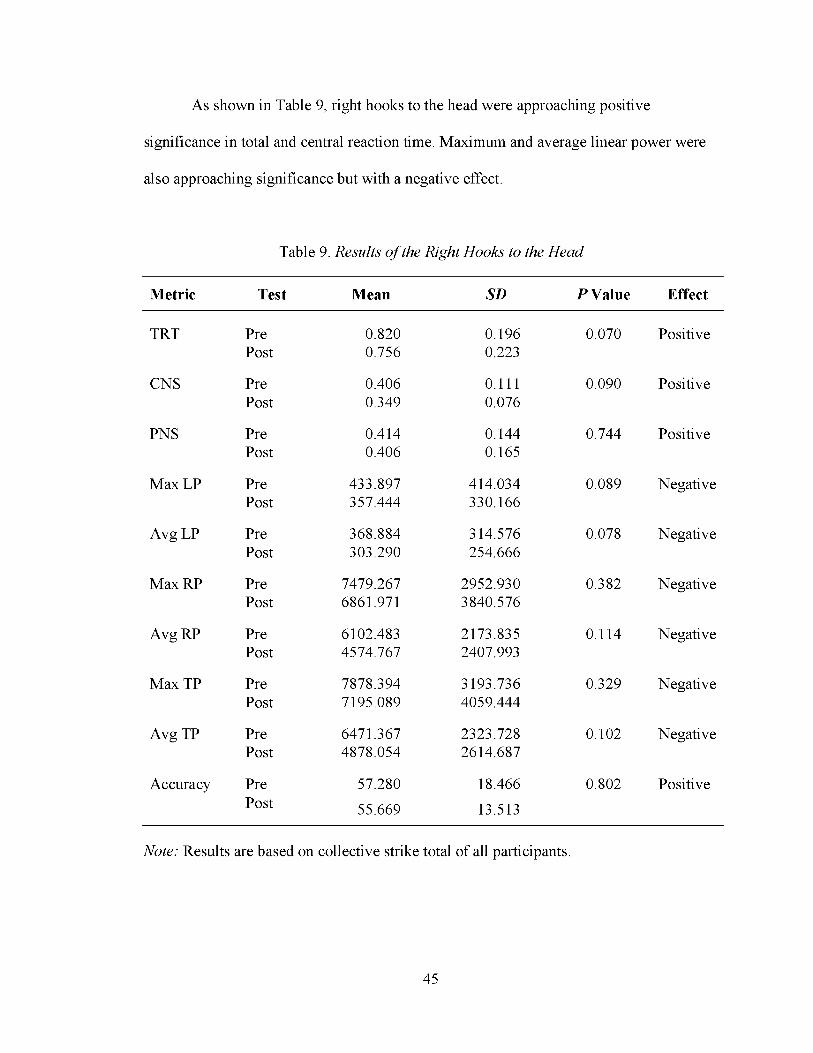
As shown in Table 9, right hooks to the head were approaching positive
significance in total and central reaction time. Maximum and average linear power were
also approaching significance but with a negative effect.
Table 9. Results o f the Right Hooks to the Head
Metric Test Mean SD P Value Effect
TRT Pre 0.820 0.196 0.070 PositivePost 0.756 0.223
CNS Pre 0.406 0.111 0.090 PositivePost 0.349 0.076
PNS Pre 0.414 0.144 0.744 PositivePost 0.406 0.165
Max LP Pre 433.897 414.034 0.089 NegativePost 357.444 330.166
Avg LP Pre 368.884 314.576 0.078 NegativePost 303.290 254.666
Max RP Pre 7479.267 2952.930 0.382 NegativePost 6861.971 3840.576
Avg RP Pre 6102.483 2173.835 0.114 NegativePost 4574.767 2407.993
Max TP Pre 7878.394 3193.736 0.329 NegativePost 7195.089 4059.444
Avg TP Pre 6471.367 2323.728 0.102 NegativePost 4878.054 2614.687
Accuracy Pre 57.280 18.466 0.802 PositivePost 55.669 13.513
Note: Results are based on collective strike total of all participants.
45

Right straights to the head contained a significant positive effect on total and
central reaction time, matching the overall trend. Accuracy demonstrated a significant
negative effect (see Table 10). However, left kicks to the head or leg demonstrated no
significance (see Table 11 and Table 12 respectively).
Table 10. Results o f the Right Straights to the Head
Metric Test Mean SD P Value Effect
TRT Pre 0.704 0.177 *0.035 PositivePost 0.644 0.155
CNS Pre 0.426 0.078 *0.031 PositivePost 0.364 0.093
PNS Pre 0.281 0.129 0.966 PositivePost 0.280 0.092
Max LP Pre 610.080 556.572 0.151 NegativePost 537.253 493.420
Avg LP Pre 359.597 286.219 0.149 NegativePost 317.689 251.548
Max RP Pre 4086.434 2404.181 0.521 NegativePost 3868.514 2879.987
Avg RP Pre 2142.634 989.002 0.313 NegativePost 1971.804 1072.809
Max TP Pre 4648.576 2936.377 0.415 NegativePost 4355.061 3359.091
Avg TP Pre 2502.234 1252.908 0.254 NegativePost 2289.497 1301.058
Accuracy Pre 60.290 21.762 *0.036 NegativePost 79.361 32.710
Note: Results are based on collective strike total of all participants.
46
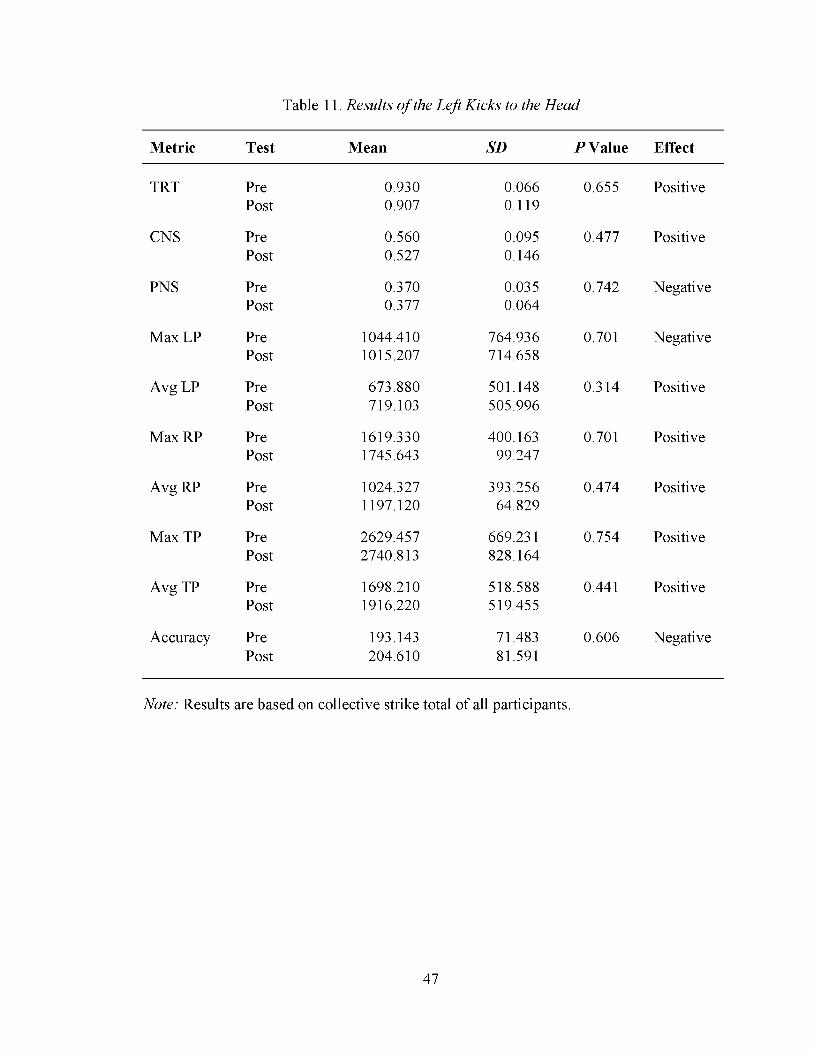
Table 11. Results o f the Left K icks to the H ead
Metric Test Mean SD P Value Effect
TRT Pre 0.930 0.066 0.655 PositivePost 0.907 0.119
CNS Pre 0.560 0.095 0.477 PositivePost 0.527 0.146
PNS Pre 0.370 0.035 0.742 NegativePost 0.377 0.064
Max LP Pre 1044.410 764.936 0.701 NegativePost 1015.207 714.658
Avg LP Pre 673.880 501.148 0.314 PositivePost 719.103 505.996
Max RP Pre 1619.330 400.163 0.701 PositivePost 1745.643 99.247
Avg RP Pre 1024.327 393.256 0.474 PositivePost 1197.120 64.829
Max TP Pre 2629.457 669.231 0.754 PositivePost 2740.813 828.164
Avg TP Pre 1698.210 518.588 0.441 PositivePost 1916.220 519.455
Accuracy Pre 193.143 71.483 0.606 NegativePost 204.610 81.591
Note: Results are based on collective strike total of all participants.
47
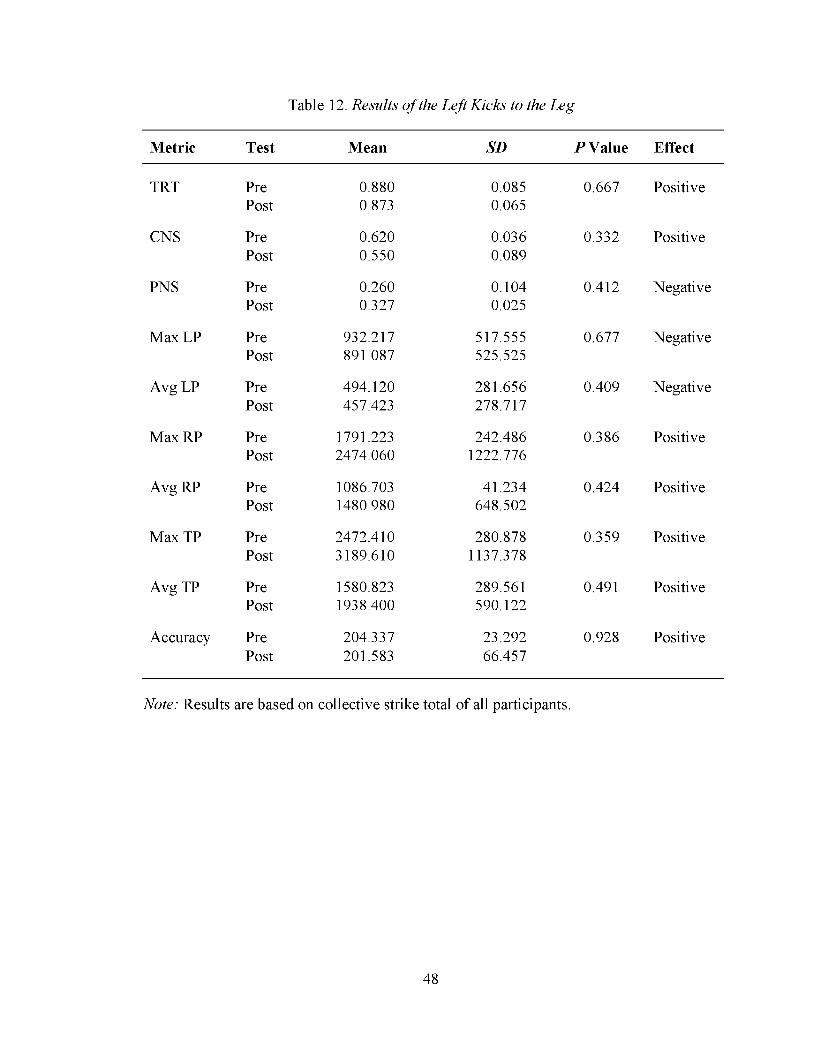
Table 12. Results o f the Left K icks to the Leg
Metric Test Mean SD P Value Effect
TRT Pre 0.880 0.085 0.667 PositivePost 0.873 0.065
CNS Pre 0.620 0.036 0.332 PositivePost 0.550 0.089
PNS Pre 0.260 0.104 0.412 NegativePost 0.327 0.025
Max LP Pre 932.217 517.555 0.677 NegativePost 891.087 525.525
Avg LP Pre 494.120 281.656 0.409 NegativePost 457.423 278.717
Max RP Pre 1791.223 242.486 0.386 PositivePost 2474.060 1222.776
Avg RP Pre 1086.703 41.234 0.424 PositivePost 1480.980 648.502
Max TP Pre 2472.410 280.878 0.359 PositivePost 3189.610 1137.378
Avg TP Pre 1580.823 289.561 0.491 PositivePost 1938.400 590.122
Accuracy Pre 204.337 23.292 0.928 PositivePost 201.583 66.457
Note: Results are based on collective strike total of all participants.
48
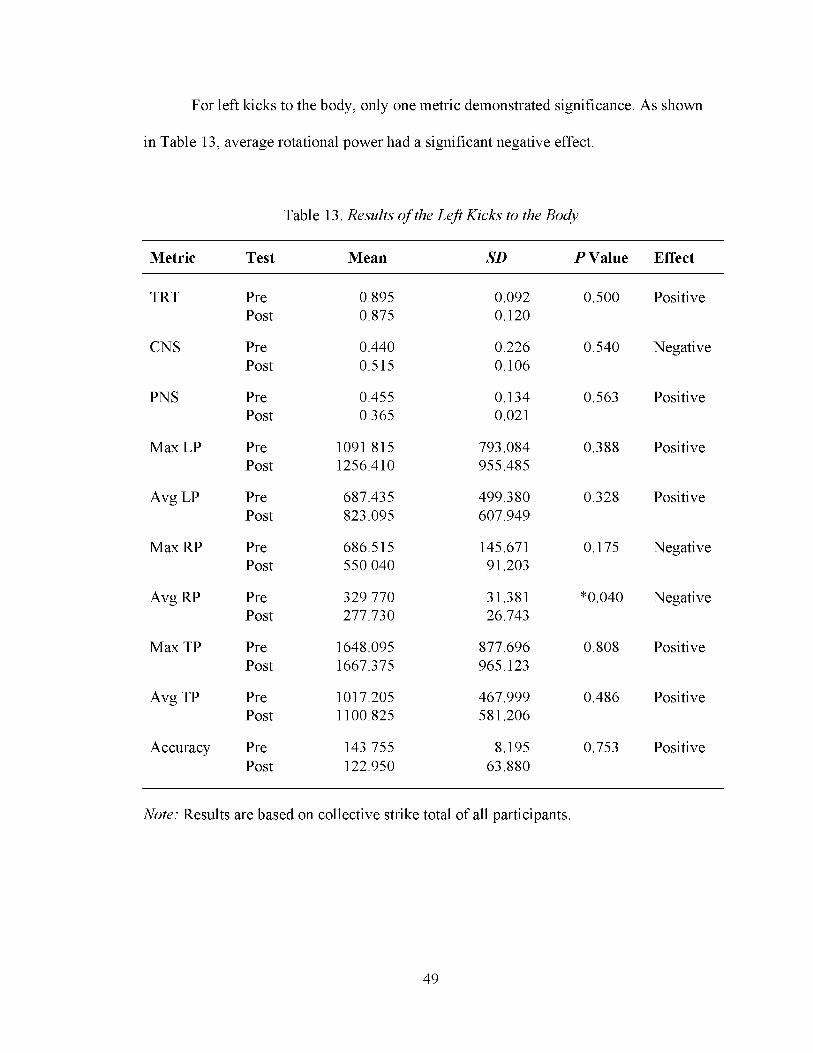
For left kicks to the body, only one metric demonstrated significance. As shown
in Table 13, average rotational power had a significant negative effect.
Table 13. Results o f the Left Kicks to the Body
Metric Test Mean SD P Value Effect
TRT Pre 0.895 0.092 0.500 PositivePost 0.875 0.120
CNS Pre 0.440 0.226 0.540 NegativePost 0.515 0.106
PNS Pre 0.455 0.134 0.563 PositivePost 0.365 0.021
Max LP Pre 1091.815 793.084 0.388 PositivePost 1256.410 955.485
Avg LP Pre 687.435 499.380 0.328 PositivePost 823.095 607.949
Max RP Pre 686.515 145.671 0.175 NegativePost 550.040 91.203
Avg RP Pre 329.770 31.381 *0.040 NegativePost 277.730 26.743
Max TP Pre 1648.095 877.696 0.808 PositivePost 1667.375 965.123
Avg TP Pre 1017.205 467.999 0.486 PositivePost 1100.825 581.206
Accuracy Pre 143.755 8.195 0.753 PositivePost 122.950 63.880
Note: Results are based on collective strike total of all participants.
49

For right kicks to the head, there was no significance. Total reaction time and
accuracy were approaching significance with a positive effect (see Table 14).
Table 14. Results o f the Right Kicks to the Head
Metric Test Mean SD P Value Effect
TRT Pre 0.940 0.113 0.060 PositivePost 0.893 0.092
CNS Pre 0.760 0.050 0.274 PositivePost 0.597 0.144
PNS Pre 0.183 0.078 0.333 NegativePost 0.300 0.234
Max LP Pre 917.460 497.762 0.403 PositivePost 964.370 563.584
Avg LP Pre 600.933 355.441 0.376 PositivePost 648.570 413.031
Max RP Pre 8001.190 2582.254 0.339 PositivePost 8964.403 3909.428
Avg RP Pre 5133.327 1406.954 0.538 PositivePost 5522.783 2146.520
Max TP Pre 8740.907 2501.395 0.339 PositivePost 9776.523 3900.394
Avg TP Pre 5734.260 1227.830 0.519 PositivePost 6171.363 2099.429
Accuracy Pre 180.643 41.158 0.061 PositivePost 172.387 39.387
Note: Results are based on collective strike total of all participants.
50
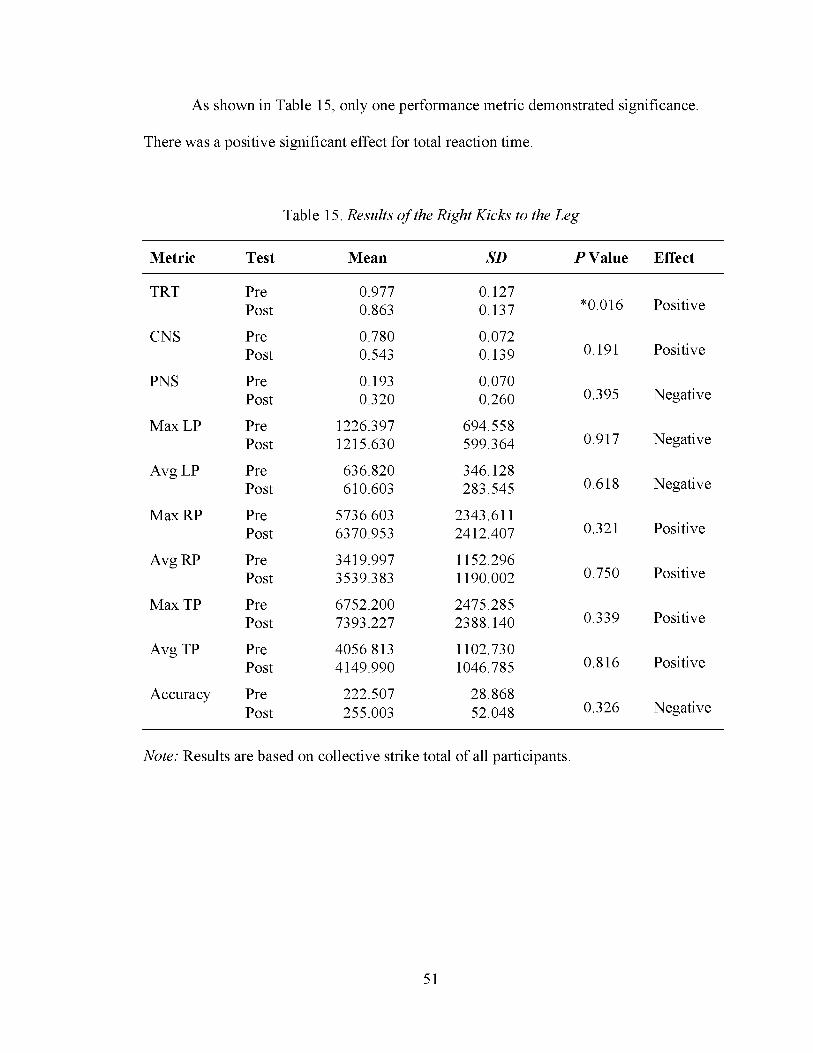
As shown in Table 15, only one performance metric demonstrated significance.
There was a positive significant effect for total reaction time.
Table 15. Results o f the Right Kicks to the Leg
Metric Test Mean SD P Value Effect
TRT Pre 0.977 0.127Post 0.863 0.137 *0.016 Positive
CNS Pre 0.780 0.072Post 0.543 0.139 0.191 Positive
PNS Pre 0.193 0.070Post 0.320 0.260 0.395 Negative
Max LP Pre 1226.397 694.558Post 1215.630 599.364 0.917 Negative
Avg LP Pre 636.820 346.128Post 610.603 283.545 0.618 Negative
Max RP Pre 5736.603 2343.611Post 6370.953 2412.407 0.321 Positive
Avg RP Pre 3419.997 1152.296Post 3539.383 1190.002 0.750 Positive
Max TP Pre 6752.200 2475.285Post 7393.227 2388.140 0.339 Positive
Avg TP Pre 4056.813 1102.730Post 4149.990 1046.785 0.816 Positive
Accuracy Pre 222.507 28.868NegativePost 255.003 52.048 0.326
Note: Results are based on collective strike total of all participants.
51
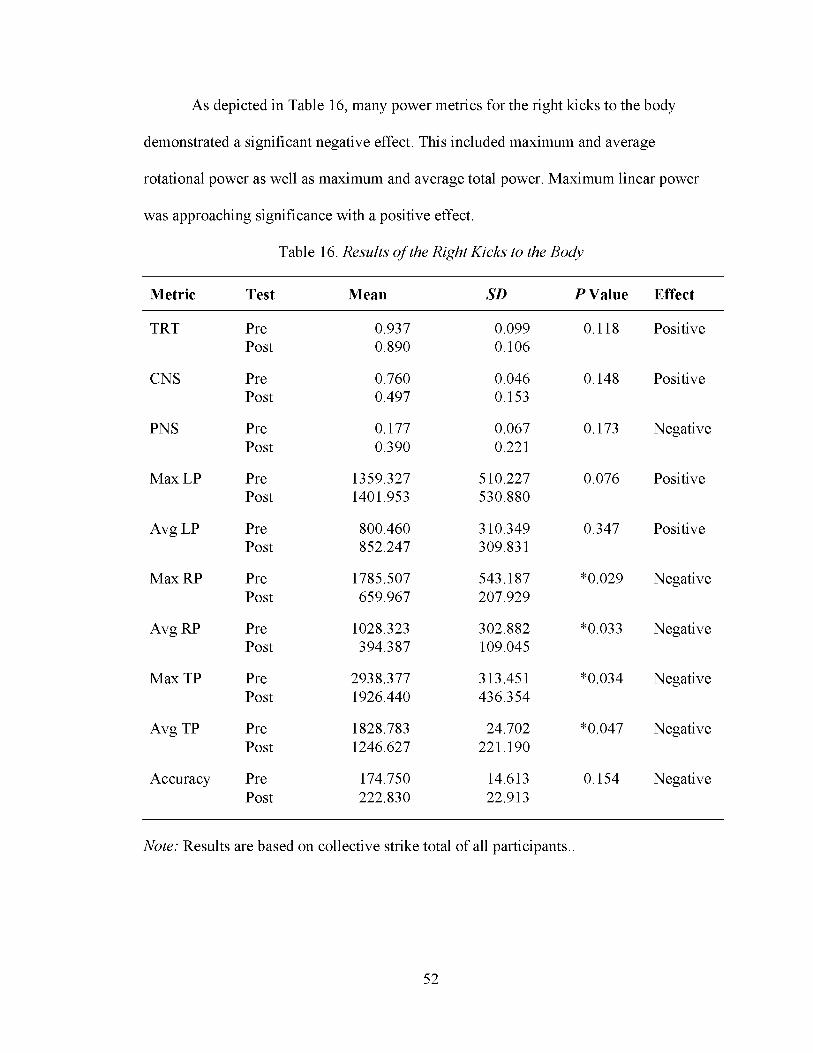
As depicted in Table 16, many power metrics for the right kicks to the body
demonstrated a significant negative effect. This included maximum and average
rotational power as well as maximum and average total power. Maximum linear power
was approaching significance with a positive effect.
Table 16. Results o f the Right Kicks to the Body
Metric Test Mean SD P Value Effect
TRT Pre 0.937 0.099 0.118 PositivePost 0.890 0.106
CNS Pre 0.760 0.046 0.148 PositivePost 0.497 0.153
PNS Pre 0.177 0.067 0.173 NegativePost 0.390 0.221
Max LP Pre 1359.327 510.227 0.076 PositivePost 1401.953 530.880
Avg LP Pre 800.460 310.349 0.347 PositivePost 852.247 309.831
Max RP Pre 1785.507 543.187 *0.029 NegativePost 659.967 207.929
Avg RP Pre 1028.323 302.882 *0.033 NegativePost 394.387 109.045
Max TP Pre 2938.377 313.451 *0.034 NegativePost 1926.440 436.354
Avg TP Pre 1828.783 24.702 *0.047 NegativePost 1246.627 221.190
Accuracy Pre 174.750 14.613 0.154 NegativePost 222.830 22.913
Note: Results are based on collective strike total of all participants..
52

Effect of Weight Cutting by Participant
The following tables present the effect of weight cutting by individual
participants. As demonstrated in Table 17, Participant 1 had a significant positive effect
on central reaction time. Total reaction time was approaching significance with a positive
effect. Accuracy had a significant negative effect.
Table 17. Results o f Participant 1
Metric Test Mean SD P Value Effect
TRT Pre 0.530 0.085 0.054 PositivePost 0.463 0.061
CNS Pre 0.345 0.063 *0.012 PositivePost 0.237 0.030
PNS Pre 0.183 0.106 0.396 NegativePost 0.227 0.050
Max LP Pre 199.812 65.642 0.180 PositivePost 10901.132 16864.272
Avg LP Pre 145.467 55.565 0.181 PositivePost 4229.785 6444.609
Max RP Pre 1980.358 2605.883 0.254 PositivePost 5150.250 4972.733
Avg RP Pre 1866.550 3173.667 0.731 PositivePost 2367.378 1894.822
Max TP Pre 2144.227 2606.340 0.197 PositivePost 16024.335 21583.778
Avg TP Pre 2012.020 3208.973 0.289 PositivePost 6597.162 8037.340
Accuracy Pre 53.923 20.548 *0.015 NegativePost 79.940 30.675
Note: Results are based on strike styles used by participant.
53

Participant 2 demonstrated no significance for any metric as depicted in Table 18.
Central reaction time was approaching significance with a positive effect.
Table 18. Results o f Participant 2
Metric Test Mean SD P Value Effect
TRT Pre 0.738 0.137 0.235 PositivePost 0.721 0.120
CNS Pre 0.518 0.166 0.080 PositivePost 0.461 0.136
PNS Pre 0.220 0.151 0.234 NegativePost 0.260 0.091
Max LP Pre 379.547 160.420 0.480 NegativePost 364.681 180.919
Avg LP Pre 242.023 88.873 0.919 PositivePost 243.176 106.959
Max RP Pre 2372.250 2322.774 0.578 NegativePost 2196.050 2726.152
Avg RP Pre 1658.783 1764.360 0.288 NegativePost 1392.992 1688.033
Max TP Pre 2644.677 2309.774 0.584 NegativePost 2474.170 2717.905
Avg TP Pre 1900.809 1765.807 0.284 NegativePost 1636.168 1688.965
Accuracy Pre 131.283 75.038 0.147 NegativePost 144.253 85.507
Note: Results are based on strike styles used by participant.
54
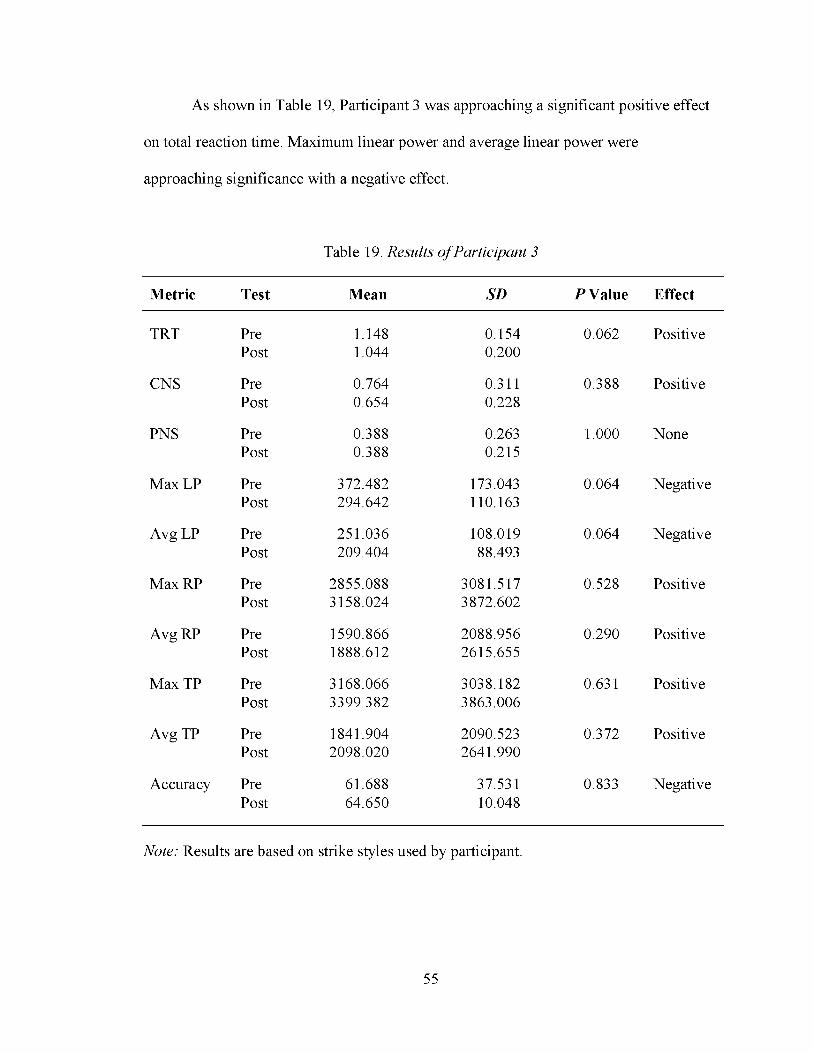
As shown in Table 19, Participant 3 was approaching a significant positive effect
on total reaction time. Maximum linear power and average linear power were
approaching significance with a negative effect.
Table 19. Results o f Participant 3
Metric Test Mean SD P Value Effect
TRT Pre 1.148 0.154 0.062 PositivePost 1.044 0.200
CNS Pre 0.764 0.311 0.388 PositivePost 0.654 0.228
PNS Pre 0.388 0.263 1.000 NonePost 0.388 0.215
Max LP Pre 372.482 173.043 0.064 NegativePost 294.642 110.163
Avg LP Pre 251.036 108.019 0.064 NegativePost 209.404 88.493
Max RP Pre 2855.088 3081.517 0.528 PositivePost 3158.024 3872.602
Avg RP Pre 1590.866 2088.956 0.290 PositivePost 1888.612 2615.655
Max TP Pre 3168.066 3038.182 0.631 PositivePost 3399.382 3863.006
Avg TP Pre 1841.904 2090.523 0.372 PositivePost 2098.020 2641.990
Accuracy Pre 61.688 37.531 0.833 NegativePost 64.650 10.048
Note: Results are based on strike styles used by participant.
55

Similarly, Participant 4 exhibited approaching significance for a positive effect
for total reaction time. Maximum linear power and accuracy were approaching
significance in a negative direction.
Table 20. Results o f Participant 4
Metric Test Mean SD P Value Effect
TRT Pre 0.781 0.129 0.071 PositivePost 0.745 0.090
CNS Pre 0.532 0.168 0.178 PositivePost 0.479 0.085
PNS Pre 0.250 0.111 0.578 NegativePost 0.265 0.083
Max LP Pre 1050.905 350.142 0.077 NegativePost 963.700 358.460
Avg LP Pre 637.337 183.519 0.474 NegativePost 610.917 185.838
Max RP Pre 3313.508 3572.369 0.577 NegativePost 3115.967 3940.590
Avg RP Pre 2061.255 2328.730 0.592 NegativePost 1943.825 2460.350
Max TP Pre 4206.982 3541.391 0.550 NegativePost 3976.999 3943.830
Avg TP Pre 2698.593 2321.113 0.551 NegativePost 2554.738 2455.870
Accuracy Pre 108.879 68.282 0.063 NegativePost 130.071 95.519
Note: Results are based on strike styles used by participant.
56

As shown in Table 21, there was no significance for Participant 5. Central
reaction time was approaching significance for a positive effect, and peripheral reaction
time was approaching significance for a negative effect.
Table 21. Results o f Participant 5
Metric Test Mean SD P Value Effect
TRT Pre 0.889 0.156 0.111 PositivePost 0.858 0.157
CNS Pre 0.566 0.186 0.058 PositivePost 0.446 0.135
PNS Pre 0.325 0.086 0.087 NegativePost 0.413 0.141
Max LP Pre 1383.897 315.240 0.839 PositivePost 1393.318 377.231
Avg LP Pre 884.832 224.733 0.978 NegativePost 883.694 285.557
Max RP Pre 3397.565 3624.022 0.197 PositivePost 3702.542 4093.157
Avg RP Pre 2023.241 2281.910 0.511 PositivePost 2103.009 2461.920
Max TP Pre 4695.473 3709.028 0.162 PositivePost 5006.048 4093.752
Avg TP Pre 2908.072 2320.362 0.539 PositivePost 2986.705 2445.450
Accuracy Pre 125.984 80.017 0.375 PositivePost 119.083 75.539
Note: Results are based on strike styles used by participant.
57
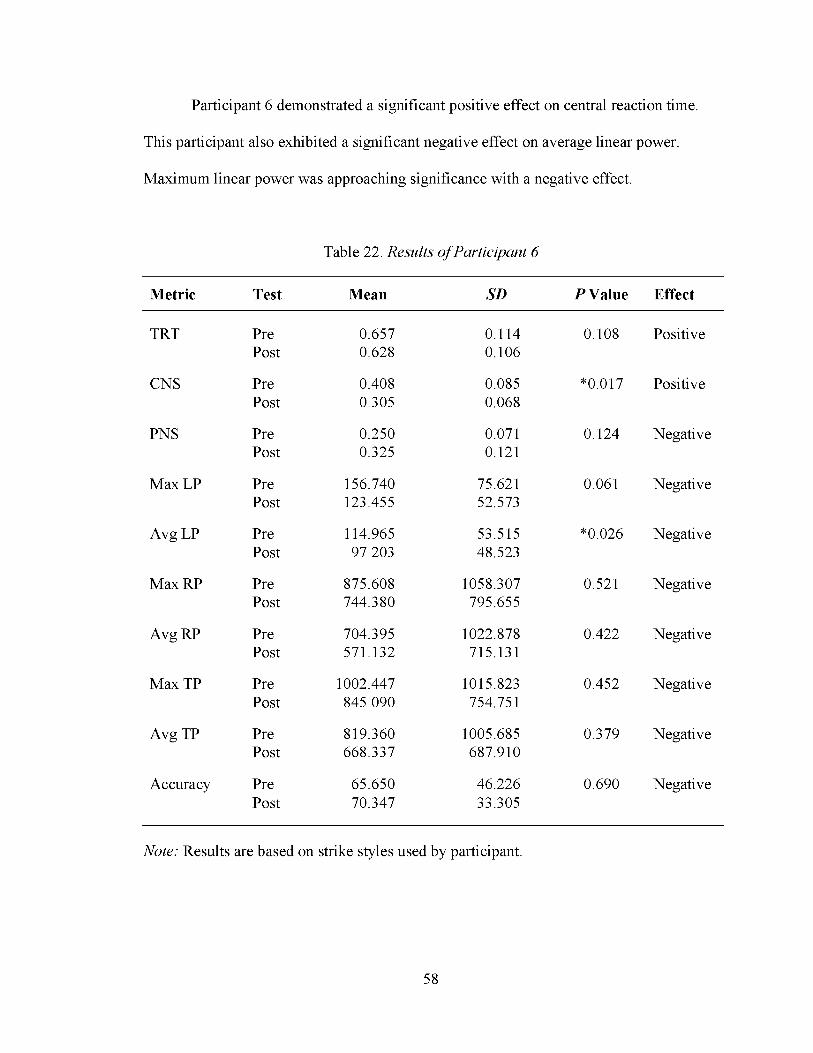
Participant 6 demonstrated a significant positive effect on central reaction time.
This participant also exhibited a significant negative effect on average linear power.
Maximum linear power was approaching significance with a negative effect.
Table 22. Results o f Participant 6
Metric Test Mean SD P Value Effect
TRT Pre 0.657 0.114 0.108 PositivePost 0.628 0.106
CNS Pre 0.408 0.085 *0.017 PositivePost 0.305 0.068
PNS Pre 0.250 0.071 0.124 NegativePost 0.325 0.121
Max LP Pre 156.740 75.621 0.061 NegativePost 123.455 52.573
Avg LP Pre 114.965 53.515 *0.026 NegativePost 97.203 48.523
Max RP Pre 875.608 1058.307 0.521 NegativePost 744.380 795.655
Avg RP Pre 704.395 1022.878 0.422 NegativePost 571.132 715.131
Max TP Pre 1002.447 1015.823 0.452 NegativePost 845.090 754.751
Avg TP Pre 819.360 1005.685 0.379 NegativePost 668.337 687.910
Accuracy Pre 65.650 46.226 0.690 NegativePost 70.347 33.305
Note: Results are based on strike styles used by participant.
58
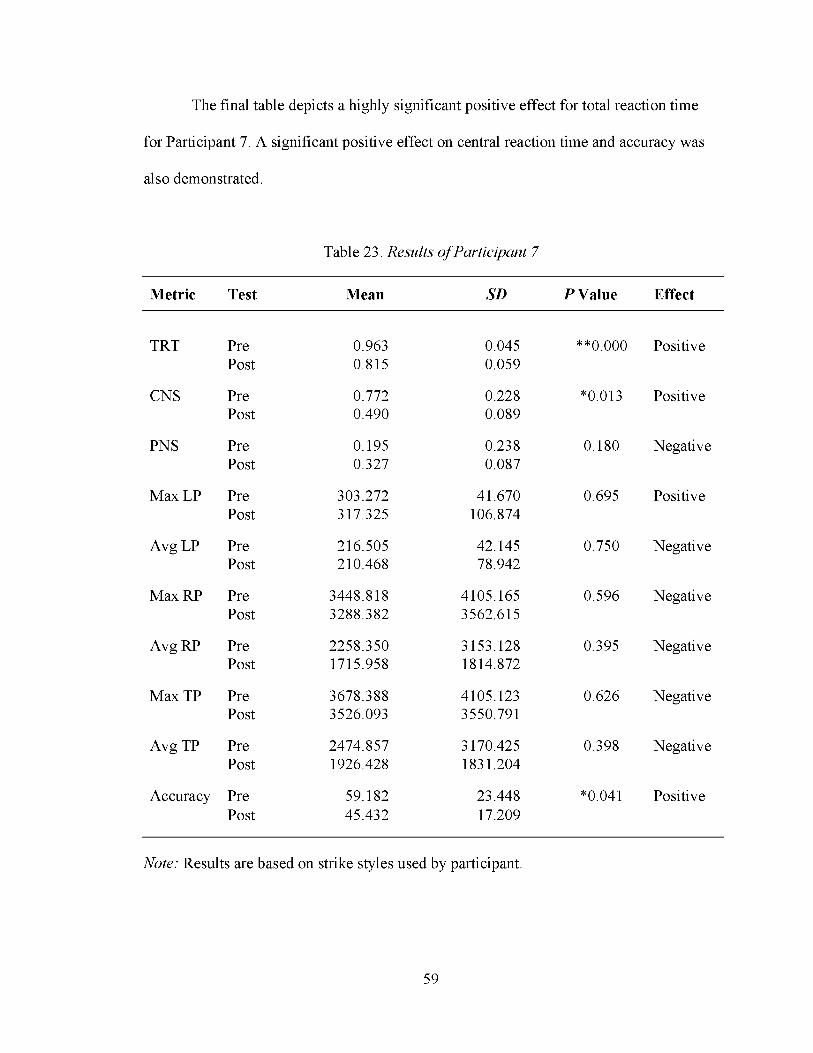
The final table depicts a highly significant positive effect for total reaction time
for Participant 7. A significant positive effect on central reaction time and accuracy was
also demonstrated.
Table 23. Results o f Participant 7
Metric Test Mean SD P Value Effect
TRT Pre 0.963 0.045 **0.000 PositivePost 0.815 0.059
CNS Pre 0.772 0.228 *0.013 PositivePost 0.490 0.089
PNS Pre 0.195 0.238 0.180 NegativePost 0.327 0.087
Max LP Pre 303.272 41.670 0.695 PositivePost 317.325 106.874
Avg LP Pre 216.505 42.145 0.750 NegativePost 210.468 78.942
Max RP Pre 3448.818 4105.165 0.596 NegativePost 3288.382 3562.615
Avg RP Pre 2258.350 3153.128 0.395 NegativePost 1715.958 1814.872
Max TP Pre 3678.388 4105.123 0.626 NegativePost 3526.093 3550.791
Avg TP Pre 2474.857 3170.425 0.398 NegativePost 1926.428 1831.204
Accuracy Pre 59.182 23.448 *0.041 PositivePost 45.432 17.209
Note: Results are based on strike styles used by participant.
59
In this chapter, I have presented all of the results and multi layers of statistical
analysis. This included the overall effect and then investigating this effect isolated to the
upper and lower body. A further breakdown was depicted by examining a potential effect
at the individual strike level and, lastly, the effects by individual participant. Effect trends
and discussion points will be presented in the next chapter.
Chapter Summary
60
Chapter 5: Discussion
It is my aim in this chapter to present the novelty of this research and how it adds
to the literature. Also, I intend to examine the trends demonstrated in the results at each
stage of analysis for each metric and to compare them to existing conclusions in the
literature. Lastly, this discussion will provide an insight on the implications for
practitioners of mixed martial arts and suggestions for future research.
Pilot Investigation
Comparisons to conclusions from the literature will be few, as this investigation
was the first of its kind in a variety of aspects regarding weight cutting. For example, this
was the first study to use only mixed martial arts practitioners or striking performance in
mixed martial arts. Another first involved the focus on striking performance from a
biomechanical perspective. Finally, this study was the first to allow a full 24-hour
rehydration and re-feed to represent the chronology of mixed martial arts weigh-ins and
competitions.
More importantly, this study was the first to investigate weight cutting from the
perspective of reaction time or accuracy. While the work was pilot in the previously
listed areas, it was the third to allow a self-selected weight cutting regimen. Previous self
selected weight loss studies used dynamometers to assess work and strength and did not
allow the 24-hour rehydration found in mixed martial arts (Oopik et al., 2002; Timpmann
et al., 2008).
Overall Trends
The results indicated that there was a highly significant positive effect on total
and central nervous reaction time, but a highly significant negative effect on peripheral
61
reaction time (see Appendix C). That is, weight cutting unequivocally decreased the
reaction time from the central nervous system from an overall pre- to post-perspective,
which was in direct opposition to the hypothesis. However, peripheral reaction time from
an overall perspective did increase, as hypothesized. The negative effect on peripheral
reaction was overridden by the positive effect so much so that at the overall level of
analysis, there was a highly significant positive effect on the total reaction time from this
overall perspective. That is to say, there was a decrease in total reaction time. This was a
rejection of the hypothesis. This suggests a mitigating effect of enough central recovery
to nullify the peripheral reaction deficits.
Similarly, in rejection of the hypothesis, all metrics of power showed no
significance. This null effect on power outputs is in line with the summary conclusion on
the effect of weight cutting on power as presented by Horswill (2009). This conclusion
was based across combative sports and was cited in chapter one: essentially stating that
repeated short-duration high-intensity performances are less likely to be adversely
effected. When combined with an element of endurance, which there was not in this
investigation, power is more likely to show decrements. Given the measurements were
investigating a compilation of single strikes, there was not an endurance element present
in this study. However, accuracy was approaching significance with a negative effect. It
was hypothesized that accuracy would be affected negatively.
In summary, the overall trends were that of an increase in peripheral reaction time
and a decrease in central reaction time. The decrease in central reaction time was enough
to diminish the decrease in peripheral reaction time so much so that there was a decrease
in total reaction time. This suggests that a 24-hour recovery period between weighing in
62

and competing is sufficient to allow cognitive recovery. This trend may not hold with
increased weight lost or decreased recovery time.
Trends by Hand and Foot Strikes
When moving deeper into the data, shifting from an all-encompassing overview to
accounting for differences between upper and lower body strikes, these trends remained
(see Appendix D). For hand strikes, there was a highly significant positive effect on total
reaction time and central reaction (i.e., decreased total and central reaction time) and a
significant negative effect on peripheral reaction (i.e., increased peripheral reaction time).
Foot strikes demonstrated the exact trends: that is, highly significant positive effect on
total and central reaction time (i.e., decreased total and central reaction time) and a
significant negative effect on peripheral reaction time (i.e., increased peripheral reaction
time). Again, only the peripheral reaction time supported the hypothesis. Matching the
overall trends, power and its components did not demonstrate significance, rejecting the
hypothesis. Again, this matched the conclusion as presented by Horswill (2009) that
power will not be affected in short-duration high-intensity movements.
In short, the overall trends were upheld, that is: a decrease in total and central
reaction time and an increase in peripheral reaction time. The suggestion that 24 hours is
enough to recover from this weight cut is maintained. However, would this continue with
more weight lost or decreased recovery time?
Trends by Individual Strike
Reaction time components. Digging deeper into the data, the trends become less
clear, suggesting variability in the effect of weight cutting by a selected strike style (see
Appendix E). For reaction time trends, the significant (*) or highly significant (**)
63
positive effect (i.e., decreased reaction time) on total reaction time manifested for left
hooks to the body (**), right straights to the head (*), and right kicks to the leg (*). Right
hooks to the head and right kicks to the head were approaching a positive significance:
that is, a decreased reaction time. Central reaction time demonstrated a significant
positive effect for left hooks to the body (*) and right straights to the head (*). Right
hooks to the head were approaching significance with a positive effect. The mitigating
effect of faster central reaction covering up deficits in peripheral reaction appeared to
wane at the individual strike. There was no significance on peripheral reaction time.
Power components. At this level of analysis, components of power began to
approach or achieve significance (see Appendix E). There was no clear pattern appearing
in the power components. Only left and right kicks to the body demonstrated a significant
negative effect. Left kicks to the body had a significant negative effect on average
rotational power. Right kicks to the body revealed a significant negative effect on
maximum and average rotational powers as well as on maximum and average total
powers. Both of these strikes saw a decrease in power. It should be noted that left
straights to the head and right kicks to the body were approaching a negative significance
in maximum linear power, while right hooks to the head were approaching negative
significance for both maximum and average linear power. This provided mixed results
and no conclusion on the effect on power by individual strike style.
Accuracy. Similar to power, accuracy began to occasionally show a negative
effect (see Appendix E). There was a significant negative effect on right straights to the
head, as well as right kicks to the head approaching a significant positive effect. This did
64
not maintain the approaching trend found at the overall level and no conclusion on a
negative effect on accuracy within strike style.
Trends by Individual Participant
Trends at the level of the participants are presented and discussed in relation to
each individual. It needs to be noted that there were no clear consistent patterns (see
Appendix F).
1. Participant 1 demonstrated a significant positive effect on central reaction
time and a significant negative effect on accuracy. Total reaction time was
approaching a positive significance.
2. Participant 2 depicted a positive effect approaching significance in central
reaction time.
3. Participant 3 was approaching significance with a positive effect on total
reaction time. There was also an approaching significance with a negative
effect on maximum and average linear power.
4. Participant 4 was approaching a positive significance for total reaction time.
Also, there was an approaching negative significance for maximum linear
power and accuracy.
5. Participant 5 was approaching significance in the positive direction for central
reaction time and in the negative direction for peripheral reaction time.
6. Participant 6 demonstrated a significant positive effect on central reaction
time. Maximum linear power was approaching a negative significance, and
average linear power demonstrated a negative significance.
65

7. Participant 7 portrayed a highly significant positive effect on total reaction
time. Central reaction time demonstrated a significant positive effect and, as
an outlier, demonstrated a significant positive effect on accuracy.
These results have demonstrated a large variability between subjects. However,
the overall trends of decreased total and central reaction time continually appeared. This
individual variability at the participant level suggests that certain athletes are better able
to handle or recover from dehydration. An athlete will develop their own habits and
comforts with weight loss and, like any learning, should improve with each successive
attempt at the practice.
Conclusion
These findings suggest a large variability in all metrics on the effect of weight
cutting based on not only strike style, but also on participant. This notion of individual
ability to tolerate weight loss was presented in the only two studies to have investigated
striking performance related to weight cutting. Both studies were focused on boxers and
did not include any recovery time post weight cut. While both found a negative effect on
striking performance, the concept that some individuals appeared predisposed to better
handle dehydration and not demonstrate performance decrements was put forward (M. S.
Smith et al., 2000). Similarly, this investigation confirmed some athletes demonstrate no
decrement and may even improve performance (M. Smith et al., 2001). It should be noted
that both studies used padding over a force plate as their measurement of performance.
This investigation expanded on the concept of performance, including not just
power components, but the movement component of peripheral reaction time and the
cognitive elements of central reaction time and accuracy. In that regard, an overall
66

negative effect on peripheral reaction time and a positive effect on total reaction time
were found. However, there appeared to be a mitigating effect of central reaction time
decreasing enough to override the negative effect on peripheral reaction time. It is worth
noting that peripheral reaction time and accuracy only had a positive significant effect
once across the 12 strike styles and seven subjects
This suggests that a 24-hour time window of recovery appears to be enough to
recover central reaction time and muscular power, but not peripheral reaction from a 5%
weight cut. As stated earlier, the results on power were inconclusive, reaffirming the
conclusion put forward by Horswill (2009). That is that in a repeated short-duration high-
intensity performance, power is less likely to be affected adversely.
It is of interest that all eight participants not in a real competition articulated that
the weight lost for a 5% body weight was far less than their normal practices for
competition, and most suggested they could lose the 5% in a matter of hours. The
protocol required them to use at least 24 hours to cut weight. The remaining four were in
real competition, where three did not need a full 5% reduction to achieve their weight
class. The last competitor lost 18% of his body weight to achieve his necessary weigh in.
Also, for the four participants in real competition, as the researcher, I had a
concern about interfering with pre competition/game day habits. Each competitor stated
sentiments regarding enjoying the distraction of being a test subject and that the testing
helped take their minds off of the impending “fight”, reducing anxiety and stress.
Implications for Practitioners
The findings of this investigation suggest that weight cutting can be used as a
practice with little detriment if used sparingly and in moderation. Potential detriments
67
associated with a 5% body weight reduction or less appear to be able to be mitigated by
the allotted 24-hour period between weigh-ins and competition in all measured areas
except peripheral reaction time. As stated earlier, this effect seems to be compensated by
a decrease in central reaction time.
These findings might lead athletes and participants to consider utilizing weight
cutting practices because of the decreased reaction times, but with slower muscular
movements (i.e., peripheral reaction time), the ability to physically keep up with the
mental strategies and reactions could be detrimental. For example, upon seeing an
opening, an athlete might be unable to effectively capitalize on said defensive opening.
Another example could be an athlete seeing an incoming attack and being unable to
effectively move out of range, block, and/or counter in time.
Implications for Future Research
Further research is needed to expand on the phenomenon of weight cutting and
striking performance. Firstly, to reduce the variation in power outputs, participants could
be limited to a singular weight class. With power being linked to body weight, isolating
to a single weight class would allow a more accurate investigation. Also, a weight cut
larger than 5% of body weight as well as further studies into the effect on reaction time
and accuracy is recommended. Correspondingly, I suggest a more effective test could be
applied more efficiently in the competition setting to avoid laboratory-mandated weight
loss and investigate the phenomenon in its real life setting. Lastly, future research could
isolate within a single common strike style to provide more homogenous data.
68

References
American Academy of Pediatrics Committee on Sports Medicine and Fitness. (2005).Promotion of healthy weight-control practices in young athletes. Pediatrics, 116, 1557-1564. doi: 10.1542/peds.2005-2314
American College of Sports Medicine. (1976). Position stand on weight loss in wrestlers. Medicine and Science in Sports and Exercise,, 8, xi-xiii.
American College of Sports Medicine, American Dietetic Association, and Dietitians of Canada. (2000). Joint position statement: Nutrition and athletic performance. Medicine and Science in Sports and Exercise, 32, 2130-2145.
Artioli, G. G., Gualano, B., Franchini, E., Scagliusi, F. B., Takesian, M., Fuchs, M., & Lancha, A. H., Jr. (2010). Prevalence, magnitude, and methods of rapid weight loss among judo competitors. Medicine and Science in Sports and Exercise, 42, 436-442. doi: 10.1249/MSS.0b013e3181ba8055
Baker, L. B., Dougherty, K. A., Chow, M., & Kenney, W. L. (2007). Progressive dehydration causes a progressive decline in basketball skill performance.Medicine and Science in Sports and Exercise, 39, 1114-1123. doi: 10.1249/mss.0b013e3180574b02
Barr, S. I. (1999). Effects of dehydration on exercise performance. Canadian Journal of Applied Physiology, 24(2), 164-172.
Basmajian, J. V., & De Luca, C. J. (1985). Muscles alive: Their functions revealed by electromyography (5th ed.). Baltimore, MD: Williams & Wilkins.
Beljaeva, T., & Oopik, V. (2001). Nutritional habits of collegiate combat sports athletes. Acta Kinesiologiae Universitatis Tartuensis, 6(Suppl), 81-84.
Brownell, K. D., & Steen, S. N. (1992). Weight cycling in athletes: Effects on behavior, physiology, and health. In K. D. Brownell (Ed.), Eating, body weight and performance in athletes: Disorders o f modern society (pp. 159-171). Malvern,PA: Lea & Febieger.
Brownell, K. D., Steen, S. N., & Wilmore, J. H. (1987). Weight regulation practices in athletes: analysis of metabolic and health effects. Medicine and Science in Sports and Exercise, 19, 546-556.
Burcham, E. C., Gerald, B. L., Hunt, A. E., & Pope, J. P. (2006). Do weight loss practices affect grades of North Louisiana High School wrestlers? Applied Research in Coaching & Athletics Annual, 21, 40-54.
Burge, C. M., Carey, M. F., & Payne, W. R. (1993). Rowing performance, fluid balance, and metabolic function following dehydration and rehydration. Medicine and Science in Sports and Exercise, 25, 1358-1364.
69

Caldwell, J. E. (1987). Diuretic therapy and exercise performance. Sports Medicine, 4(4), 290-304.
Casa, D. J., Armstrong, L. E., Hillman, S. K., Montain, S. J., Reiff, R. V., Rich, B. S., . . . Stone, J. A. (2000). National Athletic Trainers’ Association position statement: Fluid replacement for athletes. Journal o f Athletic Training, 35(2), 212-224.
Caterisano, A., Camaione, D. N., Murphy, R. T., & Gonino, V. J. (1988). The effect of differential training on isokinetic muscular endurance during acute thermally induced hypohydration. American Journal o f Sports Medicine, 16(3), 269-273.
Chang, S.-T., Evans, J., Crowe, S., Zhang, X., & Shan, G. B. (2011). An innovativeapproach for real time determination of power and reaction time in a martial arts quasi-training environment using 3D motion capture and EMG measurements. Archives o f Budo, 7(3), 185-196.
Choma, C. W., Sforzo, G. A., & Keller, B. A. (1998). Impact of rapid weight loss on cognitive function in collegiate wrestlers. Medicine and Science in Sports and Exercise, 30, 746-749.
Clarkson, P., Manore, M., Oppliger, B., Steen, S., & Walberg-Rankin, J. (1998). Methods and strategies for weight loss in athletes. Sports Science Exchange - Roundtable,9(1), 1-5.
Coyle, E. F. (2004). Fluid and fuel intake during exercise. Journal o f Sports Sciences, 22, 39-55.
Davis, S. E., Dwyer, G. B., Reed, K., Bopp, C., Stosic, J., & Shepanski, M. (2002). Preliminary investigation: The impact of the NCAA Wrestling Weight Certification Program on weight cutting. Journal o f Strength & Conditioning Research, 16, 305-307.
Degoutte, F., Jouanel, P., Begue, R. J., Colombier, M., Lac, G., Pequignot, J. M., &Filaire, E. (2006). Food restriction, performance, biochemical, psychological, and endocrine changes in judo athletes. International Journal o f Sports Medicine, 27, 9-18. doi: 10.1055/s-2005-837505 [doi]
Devlin, L. H., Fraser, S. F., Barras, N. S., & Hawley, J. A. (2001). Moderate levels of hypohydration impairs bowling accuracy but not bowling velocity in skilled cricket players. Journal o f Sports Science and Medicine, 4(2), 179-187.
Dougherty, K. A., Baker, L. B., Chow, M., & Kenney, W. L. (2006). Two percentdehydration impairs and six percent carbohydrate drink improves boys’ basketball skills. Medicine and Science in Sports and Exercise, 38, 1650-1658. doi: 10.1249/01.mss.0000227640.60736.8e
Filaire, E., Maso, F., Degoutte, F., Jouanel, P., & Lac, G. (2001). Food restriction,performance, psychological state and lipid values in judo athletes. International Journal o f Sports Medicine, 22, 454-459.
70

Finaud, J., Degoutte, F., Scislowski, V., Rouveix, M., Durand, D., & Filaire, E. (2006). Competition and food restriction effects on oxidative stress in judo. International Journal o f Sports Medicine, 27, 834-841.
Fogelholm, G. M., Koskinen, R., Laakso, J., Rankinen, T., & Ruokonen, I. (1993). Gradual and rapid weight loss: Effects on nutrition and performance in male athletes. Medicine and Science in Sports and Exercise, 25, 371-377.
Fogelholm, M. (1994). Effects of bodyweight reduction on sports performance. Sports Medicine, 18(4), 249-267.
Gauchard, G. C., Gangloff, P., Vouriot, A., Mallie, J. P., & Perrin, P. P. (2002). Effects of exercise-induced fatigue with and without hydration on static postural control in adult human subjects. International Journal o f Neuroscience, 112, 1191-1206.
Gutierrez, A., Mesa, J. L., Ruiz, J. R., Chirosa, L. J., & Castillo, M. J. (2003). Sauna- induced rapid weight loss decreases explosive power in women but not in men. International Journal o f Sports Medicine, 24, 518-522. doi: 10.1055/s-2003- 42017 [doi]
Hall, C. J., & Lane, A. M. (2001). Effects of rapid weight loss on mood and performance among amateur boxers. British Journal o f Sports Medicine, 35(6), 390-395.
Herbert, W. G., & Ribisl, P. M. (1972). Effects of dehydration upon physical working capacity of wrestlers under competitive conditions. Research Quarterly, 43(4), 416-422.
Hickner, R. C., Horswill, C. A., Welker, J. M., Scott, J., Roemmich, J. N., & Costill, D.L. (1991). Test development for the study of physical performance in wrestlers following weight loss. International Journal o f Sports Medicine, 12, 557-562.
Hoey, J. (1998). Wrestling hyperthermia and dehydration. Canadian Medical Association Journal, 158, 1171-1172.
Horswill, C. A. (1992). Applied physiology of amateur wrestling. Sports Medicine (Auckland, N.Z.), 14(2), 114-143.
Horswill, C. A. (1993). Weight loss and weight cycling in amateur wrestlers: implications for performance and resting metabolic rate. International Journal o f Sport Nutrition, 3(3), 245-260.
Horswill, C. A. (2009). Making weight in combat sports. In R. Kordi, W. A. Wallace, N. Maffulli, & R. R. Wroble (Eds.), Combat sports medicine (pp. 21-40). London, England: Springer.
Horswill, C. A., Hickner, R. C., Scott, J. R., Costill, D. L., & Gould, D. (1990). Weight loss, dietary carbohydrate modifications, and high intensity, physical performance. Medicine and Science in Sports and Exercise, 22, 470-476.
71

Horswill, C. A., Park, S. H., & Roemmich, J. N. (1990). Changes in the proteinnutritional status of adolescent wrestlers. Medicine and Science in Sports and Exercise, 22, 599-604.
Housh, T. J., Evetovich, T. K., Stout, J. R., Housh, D. J., Johnson, G. O., Briese, M. C.,& Perry, S. R. (1997). Longitudinal assessment of anthropometric growth in high school wrestlers. Journal o f Strength & Conditioning Research, 11, 159-162.
Housh, T. J., Johnson, G. O., Stout, J., & Housh, D. J. (1993). Anthropometric growth patterns of high school wrestlers. Medicine and Science in Sports and Exercise, 25, 1141-1151.
Jauhiainen, M., Laitinen, M., Penttila, I., Nousiainen, U., & Ahonen, E. (1985). Lipids and apolipoproteins A-I, B and C-II and different rapid weight loss programs (weight lifters, wrestlers, boxers and judokas). The International Journal o f Biochemistry, 17(2), 167-174.
Jones, L. C., Cleary, M. A., Lopez, R. M., Zuri, R. E., & Lopez, R. (2008). Activedehydration impairs upper and lower body anaerobic muscular power. Journal o f Strength and Conditioning Research, 22, 455-463. doi: 10.1519/JSC.0b013e3181635ba5
Judelson, D. A., Maresh, C. M., Anderson, J. M., Armstrong, L. E., Casa, D. J., Kraemer, W. J., & Volek, J. S. (2007). Hydration and muscular performance: does fluid balance affect strength, power and high-intensity endurance? Sports Medicine, 37(10), 907-921. doi: 10.2165/00007256-200737100-00006
Judelson, D. A., Maresh, C. M., Farrell, M. J., Yamamoto, L. M., Armstrong, L. E.,Kraemer, W. J., . . . Anderson, J. M. (2007). Effect of hydration state on strength, power, and resistance exercise performance. Medicine and Science in Sports and Exercise, 39, 1817-1824. doi: 10.1249/mss.0b013e3180de5f22
Karila, T. A., Sarkkinen, P., Marttinen, M., Seppala, T., Mero, A., & Tallroth, K. (2008). Rapid weight loss decreases serum testosterone. International Journal o f Sports Medicine, 29, 872-877. doi: 10.1055/s-2008-1038604
Kazemi, M., Shearer, H., & Choung, Y. S. (2005). Pre-competition habits and injuries in Taekwondo athletes. BMC Musculoskeletal Disorders, 6, 26-26.
Kijin, K., & Wookwang, C. (2004). Changes of body composition and anaerobic performance after rapid weight loss in Taekwondo players (Abstract). In V. Klisouras (Ed.), 2004 Pre-Olympic Congress: Proceedings: Volume I: Lectures- orals: Sport science through the ages (pp. 383-384). Thessaloniki, Greece: Aristotle University of Thessaloniki, Department of Physical Education & Sport Science.
Kiningham, R. B., & Gorenflo, D. W. (2001). Weight loss methods of high school wrestlers. Medicine and Science in Sports and Exercise, 33, 810-813.
72

Klinzing, J. E., & Karpowicz, W. (1986). The effects of rapid weight loss andrehydratation on a wrestling performance test. Journal o f Sports Medicine and Physical Fitness, 26(2), 149-156.
Koral, J., & Dosseville, F. (2009). Combination of gradual and rapid weight loss: Effects on physical performance and psychological state of elite judo athletes. Journal of Sports Sciences, 27, 115-120. doi: 10.1080/02640410802413214
Kowatari, K., Umeda, T., Shimoyama, T., Nakaji, S., Yamamoto, Y., & Sugawara, K. (2001). Exercise training and energy restriction decrease neutrophil phagocytic activity in judoists. Medicine and Science in Sports and Exercise, 33, 519-524.
Kraemer, W. J., Fry, A. C., Rubin, M. R., Triplett-McBride, T., Gordon, S. E., Koziris, L. P., . . . Fleck, S. J. (2001). Physiological and performance responses to tournament wrestling. Medicine and Science in Sports and Exercise, 33, 13671378.
Lakin, J. A., Steen, S. N., & Oppliger, R. A. (1990). Eating behaviors, weight loss methods, and nutrition practices among high school wrestlers. Journal of Community Health Nursing, 7(4), 223.
Landry, G. L. (1998). Short-term cognitive effects of rapid weight loss in collegiate wrestlers. Clinical Journal o f Sport Medicine, 8(4), 314-314.
Lee, S. J. (1997). The influence of rapid weight loss periods on cardiorespiratory and muscle function in taekwondo players. WTF Taekwondo, 65, 35-44.
Lenetsky, S., & Harris, N. (2012). The mixed martial arts athlete: A physiological profile. Strength and Conditioning Journal, 34(1), 32-47. doi: 10.1519/Ssc.0b013e3182389f00
Maffulli, N. (1992). Making weight: A case study of two elite wrestlers. British Journal o f Sports Medicine, 26(2), 107-110.
Magal, M., Webster, M. J., Sistrunk, L. E., Whitehead, M. T., Evans, R. K., & Boyd, J.C. (2003). Comparison of glycerol and water hydration regimens on tennis-related performance. Medicine and Science in Sports and Exercise, 35, 150-156. doi: 10.1249/01.MSS.0000043600.40490.7E
Maughan, R. J. (2003). Impact of mild dehydration on wellness and on exerciseperformance. European Journal o f Clinical Nutrition, 57(Suppl 2), S19-S23. doi: 10.1038/sj.ejcn.1601897
Maxwell, N. S., Gardner, F., & Nimmo, M. A. (1999). Intermittent running: Muscle metabolism in the heat and effect of hypohydration. Medicine and Science in Sports and Exercise, 31, 675-683.
McCargar, L. J., & Crawford, S. M. (1992). Metabolic and anthropometric changes with weight cycling in wrestlers. Medicine and Science in Sports and Exercise, 24, 1270-1275.
73
McGregor, S. J., Nicholas, C. W., Lakomy, H. K., & Williams, C. (1999). The influence of intermittent high-intensity shuttle running and fluid ingestion on the performance of a soccer skill. Journal o f Sports Sciences, 17, 895-903.
McMurray, R. G., Proctor, C. R., & Wilson, W. L. (1991). Effect of caloric deficit and dietary manipulation on aerobic and anaerobic exercise. International Journal o f Sports Medicine, 12, 167-172.
Melby, C. L., Schmidt, W. D., & Corrigan, D. (1990). Resting metabolic rate in weightcycling collegiate wrestlers compared with physically active, noncycling control subjects. American Journal o f Clinical Nutrition, 52, 409-414.
Meriam, J. L., & Kraige, L. G. (2008). Engineering mechanics (SI, 6th ed.). New York, NY: John Wiley.
Mihoces, G. (2008, August 2). U.S. captain Cormier hospitalized, out of Games. USA Today. Retrieved fromhttp://usatoday30.usatoday.com/sports/olympics/beijing/wrestling/2008-08-21-cormier-withdrawn_N.htm
Montain, S. J. (2008). Hydration recommendations for sport 2008. Current Sports Medicine Reports, 7(4), 187-192. doi: 10.1249/JSR.0b013e31817f005f
Montain, S. J., Smith, S. A., Mattot, R. P., Zientara, G. P., Jolesz, F. A., & Sawka, M. N. (1998). Hypohydration effects on skeletal muscle performance and metabolism: A 31P-MRS study. Journal o f Applied Physiology, 84(6), 1889-1894.
Murray, B. (2007). Hydration and physical performance. Journal o f the American College o f Nutrition, 26(Suppl. 5), 542S-548S. doi: 26/suppl_5/542S [pii]
Nelson, W. B. (1962). Relationship o f weight cutting to certain physical growth factors in selected high school wrestlers in Minnesota. (Master’s thesis, Mankato State College, Mankato, Minnesota)
Ngai, K. M., Levy, F., & Hsu, E. B. (2008). Injury trends in sanctioned mixed martial arts competition: A 5-year review from 2002 to 2007. British Journal o f Sports Medicine, 42, 686-689. doi: 10.1136/bjsm.2007.044891
Nitzke, S. A., Voichick, J. S., & Olson, D. (1992). Weight cycling practices and longterm health conditions in a sample of former wrestlers and other collegiate athletes. Journal o f Athletic Training, 27(3), 257-258; 260-261.
Ohta, S., Nakaji, S., Suzuki, K., Totsuka, M., Umeda, T., & Sugawara, K. (2002). Depressed humoral immunity after weight reduction in competitive judoists. Luminescence, 17(3), 150-157. doi: 10.1002/bio.686 [doi]
Oopik, V., Paasuke, M., Sikku, T., Timpmann, S., Medijainen, L., Ereline, J., . . .Gapejeva, E. (1996). Effect of rapid weight loss on metabolism and isokinetic performance capacity. A case study of two well-trained wrestlers. Journal o f Sports Medicine & Physical Fitness, 36(2), 127-131.
74

Oopik, V., Paasuke, M., Timpmann, S., Medijainen, L., Ereline, J., & Gapejeva, J.(2002). Effects of creatine supplementation during recovery from rapid body mass reduction on metabolism and muscle performance capacity in well-trained wrestlers. Journal o f Sports Medicine and Physical Fitness, 42(3), 330-339.
Oppliger, R. A., Case, H. S., Horswill, C. A., Landry, G. L., & Shelter, A. C. (1996). American College of Sports Medicine position stand: Weight loss in wrestlers. Medicine and Science in Sports and Exercise, 28, ix-xii.
Oppliger, R. A., Landry, G. L., Foster, S. W., & Lambrecht, A. C. (1993). Bulimicbehaviors among interscholastic wrestlers: A statewide survey. Pediatrics, 91(4), 826.
Oppliger, R. A., Landry, G. L., Foster, S. W., & Lambrecht, A. C. (1998). Weight-cutting practices of high school wrestlers. Clinical Journal o f Sport Medicine, 8(1), 2631.
Oppliger, R. A., Steen, S. N., & Scott, J. R. (2003). Weight loss practices of collegewrestlers. International Journal o f Sport Nutrition & Exercise Metabolism, 13(1), 29-46.
Oppliger, R. A., Utter, A. C., Scott, J. R., Dick, R. W., & Klossner, D. (2006). NCAA rule change improves weight loss among national championship wrestlers. Medicine & Science in Sports & Exercise, 38, 963-970.
Paik, I. Y., Jeong, M. H., Jin, H. E., Kim, Y. I., Suh, A. R., Cho, S. Y., . . . Suh, S. H.(2009). Fluid replacement following dehydration reduces oxidative stress during recovery. Biochemical and Biophysical Research Communications, 383(1), 103107. doi: 10.1016/j.bbrc.2009.03.135
Prouteau, S., Benhamou, L., & Courteix, D. (2006). Relationships between serum leptin and bone markers during stable weight, weight reduction and weight regain in male and female judoists. European Journal o f Endocrinology, 154(3), 389-395. doi: 10.1530/eje.1.02103
Prouteau, S., Ducher, G., Serbescu, C., Benhamou, L., & Courteix, D. (2007). Genderdifferences in response to weight cycling in elite judoists. Biology o f Sport, 24(2), 91-104.
Prouteau, S., Pelle, A., Collomp, K., Benhamou, L., & Courteix, D. (2006). Bone density in elite judoists and effects of weight cycling on bone metabolic balance.Medicine and Science in Sports and Exercise, 38, 694-700.
Rankin, J. W., Ocel, J. V., & Craft, L. L. (1996). Effect of weight loss and refeeding diet composition on anaerobic performance in wrestlers. Medicine and Science in Sports and Exercise, 28, 1292-1299.
75

Remick, D., Chancellor, K., Pederson, J., Zambraski, E. J., Sawka, M. N., & Wenger, C. B. (1998). Hyperthermia and dehydration-related deaths associated with intentional rapid weight loss in three collegiate wrestlers--North Carolina, Wisconsin, and Michigan, November-December 1997. Journal o f the American Medical Association, 279, 824-825. doi: 10.1001/jama.279.11.824
Ribisl, P. M. (1975). Rapid weight reduction in wrestling. American Journal o f Sports Medicine, 3(2), 55-57. doi: 10.1177/036354657500300201
Ribisl, P. M., & Herbert, W. G. (1970). Effects of rapid weight reduction and subsequent rehydration upon the physical working capacity of wrestlers. Research Quarterly, 41(4), 536-541.
Rodriguez, N. R., Di Marco, N. M., & Langley, S. (2009). American College of Sports Medicine position stand: Nutrition and athletic performance. Medicine and Science in Sports and Exercise, 41, 709-731. doi:10.1249/MSS.0b013e31890eb86
Roemmich, J. N., & Sinning, W. E. (1997). Weight loss and wrestling training: Effects on nutrition, growth, maturation, body composition, and strength. Journal o f Applied Physiology, 82(6), 1751-1759.
Roots, E., Timpmann, S., & Oopik, V. (2000). Weight cycling and blood lipid profile in combat sports athletes. Biology o f Sport, 17(4), 265-274.
Saarni, S. E., Rissanen, A., Sarna, S., Koskenvuo, M., & Kaprio, J. (2006). Weight cycling of athletes and subsequent weight gain in middleage. International Journal o f Obesity: Journal o f the International Association for the Study of Obesity, 30, 1639-1644.
Sansone, R. A., & Sawyer, R. (2005). Weight loss pressure on a 5 year old wrestler. British Journal o f Sports Medicine, 39(1), e2. doi: 10.1136/bjsm.2004.013136
Sawka, M. N., Burke, L. M., Eichner, E. R., Maughan, R. J., Montain, S. J., &Stachenfeld, N. S. (2007). American College of Sports Medicine position stand: Exercise and fluid replacement. Medicine and Science in Sports and Exercise, 39, 377-390. doi: 10.1249/mss.0b013e31802ca597
Sawka, M. N., Montain, S. J., & Latzka, W. A. (2001). Hydration effects onthermoregulation and performance in the heat. Comparative Biochemistry and Physiology Part A: Molecular & Integrative Physiology, 128(4), 679-690. doi: 10.1016/S1095-6433(01)00274-4
Schmidt, W. D., Corrigan, D., & Melby, C. L. (1993). Two seasons of weight cycling does not lower resting metabolic rate in college wrestlers. Medicine and Science in Sports and Exercise, 25, 613-619.
Schnirring, L. (1998). NCAA strengthens weight-cutting rules. Physician & Sportsmedicine, 26(7), 16.
76

Schoffstall, J. E., Branch, J. D., Leutholtz, B. C., & Swain, D. E. (2001). Effects of dehydration and rehydration on the one-repetition maximum bench press of weight-trained males. Journal o f Strength and Conditioning Research, 15, 102108.
Seidenberg, P. H. (2011). Mixed martial arts: Injury patterns and issues for the ringside physician. Current Sports Medicine Reports, 10(3), 147-150. doi: 10.1249/Jsr.0b013e31821cc952
Shan, G., Bohn, C., Sust, M., & Nicol, K. (2004). How can dynamic rigid-body modeling be helpful in motor learning? - Learning performance through dynamic modeling. Kinesiology, 36(2), 182-191.
Shan, G., & Westerhoff, P. (2005). Full-body kinematic characteristics of the maximal instep soccer kick by male soccer players and parameters related to kick quality. Sports Biomechanics, 4(1), 59-72.
Shirreffs, S. M. (2000). Markers of hydration status. Journal o f Sports Medicine and Physical Fitness, 40(1), 80-84.
Shirreffs, S. M. (2005). The importance of good hydration for work and exercise performance. Nutrition Reviews, 63(6 Pt 2), S14-S21.
Shirreffs, S. M. (2009). Conference on “Multidisciplinary approaches to nutritionalproblems”. Symposium on “Performance, exercise and health”. Hydration, fluids and performance. Proceedings o f the Nutrition Society, 68(1), 17-22. doi: 10.1017/S002966510800877X
Singer, R. N., & Weiss, S. A. (1968). Effects of weight reduction on selectedanthropometric, physical, and performance measures of wrestlers. Research Quarterly, 39(2), 361-369.
Slater, G., Rice, A. J., Tanner, R., Sharpe, K., Gore, C. J., Jenkins, D. G., & Hahn, A. G. (2006). Acute weight loss followed by an aggressive nutritional recovery strategy has little impact on on-water rowing performance. British Journal o f Sports Medicine, 40(1), 55-59. doi: 10.1136/bjsm.2005.019604
Slater, G. J., Rice, A. J., Sharpe, K., Tanner, R., Jenkins, D., Gore, C. J., & Hahn, A. G. (2005). Impact of acute weight loss and/or thermal stress on rowing ergometer performance. Medicine and Science in Sports and Exercise, 37, 1387-1394. doi: 10.1249/01.mss.0000174900.13358.7e
Slater, G. J., Rice, A. J., Tanner, R., Sharpe, K., Jenkins, D., & Hahn, A. G. (2006). Impact of two different body mass management strategies on repeat rowing performance. Medicine and Science in Sports and Exercise, 38, 138-146. doi: 10.1249/01.mss.0000179903.05365.7a
77

Smith, M. S., Dyson, R., Hale, T., Harrison, J. H., & McManus, P. (2000). The effects in humans of rapid loss of body mass on a boxing-related task. European Journal o f Applied Physiology, 83, 34-39.
Smith, M., Dyson, R., Hale, T., Hamilton, M., Kelly, J., & Wellington, P. (2001). The effects of restricted energy and fluid intake on simulated amateur boxing performance. International Journal o f Sport Nutrition and Exercise Metabolism, 11(2), 238-247.
Steen, S. N., & Brownell, K. D. (1990). Patterns of weight loss and regain in wrestlers:Has the tradition changed? Medicine and Science in Sports and Exercise, 22, 762768.
Steen, S. N., Oppliger, R. A., & Brownell, K. D. (1988). Metabolic effects of repeated weight loss and regain in adolescent wrestlers. The Journal o f the American Medical Association, 260(1), 47-50.
Strauss, R. H., Lanese, R. R., & Malarkey, W. B. (1985). Weight loss in amateurwrestlers and its effect on serum testosterone levels. Journal o f the American Medical Association, 254(23), 3337-3338.
Suzuki, M., Nakaji, S., Umeda, T., Shimoyama, T., Mochida, N., Kojima, A., . . . Sugawara, K. (2003). Effects of weight reduction on neutrophil phagocytic activity and oxidative burst activity in female judoists. Luminescence, 18(4), 214217. doi: 10.1002/bio.727
Tarnopolsky, M. A., Cipriano, N., Woodcroft, C., Pulkkinen, W. J., Robinson, D. C., Henderson, J. M., & MacDougall, J. D. (1996). Effects of rapid weight loss and wrestling on muscle glycogen concentration. Clinical Journal o f Sport Medicine: Official Journal o f the Canadian Academy o f Sport Medicine, 6(2), 78-84.
Timpmann, S., Oopik, V., Paasuke, M., Medijainen, L., & Ereline, J. (2004). Effect of rapid body mass loss on metabolism and muscle performance in combat sports athletes (Abstract). In V. Klisouras (Ed.), 2004 Pre-Olympic Congress: Proceedings: Volume I: Lectures-orals: Sport science through the ages (pp. 231 - 232). Thessaloniki, Greece: Aristotle University of Thessaloniki, Department of Physical Education & Sport Science.
Timpmann, S., Oopik, V., Paasuke, M., Medijainen, L., & Ereline, J. (2008). Acuteeffects of self-selected regimen of rapid body mass loss in combat sports athletes. Journal o f Sports Science & Medicine, 7(2), 210-217.
Trucco, E., & Verri, A. (1998). Introductory techniques for 3-D computer vision. Upper Saddle River, NJ: Prentice Hall.
Umeda, T., Nakaji, S., Shimoyama, T., Kojima, A., Yamamoto, Y., & Sugawara, K.(2004). Adverse effects of energy restriction on changes in immunoglobulins and complements during weight reduction in judoists. Journal o f Sports Medicine and Physical Fitness, 44, 328-334.
78

Umeda, T., Nakaji, S., Shimoyama, T., Yamamoto, Y., Totsuka, M., & Sugawara, K. (2004). Adverse effects of energy restriction on myogenic enzymes in judoists. Journal o f Sports Sciences, 22, 329-338.
Utter, A., & Kang, J. (1998). Acute weight gain and performance in college wrestlers. Journal o f Strength & Conditioning Research, 12, 157-160.
Utter, A. C. (2001). The new National Collegiate Athletic Association wrestling weight certification program and sport-seasonal changes in body composition of college wrestlers. Journal o f Strength & Conditioning Research, 15, 296-301.
von Duvillard, S. P., Arciero, P. J., Tietjen-Smith, T., & Alford, K. (2008). Sports drinks, exercise training, and competition. Current Sports Medicine Reports, 7(4), 202208. doi: 10.1249/JSR.0b013e31817ffa37
Walsh, R. M., Noakes, T. D., Hawley, J. A., & Dennis, S. C. (1994). Impaired high- intensity cycling performance time at low levels of dehydration. International Journal o f Sports Medicine, 15, 392-398.
Waslen, P. E., McCargar, L. J., & Taunton, J. E. (1993). Weight cycling in competitive judokas. Clinical Journal o f Sport Medicine, 3(4), 235-241.
Water deprivation and performance of athletes. (1974). American Journal o f Clinical Nutrition, 27(10), 1096-1097.
Watson, G., Judelson, D. A., Armstrong, L. E., Yeargin, S. W., Casa, D. J., & Maresh, C. M. (2005). Influence of diuretic-induced dehydration on competitive sprint and power performance. Medicine and Science in Sports and Exercise, 37, 1168-1174. doi: 10.1249/01.mss.0000170100.93279.be
Webster, S., Rutt, R., & Weltman, A. (1990). Physiological effects of a weight loss regimen practiced by college wrestlers. Medicine and Science in Sports and Exercise, 22(2), 229-234.
Whiting, W. C., Gregor, R. J., & Finerman, G. A. (1988). Kinematic analysis of human upper extremity movements in boxing. / Analyse cinematique des mouvements des membres superieurs en boxe. American Journal o f Sports Medicine, 16(2), 130-136.
Wroble, R. R., & Moxley, D. P. (1998a). Acute weight gain and its relationship tosuccess in high school wrestlers. Medicine and Science in Sports and Exercise, 30(6), 949-951.
Wroble, R. R., & Moxley, D. P. (1998b). Weight loss patterns and success rates in high school wrestlers. Medicine and Science in Sports and Exercise, 30(4), 625-628.
Yaegaki, M., Umeda, T., Takahashi, I., Matsuzaka, M., Sugawara, N., Shimaya, S., . . . Nakaji, S. (2007). Change in the capability of reactive oxygen species production by neutrophils following weight reduction in female judoists. British Journal o f Sports Medicine, 41, 322-327. doi: 10.1136/bjsm.2006.032029
79

Yamamoto, L. M., Judelson, D. A., Farrell, M. J., Lee, E. C., Armstrong, L. E., Casa, D.J. , . . . Maresh, C. M. (2008). Effects of hydration state and resistance exercise on markers of muscle damage. Journal o f Strength and Conditioning Research, 22, 1387-1393. doi: 10.1519/JSC.0b013e3181739403
Yoshida, T., Takanishi, T., Nakai, S., Yorimoto, A., & Morimoto, T. (2002). The critical level of water deficit causing a decrease in human exercise performance: A practical field study. European Journal o f Applied Physiology, 87, 529-534. doi: 10.1007/s00421 -002-0651 -z]
Yoshioka, Y., Umeda, T., Nakaji, S., Kojima, A., Tanabe, M., Mochida, N., & Sugawara,K. (2006). Gender differences in the psychological response to weight reduction in judoists. International Journal o f Sport Nutrition and Exercise Metabolism, 16(2), 187-198.
80

Appendix A: Ethics Application Approval
UNIVERSITY OF LETHBRIDGEAPPLICATION FOR ETHICAL REVIEW OF HUMAN SUBJECT
RESEARCH
The Human Subject Research Committee is mandated by University policy to examine and approve research proposals to ensure that ethical principles and standards respecting the personal welfare and rights of subjects have been recognized and accommodated. The Committee follows the Tri-Council Policy Statement: Ethical Conduct for Research Involving Humans. This Policy Statement is available at: http://www.pre.ethics.gc.ca/english/policystatement/policystatement.cfm. Other guidelines may be used when appropriate to the research in question.
You are encouraged to speak with the Office of Research Services about any outstanding issues, and seek the advice of the Committee when appropriate.
You are asked to respond to all of the following items and to submit your application and all supporting documents electronically to Margaret McKeen,Office of Research Services. (If possible, please use a different font for your responses, and submit your application as one document including the supporting documentation.) Supporting documents include letters of introduction, interview questions, questionnaires, telephone survey scripts, letters of consent, etc.
The Committee deals with applications as expeditiously as possible. Please allow up to one month from the date of receipt for Committee review.
Following approval of your protocol, any changes in procedures relevant to the ethical issues involved in the treatment of human subjects are to be reported immediately to the Office of Research Services.
If the research involves invasive procedures, a Hazard Assessment Report (available from Risk and Safety Services or on-line at:http://www.uleth.ca/hum/ohs/Documents/HAZARD_ASSESSMENT_FORM.doc) must be completed and submitted to Risk and Safety Services for approval. Review and approval by the Biosafety Committee may also be required.
81

SECTION A: GENERAL (This information is requiredfor administrative purposes only and will not affect the ethical review o f your proposal.)
A1. Researcher/Applicant Information
Name: Jared EvansDepartment: KinesiologyTelephone Number: home [phone #] campus [phone #] Email address: [email address]Are you: Graduate Student
A2. Supervisor Information
Name: Dr. Gongbing ShanDepartment: Kinesiology Telephone Number: [phone #] Email address: [email address] Are you: Faculty
A3. Student Thesis/Project Committee
a) Is this research for an undergraduate or graduate thesis/project? Yes
b) If yes, please provide the names, departments and phone numbers of your Committee members.
Name:1. Dr. Gongbing Shan2. Dr. Jochen Bocksnick3. Dr. Hua Li
Department:Kinesiology
Kinesiology Math & Comp Science
Telephone: [phone #] [phone #] [phone #]
A4. Title of Project:
Indicate the title of your project. If this project is funded, the title should be the same as the title of your funded research.
Msc. Kinesiology - The influence of weight fluctuation on biomechanical characteristics in martial arts performance
82

A5. Location of Research
a) Indicate where the research will be conducted.
The University of Lethbridge Biomechanics Lab (Pe 240) in the Kinesiology Department.
b) Does this project involve other centers, jurisdictions or countries? If so, please provide a list of the other groups who will be reviewing this protocol.
N/A
A6. Start/End Dates of Research Involving Human Subjects
Please state the start and end dates of the research involving human subjects. NOTE: Research involving human subjects cannot begin until Human Subject Research Committee approval has been received.
Start date (dd/mm/yyyy): 01/05/2009
End date (dd/mm/yyyy): 30/04/2010
A7. Funding
a) Is the project funded? No
b) Is the project part of a course? No
SECTION B: DETAILS ABOUT THE PROJECT
B1. Purpose of Project
Provide a brief and clear statement of the context and objectives of the project, including the key questions and/or hypotheses of the project (in two pages or less).
This study will examine the effect of weight fluctuations on biomechanical parameters of martial arts performance. These weight fluctuations take approximately one to two weeks depending on the competition (desired weight class) and coaching instruction. The parameters being investigated include reaction time, striking accuracy, power, speed, and balance. This research will contribute to the growing body of research on intentional weight fluctuation within sport and will help to supply scientific evidence for evaluating the phenomena of weight cutting within martial arts competition. It is
83

hypothesized that a weight cut will weaken the power, slow down reaction and decrease the strike accuracy.
B2. Description of Subjects
a) Describe the subjects to be included (including age range, gender, minority status, and any other relevant characteristics). If appropriate, specify the number of subjects in each study group.
20-25 subjects depending on availability. These subjects being trained mixed martial artists from the local “Canadian Martial Arts Centre” or martial artists who are interested in the study through word of mouth. Experience, age and gender are not factors in this research and subjects’ inclusion is based on the availability of the athletes. Previous health conditions are controlled by the club and should not be a factor on this research. Based on an estimation of the clientele of the martial arts clubs there should be an adequate base of volunteers to draw subjects from.
b) List any subject inclusion/exclusion criteria.
N/A.
c) If the subjects or facilities will be offered compensation or credit for participating in the research, provide details. Specify the amount, what the compensation is for, and how payment will be determined for subjects who do not complete the study.
The volunteer subjects are not offered monetary compensation; it is entirely volunteer based on the signed consent form. The subjects’ are offered scientific feedback (biomechanical analysis) about their abilities in relation to sporting standards and to top level athletes within their sport. Also, 3D electrical reports can be created of subjects’ performance on request basis. The PI will create these reports free of charge.
B3. Recruitment of Subjects
a) Briefly describe how subjects will be recruited and who will be doing the recruiting. If posters, newspaper advertisements, radio announcements or letters of invitation are being used, append to this application.
Subjects are recruited through personal contact at the martial arts centre as well as word of mouth between the athletes. I am a member of the club and have personal contact with many of the athletes at the club. Relationships range from friends to training partners to acquaintances and I should be able to garner enough participants because the coach/owner of the club is aiding and involved with recruitment. Recruitment is not limited to this one club as all combat athletes are welcome.
84

b) When and how will people be informed of the right to withdraw from the study? What procedures will be followed for people who wish to withdraw at any point during the study? What happens to the information contributed to the point of withdrawal?
The subjects are participating on a volunteer basis and are informed of their right to withdraw at any time, prior to involvement. Since the testing is only two weeks at maximum, withdrawal will not significantly affect the database (ie. New recruitment will be used). A withdrawal would cause the subjects data to be excluded from the database.
c) Indicate how subjects can obtain feedback on the research findings.
Subjects can contact me through personal phone or email as well as verbal questions at the martial arts centre during training. My contact information is on the consent form (pg. 2).
B4. Description of Research Procedures
Provide a summary of the design and procedures of the research. Provide details of data collection, and time commitment for the subjects, etc. NOTE: all study measures (e.g. questionnaires, interview guides, surveys, rating scales, etc.) must be appended to this application. If the procedures include a blind, indicate under what conditions the code will be broken, what provisions have been made for this occurrence, and who will have the code.
Using subjects available from the martial arts club, a pre-test and post-test data collection will be applied. These tests are performed prior to and after the initiation of a self-selected regime for weight reduction and weight regain, as deemed by the sport, coaches and personal experience; weight fluctuation is not manipulated by the researcher. The subjects’ record their individual procedures, methods, and chronological weight fluctuation over these one or two weeks (depending on personal plan). These tests are approximately 1 hour per session for two sessions approximately one to two weeks apart and have the subject performing selected martial arts strikes on a standard punching bag. This performance will be analyzed by a synchronized data collection of 3D motion capture, ground reaction forces and electromyography (EMG). 3D motion capture consists of a 12 high speed camera system (VICON v8i at 250 frames/s) and will be used to collect total body motion of both subject and punching bag. Ground reaction forces are measured using 2 Kistler force platforms for determining weight transfer during the skill performance. Surface EMG is measured using a wireless Noraxon Telemyo8 system synchronized with the motion capture system to monitor the major muscle groups in the striking limbs; biceps, triceps, quadriceps and hamstrings. This potentially requires a small patch of skin to be shaved for better skin-electrode contact. This allows an investigation of muscular recruitment, activation and onset differences. Statistical analyses will be performed to determine the influence of weight fluctuations on martial
85

arts performance. These analyses include descriptive statistics for group characterization and t-tests for determining the influence on biomechanical parameters.
B5. Privacy Protection
The next set of questions deals with anonymity and confidentiality. Refer to the brief descriptions below to assist you in answering these questions.
a) Anonymity refers to the protection of the identity o f participants. Anonymity can be provided along a continuum, from “complete ” to “no ” protection, where complete protection means that no identifying information will be collected.
1. Will the anonymity of the participants be protected?
Yes (completely)
2. If “yes”, explain how anonymity will be protected, and describe how this will be explained in the consent process.
The information collected will be stored by initials and on a separate hard drive location (finally stored on the researcher’s personal external hard drive). The tests are recorded with a standard video camera, but the view is slightly from behind and this data is only seen by the researcher. The 12 camera system does not record subjects’ faces. Discussion of results and findings will occur through private means (phone or email) or through private one on one communications. The researcher will not show the comparison among athletes during the communication.
3. If “no”, justify why loss of anonymity is required, and describe how this will be explained in the consent process.
b) Confidentiality refers to the protection, access, control and security o f the data and personal information.
1. How will confidentiality be protected and how will this be explained in the consent process? Specify which personnel will have access to the listing of names and study ID numbers as well as other study information collected (use job titles rather than individual names). Provide details on the location, manner of storage, and the proposed retention period of the information collected.
All personal information collected is stored in the researcher’s files and will not be disclosed without subject permission. The raw data and consent forms will be stored in a separate and locked cabinet for three years that both the researcher and supervisor have access to.
86

B6. Potential Risks and Benefits
To facilitate H um an Subject Research Com m ittee review and to determ ine w hether the study involves m ore than m inim al risk, please respond to the follow ing questions. Does this project involve...
C heck those that apply
1. Collection of data through invasive clinical procedures that are not required for normal patient care.
2. Collection of data through noninvasive clinical procedures involving imaging or microwaves that are not required for normal patient care.
3. Collection, use, or disclosure of health information or biological samples where the researcher is requesting that the requirement for informed consent be waived.
4. Any procedures involving deception or incomplete disclosure of the nature of the research for purposes of informed consent.
5. Any possibility that a breach of confidentiality could place subjects at risk of Criminal or civil liability or be damaging to subjects’ financial standing, Employability or reputation.
6. Research questions or procedures that might be expected to cause subject psychological distress, discomfort or anxiety beyond what a reasonable person might expect in day to day social interactions (e.g., questions that raise painful memories or unresolved emotional issues).
7. Research questions that involve sensitive issues (e.g. sexual orientation or practices, etc.).
8. Investigations in which there is an existing relationship between the investigator and subjects (e.g., manager/employee, therapist/client, teacher/student).
9. Investigations in which there is a conflict of interest between an investigator and the sponsor of the investigation.
10. Any other non-therapeutic risks that arise from procedures not directly related to patient care.
a) Outline any risks of potential physical or emotional harm or discomfort to the subjects, and describe how the anticipated benefits outweigh the potential risks.
There are no associated risks with this research; however, this study is relevant practically because it will supply scientific evidence for evaluating weight fluctuation in weight class sports and also individual athletes’ health within these sports. Since the athletes are medically approved (by the competition commission) and are ready to participate in competition, the biomechanical tests have no health risks to the planned competitive performance.
b) Indicate the steps taken to inform subjects of the possible consequences of releasing information in the public domain, and describe how subjects will be given an opportunity to review material before it is released.
The PI will be using the results and data analysis for research presentations, however, subjects’ identity will remain confidential.
87
B7. Obtaining Consent
Advise the Committee how informed consent will be obtained. The Tri-Council Policy Statement ensures that informed consent be obtained in writing from all subjects or, when appropriate from parents or legal guardians, unless there is a good reason for not doing so. If a consent form will be used, attach copies for the Committee. A sample letter of consent is available from the Office of Research Services or our web site at:
http://www.uleth.ca/rch/funding/forms/Human_Subject_Research_Sample_Letter _of_Consent.pdf. Please ensure that the reading level of the consent form is appropriate to the population involved.
a) Clearly detail who will be obtaining consent and the procedures for doing so. If appropriate, specify whether subjects will be randomly assigned to groups before or after consent has been attained.
The researcher will be obtaining consent from individuals as they express interest in the study (or are approached to garner interest), collecting signatures before testing.
b) If the subjects are not able/competent to give fully informed consent (cognitive impairment, age, etc.), or if there are significant power differences in operation (professor/student, employer/employee, political or economic minorities, etc.), please specify, and describe steps you will take to obtain free and informed consent. If participants are not competent to consent, specify who will consent on their behalf.
N/A
c) Do any of the procedures include the use of deception or partial disclosure of information to subjects? If yes, provide a rationale for the deception or partial disclosure. Describe the procedures for debriefing the subjects.
N/A
d) For the letter of consent/consent form:
*attached at the end*
B8. Continuing Review
Propose a process for continuing review if the research is ongoing. Continuing review should consist of, at least, the submission of a succinct annual status report. Notify the Committee when the research concludes.
The data collection is approximately one year, if that time frame is exceeded, an annual review will be conducted.
88

The protection of human subjects will be assured in accordance with the TriCouncil Policy Statement or with other guidelines if these have been agreed upon as more appropriate.
Signature of Researcher/Applicant Date
(Revised April 3/09)
89
Appendix B: Consent Form
The Influence of Weight Fluctuation on Biomechanical Characteristics in Martial ArtsPerformance
Biomechanics Laboratory University o f Lethbridge
I, Jared Evans (B.Sc. Exercise Science) invite you to participate in my Masters research under the supervision of Dr. Shan (Ph.D.; Department of Kinesiology) to scientifically evaluate the effect of weight fluctuations on biomechanical characteristics of martial arts performance. If you would like to do a weight fluctuation for mock competition and/or training; your participation is appreciated.
Purpose
The aim is to investigate issues related to weight cutting in martial arts competition such as if the practice is needed and if it is effective for increasing the chance to win when taking on potential health risks and/or performance decrements. This study is focused on the influence of weight cutting on power, accuracy, balance and reaction time in regard to individual strike performance.
Procedures
A pre-test will be performed prior to the weight fluctuation. A post-test will be performed after the fluctuation when you have returned to a competition state 24 hours after making weight. Each testing session takes approximately 60 minutes and will have you performing selected strikes on a punching bag while standing on force platforms. The strikes include a variety of punches and kicks at different targets. The same data collection procedure and measurement of biomechanical parameters will be applied to both the pre- and post-test.
These performances will be analyzed by a synchronized data collection of 3D motion capture, ground reaction forces and electromyography (EMG). 3D capture consists of a 12 high speed camera system (VICON 200 Hz) utilizing passive markers attached to a special suit and will be used to collect total body motion of both you and the punching bag. Ground reaction forces are measured using 2 Kistler force platforms and used for determining weight transfer and body sway. Surface EMG is measured using a wireless Noraxon Telemyo8 system to monitor the major muscle groups in the striking limbs; biceps, triceps, quadriceps and hamstrings. This allows an investigation of reaction time, strike time, muscular recruitment, muscular activation and onset differences.
90

Potential Risks and Discomforts
It should be noted that a small patch of skin may need to be shaved for proper electrode skin contact. Nothing is intrusive and these tests do not use any sort of medication. There are no risks and discomforts associated with the testing set up and/or protocol.
Potential Benefits
Benefits of participation include; scientific feedback (biomechanical analysis) on your abilities in relation to sporting standards and top level athletes within your sport as well as the potential decrement in your abilities due to practices involved in “making weight”. This includes power, accelerations, velocities, force and momentum. Also, you will help to supply scientific evidence for evaluating weight fluctuation in weight class sports. Lastly, 3D electrical reports can be created of your performance on a request basis, free of charge.
Participation and Withdrawal
Participation in this study is entirely voluntary and you are free to withdraw at any time. Your data will not be used should you withdraw from the study.
Confidentiality
Only the primary researchers will have access to the data collected. Therefore your anonymity and confidentiality will be secure. Names will not be used during data processing and data is saved on a project hard drive that is only accessible by the researchers. While 3D motion does not capture facial features, regular video is taken but not shared with anyone or utilized past the early stages of analysis.
Information about Study Results
If you have any further questions, concerns or result requests please contact:Jared Evans work: [phone #], cell: [phone #], [email address]Dr. Shan: [phone #], [email address]
This study has been reviewed by the University of Lethbridge Human Subject Research Committee. Questions regarding your rights as a participant in this research may be addressed to the Office of Research Services, University of Lethbridge (Phone: [phone #]).
Your signature below indicates that you have read and understood the information provided above, that you are willing to participate in this study and that you understand that you may withdraw at any time.
91

I have read the attached informed consent form and I consent to participate in the “The influence o f weight fluctuation on biomechanical characteristics in martial arts performance ” research study.
Printed Name: Date:
Signature:
Witnessed by: Date:
92

Appendix C: SPSS Statistical Results for Over All Effect
Central Tendency for Overall Effect
Perform ance M etric Test N M ean SD Std. E rror M ean
TRT Pre 58 .806 .202 .026Post 58 .755 .185 .024
CNS Pre 58 .549 .213 .028Post 58 .442 .155 .020
PNS Pre 58 .259 .152 .020Post 58 .314 .128 .017
Max LP Pre 58 664.528 524.150 68.824Post 58 1745.196 5920.441 777.392
Avg LP Pre 58 424.996 323.286 42.450Post 58 836.453 2257.936 296.482
Max RP Pre 58 2720.526 3052.292 400.786Post 58 3033.568 3613.414 474.465
Avg RP Pre 58 1789.452 2211.606 290.398Post 58 1736.275 2039.300 267.773
Max TP Pre 58 3295.677 3173.176 416.658Post 58 4704.821 8183.933 1074.603
Avg TP Pre 58 2214.449 2272.025 298.331Post 58 2572.729 3409.679 447.713
Accuracy Pre 58 97.687 67.242 8.829Post 58 104.972 74.310 9.757
93

T-Test Results for Overall Effect
Metric
Paired Differences
t df Sig. 12tailed)Mean SD
Std. Error Mean
95% Confidence Interval of the
DifferenceLower Upper
TRT .051 .069 .009 .033 .069 5.646 57 .000CNS .107 .157 .021 .066 .149 5.194 57 .000PNS -.055 .136 .018 -.091 -.019 -3.083 57 .003
Max LP -1080.668 5976.147 784.707 -2652.016 490.680 -1.377 57 .174Avg LP -411.457 2285.699 300.127 -1012.451 189.537 -1.371 57 .176Max RP -313.042 2208.642 290.009 -893.774 267.691 -1.079 57 .285Avg RP 53.177 1243.503 163.280 -273.786 380.139 .326 57 .746Max TP -1409.144 8046.381 1056.542 -3524.832 706.544 -1.334 57 .188Avg TP -358.280 3242.036 425.700 -1210.730 494.170 -.842 57 .404
Accuracy -7.285 28.721 3.771 -14.837 .267 -1.932 57 .058
94

Appendix D: SPSS Tables for Overall Hand and Foot Strikes
Central Tendency for Overall Hand Strikes
P erform ance M etric (H and)
Test N M ean SDStd.
E rrorM ean
TRT Pre 41 .756 .214 .033Post 41 .702 .189 .029
CNS Pre 41 .500 .220 .034Post 41 .401 .152 .024
PNS Pre 41 .257 .164 .026Post 41 .301 .117 .018
Max LP Pre 41 485.843 401.075 62.637Post 41 2005.947 7041.772 1099.740
Avg LP Pre 41 333.080 275.107 42.964Post 41 902.543 2683.092 419.029
Max RP Pre 41 2429.657 3058.301 477.626Post 41 2785.409 3613.540 564.340
Avg RP Pre 41 1659.771 2346.485 366.459Post 41 1554.745 1995.528 311.649
Max TP Pre 41 2859.830 3183.502 497.180Post 41 4743.050 9502.096 1483.978
Avg TP Pre 41 1992.852 2414.467 377.076Post 41 2457.288 3843.922 600.320
Accuracy Pre 41 59.810 27.904 4.358Post 41 65.200 28.653 4.475
95
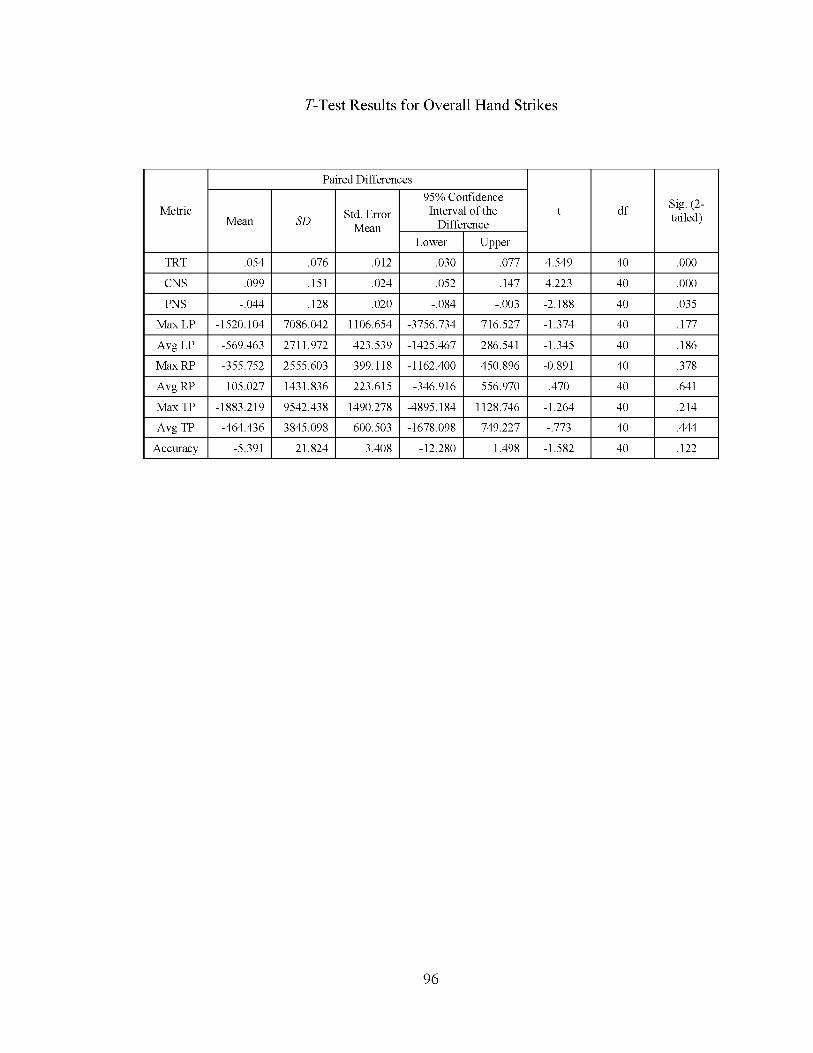
T-Test Results for Overall Hand Strikes
Metric
Paired Differences
t df Sig. 12tailed)Mean SD
Std. Error Mean
95% Confidence Interval of the
DifferenceLower Upper
TRT .054 .076 .012 .030 .077 4.549 40 .000CNS .099 .151 .024 .052 .147 4.223 40 .000PNS -.044 .128 .020 -.084 -.003 -2.188 40 .035
Max LP -1520.104 7086.042 1106.654 -3756.734 716.527 -1.374 40 .177Avg LP -569.463 2711.972 423.539 -1425.467 286.541 -1.345 40 .186Max RP -355.752 2555.603 399.118 -1162.400 450.896 -0.891 40 .378Avg RP 105.027 1431.836 223.615 -346.916 556.970 .470 40 .641Max TP -1883.219 9542.438 1490.278 -4895.184 1128.746 -1.264 40 .214Avg TP -464.436 3845.098 600.503 -1678.098 749.227 -.773 40 .444
Accuracy -5.391 21.824 3.408 -12.280 1.498 -1.582 40 .122
96

Central Tendency for Overall Foot Strikes
P erform ance M etric (Foot)
Test N M ean SDStd.
E rrorM ean
TRT Pre 17 .928 .089 .021Post 17 .884 .091 .022
CNS Pre 17 .666 .143 .035Post 17 .539 .116 .028
PNS Pre 17 .262 .122 .030Post 17 .345 .152 .037
Max LP Pre 17 1095.474 545.386 132.275Post 17 1116.327 557.332 135.173
Avg LP Pre 17 646.677 330.543 80.168Post 17 677.061 356.321 86.421
Max RP Pre 17 3422.035 3011.194 730.322Post 17 3632.068 3651.319 885.575
Avg RP Pre 17 2102.210 1874.275 454.578Post 17 2174.084 2138.248 518.601
Max TP Pre 17 4346.838 2978.838 722.474Post 17 4612.623 3587.115 870.003
Avg TP Pre 17 2748.887 1840.252 446.327Post 17 2851.144 2088.410 506.514
Accuracy Pre 17 189.038 40.227 9.757Post 17 200.891 61.572 14.933
97

T-Test Results for Overall Foot Strikes
Metric
Paired Differences
t d f Sig. 12tailed)Mean SD
Std. Error Mean
95% Confidence Interval of the
DifferenceLower Upper
TRT .044 .049 .012 .019 .070 3.684 16 .002CNS .126 .176 .043 .036 .217 2.966 16 .009PNS -.083 .156 .038 -.163 -.003 -2.198 16 .043
Max LP -20.853 118.748 28.801 -81.907 40.201 -0.724 16 .479Avg LP -30.384 82.154 19.925 -72.623 11.856 -1.525 16 .147Max RP -210.034 1017.110 246.686 -732.983 312.916 -0.851 16 .407Avg RP -71.874 599.834 145.481 -380.280 236.533 -.494 16 .628Max TP -265.785 1020.382 247.479 -790.417 258.847 -1.074 16 .299Avg TP -102.257 619.880 150.343 -420.970 216.456 -.680 16 .506
Accuracy -11.852 41.433 10.049 -33.155 9.450 -1.179 16 .255
98

Appendix E: Tables by Individual Strike Style
Central Tendency for Left Hook to Body
Test N Mean SDStd. Error
MeanTRT Pre 7 .836 .258 .097
Post 7 .763 .224 .085CNS Pre 7 .667 .323 .122
Post 7 .453 .177 .067PNS Pre 7 .167 .194 .073
Post 7 .309 .071 .027Max LP Pre 7 560.544 377.135 142.544
Post 7 525.161 412.926 156.071Avg LP Pre 7 374.866 277.921 105.044
Post 7 359.897 296.801 112.180Max RP Pre 7 318.034 237.347 89.709
Post 7 219.377 225.870 85.371Avg RP Pre 7 176.107 145.710 55.073
Post 7 126.556 145.266 54.906Max TP Pre 7 808.593 483.843 182.876
Post 7 692.747 551.097 208.295Avg TP Pre 7 550.976 373.054 141.001
Post 7 486.451 413.981 156.470Accuracy Pre 7 46.276 22.505 8.506
Post 7 60.104 34.314 12.970
99
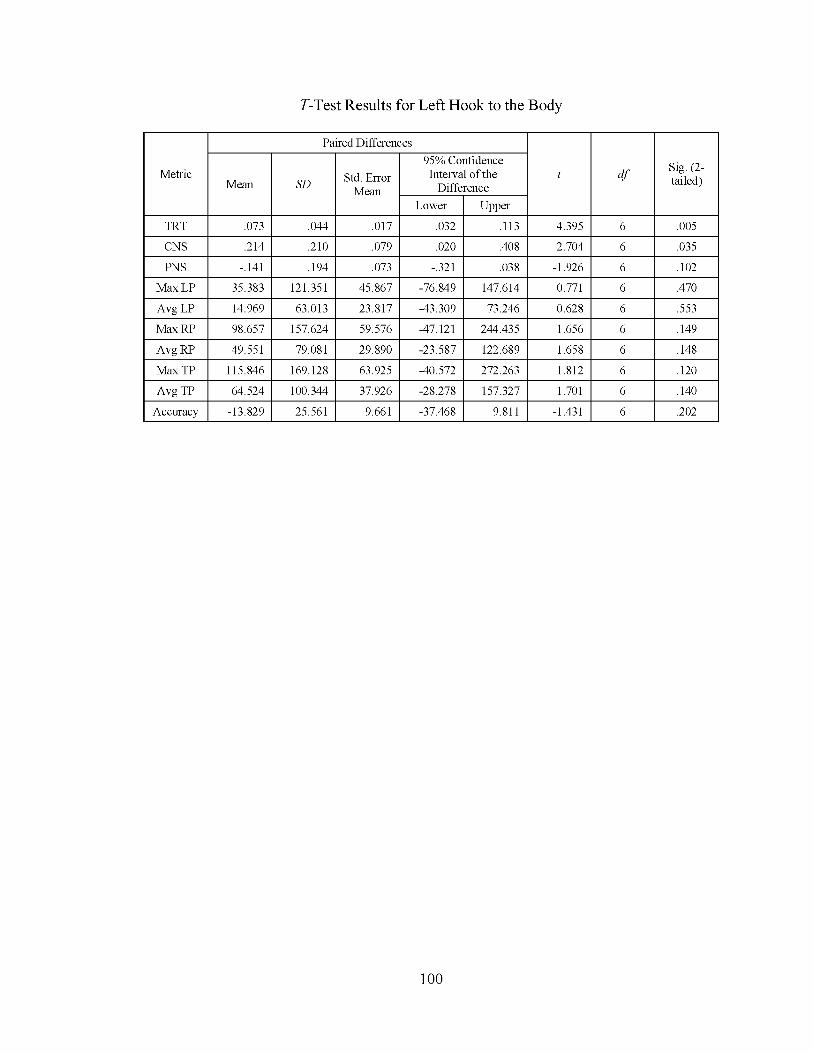
T-Test Results for Left Hook to the Body
Metric
Paired Differences
t d f Sig. 12tailed)Mean SD
Std. Error Mean
95% Confidence Interval of the
DifferenceLower Upper
TRT .073 .044 .017 .032 .113 4.395 6 .005CNS .214 .210 .079 .020 .408 2.704 6 .035PNS -.141 .194 .073 -.321 .038 -1.926 6 .102
Max LP 35.383 121.351 45.867 -76.849 147.614 0.771 6 .470Avg LP 14.969 63.013 23.817 -43.309 73.246 0.628 6 .553Max RP 98.657 157.624 59.576 -47.121 244.435 1.656 6 .149Avg RP 49.551 79.081 29.890 -23.587 122.689 1.658 6 .148Max TP 115.846 169.128 63.925 -40.572 272.263 1.812 6 .120Avg TP 64.524 100.344 37.926 -28.278 157.327 1.701 6 .140
Accuracy -13.829 25.561 9.661 -37.468 9.811 -1.431 6 .202
100

Central Tendency for Left Hook to Head
Test N Mean SDStd. Error
MeanTRT Pre 7 0.767 0.247 0.093
Post 7 0.731 0.227 0.086CNS Pre 7 0.540 0.201 0.076
Post 7 0.459 0.272 0.103PNS Pre 7 0.230 0.142 0.054
Post 7 0.276 0.097 0.037Max LP Pre 7 370.074 337.467 127.551
Post 7 4314.030 10478.447 3960.481Avg LP Pre 7 249.591 242.317 91.587
Post 7 1773.937 4111.434 1553.976Max RP Pre 7 1004.639 568.985 215.056
Post 7 2257.729 3473.166 1312.733Avg RP Pre 7 470.214 201.842 76.289
Post 7 956.370 1350.783 510.548Max TP Pre 7 1342.529 716.055 270.643
Post 7 6547.910 13923.661 5262.649Avg TP Pre 7 719.806 414.645 156.721
Post 7 2730.310 5455.911 2062.141Accuracy Pre 7 70.007 34.358 12.986
Post 7 65.653 25.793 9.749
101
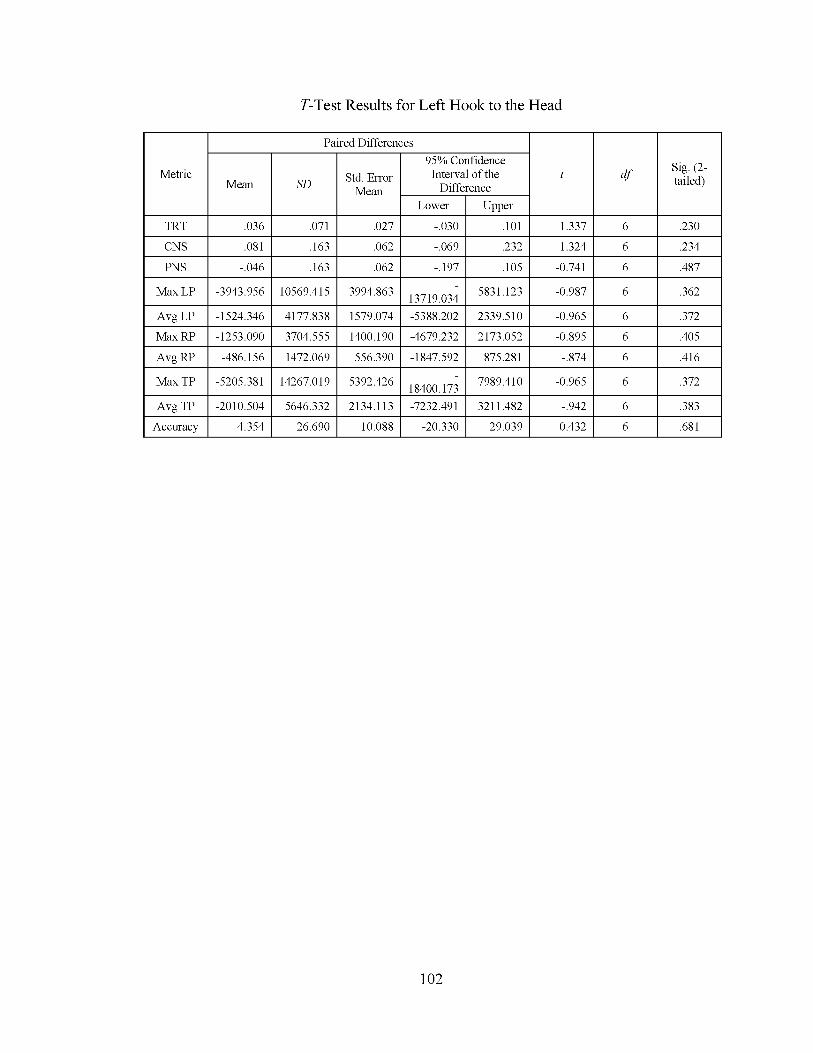
T-Test Results for Left Hook to the Head
Metric
Paired Differences
t d f Sig. (2tailed)Mean SD
Std. Error Mean
95% Confidence Interval of the
DifferenceLower Upper
TRT .036 .071 .027 -.030 .101 1.337 6 .230CNS .081 .163 .062 -.069 .232 1.324 6 .234PNS -.046 .163 .062 -.197 .105 -0.741 6 .487
Max LP -3943.956 10569.415 3994.863 13719.034 5831.123 -0.987 6 .362
Avg LP -1524.346 4177.838 1579.074 -5388.202 2339.510 -0.965 6 .372Max RP -1253.090 3704.555 1400.190 -4679.232 2173.052 -0.895 6 .405Avg RP -486.156 1472.069 556.390 -1847.592 875.281 -.874 6 .416
Max TP -5205.381 14267.019 5392.426 18400.173 7989.410 -0.965 6 .372
Avg TP -2010.504 5646.332 2134.113 -7232.491 3211.482 -.942 6 .383Accuracy 4.354 26.690 10.088 -20.330 29.039 0.432 6 .681
102

Central Tendency for Left Straight to the Head
Test N Mean SDStd. Error
MeanTRT Pre 7 0.650 0.244 0.092
Post 7 0.599 0.156 0.059CNS Pre 7 0.544 0.287 0.109
Post 7 0.416 0.131 0.049PNS Pre 7 0.110 0.060 0.023
Post 7 0.181 0.047 0.018Max LP Pre 7 349.044 250.766 94.781
Post 7 313.649 229.737 86.832Avg LP Pre 7 201.547 119.776 45.271
Post 7 193.076 133.511 50.463Max RP Pre 7 1081.191 470.246 177.736
Post 7 1019.314 439.239 166.017Avg RP Pre 7 655.017 290.283 109.717
Post 7 580.461 249.451 94.284Max TP Pre 7 1313.283 564.894 213.510
Post 7 1235.690 547.648 206.991Avg TP Pre 7 856.566 362.292 136.933
Post 7 773.537 352.948 133.402Accuracy Pre 7 53.459 19.909 7.525
Post 7 60.450 25.495 9.636
103

T-Test Results for Left Straight to the Head
Metric
Paired Differences
t d f Sig. 12tailed)Mean SD
Std. Error Mean
95% Confidence Interval of the
DifferenceLower Upper
TRT .051 .109 .041 -.050 .152 1.247 6 .259CNS .129 .183 .069 -.041 .298 1.859 6 .112PNS -.071 .104 .039 -.168 .025 -1.809 6 .120
Max LP 35.396 39.885 15.075 -1.492 72.284 2.348 6 .057Avg LP 8.471 27.376 10.347 -16.848 33.790 0.819 6 .444Max RP 61.877 307.801 116.338 -222.791 346.545 0.532 6 .614Avg RP 74.556 190.590 72.036 -101.710 250.822 1.035 6 .341Max TP 77.593 274.240 103.653 -176.037 331.222 0.749 6 .482Avg TP 83.029 179.917 68.002 -83.367 249.424 1.221 6 .268
Accuracy -6.991 12.015 4.541 -18.103 4.120 -1.540 6 .175
104
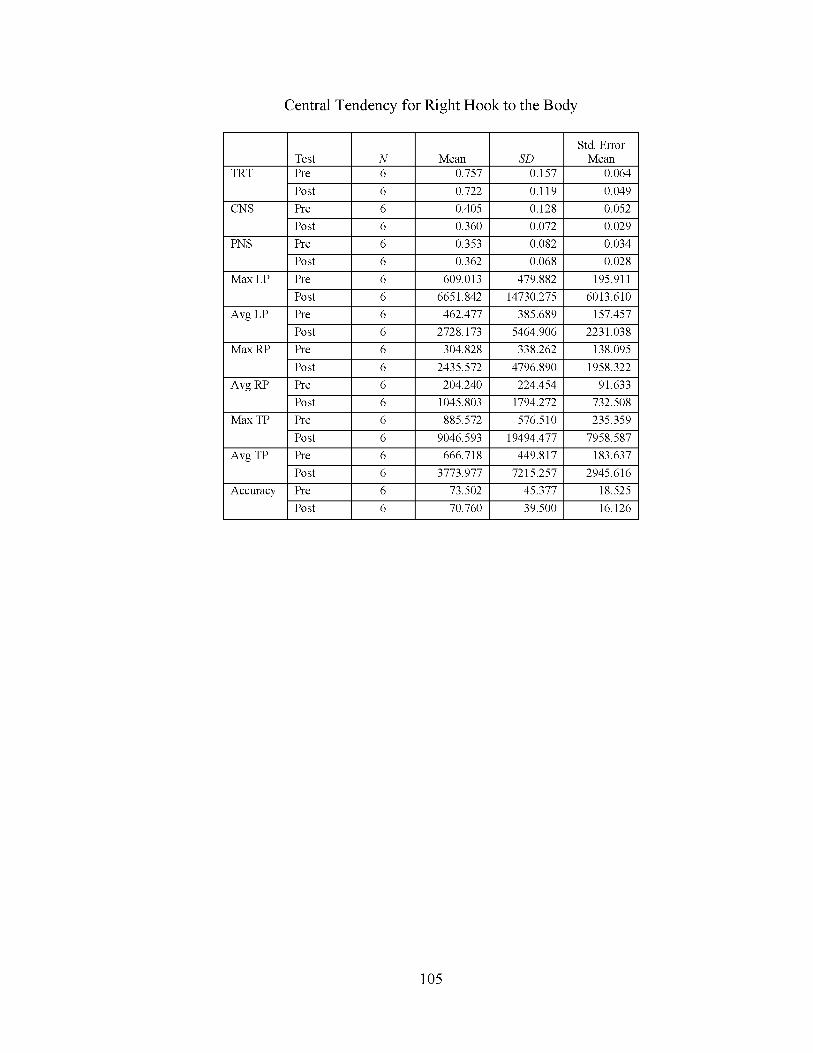
Central Tendency for Right Hook to the Body
Test N Mean SDStd. Error
MeanTRT Pre 6 0.757 0.157 0.064
Post 6 0.722 0.119 0.049CNS Pre 6 0.405 0.128 0.052
Post 6 0.360 0.072 0.029PNS Pre 6 0.353 0.082 0.034
Post 6 0.362 0.068 0.028Max LP Pre 6 609.013 479.882 195.911
Post 6 6651.842 14730.275 6013.610Avg LP Pre 6 462.477 385.689 157.457
Post 6 2728.173 5464.906 2231.038Max RP Pre 6 304.828 338.262 138.095
Post 6 2435.572 4796.890 1958.322Avg RP Pre 6 204.240 224.454 91.633
Post 6 1045.803 1794.272 732.508Max TP Pre 6 885.572 576.510 235.359
Post 6 9046.593 19494.477 7958.587Avg TP Pre 6 666.718 449.817 183.637
Post 6 3773.977 7215.257 2945.616Accuracy Pre 6 73.502 45.377 18.525
Post 6 70.760 39.500 16.126
105
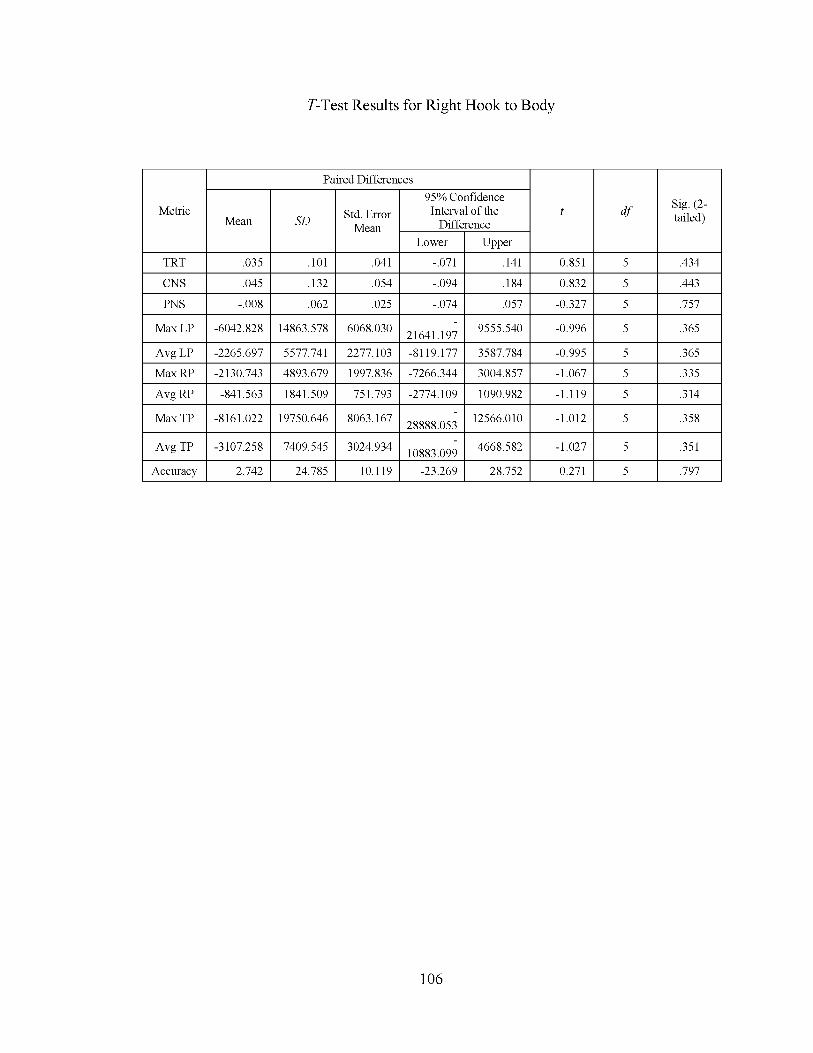
T-Test Results for Right Hook to Body
Metric
Paired Differences
t d f Sig. 12tailed)Mean SD
Std. Error Mean
95% Confidence Interval of the
DifferenceLower Upper
TRT .035 .101 .041 -.071 .141 0.851 5 .434CNS .045 .132 .054 -.094 .184 0.832 5 .443PNS -.008 .062 .025 -.074 .057 -0.327 5 .757
Max LP -6042.828 14863.578 6068.030 21641.197 9555.540 -0.996 5 .365
Avg LP -2265.697 5577.741 2277.103 -8119.177 3587.784 -0.995 5 .365Max RP -2130.743 4893.679 1997.836 -7266.344 3004.857 -1.067 5 .335Avg RP -841.563 1841.509 751.793 -2774.109 1090.982 -1.119 5 .314
Max TP -8161.022 19750.646 8063.167 28888.053 12566.010 -1.012 5 .358
Avg TP -3107.258 7409.545 3024.934 10883.099 4668.582 -1.027 5 .351
Accuracy 2.742 24.785 10.119 -23.269 28.752 0.271 5 .797
106

Central Tendency for Right Hook to the Head
Test N Mean SDStd. Error
MeanTRT Pre 7 0.820 0.196 0.074
Post 7 0.756 0.223 0.084CNS Pre 7 0.406 0.111 0.042
Post 7 0.349 0.076 0.029PNS Pre 7 0.414 0.144 0.054
Post 7 0.406 0.165 0.062Max LP Pre 7 433.897 414.034 156.490
Post 7 357.444 330.166 124.791Avg LP Pre 7 368.884 314.576 118.898
Post 7 303.290 254.666 96.255Max RP Pre 7 7479.267 2952.930 1116.103
Post 7 6861.971 3840.576 1451.601Avg RP Pre 7 6102.483 2173.835 821.632
Post 7 4574.767 2407.993 910.136Max TP Pre 7 7878.394 3193.736 1207.119
Post 7 7195.089 4059.444 1534.325Avg TP Pre 7 6471.367 2323.728 878.287
Post 7 4878.054 2614.687 988.259Accuracy Pre 7 57.280 18.466 6.979
Post 7 55.669 13.513 5.107
107

T-Test Results for Right Hook to the Head
Metric
Paired Differences
t d f Sig. (2tailed)Mean SD
Std. Error Mean
95% Confidence Interval of the
DifferenceLower Upper
TRT .064 .077 .029 -.007 .136 2.203 6 .070CNS .057 .075 .028 -.012 .126 2.016 6 .090PNS .009 .066 .025 -.053 .070 0.343 6 .744
Max LP 76.453 99.964 37.783 -15.998 168.904 2.023 6 .089Avg LP 65.594 81.835 30.931 -10.091 141.279 2.121 6 .078Max RP 617.296 1732.523 654.832 -985.021 2219.612 0.943 6 .382Avg RP 1527.716 2188.279 827.092 -496.105 3551.536 1.847 6 .114Max TP 683.306 1701.829 643.231 -890.623 2257.235 1.062 6 .329Avg TP 1593.313 2183.411 825.252 -426.006 3612.632 1.931 6 .102
Accuracy 1.611 16.229 6.134 -13.398 16.621 0.263 6 .802
108

Central Tendency for Right Straight to the Head
Test N Mean SDStd. Error
MeanTRT Pre 7 0.704 0.177 0.067
Post 7 0.644 0.155 0.058CNS Pre 7 0.426 0.078 0.029
Post 7 0.364 0.093 0.035PNS Pre 7 0.281 0.129 0.049
Post 7 0.280 0.092 0.035Max LP Pre 7 610.080 556.572 210.365
Post 7 537.253 493.420 186.495Avg LP Pre 7 359.597 286.219 108.180
Post 7 317.689 251.548 95.076Max RP Pre 7 4086.434 2404.181 908.695
Post 7 3868.514 2879.987 1088.533Avg RP Pre 7 2142.634 989.002 373.808
Post 7 1971.804 1072.809 405.484Max TP Pre 7 4648.576 2936.377 1109.846
Post 7 4355.061 3359.091 1269.617Avg TP Pre 7 2502.234 1252.908 473.555
Post 7 2289.497 1301.058 491.754Accuracy Pre 7 60.290 21.762 8.225
Post 7 79.361 32.710 12.363
109

Table: T-Test Results for Right Straight to the Head
Metric
Paired Differences
t d f Sig. (2tailed)Mean SD
Std. Error Mean
95% Confidence Interval of the
DifferenceLower Upper
TRT .060 .059 .022 .006 .114 2.709 6 .035CNS .061 .058 .022 .008 .115 2.809 6 .031PNS .001 .084 .032 -.076 .079 0.045 6 .966
Max LP 72.827 117.165 44.284 -35.533 181.187 1.645 6 .151Avg LP 41.909 66.987 25.319 -20.044 103.861 1.655 6 .149Max RP 217.920 846.192 319.831 -564.677 1000.517 0.681 6 .521Avg RP 170.830 410.741 155.245 -209.042 550.702 1.100 6 .313Max TP 293.514 886.189 334.948 -526.074 1113.102 0.876 6 .415Avg TP 212.737 445.978 168.564 -199.724 625.198 1.262 6 .254
Accuracy -19.071 18.748 7.086 -36.410 -1.733 -2.691 6 .036
110

Central Tendency for Left Kick to the Head
Test N Mean SDStd. Error
MeanTRT Pre 3 0.930 0.066 0.038
Post 3 0.907 0.119 0.069CNS Pre 3 0.560 0.095 0.055
Post 3 0.527 0.146 0.084PNS Pre 3 0.370 0.035 0.020
Post 3 0.377 0.064 0.037Max LP Pre 3 1044.410 764.936 441.636
Post 3 1015.207 714.658 412.608Avg LP Pre 3 673.880 501.148 289.338
Post 3 719.103 505.996 292.137Max RP Pre 3 1619.330 400.163 231.034
Post 3 1745.643 99.247 57.300Avg RP Pre 3 1024.327 393.256 227.047
Post 3 1197.120 64.829 37.429Max TP Pre 3 2629.457 669.231 386.381
Post 3 2740.813 828.164 478.141Avg TP Pre 3 1698.210 518.588 299.407
Post 3 1916.220 519.455 299.908Accuracy Pre 3 193.143 71.483 41.271
Post 3 204.610 81.591 47.107
111

T-Test Results for Left Kick to the Head
Metric
Paired Differences
t d f Sig. (2tailed)Mean SD
Std. Error Mean
95% Confidence Interval of the
DifferenceLower Upper
TRT .023 .078 .045 -.170 .216 0.520 2 .655CNS .033 .067 .038 -.132 .199 0.867 2 .477PNS -.007 .031 .018 -.083 .069 -0.378 2 .742
Max LP 29.203 114.033 65.837 -254.069 312.476 0.444 2 .701Avg LP -45.223 58.757 33.923 -191.184 100.737 -1.333 2 .314Max RP -126.313 492.913 284.584 -1350.778 1098.151 -0.444 2 .701Avg RP -172.793 342.475 197.728 -1023.549 677.962 -.874 2 .474Max TP -111.357 538.073 310.656 -1448.003 1225.290 -0.358 2 .754Avg TP -218.010 396.422 228.874 -1202.777 766.757 -.953 2 .441
Accuracy -11.467 32.719 18.890 -92.745 69.811 -0.607 2 .606
112

Central Tendency for Left Kick to the Leg
Test N Mean SDStd. Error
MeanTRT Pre 3 .880 .085 .049
Post 3 .873 .065 .038CNS Pre 3 .620 .036 .021
Post 3 .550 .089 .051PNS Pre 3 .260 .104 .060
Post 3 .327 .025 .015Max LP Pre 3 932.217 517.555 298.811
Post 3 891.087 525.525 303.412Avg LP Pre 3 494.120 281.656 162.614
Post 3 457.423 278.717 160.917Max RP Pre 3 1791.223 242.486 140.000
Post 3 2474.060 1222.776 705.970Avg RP Pre 3 1086.703 41.234 23.806
Post 3 1480.980 648.502 374.413Max TP Pre 3 2472.410 280.878 162.165
Post 3 3189.610 1137.378 656.665Avg TP Pre 3 1580.823 289.561 167.178
Post 3 1938.400 590.122 340.707Accuracy Pre 3 204.337 23.292 13.447
Post 3 201.583 66.457 38.369
113

T-Test Results for Left Kick to the Leg
Metric
Paired Differences
t d f Sig. (2tailed)Mean SD Std. Error
Mean
95% Confidence Interval of the
DifferenceLower Upper
TRT .007 .023 .013 -.051 .064 0.500 2 .667CNS .070 .095 .055 -.167 .307 1.271 2 .332PNS -.067 .112 .065 -.346 .213 -1.027 2 .412
Max LP 41.130 147.674 85.260 -325.713 407.973 0.482 2 .677Avg LP 36.697 61.318 35.402 -115.626 189.020 1.037 2 .409Max RP -682.837 1074.802 620.537 -3352.794 1987.120 -1.100 2 .386Avg RP -394.277 684.488 395.189 -2094.638 1306.085 -.998 2 .424Max TP -717.200 1052.597 607.717 -3331.996 1897.596 -1.180 2 .359Avg TP -357.577 739.942 427.206 -2195.696 1480.542 -.837 2 .491
Accuracy 2.753 46.668 26.944 -113.177 118.683 0.102 2 .928
114

Central Tendency for Left Kick to the Body
Test N Mean SDStd. Error
MeanTRT Pre 2 .895 .092 .065
Post 2 .875 .120 .085CNS Pre 2 .440 .226 .160
Post 2 .515 .106 .075PNS Pre 2 .455 .134 .095
Post 2 .365 .021 .015Max LP Pre 2 1091.815 793.084 560.795
Post 2 1256.410 955.485 675.630Avg LP Pre 2 687.435 499.380 353.115
Post 2 823.095 607.949 429.885Max RP Pre 2 686.515 145.671 103.005
Post 2 550.040 91.203 64.490Avg RP Pre 2 329.770 31.381 22.190
Post 2 277.730 26.743 18.910Max TP Pre 2 1648.095 877.696 620.625
Post 2 1667.375 965.123 682.445Avg TP Pre 2 1017.205 467.999 330.925
Post 2 1100.825 581.206 410.975Accuracy Pre 2 143.755 8.195 5.795
Post 2 122.950 63.880 45.170
115
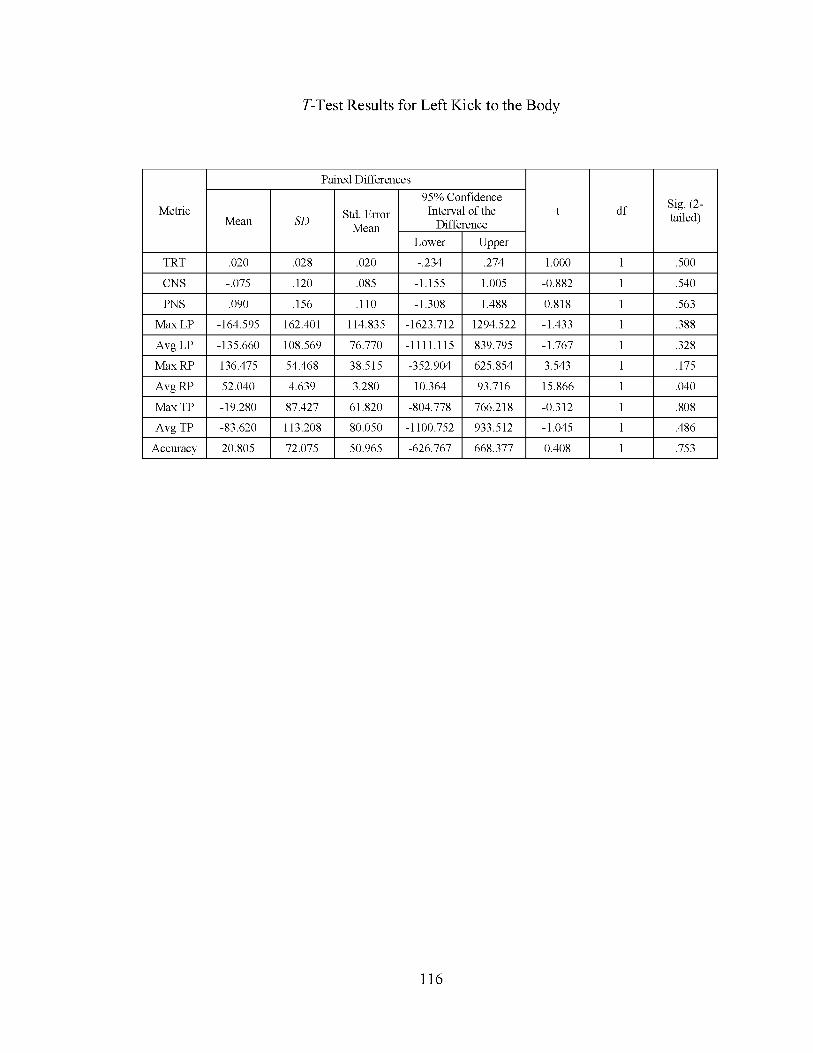
T-Test Results for Left Kick to the Body
Metric
Paired Differences
t df Sig. (2tailed)Mean SD
Std. Error Mean
95% Confidence Interval of the
DifferenceLower Upper
TRT .020 .028 .020 -.234 .274 1.000 1 .500CNS -.075 .120 .085 -1.155 1.005 -0.882 1 .540PNS .090 .156 .110 -1.308 1.488 0.818 1 .563
Max LP -164.595 162.401 114.835 -1623.712 1294.522 -1.433 1 .388Avg LP -135.660 108.569 76.770 -1111.115 839.795 -1.767 1 .328Max RP 136.475 54.468 38.515 -352.904 625.854 3.543 1 .175Avg RP 52.040 4.639 3.280 10.364 93.716 15.866 1 .040Max TP -19.280 87.427 61.820 -804.778 766.218 -0.312 1 .808Avg TP -83.620 113.208 80.050 -1100.752 933.512 -1.045 1 .486
Accuracy 20.805 72.075 50.965 -626.767 668.377 0.408 1 .753
116

Central Tendency for Right Kick to the Head
Test N Mean SDStd. Error
MeanTRT Pre 3 .940 .113 .065
Post 3 .893 .092 .053CNS Pre 3 .760 .050 .029
Post 3 .597 .144 .083PNS Pre 3 .183 .078 .045
Post 3 .300 .234 .135Max LP Pre 3 917.460 497.762 287.383
Post 3 964.370 563.584 325.385Avg LP Pre 3 600.933 355.441 205.214
Post 3 648.570 413.031 238.464Max RP Pre 3 8001.190 2582.254 1490.865
Post 3 8964.403 3909.428 2257.109Avg RP Pre 3 5133.327 1406.954 812.306
Post 3 5522.783 2146.520 1239.294Max TP Pre 3 8740.907 2501.395 1444.181
Post 3 9776.523 3900.394 2251.893Avg TP Pre 3 5734.260 1227.830 708.888
Post 3 6171.363 2099.429 1212.106Accuracy Pre 3 180.643 41.158 23.763
Post 3 172.387 39.387 22.740
117

T-Test Results for Right Kick to the Head
Metric
Paired Differences
t d f Sig. (2tailed)Mean SD
Std. Error Mean
95% Confidence Interval of the
DifferenceLower Upper
TRT .047 .021 .012 -.005 .098 3.883 2 .060CNS .163 .189 .109 -.307 .634 1.494 2 .274PNS -.117 .159 .092 -.513 .279 -1.267 2 .333
Max LP -46.910 77.105 44.517 -238.449 144.629 -1.054 2 .403Avg LP -47.637 73.119 42.215 -229.275 134.002 -1.128 2 .376Max RP -963.213 1338.981 773.061 -4289.427 2363.000 -1.246 2 .339Avg RP -389.457 916.806 529.318 -2666.929 1888.016 -.736 2 .538Max TP -1035.617 1440.223 831.513 -4613.330 2542.096 -1.245 2 .339Avg TP -437.103 974.668 562.725 -2858.313 1984.106 -.777 2 .519
Accuracy 8.257 3.708 2.141 -.955 17.468 3.857 2 .061
118

Central Tendency for Right Kick to the Leg
Test N Mean SDStd. Error
MeanTRT Pre 3 .977 .127 .073
Post 3 .863 .137 .079CNS Pre 3 .780 .072 .042
Post 3 .543 .139 .080PNS Pre 3 .193 .070 .041
Post 3 .320 .260 .150Max LP Pre 3 1226.397 694.558 401.003
Post 3 1215.630 599.364 346.043Avg LP Pre 3 636.820 346.128 199.837
Post 3 610.603 283.545 163.705Max RP Pre 3 5736.603 2343.611 1353.084
Post 3 6370.953 2412.407 1392.804Avg RP Pre 3 3419.997 1152.296 665.278
Post 3 3539.383 1190.002 687.048Max TP Pre 3 6752.200 2475.285 1429.106
Post 3 7393.227 2388.140 1378.793Avg TP Pre 3 4056.813 1102.730 636.662
Post 3 4149.990 1046.785 604.361Accuracy Pre 3 222.507 28.868 16.667
Post 3 255.003 52.048 30.050
119
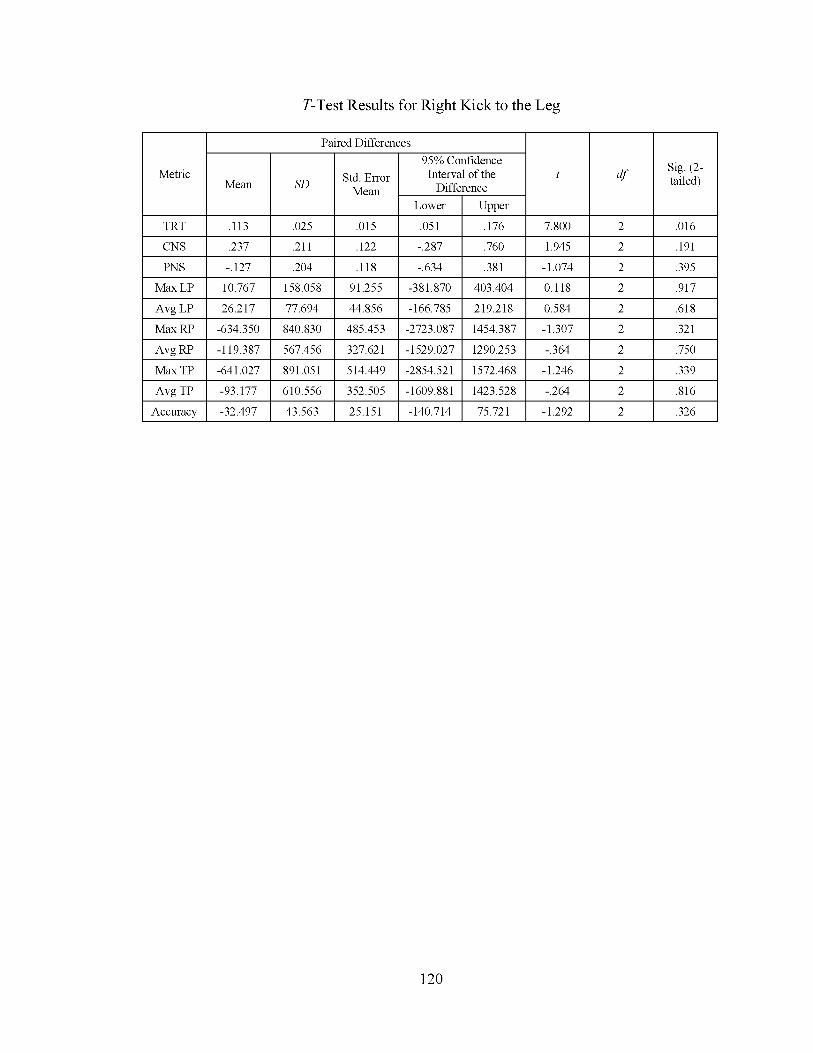
T-Test Results for Right Kick to the Leg
Metric
Paired Differences
t d f Sig. (2tailed)Mean SD Std. Error
Mean
95% Confidence Interval of the
DifferenceLower Upper
TRT .113 .025 .015 .051 .176 7.800 2 .016CNS .237 .211 .122 -.287 .760 1.945 2 .191PNS -.127 .204 .118 -.634 .381 -1.074 2 .395
Max LP 10.767 158.058 91.255 -381.870 403.404 0.118 2 .917Avg LP 26.217 77.694 44.856 -166.785 219.218 0.584 2 .618Max RP -634.350 840.830 485.453 -2723.087 1454.387 -1.307 2 .321Avg RP -119.387 567.456 327.621 -1529.027 1290.253 -.364 2 .750Max TP -641.027 891.051 514.449 -2854.521 1572.468 -1.246 2 .339Avg TP -93.177 610.556 352.505 -1609.881 1423.528 -.264 2 .816
Accuracy -32.497 43.563 25.151 -140.714 75.721 -1.292 2 .326
120
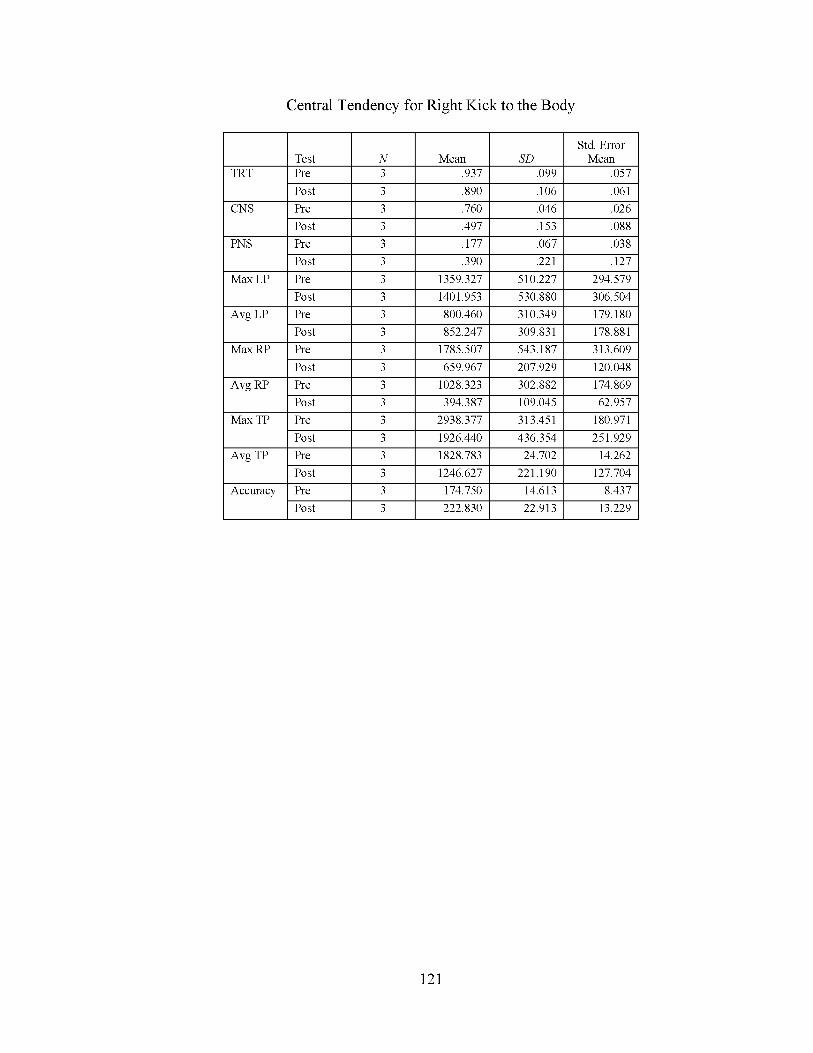
Central Tendency for Right Kick to the Body
Test N Mean SDStd. Error
MeanTRT Pre 3 .937 .099 .057
Post 3 .890 .106 .061CNS Pre 3 .760 .046 .026
Post 3 .497 .153 .088PNS Pre 3 .177 .067 .038
Post 3 .390 .221 .127Max LP Pre 3 1359.327 510.227 294.579
Post 3 1401.953 530.880 306.504Avg LP Pre 3 800.460 310.349 179.180
Post 3 852.247 309.831 178.881Max RP Pre 3 1785.507 543.187 313.609
Post 3 659.967 207.929 120.048Avg RP Pre 3 1028.323 302.882 174.869
Post 3 394.387 109.045 62.957Max TP Pre 3 2938.377 313.451 180.971
Post 3 1926.440 436.354 251.929Avg TP Pre 3 1828.783 24.702 14.262
Post 3 1246.627 221.190 127.704Accuracy Pre 3 174.750 14.613 8.437
Post 3 222.830 22.913 13.229
121

T-Test Results for Right Kick to the Body
Metric
Paired Differences
t d f Sig. (2tailed)Mean SD
Std. Error Mean
95% Confidence Interval of the
DifferenceLower Upper
TRT .047 .031 .018 -.029 .123 2.646 2 .118CNS .263 .199 .115 -.230 .757 2.297 2 .148PNS -.213 .178 .103 -.655 .228 -2.078 2 .173
Max LP -42.627 21.679 12.517 -96.481 11.228 -3.406 2 .076Avg LP -51.787 73.505 42.438 -234.383 130.810 -1.220 2 .347Max RP 1125.540 337.756 195.004 286.507 1964.573 5.772 2 .029Avg RP 633.937 203.886 117.714 127.456 1140.418 5.385 2 .033Max TP 1011.937 329.682 190.342 192.962 1830.911 5.316 2 .034Avg TP 582.157 225.859 130.400 21.093 1143.221 4.464 2 .047
Accuracy -48.080 37.077 21.406 -140.183 44.023 -2.246 2 .154
122
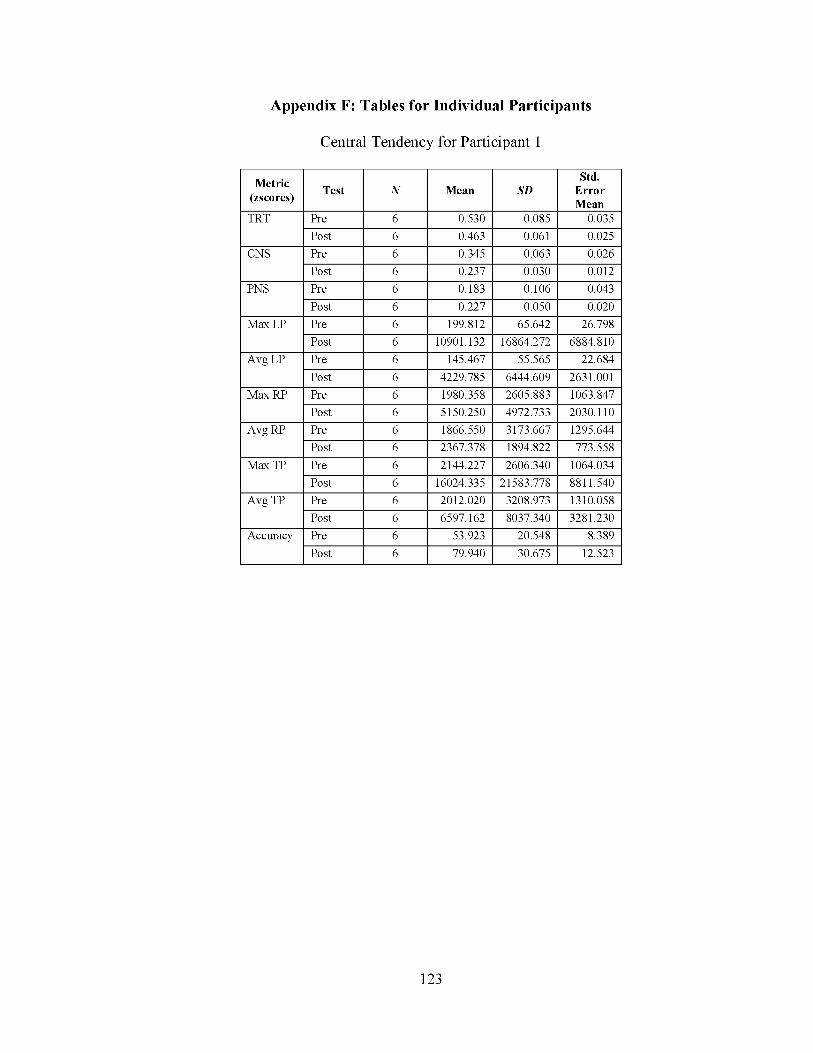
Appendix F: Tables for Individual Participants
Central Tendency for Participant 1
M etric(zscores)
Test N M ean SDStd.
E rrorM ean
TRT Pre 6 0.530 0.085 0.035Post 6 0.463 0.061 0.025
CNS Pre 6 0.345 0.063 0.026Post 6 0.237 0.030 0.012
PNS Pre 6 0.183 0.106 0.043Post 6 0.227 0.050 0.020
Max LP Pre 6 199.812 65.642 26.798Post 6 10901.132 16864.272 6884.810
Avg LP Pre 6 145.467 55.565 22.684Post 6 4229.785 6444.609 2631.001
Max RP Pre 6 1980.358 2605.883 1063.847Post 6 5150.250 4972.733 2030.110
Avg RP Pre 6 1866.550 3173.667 1295.644Post 6 2367.378 1894.822 773.558
Max TP Pre 6 2144.227 2606.340 1064.034Post 6 16024.335 21583.778 8811.540
Avg TP Pre 6 2012.020 3208.973 1310.058Post 6 6597.162 8037.340 3281.230
Accuracy Pre 6 53.923 20.548 8.389Post 6 79.940 30.675 12.523
123

T-Test Results for Participant 1
Metric
Paired Differences
t df Sig. 12tailed)Mean SD
Std. Error Mean
95% Confidence Interval of the
DifferenceLower Upper
TRT .067 .065 .027 -.002 .135 2.512 5 .054CNS .108 .069 .028 .036 .181 3.856 5 .012PNS -.043 .114 .047 -.163 .077 -0.927 5 .396
Max LP 10701.320 16826.266 6869.295 28359.404 6956.764 -1.558 5 .180
Avg LP -4084.318 6436.212 2627.573 10838.709 2670.072 -1.554 5 .181
Max RP -3169.892 6025.943 2460.081 -9493.731 3153.948 -1.289 5 .254Avg RP -500.828 3379.042 1379.488 -4046.915 3045.259 -.363 5 .731
Max TP 13880.108 22831.531 9320.934 37840.331 10080.115 -1.489 5 .197
Avg TP -4585.142 9477.827 3869.307 14531.511 5361.228 -1.185 5 .289
Accuracy -26.017 17.438 7.119 -44.317 -7.717 -3.655 5 .015
124

Central Tendency for Participant 2
M etric(zscores)
Test N M ean SDStd.
E rrorM ean
TRT Pre 12 .738 .137 .040Post 12 .721 .120 .035
CNS Pre 12 .518 .166 .048Post 12 .461 .136 .039
PNS Pre 12 .220 .151 .043Post 12 .260 .091 .026
Max LP Pre 12 379.547 160.420 46.309Post 12 364.681 180.919 52.227
Avg LP Pre 12 242.023 88.873 25.655Post 12 243.176 106.959 30.877
Max RP Pre 12 2372.250 2322.774 670.527Post 12 2196.050 2726.152 786.972
Avg RP Pre 12 1658.783 1764.360 509.327Post 12 1392.992 1688.033 487.293
Max TP Pre 12 2644.677 2309.774 666.774Post 12 2474.170 2717.905 784.592
Avg TP Pre 12 1900.809 1765.807 509.745Post 12 1636.168 1688.965 487.562
Accuracy Pre 12 131.283 75.038 21.662Post 12 144.253 85.507 24.684
125
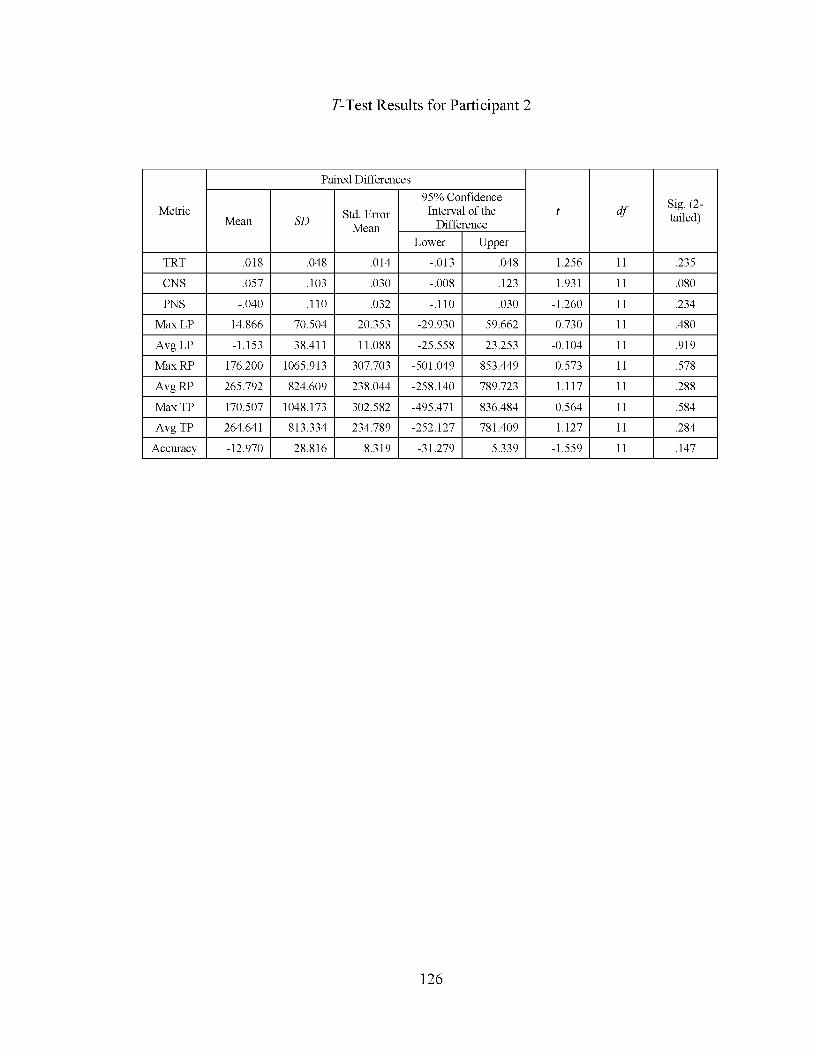
T-Test Results for Participant 2
Metric
Paired Differences
t d f Sig. (2tailed)Mean SD Std. Error
Mean
95% Confidence Interval of the
DifferenceLower Upper
TRT .018 .048 .014 -.013 .048 1.256 11 .235CNS .057 .103 .030 -.008 .123 1.931 11 .080PNS -.040 .110 .032 -.110 .030 -1.260 11 .234
Max LP 14.866 70.504 20.353 -29.930 59.662 0.730 11 .480Avg LP -1.153 38.411 11.088 -25.558 23.253 -0.104 11 .919Max RP 176.200 1065.913 307.703 -501.049 853.449 0.573 11 .578Avg RP 265.792 824.609 238.044 -258.140 789.723 1.117 11 .288Max TP 170.507 1048.173 302.582 -495.471 836.484 0.564 11 .584Avg TP 264.641 813.334 234.789 -252.127 781.409 1.127 11 .284
Accuracy -12.970 28.816 8.319 -31.279 5.339 -1.559 11 .147
126
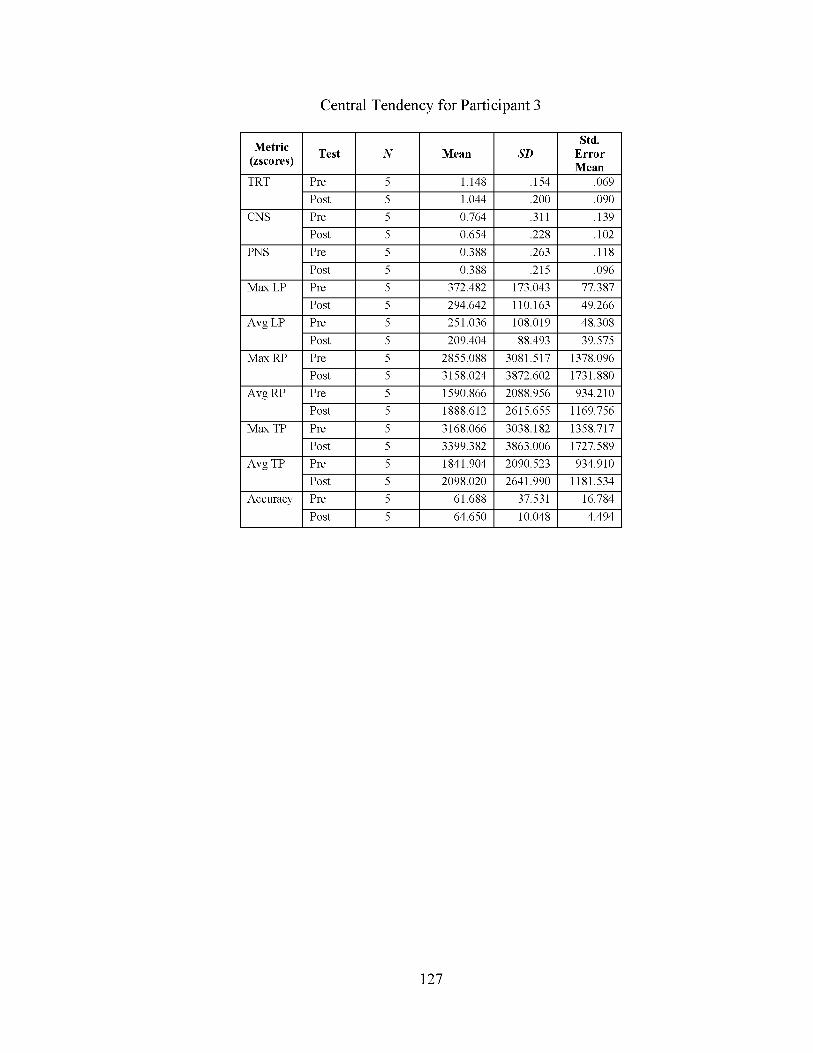
Central Tendency for Participant 3
M etric(zscores)
Test N M ean SDStd.
E rrorM ean
TRT Pre 5 1.148 .154 .069Post 5 1.044 .200 .090
CNS Pre 5 0.764 .311 .139Post 5 0.654 .228 .102
PNS Pre 5 0.388 .263 .118Post 5 0.388 .215 .096
Max LP Pre 5 372.482 173.043 77.387Post 5 294.642 110.163 49.266
Avg LP Pre 5 251.036 108.019 48.308Post 5 209.404 88.493 39.575
Max RP Pre 5 2855.088 3081.517 1378.096Post 5 3158.024 3872.602 1731.880
Avg RP Pre 5 1590.866 2088.956 934.210Post 5 1888.612 2615.655 1169.756
Max TP Pre 5 3168.066 3038.182 1358.717Post 5 3399.382 3863.006 1727.589
Avg TP Pre 5 1841.904 2090.523 934.910Post 5 2098.020 2641.990 1181.534
Accuracy Pre 5 61.688 37.531 16.784Post 5 64.650 10.048 4.494
127

T-Test Results for Participant 3
Metric
Paired Differences
t df Sig. (2tailed)Mean SD Std. Error
Mean
95% Confidence Interval of the
DifferenceLower Upper
TRT .104 .090 .040 -.008 .216 2.571 4 .062CNS .110 .254 .114 -.206 .426 0.967 4 .388PNS .000 .190 .085 -.236 .236 0.000 4 1.000
Max LP 77.840 68.660 30.706 -7.413 163.093 2.535 4 .064Avg LP 41.632 36.635 16.384 -3.857 87.121 2.541 4 .064Max RP -302.936 980.427 438.460 -1520.297 914.425 -0.691 4 .528Avg RP -297.746 546.768 244.522 -976.648 381.156 -1.218 4 .290Max TP -231.316 997.473 446.083 -1469.842 1007.210 -0.519 4 .631Avg TP -256.116 570.130 254.970 -964.026 451.794 -1.004 4 .372
Accuracy -2.962 29.398 13.147 -39.464 33.540 -0.225 4 .833
128
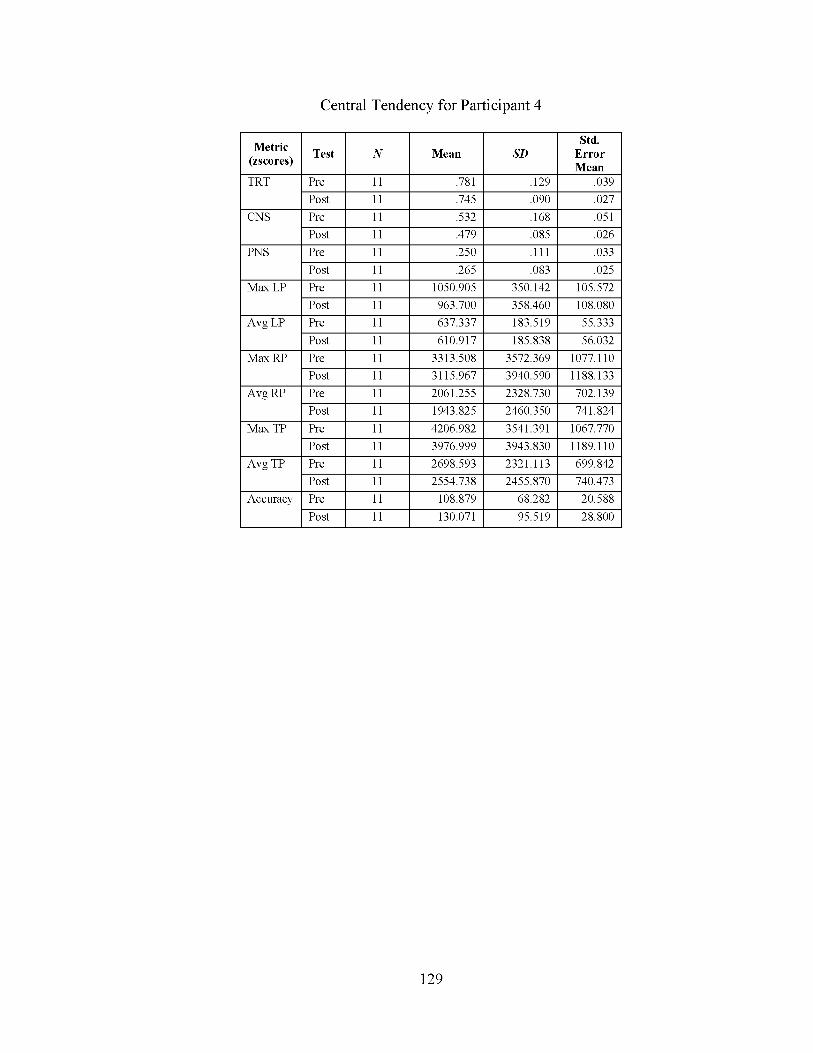
Central Tendency for Participant 4
M etric(zscores)
Test N M ean SDStd.
E rrorM ean
TRT Pre 11 .781 .129 .039Post 11 .745 .090 .027
CNS Pre 11 .532 .168 .051Post 11 .479 .085 .026
PNS Pre 11 .250 .111 .033Post 11 .265 .083 .025
Max LP Pre 11 1050.905 350.142 105.572Post 11 963.700 358.460 108.080
Avg LP Pre 11 637.337 183.519 55.333Post 11 610.917 185.838 56.032
Max RP Pre 11 3313.508 3572.369 1077.110Post 11 3115.967 3940.590 1188.133
Avg RP Pre 11 2061.255 2328.730 702.139Post 11 1943.825 2460.350 741.824
Max TP Pre 11 4206.982 3541.391 1067.770Post 11 3976.999 3943.830 1189.110
Avg TP Pre 11 2698.593 2321.113 699.842Post 11 2554.738 2455.870 740.473
Accuracy Pre 11 108.879 68.282 20.588Post 11 130.071 95.519 28.800
129

T-Test Results for Participant 4
Metric
Paired Differences
t df Sig. (2tailed)Mean SD Std. Error
Mean
95% Confidence Interval of the
DifferenceLower Upper
TRT .035 .058 .018 -.004 .075 2.020 10 .071CNS .053 .121 .036 -.028 .134 1.447 10 .178PNS -.015 .089 .027 -.075 .044 -0.575 10 .578
Max LP 87.205 146.759 44.249 -11.389 185.798 1.971 10 .077Avg LP 26.420 117.647 35.472 -52.616 105.456 0.745 10 .474Max RP 197.541 1135.435 342.347 -565.255 960.337 0.577 10 .577Avg RP 117.431 702.790 211.899 -354.710 589.572 .554 10 .592Max TP 229.983 1231.629 371.350 -597.437 1057.402 0.619 10 .550Avg TP 143.855 772.672 232.969 -375.233 662.942 .617 10 .551
Accuracy -21.192 33.553 10.116 -43.733 1.349 -2.095 10 .063
130

Central Tendency for Participant 5
M etric(zscores)
Test N M ean SDStd.
E rrorM ean
TRT Pre 12 .889 .156 .045Post 12 .858 .157 .045
CNS Pre 12 .566 .186 .054Post 12 .446 .135 .039
PNS Pre 12 .325 .086 .025Post 12 .413 .141 .041
Max LP Pre 12 1383.897 315.240 91.002Post 12 1393.318 377.231 108.897
Avg LP Pre 12 884.832 224.733 64.875Post 12 883.694 285.557 82.433
Max RP Pre 12 3397.565 3624.022 1046.165Post 12 3702.542 4093.157 1181.593
Avg RP Pre 12 2023.241 2281.910 658.731Post 12 2103.009 2461.920 710.695
Max TP Pre 12 4695.473 3709.028 1070.704Post 12 5006.048 4093.752 1181.765
Avg TP Pre 12 2908.072 2320.362 669.831Post 12 2986.705 2445.450 705.941
Accuracy Pre 12 125.984 80.017 23.099Post 12 119.083 75.539 21.806
131

T-Test Results for Participant 5
Metric
Paired Differences
t df Sig. (2tailed)Mean SD Std. Error
Mean
95% Confidence Interval of the
DifferenceLower Upper
TRT .031 .062 .018 -.008 .070 1.731 11 .111CNS .120 .196 .057 -.005 .245 2.116 11 .058PNS -.088 .161 .047 -.190 .015 -1.879 11 .087
Max LP -9.422 157.151 45.366 -109.271 90.428 -0.208 11 .839Avg LP 1.138 137.532 39.702 -86.246 88.521 0.029 11 .978Max RP -304.977 770.041 222.292 -794.237 184.284 -1.372 11 .197Avg RP -79.768 407.142 117.532 -338.454 178.917 -.679 11 .511Max TP -310.576 718.248 207.340 -766.929 145.777 -1.498 11 .162Avg TP -78.633 429.331 123.937 -351.417 194.151 -.634 11 .539
Accuracy 6.902 25.880 7.471 -9.542 23.345 0.924 11 .375
132

Central Tendency for Participant 6
M etric(zscores)
Test N M ean SDStd.
E rrorM ean
TRT Pre 6 .657 .114 .047Post 6 .628 .106 .043
CNS Pre 6 .408 .085 .035Post 6 .305 .068 .028
PNS Pre 6 .250 .071 .029Post 6 .325 .121 .049
Max LP Pre 6 156.740 75.621 30.872Post 6 123.455 52.573 21.463
Avg LP Pre 6 114.965 53.515 21.847Post 6 97.203 48.523 19.809
Max RP Pre 6 875.608 1058.307 432.052Post 6 744.380 795.655 324.825
Avg RP Pre 6 704.395 1022.878 417.588Post 6 571.132 715.131 291.951
Max TP Pre 6 1002.447 1015.823 414.708Post 6 845.090 754.751 308.126
Avg TP Pre 6 819.360 1005.685 410.569Post 6 668.337 687.910 280.838
Accuracy Pre 6 65.650 46.226 18.872Post 6 70.347 33.305 13.597
133

T-Test Results for Participant 6
Metric
Paired Differences
t d f Sig. (2tailed)Mean SD Std. Error
Mean
95% Confidence Interval of the
DifferenceLower Upper
TRT .028 .035 .014 -.009 .066 1.958 5 .108CNS .103 .072 .029 .028 .179 3.528 5 .017PNS -.075 .100 .041 -.179 .029 -1.845 5 .124
Max LP 33.285 33.941 13.857 -2.334 68.904 2.402 5 .061Avg LP 17.762 13.869 5.662 3.207 32.317 3.137 5 .026Max RP 131.228 466.114 190.290 -357.929 620.385 0.690 5 .521Avg RP 133.263 373.732 152.575 -258.944 525.471 .873 5 .422Max TP 157.357 472.344 192.834 -338.338 653.052 0.816 5 .452Avg TP 151.023 383.191 156.437 -251.111 553.157 .965 5 .379
Accuracy -4.697 27.189 11.100 -33.230 23.837 -0.423 5 .690
134
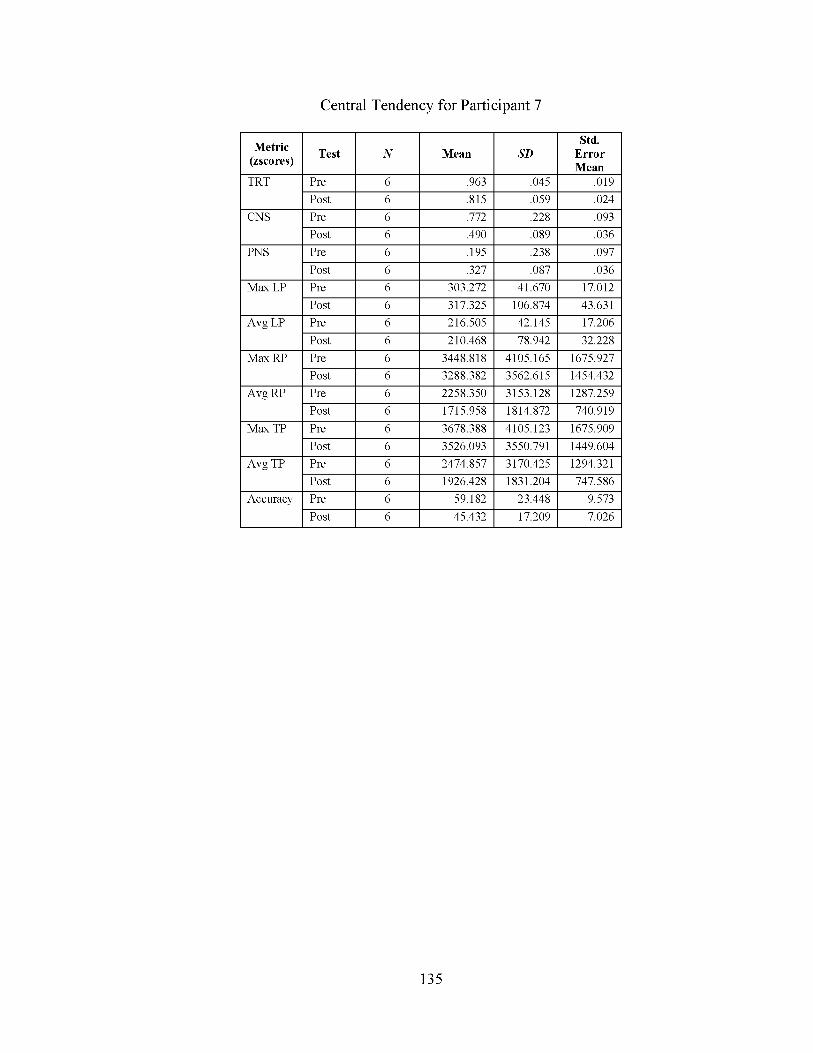
Central Tendency for Participant 7
M etric(zscores)
Test N M ean SDStd.
E rrorM ean
TRT Pre 6 .963 .045 .019Post 6 .815 .059 .024
CNS Pre 6 .772 .228 .093Post 6 .490 .089 .036
PNS Pre 6 .195 .238 .097Post 6 .327 .087 .036
Max LP Pre 6 303.272 41.670 17.012Post 6 317.325 106.874 43.631
Avg LP Pre 6 216.505 42.145 17.206Post 6 210.468 78.942 32.228
Max RP Pre 6 3448.818 4105.165 1675.927Post 6 3288.382 3562.615 1454.432
Avg RP Pre 6 2258.350 3153.128 1287.259Post 6 1715.958 1814.872 740.919
Max TP Pre 6 3678.388 4105.123 1675.909Post 6 3526.093 3550.791 1449.604
Avg TP Pre 6 2474.857 3170.425 1294.321Post 6 1926.428 1831.204 747.586
Accuracy Pre 6 59.182 23.448 9.573Post 6 45.432 17.209 7.026
135

T-Test Results for Participant 7
Metric
Paired Differences
t d f Sig. (2tailed)Mean SD Std. Error
Mean
95% Confidence Interval of the
DifferenceLower Upper
TRT .148 .045 .019 .101 .196 8.012 5 .000CNS .282 .182 .074 .090 .473 3.783 5 .013PNS -.132 .207 .085 -.349 .086 -1.556 5 .180
Max LP -14.053 82.949 33.864 -101.103 72.997 -0.415 5 .695Avg LP 6.037 43.971 17.951 -40.108 52.182 0.336 5 .750Max RP 160.437 693.929 283.295 -567.797 888.670 0.566 5 .596Avg RP 542.392 1426.967 582.557 -955.118 2039.902 .931 5 .395Max TP 152.295 719.100 293.571 -602.354 906.944 0.519 5 .626Avg TP 548.428 1452.785 593.097 -976.176 2073.032 .925 5 .398
Accuracy 13.750 12.354 5.044 .785 26.715 2.726 5 .041
136