welcome bay area regional economic vitality conversation june 11, 2004 made possible through...
TRANSCRIPT

Welcome
Bay Area Regional Economic Vitality ConversationJune 11, 2004
Made possible through generous support from Pacific Gas and Electric Company

Background for Bay AreaBackground for Bay AreaEconomic Vitality ConversationEconomic Vitality Conversation
June 11, 2004June 11, 2004
Presented by: Stephen LevyPresented by: Stephen Levy

Increasing California's Competitive Edge
Reduce the Negatives Workers' Compensation Energy Costs Housing Costs Improving the Efficiency of Regulations
Increase the Positives Investing in Education Investing in Transportation Creating Great Communities to Live & Work

Where We Are NowWhere We Are Now
The Impact of Low U.S. Job The Impact of Low U.S. Job GrowthGrowth

United States Change in G.D.P.

U.S. Productivity Growth Rate
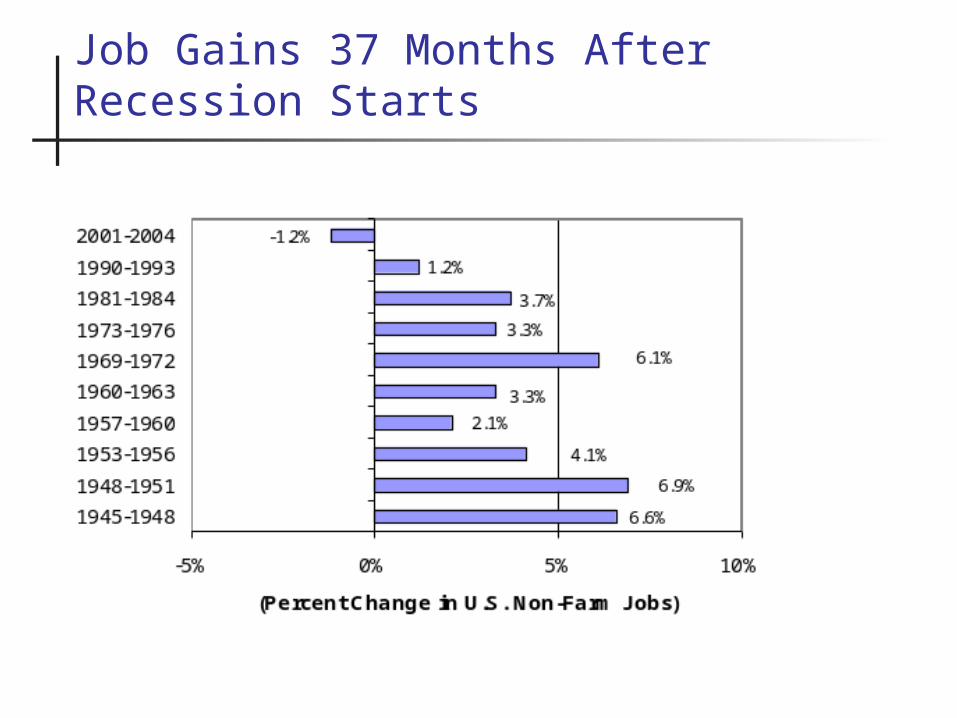
Job Gains 37 Months After Recession Starts
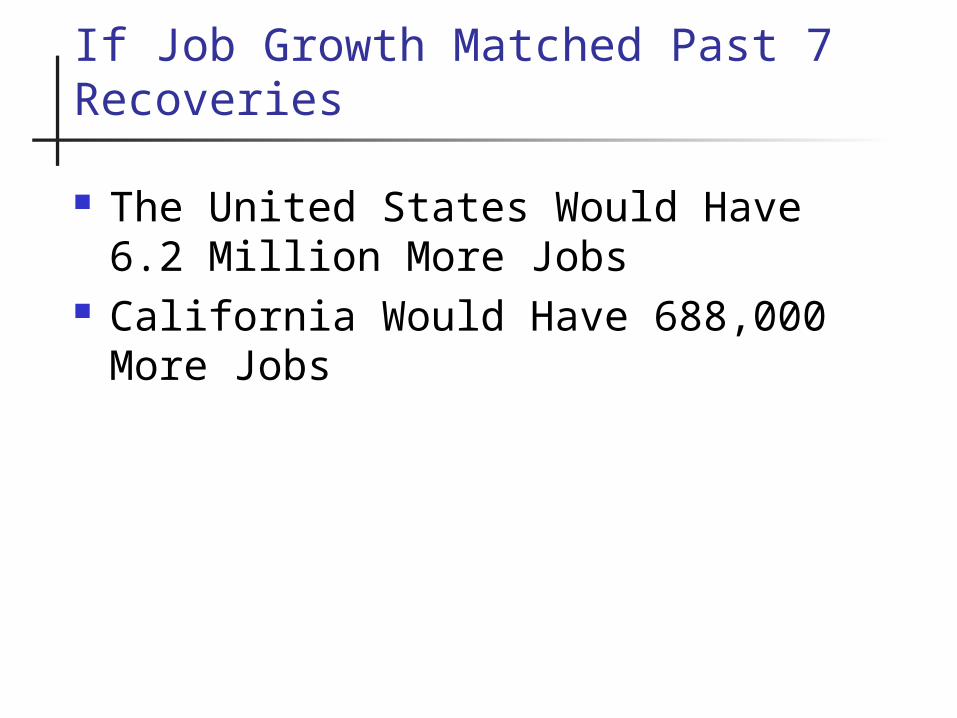
If Job Growth Matched Past 7 Recoveries
The United States Would Have 6.2 Million More Jobs
California Would Have 688,000 More Jobs

Where We Are NowWhere We Are Now
California Job TrendsCalifornia Job Trends
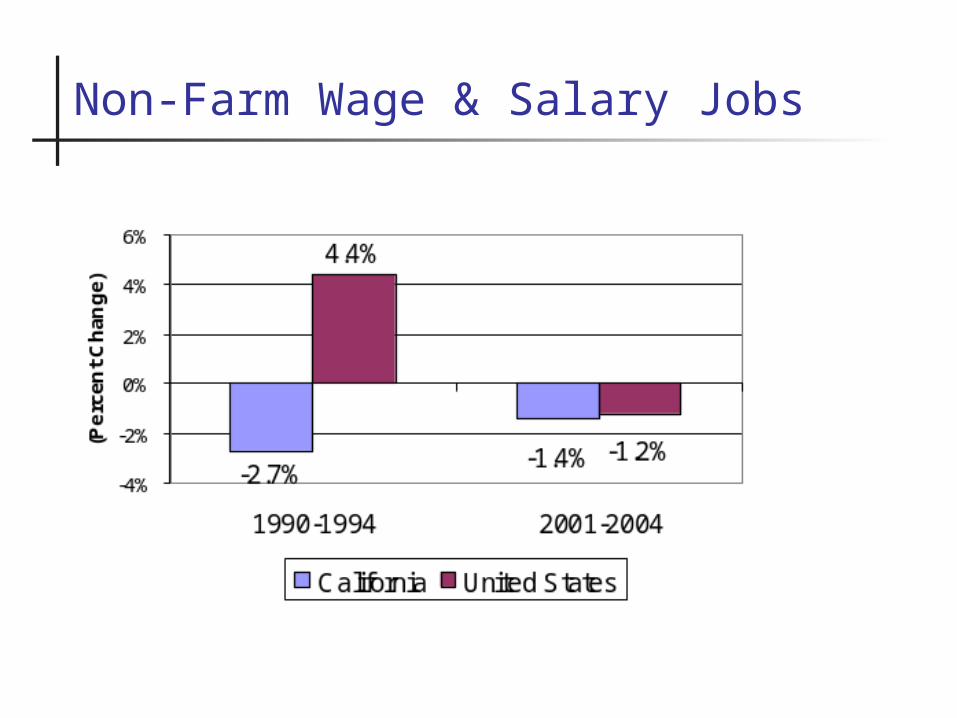
Non-Farm Wage & Salary Jobs

Non-Farm Wage & Salary Jobs

Job Losses Concentrated in Manufacturing

A Decline in U.S. Manufacturing?
8%
10%
12%
14%
16%
18%
20%
22%
24%
Jan-
75
Jan-
77
Jan-
79
Jan-
81
Jan-
83
Jan-
85
Jan-
87
Jan-
89
Jan-
91
Jan-
93
Jan-
95
Jan-
97
Jan-
99
Jan-
01
Jan-
03
% E
mp
loym
ent
in m
anu
fact
uri
ng
40
50
60
70
80
90
100
110
120
130
US
Man
ufa
ctu
rin
g O
utp
ut
Employment: A Victim of Productivity Gains & Industry Shifts to Capital Intensive Sectors
Where We Are NowWhere We Are Now
Bay AreaBay Area
California Economic Regions Show California Economic Regions Show Different TrendsDifferent Trends
Industries Matter for Regional GrowthIndustries Matter for Regional Growth

Growth in Non-Farm Jobs (Mar 01-Mar 04)

Bay Area Job Growth by Metro Area

The LA Economy: Stronger Than Payroll #’s
Rents: Change 01 Q1 – 03 Q4
Center City Off
Suburban Off Industrial Retail Apts
SACRAMENTO -2.5% -8.5% -4.8% 8.0% 6.3%SAN DIEGO -2.6% -10.1% 5.0% 5.6% 7.0%INLAND EMPIRE -4.4% 7.3% -3.1% -1.9% 14.8%LOS ANGELES -10.3% -4.9% -4.4% 1.4% 5.3%ORANGE COUNTY -14.6% -13.4% -9.6% -2.2% 1.4%National Average -20.5% -20.8% -9.9% -0.9% -4.5%OAKLAND -36.9% -28.8% -19.2% -5.1% -25.9%SAN JOSE -54.4% -62.3% -31.2% -11.3% -36.7%SAN FRANCISCO -59.7% -61.0% -25.5% -12.0% -31.2%

Manufacturing Job Losses

Manufacturing Jobs

Manufacturing Job Loss
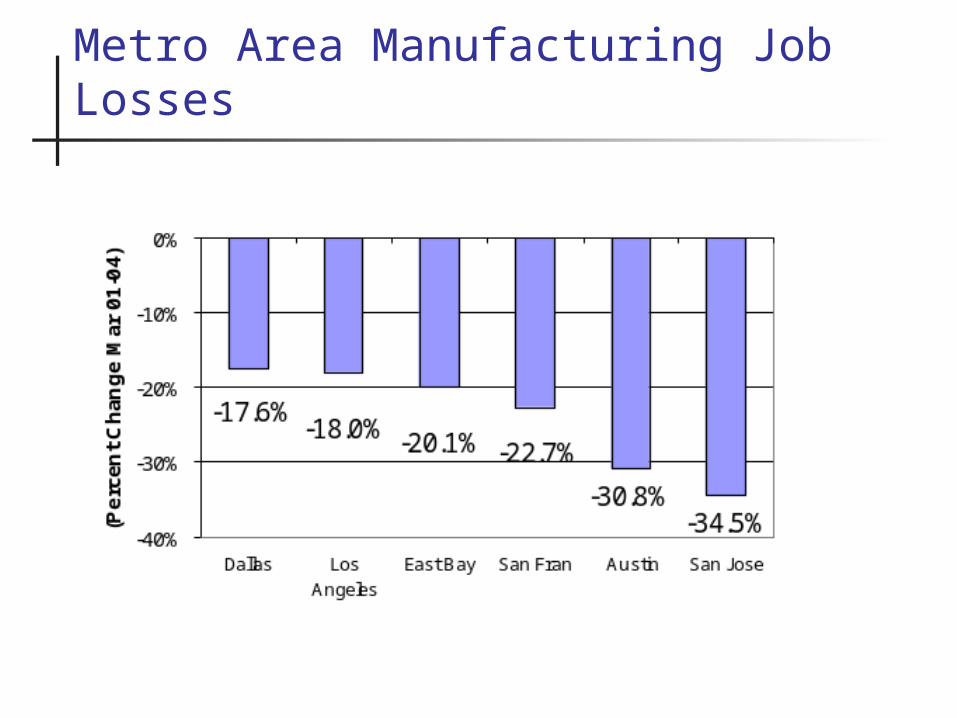
Metro Area Manufacturing Job Losses

Nevada Manufacturing Job Growth

But Manufacturing is Not the But Manufacturing is Not the Major Part of the Bay Area's Major Part of the Bay Area's
Economic BaseEconomic Base

Bay Area Economic Base
376.8
217.8
208.1
192
165.4
117.1
108.8
40.1
0 100 200 300 400 500
Prof., Tech., Sci. & Mgmnt.Serv.
Whsle. Trade and Transp.
High Tech Manufacturing
Diversified Manufacturing
Basic Government
Basic Information Services
Entertainment and Tourism
Resource Based
(Thousands of Jobs in 2002)

Increasing California's Competitive Edge
Reduce the Negatives Workers' Compensation Energy Costs Housing Costs Improving the Efficiency of Regulations
Increase the Positives Investing in Education Investing in Transportation Creating Great Communities to Live & Work

QUESTIONS?QUESTIONS?