welcome to the 2012 annual meeting - dbag-website · negative net income: €-16.6mn (prev.yr. net...
TRANSCRIPT

Frankfurt, 29 March 2012
Welcome to the 2012 Annual Meeting

Financial year 2010/2011 at a glance
Three new investments –Romaco –Spheros, Brötje-
Automation (2011/2012)
Two realisations –Heim & Haus, Preh
NAV per share declines to €17.47 –Return on NAV -6.2%
Negative net income of €-16.6mn in financial year 2010/2011 –Previous year: €34.1mn
Distribution: €0.40 dividend and €0.40 surplus dividend €0.80 total per share
Annual Meeting 2012
2
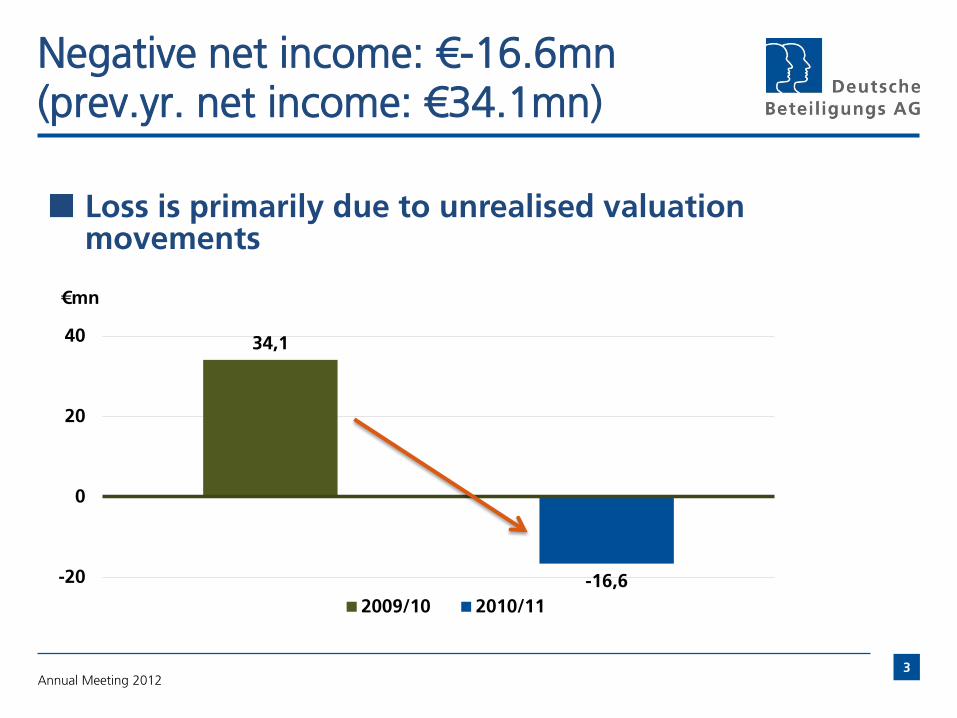
Negative net income: €-16.6mn (prev.yr. net income: €34.1mn)
Loss is primarily due to unrealised valuation movements
34,1
-16,6 -20
0
20
40
€mn
2009/10 2010/11
Annual Meeting 2012 3
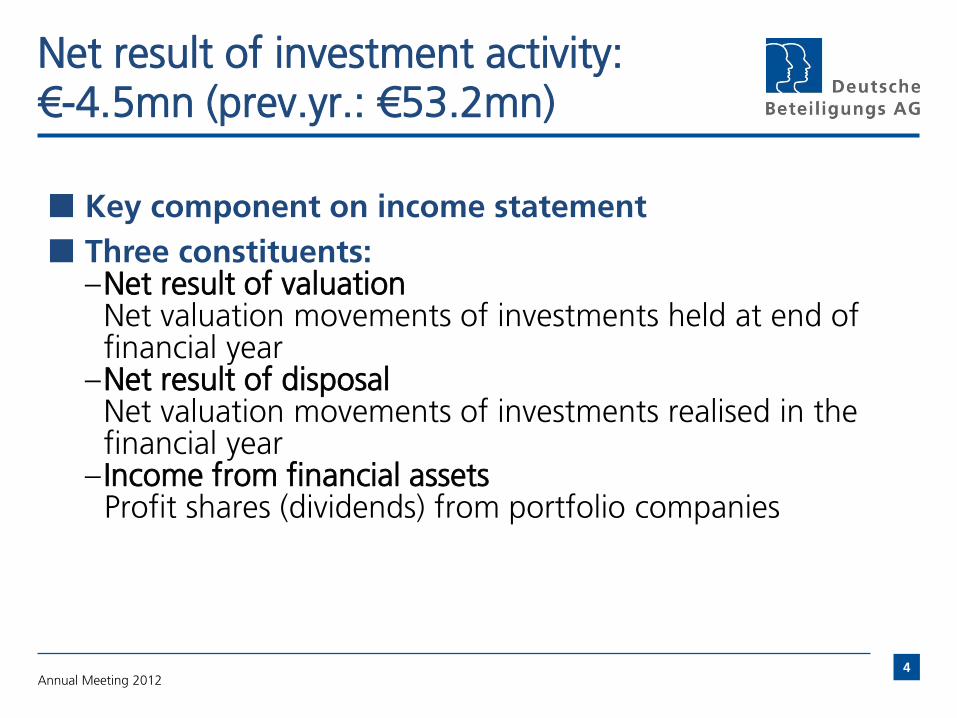
Net result of investment activity: €-4.5mn (prev.yr.: €53.2mn)
Key component on income statement
Three constituents: –Net result of valuation
Net valuation movements of investments held at end of financial year
–Net result of disposal Net valuation movements of investments realised in the financial year
– Income from financial assets Profit shares (dividends) from portfolio companies
Annual Meeting 2012 4
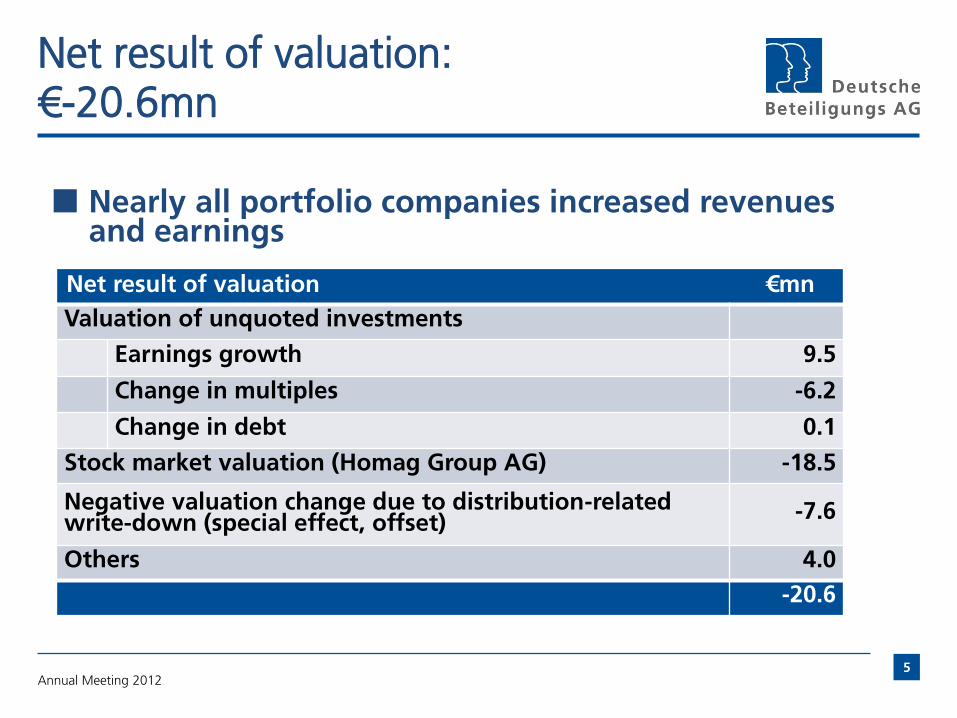
Net result of valuation: €-20.6mn
Net result of valuation €mn
Valuation of unquoted investments
Earnings growth 9.5
Change in multiples -6.2
Change in debt 0.1
Stock market valuation (Homag Group AG) -18.5
Negative valuation change due to distribution-related write-down (special effect, offset)
-7.6
Others 4.0
-20.6
Nearly all portfolio companies increased revenues and earnings
Annual Meeting 2012 5

Price trend of Homag shares caused greatest valuation effect
IPO in 2007: DBAG sold 40% of its holding in Homag –Proceeds (incl. dividends
since 2008) 140% of historical cost of entire investment
Price trend 2010/11: €15.48 €8.48, -45%
Price trend 2009/10: €8.46 €15.48, +83%
0,00
5,00
10,00
15,00
20,00
31/10/09 31/10/10 31/10/11
Annual Meeting 2012 6
€
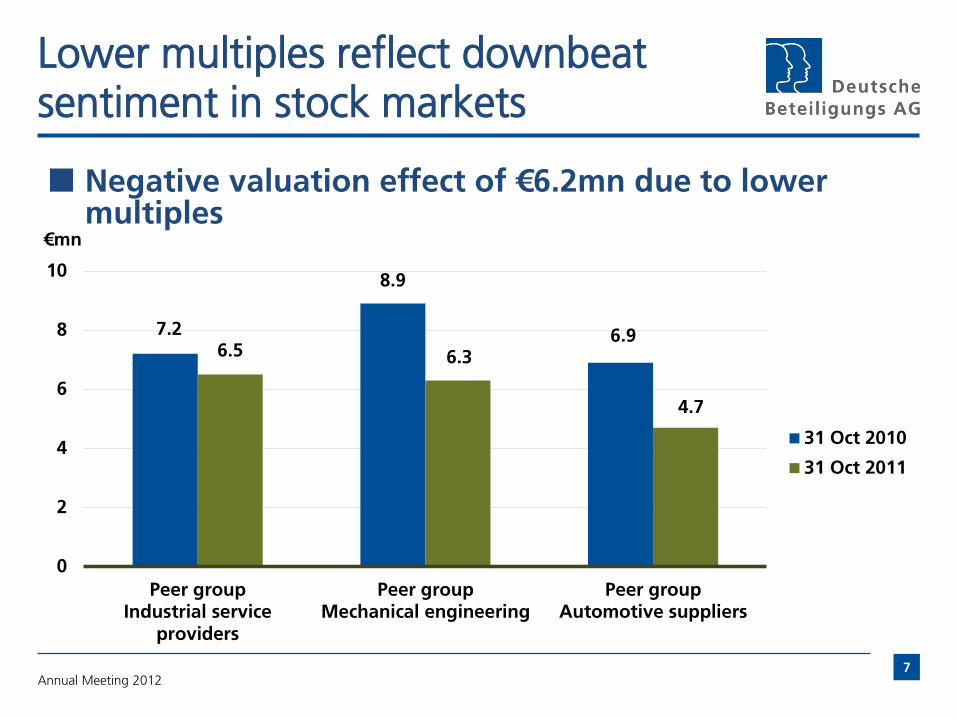
Lower multiples reflect downbeat sentiment in stock markets
Negative valuation effect of €6.2mn due to lower multiples
7.2
8.9
6.9 6.5 6.3
4.7
0
2
4
6
8
10
Peer groupIndustrial service
providers
Peer groupMechanical engineering
Peer groupAutomotive suppliers
31 Oct 2010
31 Oct 2011
Annual Meeting 2012 7
€mn

Net result of valuation: €-20.6mn (prev.yr.: €42.5mn)
Nearly all portfolio companies increased revenues and earnings
Annual Meeting 2012 8
Net result of valuation €mn
Valuation of unquoted investments
Earnings growth 9.5
Change in multiples -6.2
Change in debt 0.1
Stock market valuation (Homag Group AG) -18.5
Negative valuation change due to distribution-related write-down (special effect, offset)
-7.6
Others 4.0
-20.6

Net result of disposal: €6.7mn (prev.yr.: €1.1mn)
Net result of disposal: difference between sales proceeds and opening valuation at start of financial year not conclusive of long-term performance
Two realisations –Preh – (partial) realisation in April 2011
• Put option for remaining shares (25.1% of original investment) exercisable beginning of 2013
–Heim & Haus – realisation in May 2011
Annual Meeting 2012 9
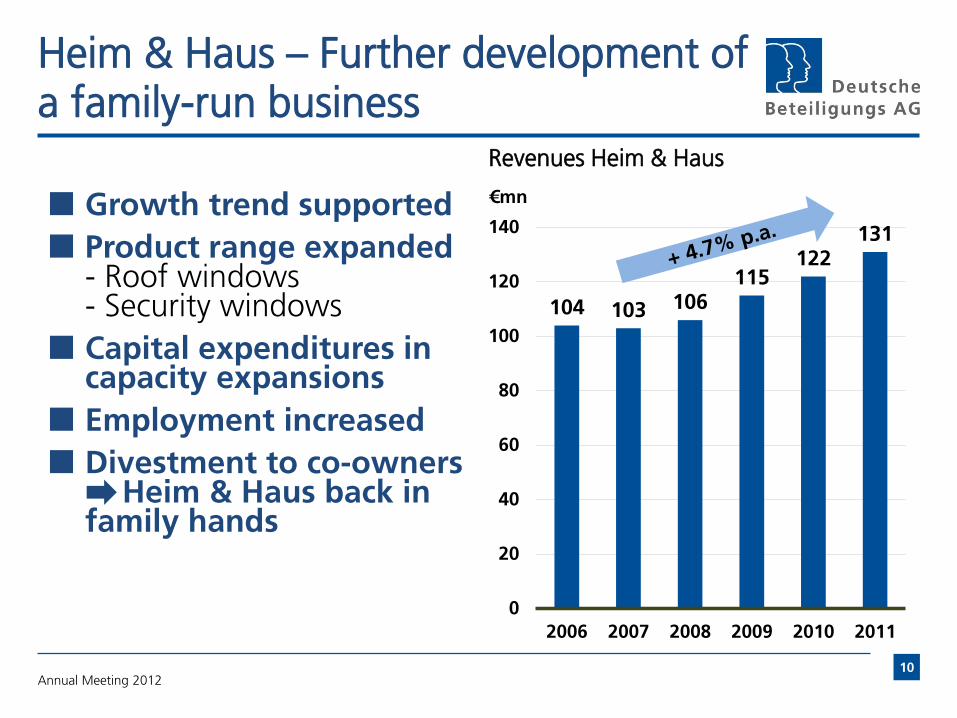
Heim & Haus – Further development of a family-run business
Growth trend supported
Product range expanded - Roof windows - Security windows
Capital expenditures in capacity expansions
Employment increased
Divestment to co-owners Heim & Haus back in family hands
104 103 106 115
122 131
0
20
40
60
80
100
120
140
2006 2007 2008 2009 2010 2011
Annual Meeting 2012 10
Revenues Heim & Haus
€mn
Preh – Successful implementation of investment strategy
Transformed into a purely automotive supplier - Two partial entities (2004 share of revenues: 18%) divested in 2008 and 2011
Attractive new product categories initiated - “Electronic control units”: battery management for electro-vehicles - “Driver control units”
Customer base expanded / internationalisation - Sept. 2005: Production site set up in Mexico - March 2009: Production site set up in Romania - Nov. 2010: Joint venture founded and production site set up in China Rapid market entry in China
Annual Meeting 2012 11
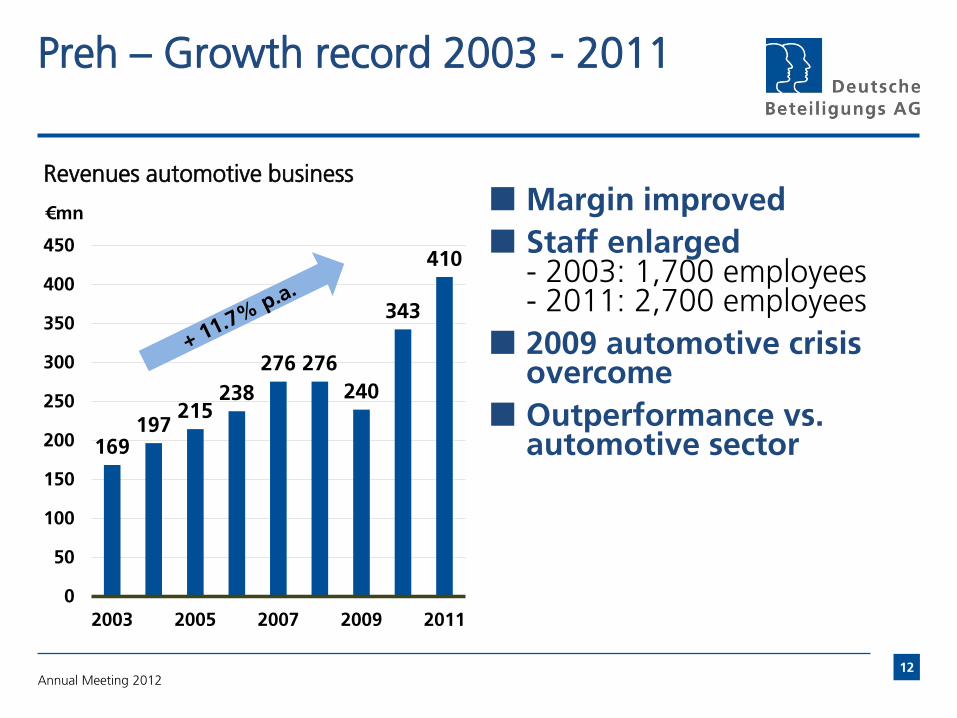
Preh – Growth record 2003 - 2011
Margin improved
Staff enlarged - 2003: 1,700 employees - 2011: 2,700 employees
2009 automotive crisis overcome
Outperformance vs. automotive sector 169
197 215
238
276 276
240
343
410
0
50
100
150
200
250
300
350
400
450
2003 2005 2007 2009 2011
€mn
Annual Meeting 2012 12
Revenues automotive business

Current income from financial assets: €9.4mn (prev.yr.: €6.6mn)
Increase due to special effects –Distribution of €7.6mn offset by distribution-related
writedown on an investment
Details in Management’s Report
Annual Meeting 2012 13
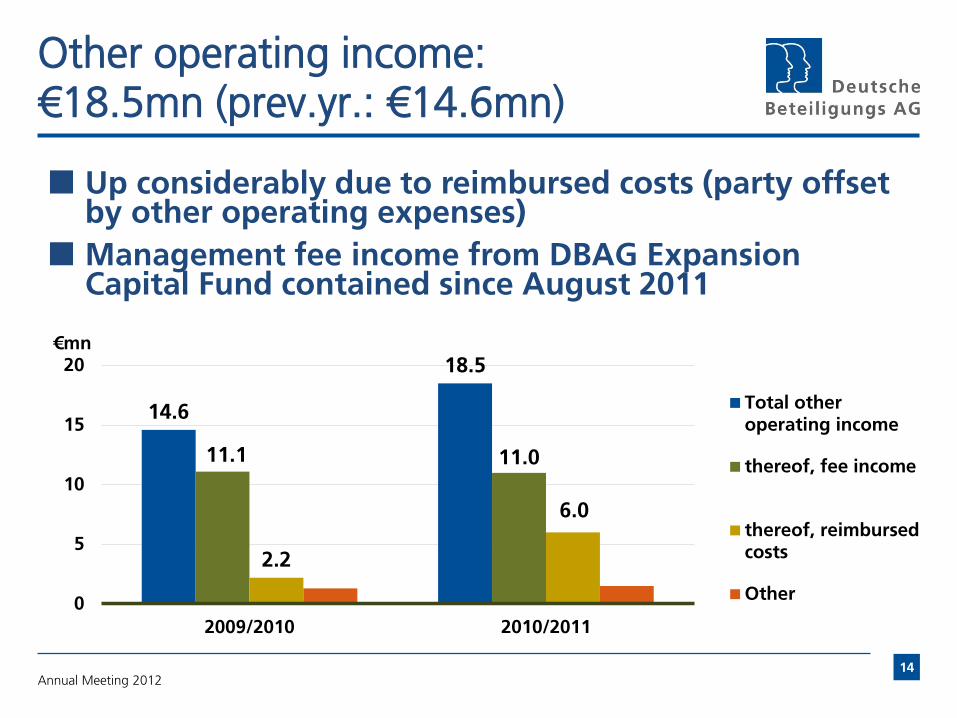
Other operating income: €18.5mn (prev.yr.: €14.6mn)
Up considerably due to reimbursed costs (party offset by other operating expenses)
Management fee income from DBAG Expansion Capital Fund contained since August 2011
14.6
18.5
11.1 11.0
2.2
6.0
0
5
10
15
20
2009/2010 2010/2011
€mn
Total otheroperating income
thereof, fee income
thereof, reimbursedcosts
Other
Annual Meeting 2012 14
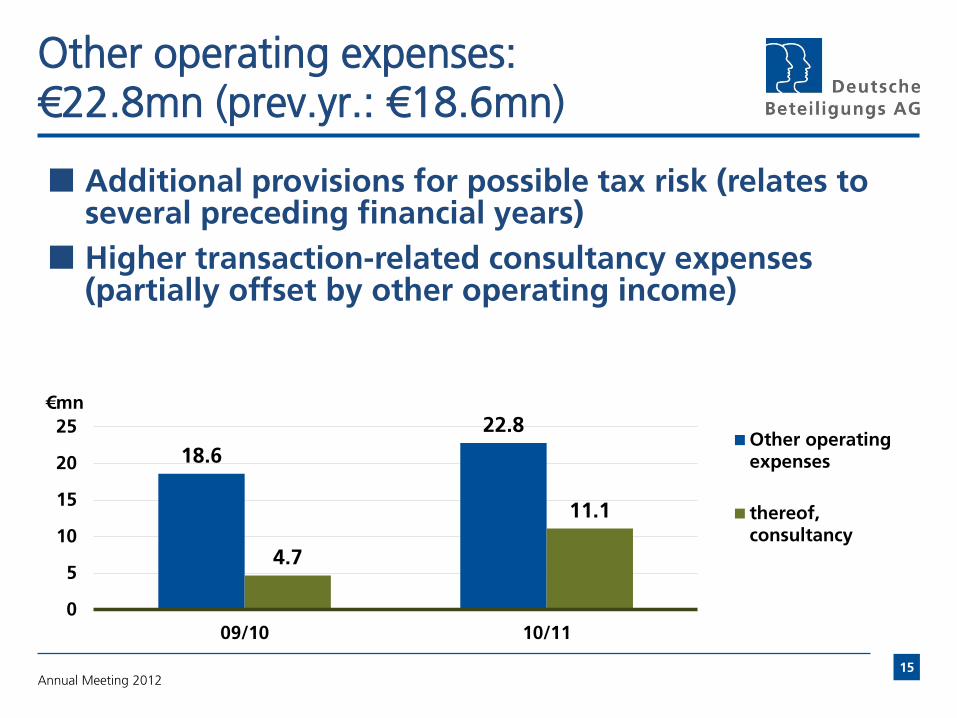
Other operating expenses: €22.8mn (prev.yr.: €18.6mn)
18.6
22.8
4.7
11.1
0
5
10
15
20
25
09/10 10/11
€mn
Other operatingexpenses
thereof,consultancy
Additional provisions for possible tax risk (relates to several preceding financial years)
Higher transaction-related consultancy expenses (partially offset by other operating income)
Annual Meeting 2012 15
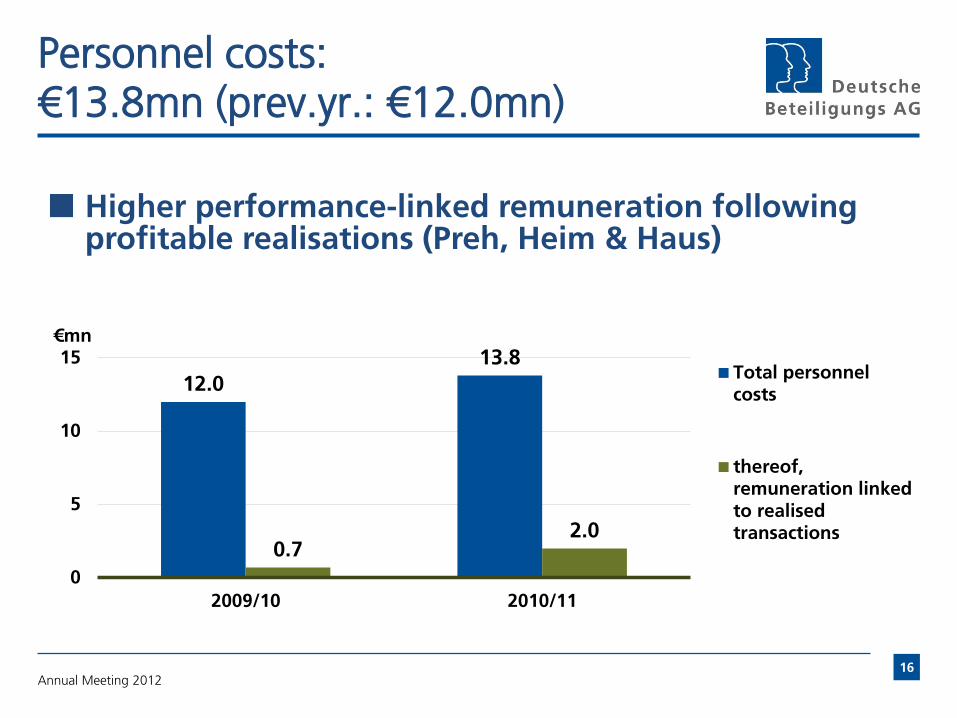
Personnel costs: €13.8mn (prev.yr.: €12.0mn)
12.0
13.8
0.7 2.0
0
5
10
15
2009/10 2010/11
€mn
Total personnelcosts
thereof,remuneration linkedto realisedtransactions
Higher performance-linked remuneration following profitable realisations (Preh, Heim & Haus)
Annual Meeting 2012 16

Net interest: €3.1mn (prev.yr.: €0.8mn) Net taxes: €1.8mn (prev.yr.: €1.3mn)
Increase in net interest primarily due to interest on tax refund
Tax refunds in 2009/2010 and 2010/2011 from preceding years
0.8
3.1
1.3
1.8
0
2
4
2009/2010 2010/2011
€mn
Net interest
Income taxes
Annual Meeting 2012 17

Balance sheet: NAV per share fell to €17.47
Net asset value per share lost 6.2%
20.03 €
18.63 €
17.47 €
1.40 €
16,00
16,50
17,00
17,50
18,00
18,50
19,00
19,50
20,00
20,50
31 Oct 10 31 Oct 11
2011 dividend
NAV per share
-1.16 € /
-6.2%
Annual Meeting 2012 18
€

Balance sheet: Liquidity of €155.6mn at reporting date
Financial assets and loans: “portfolio”, shelf companies and companies the majority of which is attributable to third parties
“Liquidity”: cash, short-term securities and long-term securities
Liquidity outflows for investments (Spheros GmbH, Brötje-Automation GmbH) and dividend of ~ €32mn
Assets
(€mn)
31 Oct.
2011
31 Oct.
2010
Liabilities
(€mn)
31 Oct.
2011
31 Oct.
2010
Financial assets
and loans 97.1 134.6 Equity 238.9 273.9
Other (e.g. receivables)
27.2 40.8 Non-current liabilities
10.9 15.8
Liquidity 155.6 140.7 Current liabilities
30.1 26.4
279.9 316.1 279.9 316.1
Annual Meeting 2012 19

Ten-year average return on NAV per share: 11.2 percent
Annual Meeting 2012
-15.8
3.1
18.2
41.3
82.7
136.5
-51.1
19.6
34.1
-16.6 -9.7%
2.1%
10.8%
20.0%
36.4%
56.2%
-17.5%
7.3% 12.7%
-6.2%
-30%
-20%
-10%
0%
10%
20%
30%
40%
50%
60%
70%
-60
-40
-20
0
20
40
60
80
100
120
140
01/02 02/03 03/04 04/05 05/06 06/07 07/08 08/09 09/10 10/11
Net income in €mn Return on NAV per share as a %
20
2001/02 to 2003/04 based on HGB accounting, thereafter on IFRS.
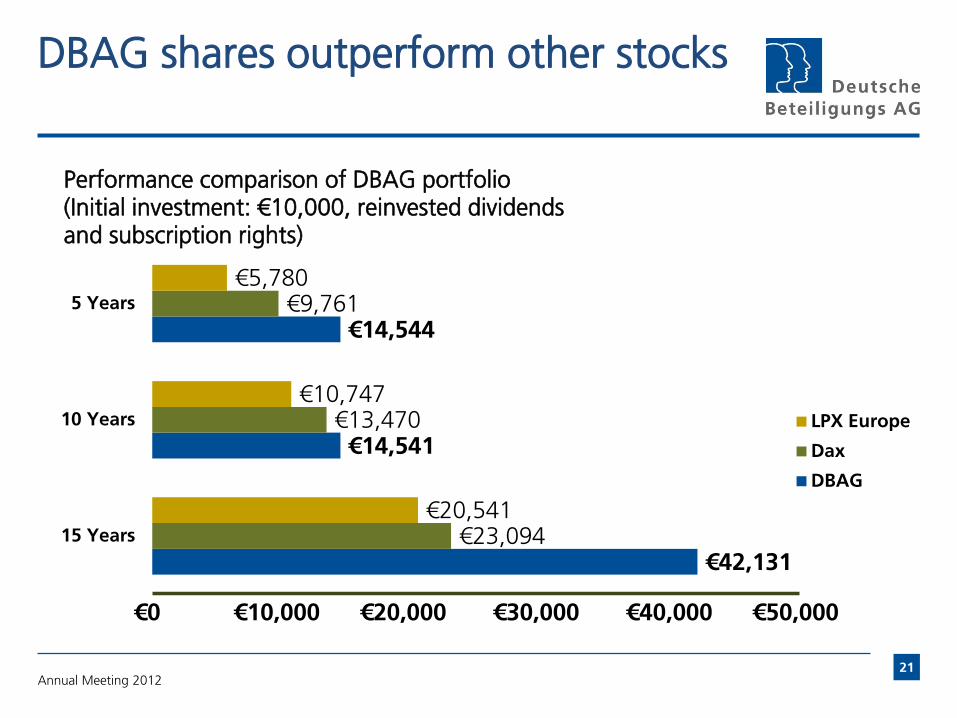
DBAG shares outperform other stocks
Annual Meeting 2012 21
€42,131
€14,541
€14,544
€23,094
€13,470
€9,761
€20,541
€10,747
€5,780
0 € 10.000 € 20.000 € 30.000 € 40.000 € 50.000 €
15 Years
10 Years
5 Years
Performance comparison of DBAG portfolio (Initial investment: €10,000, reinvested dividends and subscription rights)
LPX Europe
Dax
DBAG
€0 €10,000 €20,000 €30,000 €40,000 €50,000
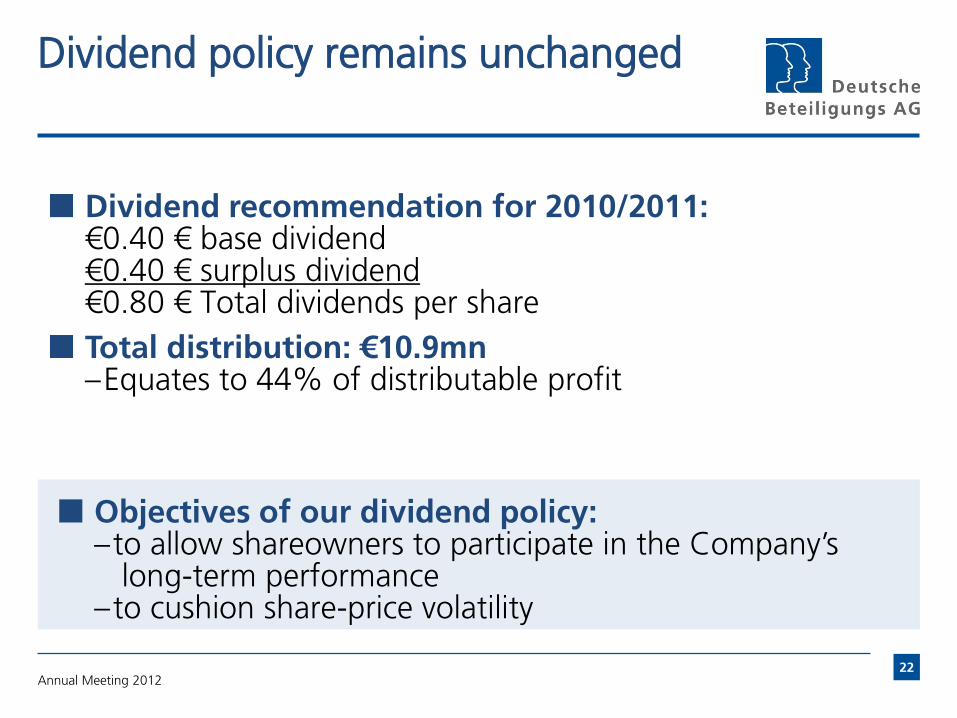
Dividend policy remains unchanged
Dividend recommendation for 2010/2011: €0.40 € base dividend €0.40 € surplus dividend €0.80 € Total dividends per share
Total distribution: €10.9mn –Equates to 44% of distributable profit
Objectives of our dividend policy: –to allow shareowners to participate in the Company’s
long-term performance –to cushion share-price volatility
Annual Meeting 2012 22
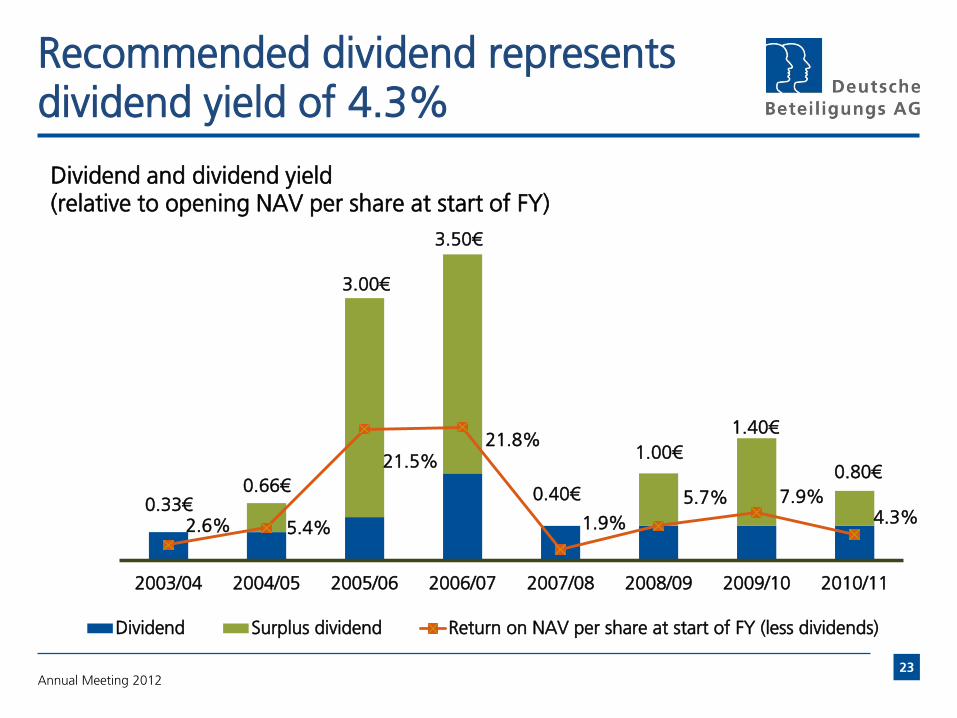
Recommended dividend represents dividend yield of 4.3%
0.33€ 0.66€
3.00€
3.50€
0.40€
1.00€
1.40€
0.80€
2.6% 5.4%
21.5% 21.8%
1.9%
5.7% 7.9% 4.3%
2003/04 2004/05 2005/06 2006/07 2007/08 2008/09 2009/10 2010/11
Dividend and dividend yield (relative to opening NAV per share at start of FY)
Dividend Surplus dividend Return on NAV per share at start of FY (less dividends)
Annual Meeting 2012 23

Changes to portfolio: New investments also very international
Annual Meeting 2012 24
Geographical revenue split
78%
21%
29%
53%
48%
20%
24%
17%
5%
8%
42%
51%
18%
31%
8%
12%
3%
6%
8%
44%
Brötje-Automation
Clyde-Bergemann
Coperion
Homag
Romaco
Spheros Europe
NorthAmerica
Asia/Pacific
Other
71%

Romaco Group – Invested in April 2011
Annual Meeting 2012
Leading manufacturer of machines and lines for packaging and processing applications for the pharma, cosmetics and food industries
Revenues of €93mn
450 employees
Investment: €7.7mn for a 18.7% share (another 77.3% held by DBAG Fund V)
25

Romaco at a glance
Two business segments: Packaging machines (share of revenues: 66%) - Technologically advanced, flexible machines - Clients: largely contract packers and generics manufacturers (market growing strongly) Process technology (33%) - Technologically mature products, partially with service-intensive components - Clients: Focus on food applications - Market sustainable and stable
Standard machines with low technology risks and order sizes
Strong service business and large installed base (24,000 machines worldwide)
Annual Meeting 2012 26
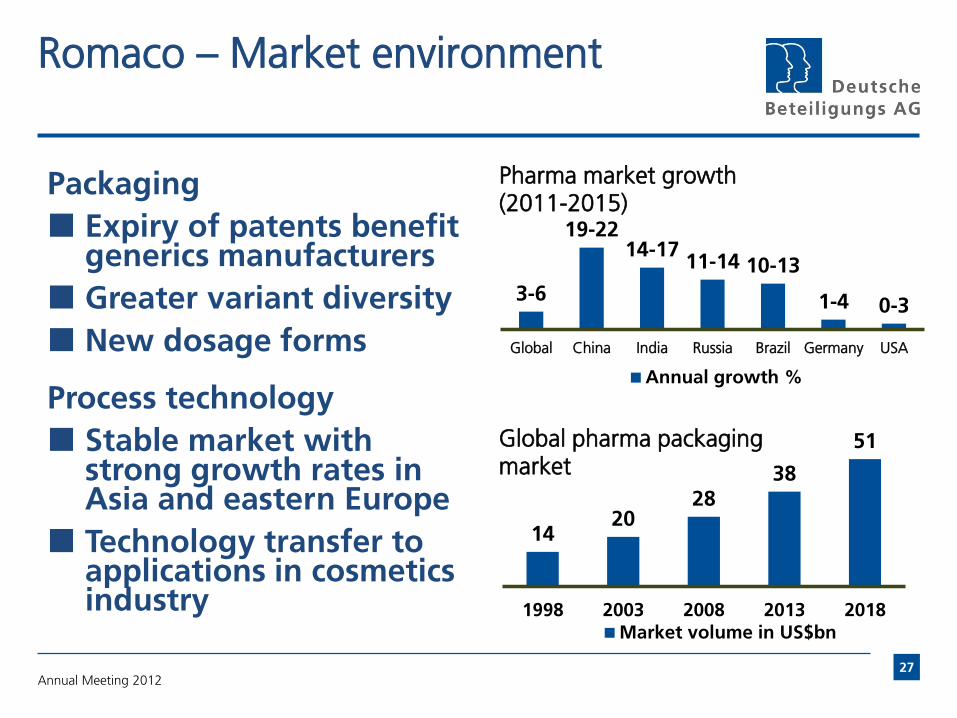
Romaco – Market environment
Packaging
Expiry of patents benefit generics manufacturers
Greater variant diversity
New dosage forms
Process technology
Stable market with strong growth rates in Asia and eastern Europe
Technology transfer to applications in cosmetics industry
14 20
28 38
51
1998 2003 2008 2013 2018
Global pharma packaging market
Market volume in US$bn
3-6
19-22 14-17
11-14 10-13
1-4 0-3
Global China India Russia Brazil Germany USA
Pharma market growth (2011-2015)
Annual growth %
Annual Meeting 2012 27
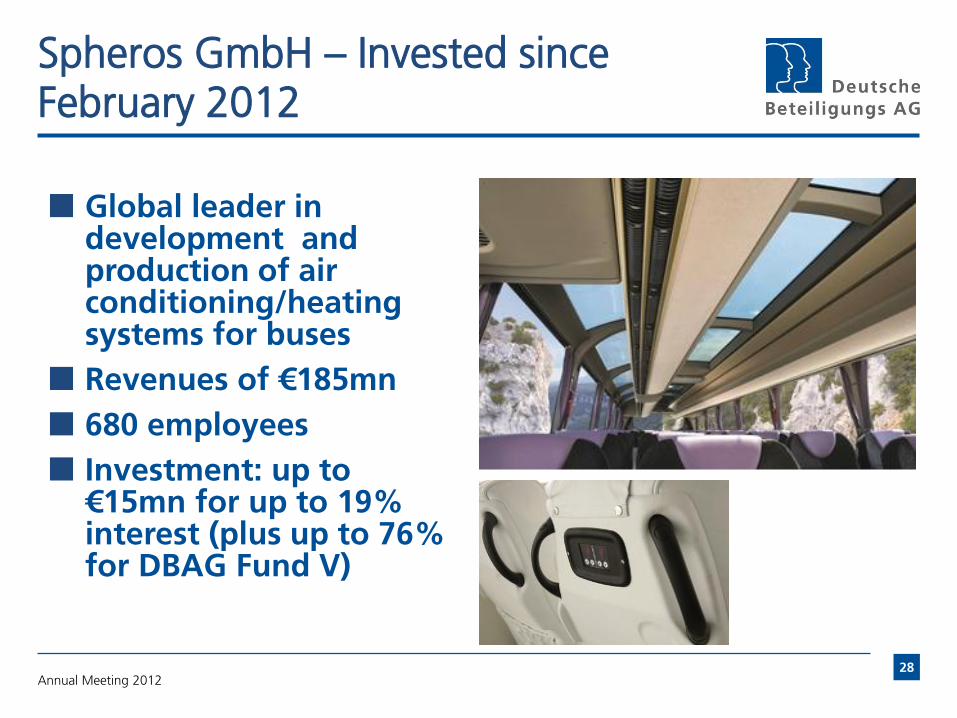
Spheros GmbH – Invested since February 2012
Global leader in development and production of air conditioning/heating systems for buses
Revenues of €185mn
680 employees
Investment: up to €15mn for up to 19% interest (plus up to 76% for DBAG Fund V)
Annual Meeting 2012 28
Spheros at a glance
Annual Meeting 2012
Global market presence -Production sites in Germany, Finland, Turkey, Brazil, India and China - International R&D sites
Innovative, technologically differentiated product portfolio
Leadership position in growing niche market
Clients: bus manufacturers worldwide and bus fleet operators (public and private)
Growth potential through... ...further internationalisation …know-how transfer to other applications
29
Spheros – Market environment
Excellent market position - Spheros’ market share between 15% (air conditioning units) and 35% (engine-independent heating systems)
Bus market a structural growth market - Growing populations, urbanisation, environmental protection regulations, need for greater comfort - Production growing much more strongly than national product: 6.0% p.a. vs. 1.4% p.a. (2004 – 2010) - Future growth rates (2010 – 2015) between 3.5% and 4.9% - Strong market growth in China and India (5% / 10% p.a.)
Bus market is less cyclical than automobile and commercial vehicle industry
Annual Meeting 2012 30
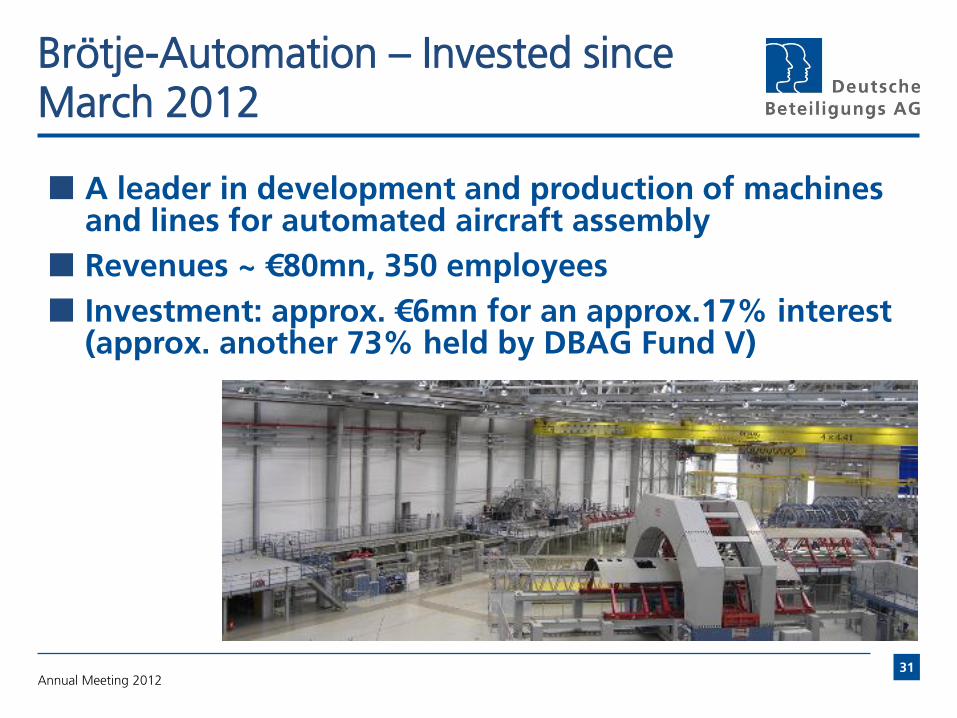
Brötje-Automation – Invested since March 2012
A leader in development and production of machines and lines for automated aircraft assembly
Revenues ~ €80mn, 350 employees
Investment: approx. €6mn for an approx.17% interest (approx. another 73% held by DBAG Fund V)
Annual Meeting 2012 31

Brötje-Automation at a glance
Annual Meeting 2012
Leading market player in its role as a strategic supplier to all major aircraft manufacturers
Products: –Joining technology, especially riveting machines
• Automated production of fuselage and individual sections • Riveting of metal or carbon fibre • Challenge: extremely high precision for positioning of rivets
–Assembly line construction • Factory planning and turnkey services
–Service: high number of installed systems
Transfer of skills to other industries –e.g. machines for use in wind-energy sector (rotor blade
production)
32

Brötje-Automation – Market environment
Brötje-Automation is a leader in a growth market - Aircraft production: expected to grow by 3.3% from
2010 to 2020 Expansion of existing production capacities
New clients: aircraft manufacturers in China and Russia
Quality, reliability, service and ability to construct complete lines are important purchasing criteria for clients - Long-standing customer relationships since early 1990s
USP through benchmark technologies
Annual Meeting 2012 33

Three new management buyouts a basis for future performance
Annual Meeting 2012
Portfolio companies operating in markets that exhibit superior growth
Portfolio companies profiting from current global trends –Romaco: greater prosperity in emerging countries –Spheros: increasing mobility –Brötje-Automation: increasing mobility, rising global cargo
traffic
DBAG Fund V more than 75 percent invested –Eight management buyouts, thereof
• three family-run businesses • one investment (MCE) realised completely, another (Homag
Group AG) partially
34

Focus remains on new investment – Good prerequisites
Experienced investment team, systematically enlarged and strengthened in key competencies –Research – Industrial experts –More team members
Good reputation among all market participants –Citations, i.a. “DACH House of the Year”
Ample liquid funds –Liquidity of ~ €120mn on balance sheet of DBAG –Commitments of ~ €250mn to co-investment funds
Annual Meeting 2012 35
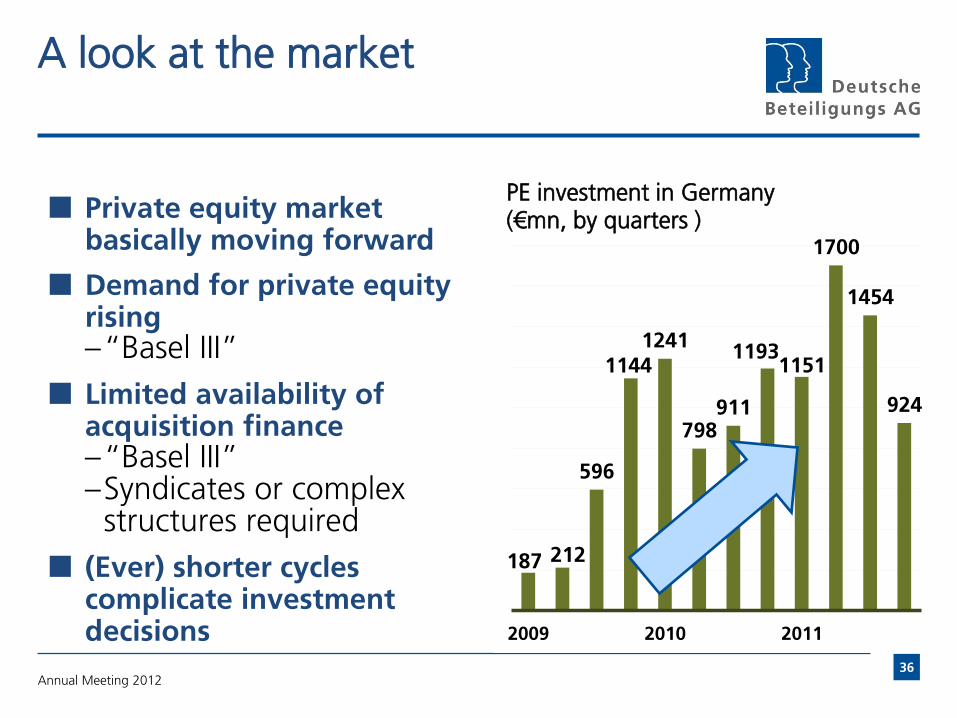
A look at the market
Private equity market basically moving forward
Demand for private equity rising –“Basel III”
Limited availability of acquisition finance –“Basel III” –Syndicates or complex
structures required
(Ever) shorter cycles complicate investment decisions
Annual Meeting 2012
187 212
596
1144 1241
798 911
1193 1151
1700
1454
924
2009 2010 2011
PE investment in Germany (€mn, by quarters )
36

Good start to new financial year: First-quarter net income of €6.9mn
Net income of €6.9mn in first quarter
Net asset value per share is €17.96 –An increase of 2.9% in the first three months of 2011/12*
Gain primarily derives from net result of valuation –Good current trading performance by portfolio companies:
2012 budgets > 2011 actual –Homag (share price up 15% in Q1) –Higher multiples in all sectors
Portfolio companies continue to make good progress
But: earnings forecasts remain difficult to make in view of prevailing uncertainty
Annual Meeting 2012
* Based on NAV per share at 31 October 2011, less proposed dividend
37
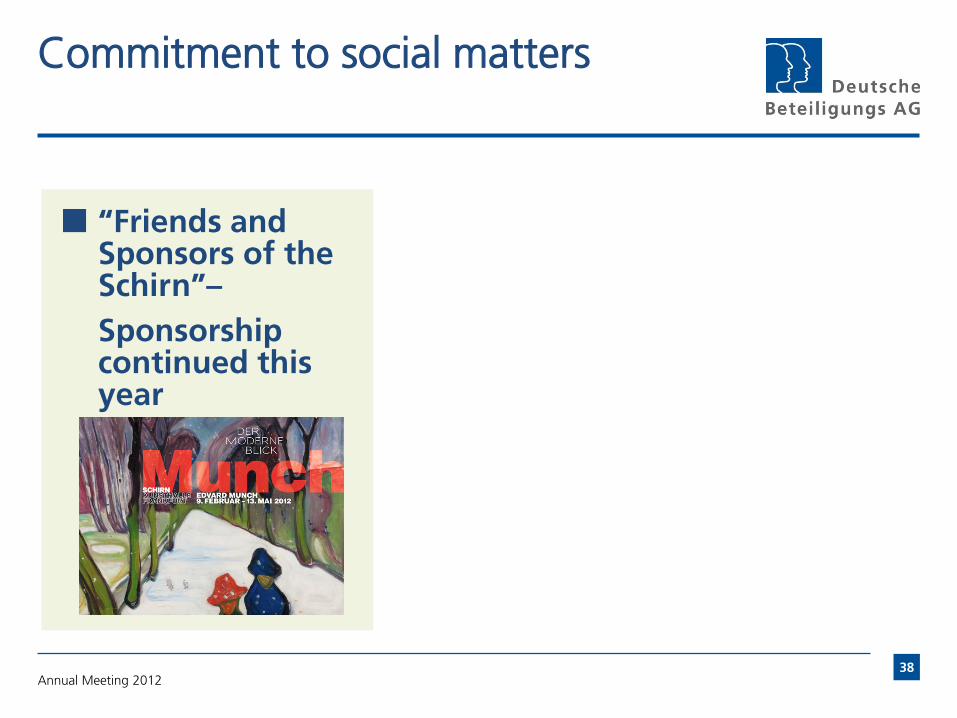
Commitment to social matters
“Friends and Sponsors of the Schirn”–
Sponsorship continued this year
Annual Meeting 2012 38
Agenda Item 1
Presentation of the adopted annual Financial Statements and Management’s Report of Deutsche Beteiligungs AG at 31 October 2011, together with an explanatory report by the Board of Management on disclosures pursuant to § 289 (4) HGB (German Commercial Code); presentation of the approved Consolidated Financial Statements and Management’s Report for the Group at 31 October 2011, together with an explanatory report by the Board of Management on disclosures pursuant to § 315 (4) HGB and the Report of the Supervisory Board
Annual Meeting 2012 39
Agenda Item 2
Resolution on the appropriation of retained profit
Annual Meeting 2012 40
Agenda Item 3
Resolution on the ratification of the actions of the members of the Board of Management for financial year 2010/2011
Annual Meeting 2012 41

Agenda Item 4
Resolution on the ratification of the actions of the members of the Supervisory Board for financial year 2010/2011
Annual Meeting 2012 42
Agenda Item 5
Appointment of auditors for financial year 2011/2012
Annual Meeting 2012 43

Thank you!
Auf Wiedersehen in March 2013
For the latest news visit www.deutsche-beteiligung.de
Annual Meeting 2012 44

This presentation contains forward-looking statements. Forward-looking statements are
statements that are not historical facts, including statements about our beliefs and expectations.
Any statement in this presentation that states our intentions, beliefs, expectations or predictions
(and the assumptions underlying them) is a forward-looking statement. These statements are
based on plans, estimates and projections as they are currently available to the management of
Deutsche Beteiligungs AG. Forward-looking statements therefore speak only as of the date they
are made, and we undertake no obligation to update publicly any of them in light of new
information or future events.
Forward-looking statements involve inherent risks and uncertainties. A number of important
factors could therefore cause actual results to differ materially from those contained in any
forward-looking statement. Such factors include the conditions in the financial markets in
Germany, in Europe, in the United States and elsewhere from which we derive a substantial
portion of our business.
Disclaimer
Annual Meeting 2012 45