welcome to thisinformational webinar on an … guidance...recommendations on marine mammal weighting...
TRANSCRIPT

Welcome to this informational webinar on an overview of the NMFS Technical Guidance for Assessing the Effects of Anthropogenic Noise on Marine Mammal Hearing (published as NOAA Technical Memorandum), which can be found at the web site at the bottom of this slide. This webinar is meant to serve as a companion to the Technical Guidance document that was finalized in July 2016.
Note: There is an additional webinar available covering the Technical Guidance’s optional User Spreadsheet.
1
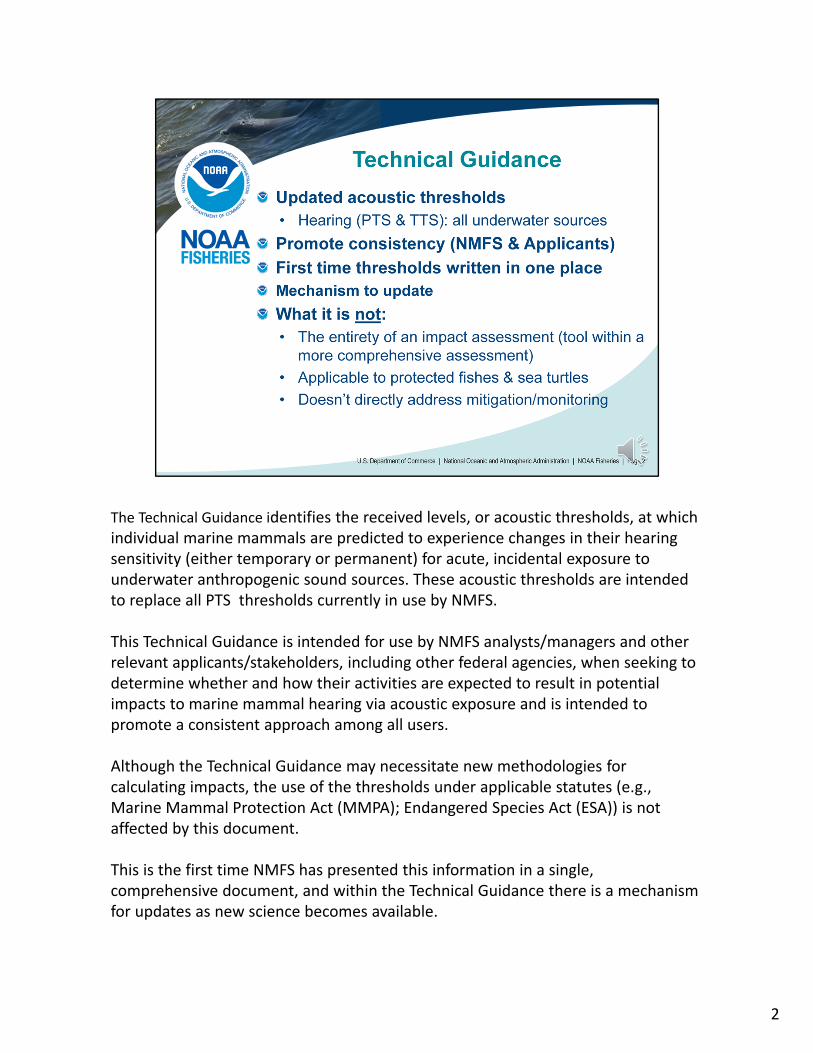
The Technical Guidance identifies the received levels, or acoustic thresholds, at which individual marine mammals are predicted to experience changes in their hearing sensitivity (either temporary or permanent) for acute, incidental exposure to underwater anthropogenic sound sources. These acoustic thresholds are intended to replace all PTS thresholds currently in use by NMFS.
This Technical Guidance is intended for use by NMFS analysts/managers and other relevant applicants/stakeholders, including other federal agencies, when seeking to determine whether and how their activities are expected to result in potential impacts to marine mammal hearing via acoustic exposure and is intended to promote a consistent approach among all users.
Although the Technical Guidance may necessitate new methodologies for calculating impacts, the use of the thresholds under applicable statutes (e.g., Marine Mammal Protection Act (MMPA); Endangered Species Act (ESA)) is not affected by this document.
This is the first time NMFS has presented this information in a single, comprehensive document, and within the Technical Guidance there is a mechanism for updates as new science becomes available.
2

What the Technical Guidance is NOT: The Technical Guidance’s acoustic thresholds do not represent the entirety of the comprehensive analysis, but rather serve as one tool to help evaluate the effects during a proposed action on marine mammals and make findings required by NOAA’s various statutes.
This document only addresses effects of noise on marine mammal hearing and does not provide guidance on behavioral disturbance or for other protected marine species, such as fishes and sea turtles.
Mitigation and monitoring requirements associated with an MMPA authorization or ESA consultation or permit are independent management decisions made in the context of the proposed activity and comprehensive effects analysis, and are beyond the scope of the Technical Guidance. NMFS acknowledges exclusion zones and monitoring zones often correspond to acoustic thresholds but that is not a legal requirement, and the updated thresholds may make such a simple correlation more challenging. The Technical Guidance can be used to inform the development of mitigation or monitoring.
2

The development of the Technical Guidance began in 2005 as a means to update NMFS’s current thresholds derived in 1997 and to reflect updated science on marine mammal hearing and effects of noise on hearing, as well as a better understanding of specific source characteristics that are more likely to result in impacts on hearing.
Specifically, the Southall panel of acoustic experts summarized and published scientific recommendations on marine mammal weighting functions and thresholds for PTS and TTS for marine mammals in a 2007 Aquatic Mammals article and are currently in the process of updating this publication.
Additionally, the Navy (Dr. James Finneran) for their upcoming Phase 3 EIS analyses have summarized and derived updated methodology for deriving marine mammal weighting functions and PTS/TTS thresholds, which includes data published in a 2015 JASA review paper on marine mammal TTS studies by Dr. Finneran.
Thus, the Technical Guidance is meant to capture the new and updated information as a result of these efforts.
Before the Technical Guidance was finalized, it underwent several review processes, including 3 peer reviews, as well as one follow‐up peer review, and 3 public comment periods. More information on these processes can be found in Appendix C.
3

The Technical Guidance contains two main sections: Main document and more detailed Appendices.
The main document is what most users will rely upon and contains the updated marine mammal auditory weighting functions and updated PTS onset thresholds.
The Technical Guidance’s appendices contain more detail on the following: Appendix A: Finneran Technical Report; Appendix B: Research Recommendations; Appendix C: Peer review and public comment processes; Appendix D: Alternative Methodology; and Appendix E: Glossary.
4

Based on the recommendations made in Southall et al. 2007, the Technical Guidance divides sources into 2 groups, uses dual metric thresholds for impulsive sources, divides marine mammals into hearing groups, and incorporates marine mammal auditory weighting functions.
Sources: The Technical Guidance recognizes that different sound sources have different physical characteristics making them more likely to induce auditory injury. Specifically, impulsive sources such as explosives, seismic airguns, and impact pile drivers, typically have high peak pressures and fast rise times making them more likely to cause auditory injury, while non‐impulsive sources, like drilling equipment or vibratory pile drivers do not contain these physical characteristics.
Dual metrics: To assess potential impacts of sound on marine mammal hearing, two metrics were used to derive thresholds: Peak sound pressure level (PK), which is only used for impulsive sounds and cumulative sound exposure level (SELcum), which is used for all sound types. The choice of the PK metric for impulsive sounds is to reflect that impulsive sounds are typically more injurious because of high peak pressures. The SELcum metric reflects that not only level of exposure contributes to noise‐induced hearing loss but also duration of exposure. In order to implement this metric, it necessary to specify a time period over which sound should be accumulated. The Technical Guidance recommends a 24‐h accumulation period.
Marine mammal hearing groups: It is recognized that not all marine mammals use and hear
5

sound in the same way. Thus, species are divided into five basic hearing groups: 3 cetacean groups (low, mid, and high) and 2 pinniped groups (phocid and otariid).
Auditory weighting functions reflect that within a hearing group, the susceptibility to noise‐induced hearing loss varies with frequency.
5

Now lets discuss the derivation of auditory weighting functions and PTS onset thresholds within the Technical Guidance. The next few slides provide a summary of the Technical Guidance’s methodology. For more detailed information, see Appendix A.
Marine mammal weighting functions are based on hearing groups and are derived to reflect the susceptibility of a hearing group to noise‐induced hearing loss. The weighting functions are derived using available marine mammal audiogram data to derive a composite audiogram per hearing group and available TTS onset data.
It is important to note that there are no direct data on PTS onset in marine mammals. Thus, marine mammal TTS data and terrestrial mammal data were used to derive a surrogate means of predicting these thresholds.
6
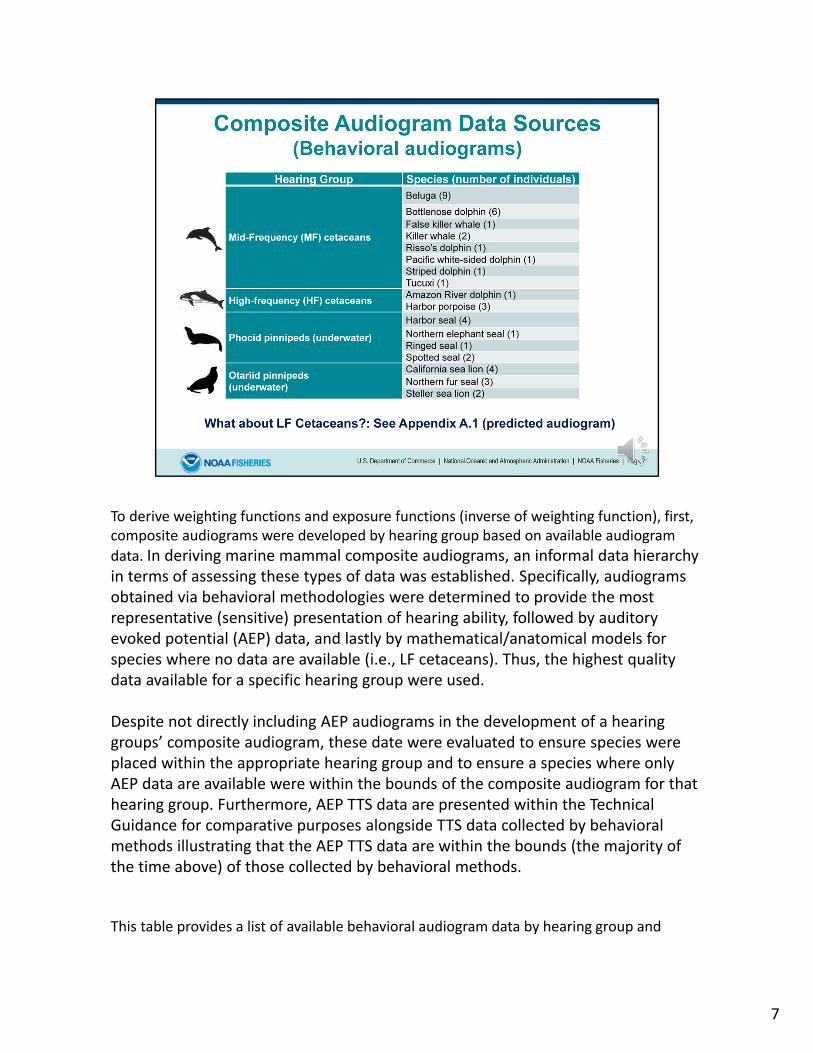
To derive weighting functions and exposure functions (inverse of weighting function), first, composite audiograms were developed by hearing group based on available audiogram
data. In deriving marine mammal composite audiograms, an informal data hierarchy in terms of assessing these types of data was established. Specifically, audiograms obtained via behavioral methodologies were determined to provide the most representative (sensitive) presentation of hearing ability, followed by auditory evoked potential (AEP) data, and lastly by mathematical/anatomical models for species where no data are available (i.e., LF cetaceans). Thus, the highest quality data available for a specific hearing group were used.
Despite not directly including AEP audiograms in the development of a hearing groups’ composite audiogram, these date were evaluated to ensure species were placed within the appropriate hearing group and to ensure a species where only AEP data are available were within the bounds of the composite audiogram for that hearing group. Furthermore, AEP TTS data are presented within the Technical Guidance for comparative purposes alongside TTS data collected by behavioral methods illustrating that the AEP TTS data are within the bounds (the majority of the time above) of those collected by behavioral methods.
This table provides a list of available behavioral audiogram data by hearing group and
7

species, with the number of individuals listed in parenthesis.
For LF cetaceans, there are no direct measurements of hearing available (i.e., only predictive models of hearing). Thus, with limited data, a predicted composite audiogram had to be derived. For more detail on this process, see Appendix A.1.
7

The first step in deriving marine mammal weighting and exposure functions relies on composite audiograms.
This slide illustrates the composite normalized audiogram for each hearing group based on available data for all hearing groups, except LF cetaceans, in which the composite audiogram is predicted.
8

After the composite audiogram is derived, then available TTS onset data are integrated. Note: the TTS onset data will be discussed later in this webinar.
This slide illustrates TTS onset data for each hearing group, illustrated by solid circles (noting for LF cetaceans, only estimated TTS onset is available; open circle). The dashed lines represent the composite audiogram (as illustrated on the previous slide), while the solid line indicates that derived exposure functions.
Note: The final exposure function is broader than the composite audiogram (i.e., exposure functions and weighting functions encompass more than just data on hearing and are more conservative than if a weighting/exposure function was strictly based on composite audiograms). Again, this is because exposure/weighting functions not only represent how well different groups hear sound but specifically their susceptibility to noise‐induced hearing loss from different frequency noise.
For more information on this derivation of weighting functions, see Appendix A.
9

This slide illustrates the Technical Guidance’s auditory weighting functions for cetaceans (LF, MF, & HF) with the X‐axis representing frequency (kHz), and the Y‐axis representing the weighting function amplitude (dB). In this example the weighting functions for LF, MF, and HF cetaceans are illustrated. Those frequencies in which a marine mammal hearing group is most susceptible to noise‐induced hearing loss are those where the weighting function amplitude is at 0 dB. The more negative a weighting function amplitude is for a corresponding hearing group, the less sensitive it is to that frequency is (i.e., less likely to induce noise‐induced hearing loss).
10
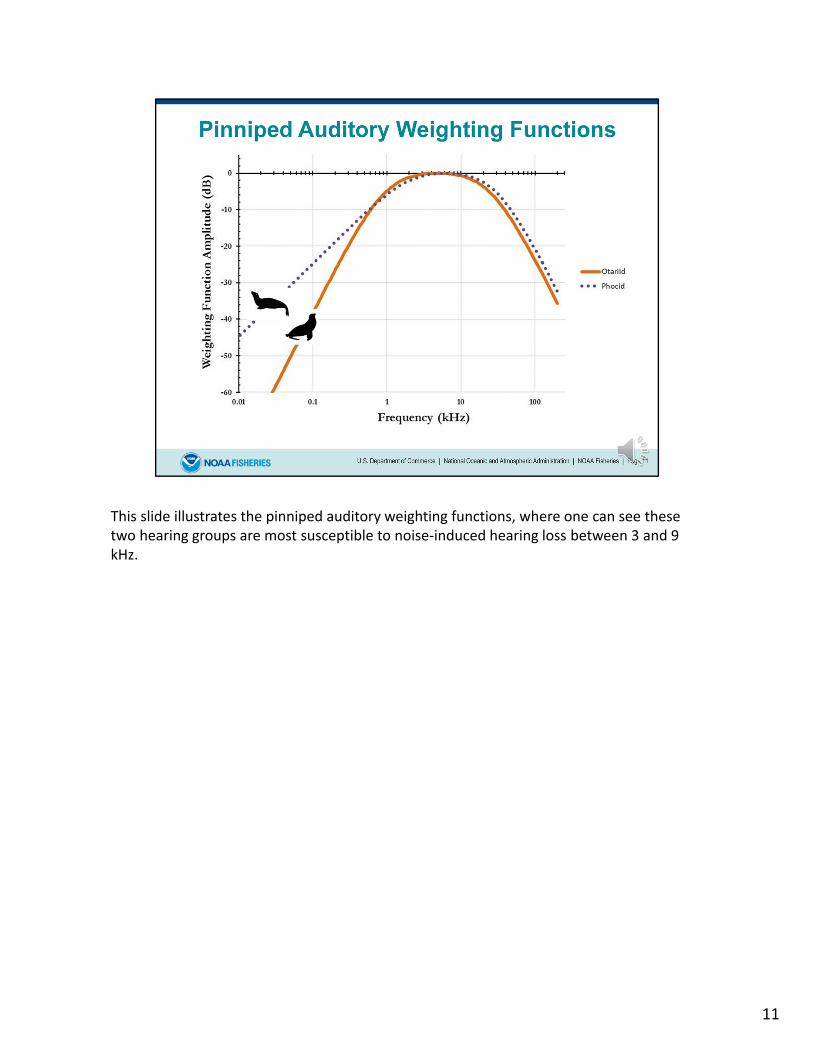
This slide illustrates the pinniped auditory weighting functions, where one can see these two hearing groups are most susceptible to noise‐induced hearing loss between 3 and 9 kHz.
11

Now lets discuss the derivation of PTS onset thresholds.
As mentioned earlier, there are no direct data on PTS onset in marine mammals. Thus, alternative methods were used to approximate PTS onset thresholds.
For non‐impulsive sources, TTS data obtained using behavioral methods (not AEP) were used to determine where TTS onset (a 6‐dB threshold shift occurred) from available data per hearing group. For LF cetaceans, TTS onset had to be approximated using surrogate datasets.
From there, PTS onset (40‐dB threshold shift) was approximated using available marine mammal growth curve data. The PTS‐TTS offset from available data sets ranged from 13‐37 dB (i.e., 13‐37 dB difference between TTS and PTS onset). Thus, a value of 20 dB was used as a surrogate means to derive PTS onset for non‐impulsive sources for all marine mammal hearing groups (i.e., PTS onset is 20 dB higher than TTS onset)
The figure on this slide, illustrates available TTS data for non‐impulsive sources for MF cetaceans.
For a complete summary of available marine mammal TTS data through 2015, see Finneran 2015 (Journal of the Acoustical Society of America).
12

Here is the slide that was discussed previously in terms of deriving exposure and weighting functions. It is shown again to illustrate where TTS onset occurred for each hearing group (depicted as solid black circles and an open circle to represent estimated TTS onset for LF cetaceans).
Note: The amount of TTS onset data available varies among hearing group, with the most data available for MF cetaceans.
13

For impulsive sources, even less data are available, with data only available for MF and HF cetaceans. Thus, for these two hearing groups, available data were weighted based upon each group’s weighting function to determine TTS onset.
For other hearing groups where no data are currently available a surrogate means was used to derive SELcum TTS onset thresholds. Specifically, the relationship between TTS onset for impulsive and non‐impulsive sounds was examined for HF and MF cetaceans, resulting in a 11 dB offset used as a surrogate means to derive TTS SELcum threshold onset for other hearing groups (i.e., TTS onset for impulsive sounds is 11 dB lower than for non‐impulsive sounds).
In addition to needing to approximate SELcum thresholds by hearing group, PK thresholds also needed to be derived. The same method used to approximate SELcum TTS onset thresholds was also tried to approximate PK TTS onset thresholds. However, this approximation produced unrealistic results. Thus, another method, specifically dynamic range, was used to approximate PK TTS onset thresholds.
Dynamic range reflects the range of the auditory system from the ability to detect a sound to the amount of sound tolerated before damage occurs (i.e., the threshold of pain minus the threshold of audibility). For the purposes of the Technical Guidance the intent is relating the threshold of audibility and TTS onset levels, not the threshold of pain.
14

From the available datasets for HF and MF cetaceans, a surrogate dynamic range of 159 dB was derived, meaning PK TTS onset thresholds are 159 dB greater than the threshold of threshold at frequency of best hearing from the composite audiogram.
To derive PTS onset for SELcum and PK thresholds methodology from Southall et al. 2007 that relied on growth rate data from terrestrial mammals was used, resulting in a 6 dB offset between TTS/PTS PK thresholds and a 15 dB offset between TTS/PTS SELcum thresholds.
14
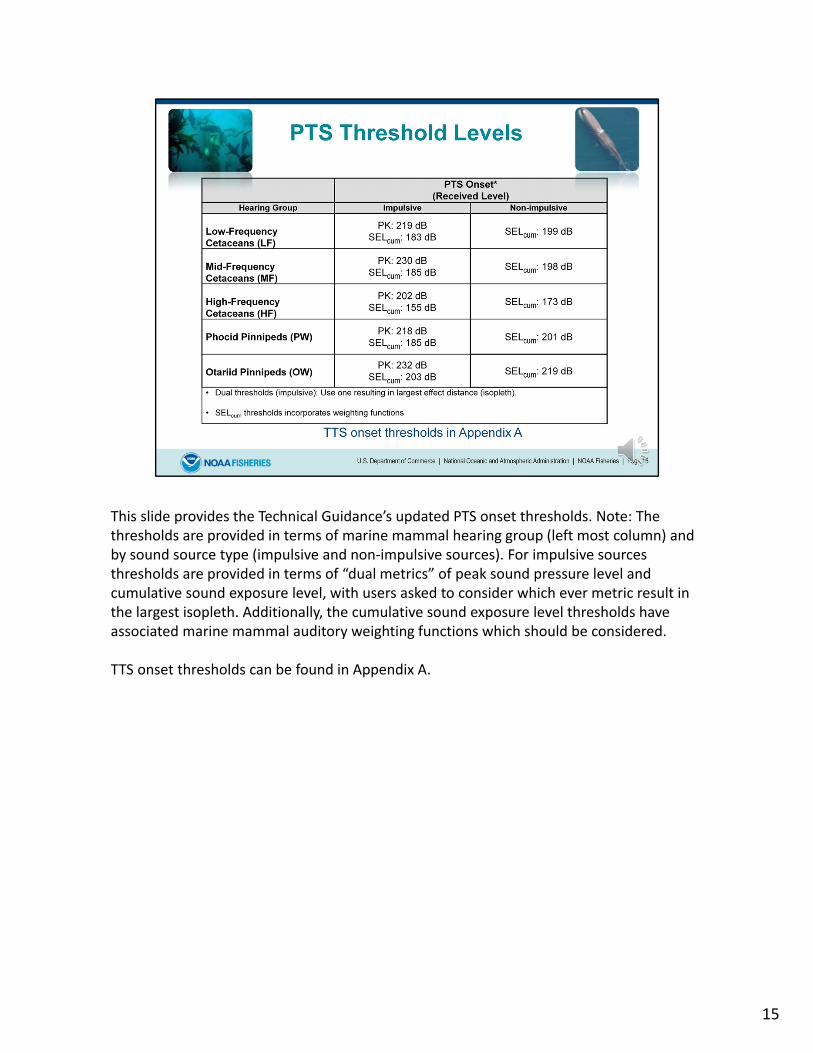
This slide provides the Technical Guidance’s updated PTS onset thresholds. Note: The thresholds are provided in terms of marine mammal hearing group (left most column) and by sound source type (impulsive and non‐impulsive sources). For impulsive sources thresholds are provided in terms of “dual metrics” of peak sound pressure level and cumulative sound exposure level, with users asked to consider which ever metric result in the largest isopleth. Additionally, the cumulative sound exposure level thresholds have associated marine mammal auditory weighting functions which should be considered.
TTS onset thresholds can be found in Appendix A.
15

Note: There is a companion webinar that provides more information on this methodology and the User Spreadsheet. Thus, only a brief overview will be provided here.
16

NMFS recognizes that the PTS onset thresholds and marine mammal weighting functions provided in the Technical Guidance are more complex than NMFS’s current thresholds. NMFS also recognizes that different applicants may have different levels of modeling capabilities.
Thus, NMFS has provided a companion optional User Spreadsheet for those user’s unable to implement thresholds using the SELcum metric (mobile and stationary sources) and associated auditory weighting functions.
For impulsive sources, it is important to remember that peak sound pressure level (PK) thresholds also need to be considered as part of the Technical Guidance’s dual thresholds and that this User Spreadsheet only pertains to thresholds in the SELcum metric (i.e., users are responsible for evaluating PK thresholds via their own means).
Note: Applicants are not obligated to use this optional spreadsheet and may perform more sophisticated exposure modeling or consider additional action‐ or location‐specific factors, if able.
More information on these optional methodologies are provided in Appendix D of the Technical Guidance.
17
This concludes this webinar. Thanks for listening. If you have any follow‐up questions, comments, or suggestions, please visit our web site (listed at the bottom of this slide).
18