welcome to tma’s 94 th annual meeting & conference may 18, 2009 williamsburg, virginia
TRANSCRIPT

Welcome to TMA’s 94th Annual Meeting &
ConferenceMay 18, 2009
Williamsburg, Virginia

Farrell DelmanPresident
Tobacco Merchants Association
TMA’s 94th Annual Meeting & ConferenceMay 18, 2009
Williamsburg, Virginia

SCHIP
FCTC
FDA
RECESSION

Conference Overview
• Some Key Trends
• The WHO’s Framework Convention
• SCHIP
• FDA

Conference Overview
• Some Key Trends
• The WHO’s Framework Convention
• SCHIP
• FDA

World CigaretteProduction & Consumption
(Billions of Pieces)
6,0255,745
5,5855,3415,230
5,695
4,693
5,818
5,469 5,5905,296
5,1105,170
4,658
4,000
4,500
5,000
5,500
6,000
6,500
1984 1988 1992 1996 2000 2004 2008
Production Consumption
Source: USDA-FAS, TMA Estimates

World (excluding China)Cigarette Prod. vs. Cons.
(Billions of Pieces)
3,8193,8713,907
3,6973,685
3,994
3,630
3,6233,798
3,7313,636
3,4883,6133,595
3,000
3,500
4,000
4,500
1984 1988 1992 1996 2000 2004 2008
World Production World Consumption
Source: USDA-FAS, TMA Estimates

TAXES … SMOKING BANS … NO ADVERTISING

POINT-OF-SALE AD BANS … KIDS
IN CARS … OUTDOOR SMOKING

Sales Trends: Shorter Cigarettes
Marlboro 72’s(Philip Morris USA and PMI)

Sales Trends: Smokeless Products Around the
World
United States
Sweden
India

The E-Cigarette
Ruyun
Freedome-Cigarette-USA
Equazcion

The China National Tobacco Corp. (CNTC) is the largest cigarette producer in the world
and China is nearing 40% of the world’s consumption
2,206
1,677
1,874
1,684
2,022
1,722
2,196
1,6711,666
1,859
1,708
2,008
1,600
1,700
1,800
1,900
2,000
2,100
2,200
2,300
1998 2000 2002 2004 2006 2008
Production
Consumption
China’s Cigarette Market(Billions of Pieces)
Source: CNTC

2,218
3,545
2,219
3,497
2,221
3,449
2,223
3,401
2,224
3,353
0
500
1,000
1,500
2,000
2,500
3,000
3,500
4,000
2009 2010 2011 2012 2013
China Cig. Consumption World minus China Cig. Consumption
China vs. World Cigarette Consumption
Forecasts(Billions of Pieces)
Source: TMA Estimates

CNTCSales
Imports
CNTCSales
Imports
A Chinese WallAgainst Cigarette Imports
(% of Total)
1998 2008
Source: TMA.org, CNTC
1988
CNTCSales
Imports2,195.74 bn(99.84%)
3.50 bn(0.16%)
1,655.3 bn(99.79%)
15.99 bn(1.02%)
3.42 bn(0.21%)
1,557.08 bn(98.98%)
Since Joining the WTO in 1997,China’s Market is as Closed as Ever

15.75016.186
17.01718.728
19.45121.404
22.067 23.203
2001 2002 2003 2004 2005 2006 2007 2008
Sales Trends: Cigars
(Billions of Pieces)
Source: TMA International Issues Monitor

68.2769.89 71.86
87.1892.93 94.36
$15.17$13.80$11.47$6.93$6.04$6.60
1998 2000 2002 2004 2006 2008
Volume (Th. of MT) Value (Bn of US$)
Sales Trends: Roll-Your-Own
(Billions of Pieces)
Source: TMA International Issues Monitor
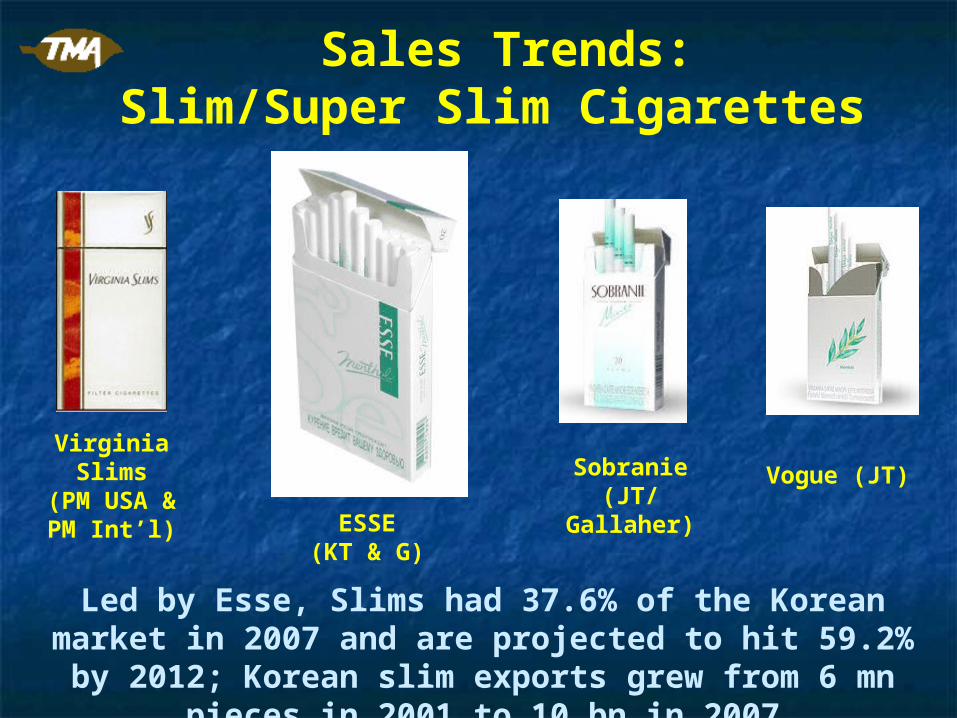
Sales Trends:Slim/Super Slim Cigarettes
Virginia Slims(PM USA &
PM Int’l)Vogue (JT)
ESSE(KT & G)
Sobranie(JT/Gallaher)
Led by Esse, Slims had 37.6% of the Korean market in 2007 and are projected to hit 59.2% by 2012; Korean slim exports grew
from 6 mn pieces in 2001 to 10 bn in 2007

Next Stops for Public Health?
Fast FoodObesity
AlcoholBig Pharma

Conference Overview
• Some Key Trends
• The WHO’s Framework Convention
• SCHIP
• FDA
U.S. Ratification of the U.S. Ratification of the FCTCFCTC
As of today, 168 nations or parties have signed the FCTC, while 164 have
ratified it.
The United States signed the FCTC on May 10, 2004, but has not yet
ratified it.

May 1999: The 52nd World Health Assembly backs aresolution which calls for the development of aFramework Convention on Tobacco Control.
October 1999: 1st session of FCTC Technical Working GroupOctober 2000: Public hearings on FCTC held
1st session of Intergovernmental Negotiating Body heldMarch 2003: WHO members draft FCTC text May 2003: 192 nations adopt FCTC text at WHO’s 56th AssemblyOctober 2004: 1st TobReg MeetingApril 2005: 1st TobLabNet MeetingFeb. 2006: 1st Conference of the Parties [COP]Feb. 2008: 1st session of INB to negotiate protocol on illicit tradeMarch 2009: 4th TobLabNet meeting held in Rio, BrazilJune 2009: 3rd session of INB to be held in Geneva4Q10: 4th session of the COP to be held in Uruguay
FCTC - TimelineFCTC - Timeline

FCTC: Articles 9 and 10FCTC: Articles 9 and 10 Article 9: Tobacco Product Content
COP 3 recommended to submit a report at COP 4 which: Identifies best practices in reporting to regulators regarding
content, emissions and product characteristics Validate, within 5 years, the analytical chemical methods for
testing and measuring cigarette content and emissions
Article 10: Tobacco Product Disclosure COP 3 recommended to submit a report at COP 4 which: Collects and analyzes information on legal
cases related to tobacco product disclosures

FCTC: Article 11FCTC: Article 11 Tobacco Product Packaging and
Labeling
The COP 3 recommends: Well-designed health warnings and
messages Large picture warnings located on principal
display areas The use of color rather than just black &
white along with relevant qualitative statements to be displayed on each pack (or package) about the emissions of the tobacco
Nations should also consider adopting measures to restrict or prohibit the use of logos, colors, brand images or promotional information on packaging other than brand names and product names displayed in a standard color and font style (plain packaging).

FCTC: Article 15 - Illicit TradeFCTC: Article 15 - Illicit Trade INB -3 Protocol Now Being Developed
Defines “Illicit” as Smuggling Illicit Manufacturing Counterfeiting
Create Practical T&T System (s) Cases / Pallets vs. Cartons vs. Packs
“Sales only allowed in X Country/Province” To Determine Point of Diversion Monitoring & Reporting System (s) to Track the Product Movement
through Distribution Authorized Enforcement Access to commercial shipment data bases

Mandates Cooperation & Data Sharing Among National & International Agencies (AP) Monitor & Collect Data on Cross-border trade
(not national data alone) As well as all product “moving under suspension
of taxes or duties within its jurisdiction” Provide COP Reports
Requires destroying counterfeit & contraband product and machinery used to produce it and the confiscation of ill-gotten gains
Encourages Nations to Enact Penalties and Remedies, including licensing, to prevent illicit trade “including counterfeit and contraband” (AP)
FCTC: Article 15 - Illicit TradeFCTC: Article 15 - Illicit Trade

U.S. Ratification of the U.S. Ratification of the FCTCFCTC
FCTC Checklist:
(Article 5) General Obligations (Article 6) Price and Tax
Measures (Article 8) Protection from ETS (Article 9) Contents of Tobacco Products
[FDA] (Article 10)Tobacco Product Disclosure [FDA] (Article 11) Packaging & Labeling of Tobacco
Products [FDA](Article 12) Education, Communication, Training & Public Awareness
(Article 13)Tobacco Advertising, Promotion & Sponsorship [FDA]
(Article 15) Illicit Trade in Tobacco Products [FDA]
(Article 19) Liability

Conference Overview
• Some Key Trends
• The WHO’s Framework Convention
• SCHIP
• FDA

US Federal Excise Taxes on US Federal Excise Taxes on Tobacco ProductsTobacco ProductsFirst ImplementedFirst Implemented
1862: Large Cigars1865: Cigarettes1897: Little Cigars (Under 3 pounds per 1,000)1917: Pipe, Snuff and Chewing Tobacco1965: Pipe, Snuff and Chewing tax eliminated1989: Pipe, Snuff and Chewing Tobacco2000: Roll-Your-Own Tobacco

The US Federal Cigarette The US Federal Cigarette Excise Tax TimelineExcise Tax Timeline
(US$ per 1,000 pieces)(US$ per 1,000 pieces)1865: $1.20 - to pay costs from the Civil Warc.1880: $1.75c.1890: $0.501920: $3.00 - to pay costs from World War I1941: $3.25 - to pay costs from World War II1943: $3.50 - to pay costs from World War II1952: $4.00 - to pay costs from the Korean War1983: $8.00 - “Tax Equity & Fiscal Resp. Act of 1982”1991: $10.00 - “Omnibus Budget Recon. Act of 1990”1993: $12.00 - “Omnibus Budget Recon. Act of 1990”2000: $17.00 - for uninsured children’s health care2002: $19.50 - for uninsured children’s health care2009: $50.33 – State Children’s Health Insurance (SCHIP)

““SCHIP” Excise Tax Rate SCHIP” Excise Tax Rate HikesHikes
ProductProduct Old RateOld Rate Current Rate Current Rate % % IncreaseIncrease
CigarettesCigarettes 3939¢/pack¢/pack $1.0066/pack$1.0066/pack 158.1%158.1%
Little CigarsLittle Cigars 3.763.76¢/pack¢/pack $1.0066/pack$1.0066/pack 2,577.1%2,577.1%
Large Large CigarsCigars
20.719%20.719% 52.75%52.75% 154.6%154.6%
Large Cigar Large Cigar Tax CapTax Cap
4.8754.875¢/¢/piecepiece
40.2640.26¢/¢/piecepiece 725.8%725.8%
Chewing Chewing Tob.Tob.
19.519.5¢/lb.¢/lb. 50.3350.33¢/lb.¢/lb. 158.1%158.1%
SnuffSnuff 58.558.5¢/lb.¢/lb. $1.51/lb.$1.51/lb. 158.1%158.1%
Pipe Pipe TobaccoTobacco
109.69109.69¢/lb.¢/lb. 283.11283.11¢/lb.¢/lb. 158.1%158.1%
RYO RYO TobaccoTobacco
109.69109.69¢/lb.¢/lb. $24.78/lb.$24.78/lb. 2,159.1%2,159.1%

State Tobacco Product State Tobacco Product Excise TaxesExcise Taxes
Cigarettes - All 50 States and D.C.- All 50 States and D.C.
Large Cigars - 47 States and D.C.- 47 States and D.C. (excl. (excl. FLFL, , NHNH, , PAPA))
Little Cigars - 49 States and D.C. (excl. - 49 States and D.C. (excl. PAPA))
Smoking Tob. - 49 States and D.C. (excl. - 49 States and D.C. (excl. PAPA))
Chewing Tob. - 49 States and D.C. (excl. - 49 States and D.C. (excl. PAPA))
Snuff - 49 States and D.C. (excl. - 49 States and D.C. (excl. PAPA))
NOTE: Florida Senate Bill 1840 would impose anOTP tax rate of $1 per ounce on cigars.

Local Tobacco Product Local Tobacco Product Excise TaxesExcise Taxes
Cigarette - 8 States (- 8 States (AKAK, , ALAL, , HIHI, , ILIL, , MOMO,, NYNY, , OHOH, , VAVA))
Major cities include among Major cities include among others:others:
Anchorage, AKAnchorage, AK Chicago, ILChicago, IL Honolulu, HI Honolulu, HI New York City, NYNew York City, NY Cleveland, OH Cleveland, OH
AlabamaAlabama (269 cities, 53 counties); (269 cities, 53 counties); MissouriMissouri - 129 - 129
Cigar - 4 States (- 4 States (AKAK, , ALAL, , HIHI, , MDMD))
OTP - 4 States (- 4 States (AKAK, , ALAL, , HIHI, , MDMD))Source: TMA’s Tobacco Tax Guide (May 2009)

State Cigarette Excise Tax IncreasesState Cigarette Excise Tax Increases (1999 (1999 – 2009)– 2009)
# of Bills # of States # of Approvals
1999 57 21 3 (MD, NH, NY)
2000 24 7 1 (LA)
2001 51 26 5 (ME (2), RI, WA, WI)
2002 116 34 21 (AZ, CT, DC, HI, IN, IL, KS,
LA, MA, MD, MI, NE, NJ, NY,
OH, OR, PA, RI, TN, UT, VT)
2003 175 37 15 (AR, CT, DE, DC, GA, ID, MT,
NJ, NM, NV, PA, RI, SD, WV, WY)
2004 139 33 8 (AL, AK, CO, MI, MT, NJ, RI, VA)
2005 114 30 9 (KY, ME, MN(2), NC, NH,NM, OH, RI, WA)
2006 57 25 6 (AZ, HI, NJ, SD, TX, VT)
2007 105 24 8 (CT, DE, IN, IA, MD, NH, TN, WI)
2008 57 20 4 (DC, MA, NH, NY)
2009 89 32 4 (AR, KY, MS, RI…HI)

The Shrinking U.S. The Shrinking U.S. Cigarette MarketCigarette Market
300
350
400
450
500
550
600
650
700
1975
1977
1979
1981
1983
1985
1987
1989
1991
1993
1995
1997
1999
2001
2003
2005
2007
Cigarette Consumption
FET Doubled(1983)
Peak: 1981 – 641 bn. pieces
Marlboro Friday(April 1993)
MSA (November 1998)
Bottom: 2008 – 345.1 bn. pieces
Source: USDA-Economic Research Service
TMA’s Tobacco USA

Source: TTB
Cigarette DomesticCigarette DomesticTaxable RemovalsTaxable Removals
(First Quarter 2009)(First Quarter 2009)
25.469 25.368 25.967
0
5
10
15
20
25
30
January February March
Domestic Taxable Removals
(Bn. of Pcs.)

50
60
70
80
90
100
2002 2003 2004 2005 2006 2007 2008 2009
1Q 2Q 3Q 4Q
U.S. Cigarette Sales by Quarter
(Billions of Pieces)
Source: Maxwell Consumer Report
-10.45% vs. 1Q08

Taxable Removals by ProductTaxable Removals by Product(February 2009 vs. March 2009)(February 2009 vs. March 2009)
2.502.60
7.607.00
0.190.27
1.871.30
0
1
2
3
4
5
6
7
8
Chew.Tob.
Snuff Pipe Tob. RYOTob.
February March
(Mn. of Lbs.)
(Mn. of Pcs.)
455.0
548.5498.2
323.3
0
100
200
300
400
500
600
Large Cigars Little Cigars
February March
Source: TTB

2008 Est. price: 2008 consumption:$4.58 345.1 billion pieces
2009 Est. price: 2009e consumption:Elasticity:$5.50 327.8 billion pieces -0.250
$5.50 324.3 billion pieces -0.300
$5.50 320.8 billion pieces -0.350
$5.50 317.4 billion pieces -0.400
U.S. CigaretteU.S. CigarettePrice ElasticityPrice Elasticity
e = Δ Quantity/ Δ Price

388376
372364
345
324319
314
2004 2005 2006 2007 2008 2009e 2010e 2011e
Cigarettes (Bn. Pcs)
U.S. Cigarette Forecast(Billions of Pieces)
Source: TMA Estimate

2009 FET 2009 Consumption 2009 Fed. Tax. Rev.$0.39/pk 80.11 bn. pc. (Jan-Mar) $1,562.1 mn$1.0066/pk 244.19 bn. pc. (Apr-Dec) $12,290.1 mnTOTAL 324.30 bn. pc. $13,852.2 mn
Cigarette Tax Revenue Forecast(Millions of US$)
2008 FET 2008 Consumption 2008 Fed. Tax. Rev.$0.39/pk 345.15 bn. pc $6,730.4 mn
Source: TMA Estimate
The Federal government is expected to collect an additional $7.12 billion in
2009.

Cigarette Tax Revenue Forecast(Millions of US$)
2008 SET 2008 Consumption 2008 State. Tax. Rev.$1.08/pk 345.15 bn. pc $18,638.1 mn2009 SET 2009 Consumption2009 State. Tax. Rev.$1.12/pk 324.30 bn. pc $18,160.8 mn
State governments will collect $477.3 mn less in tax revenues even as some States raise their excise tax rates in
2009.Source: TMA Estimate

State MSA Revenue Forecast(Millions of US$)
2008 Consumption 2008 MSA Payment (in 2009) 345.15 bn. pc $6,769.1 mn
State governments will collect $138.3 mn less in MSA payments as the
cigarette market continues to decline.
Source: TMA Estimate
2009 Consumption 2009 Est. MSA Payment (in 2010) 324.30 bn. pc $6,630.8 mn

Cigarette Tax Incidence - 2007Cigarette Tax Incidence - 2007(tax share of retail price)(tax share of retail price)
Avg. Price Sales Tax State per pack FET SET Tax Inc.
South $3.658 $0.39 $0.07 $0.196 17.9%Carolina
US $4.678 $0.39 $1.0725 $0.239 36.4%(Average)
Rhode $6.590 $0.39 $2.46 $0.405 49.4%Island
NOTE: The price figures include sales taxes.Source: TMA, Orzechowski & Walker

Cigarette Tax Incidence - 2009Cigarette Tax Incidence - 2009(% of tax share of retail price)(% of tax share of retail price)
Avg. Price Sales Tax State per pack FET SET Tax Inc.
South $4.574 $1.01 $0.07 $0.259 29.3%Carolina +25%
US $5.743 $1.01 $1.12 $0.247 41.4%(Average)
Rhode $8.584 $1.01 $3.46 $0.562 58.6%Island +30.26%
NOTE: The price figures contain sales taxes.Source: TMA estimates

Retail Price and Tax Incidence Retail Price and Tax Incidence Figures f0r 2008Figures f0r 2008
Retail Price Tax Incidence
Norway $11.72 71.20%UK $9.16 76.49%Australia $8.46 65.65%Singapore $7.95 70.54%Canada $7.50 70.73%France $7.24 80.39%Germany $6.82 76.45%Italy $5.80 75.17%
All Prices are in US Dollars per pack of 20.
Retail PriceTax Incidence
United States $4.6836.97%
Spain $4.0977.35%
Portugal $3.8650.25%
Poland $3.1474.15%
Japan $3.2163.06%
China $2.2060.73%
South Korea $1.8862.61%
Indonesia $0.9049.09%

Estimated Price Structure of aPremium Pack of Cigarettes
(2009)(% of total price)
9.7
18.4
20.4
32.5
10.9
8.2
0
20
40
60
80
100Operating Expenses($1.79)
State Excise Tax ($1.12)
Federal Excise Tax($1.01)
MSA Payment ($0.45)
Trade (Wholesale andRetail ($0.53)
Profit ($0.60)
Assuming an average retail price of a pack of premium cigarettes in 2009 at $5.50 (not
including sales tax).Source: TMA EstimateSource: TMA Estimate

Estimated Price Structure of a4th Tier Pack of Cigarettes
(2009)(Percentage of total price)
9.7
30.6
33.9
10.9
4.5
10.3
0
20
40
60
80
100Operating Expenses($0.36)
State Excise Tax ($1.12)
Federal Excise Tax($1.01)
MSA Payment (SPM)/Escrow (NPM) ($0.34)
Trade (Wholesale andRetail ($0.32)
Profit ($0.15)
Assuming a 4th tier average national retail price in 2009 of $3.30.
Source: TMA EstimateSource: TMA Estimate

““SCHIP” Excise Tax Rate SCHIP” Excise Tax Rate HikesHikes
ProductProduct Old RateOld Rate Current Rate Current Rate % % IncreaseIncrease
CigarettesCigarettes 3939¢/pack¢/pack $1.0066/pack$1.0066/pack 158.1%158.1%
Little CigarsLittle Cigars 3.763.76¢/pack¢/pack $1.0066/pack$1.0066/pack 2,577.1%2,577.1%
Large Large CigarsCigars
20.719%20.719% 52.75%52.75% 154.6%154.6%
Large Cigar Large Cigar Tax CapTax Cap
4.8754.875¢/¢/piecepiece
40.2640.26¢/¢/piecepiece 725.8%725.8%
Chewing Chewing Tob.Tob.
19.519.5¢/lb.¢/lb. 50.3350.33¢/lb.¢/lb. 158.1%158.1%
SnuffSnuff 58.558.5¢/lb.¢/lb. $1.51/lb.$1.51/lb. 158.1%158.1%
Pipe Pipe TobaccoTobacco
109.69109.69¢/lb.¢/lb. 283.11283.11¢/lb.¢/lb. 158.1%158.1%
RYO RYO TobaccoTobacco
109.69109.69¢/lb.¢/lb. $24.78/lb.$24.78/lb. 2,159.1%2,159.1%

Source: US-TTB
1.642.20 2.24 2.17 2.25 2.30
2.703.77
4.164.77
5.45
0
1
2
3
4
5
6
7
1998 2000 2002 2004 2006 2008
Production Sales
U.S. Little Cigars(Billions of pieces)

1 cigarette = 0.0325 ounces of RYOSource: USDA-AMS
3.163.81
4.164.97
5.546.21
5.756.34 6.06 5.97
6.76
0
1
2
3
4
5
6
7
8
1998 2000 2002 2004 2006 2008
Production Sales
U.S. Roll-Your-Own Tobacco
(Billions of pieces [converted])

Projected Declines in Consumption
(Billions of Pieces)2008 Cons. Proj.
2009 Cons. DifferenceLittle Cigars 5.448 3.269 (-40%) -2.179(bn. pc.) RYO Tobacco 6.762 4.057 (-40%) -2.705(bn. pc.)
Source: TMA Estimate
Combined, the disproportionate excise tax increases for little cigars and RYO
tobacco could boost cigarette consumption by an additional 4.884
billion pieces.

Source: USDA-ERS, US-TTB
3.66 3.85 3.854.11 4.21 4.53
4.944.88
5.30 5.555.76
0
1
2
3
4
5
6
1998 2000 2002 2004 2006 2008
Production Sales
U.S. Large Cigars(Billions of pieces)

Source: USDA-AMS
59.9 61.664.8
66.368.6 71.0
74.7 76.7
81.586.2
91.3
50556065707580859095
1998 2000 2002 2004 2006 2008
Production Sales
U.S. Moist SnuffU.S. Moist Snuff(Millions of pounds)(Millions of pounds)

U.S. Dark Fire-Cured and Dark Air-Cured Production
(Metric Tons)
34.5
11.8
37.1
11.5
37.6
13.2
39.4
13.5
41.7
24.4
0
10
20
30
40
50
2004 2005 2006 2007 2008
Dark Fire-Cured
Dark Air-Cured(One Sucker +Green River)
Source: USDA-NASS

U.S. Tobacco Consumptionby Leaf Equivalents – 2007
(Millions of Pounds)34.4
88.3
634.9
16.3
105.5
Source: US-TTB, USDA-AMS, TMA
Cigarettes (360 bn pc) Cigars (1 cigar = 10g) Smoking Tobacco Chewing TobaccoSnuff

U.S. Tobacco Productionby Leaf Equivalents – 1880
(Millions of Pounds)
32.9
35.3
1.1
4.0
107.2
Source: US Department of Agriculture – ERS, TMA
Cigarettes Cigars (1 cigar = 10g) Smoking Tobacco Chewing TobaccoSnuff

Conference Overview
• Some Key Trends
• The WHO’s Framework Convention
• SCHIP
• FDA

Tobacco RegulatoryTobacco RegulatoryBill ComparisonBill Comparison
IssueIssue Waxman/Waxman/KennedyKennedy
Buyer Buyer Burr/HaganBurr/Hagan
Bill No.Bill No. H.1256/H.1256/S.982S.982
H.1261H.1261 S.579S.579
AgencyAgency ““Center for Center for Tobacco Tobacco
Products” Products” within FDAwithin FDA
““Tobacco Tobacco Harm Harm
Regulation Regulation Center” Center”
within HHSwithin HHS
““Tobacco Tobacco Regulatory Regulatory Agency” Agency”
within HHSwithin HHS
IngredienIngredient t
DisclosurDisclosuree
‘‘Tar’ Tar’ LimitsLimits
Flavor Flavor BanBan
Fire-SafeFire-Safe

IssueIssue Waxman/Waxman/KennedyKennedy
Buyer Buyer Burr/Burr/HaganHagan
AdvertisinAdvertisingg
BanBan
(restrictions(restrictions
))
Graphic Graphic WarningsWarnings
Waxman: May Waxman: May Kennedy: ShallKennedy: Shall
Retail Retail LicensingLicensing
DescriptorDescriptorss
Illicit Illicit tradetrade
Tobacco RegulatoryTobacco RegulatoryBill ComparisonBill Comparison

Manufacturers
TobaccoProduct
ComplianceCenter(TPCC)
StateTax
AdministratorsWholesalers/Distributors
Retailers
LocalTax
Administrators
One important condition:One important condition: Data integrity and Data integrity and audit trail documenting company usageaudit trail documenting company usage
Creating a Centralized License Data Base Creating a Centralized License Data Base of Publicly Available Informationof Publicly Available Information
to Facilitate Public-Private Communicationto Facilitate Public-Private Communication
One-Stop Updating One-Stop Updating with License Suspension Reports Providedwith License Suspension Reports Provided

IssueIssue Waxman/Waxman/KennedyKennedy
Buyer Buyer Burr/HaganBurr/Hagan
Sales Sales RestrictioRestrictio
nsns
SamplingSampling Smokeless in adult
Any TP in adult
SeizureSeizure Small Small Man. Man.
ExemptioExemptionn
User FeesUser Fees From $85mn From $85mn in FY09 to in FY09 to $712mn in $712mn in FY19 and FY19 and
thereafter.thereafter.
Civil money Civil money penalties & penalties & license fees.license fees.
$100mn/yr $100mn/yr starting in starting in FY10 with FY10 with
inflationary inflationary factor factor
thereafter.thereafter.
Tobacco RegulatoryTobacco RegulatoryBill ComparisonBill Comparison

Modified RiskModified Risk
Waxman/Waxman/KennedyKennedy
Sets Sets a very high bara very high bar to making reduced risk claims. to making reduced risk claims. Requires pre-market approval whereby manufacturer Requires pre-market approval whereby manufacturer files an application detailing elements including files an application detailing elements including product description, formulation, and research. Multi-product description, formulation, and research. Multi-year research likely.year research likely.
BuyerBuyer Creates Creates a “reasonably likely” testa “reasonably likely” test for reduced risk for reduced risk claims based on measurable and substantial reductions claims based on measurable and substantial reductions in morbidity and mortality among users; Smokeless in morbidity and mortality among users; Smokeless tobacco product can not be sold as a MR product; tobacco product can not be sold as a MR product; Requires MR product to be labeled such that the Requires MR product to be labeled such that the consumer can easily comprehend the risk.consumer can easily comprehend the risk.
Burr/Burr/HaganHagan
Creates Creates a “totality of scientific knowledge” testa “totality of scientific knowledge” test based based on a number of joint conditions for reduced risk claims on a number of joint conditions for reduced risk claims based on available scientific evidence demonstrating based on available scientific evidence demonstrating that a given product "yields a reduced amount of 1 or that a given product "yields a reduced amount of 1 or more toxicants when compared to an appropriate more toxicants when compared to an appropriate reference tobacco product or products“. reference tobacco product or products“.
Tobacco RegulatoryTobacco RegulatoryBill ComparisonBill Comparison

Uses of the Tobacco Plant(Nicotina Tabacum/Rustica)
Proteins Nicotine
Food EnzymeGeneratio
n
Medicines
Vaccines
HIV, Malaria, Hepatitis B,
Insulin, Auto-Immune Deficiencies
Depression, Cancer, Parkinson’s,Alzheimer’s
Cereal
Traditional
Non-Traditiona
l
Other
Human Growth
Hormone

Nicotine Delivery
Traditional
Non-Traditional
E-Cigarette PatchesSmokin
gTobacco
Smokeless
TobaccoGum/
Lozenges
Snuff
Dry
Moist
Loose Leaf
Cigars
Plug
Twist/Roll
Cigarettes
Firm
MoistMachin
eMade
Hand Made (RYO)
Chewing
Tobacco
Little
Large
PipeTobacc
o
Nasal Spray
Water
Snus
Orbs/Strips/Sticks

U.S. CigaretteNicotine Consumption
(Metric Tons)
458.0451.8
420.4
395.0378.1
354.8340.2
315.5
200
250
300
350
400
450
500
1994 1996 1998 2000 2002 2004 2006 2008
Source: TMA Estimates
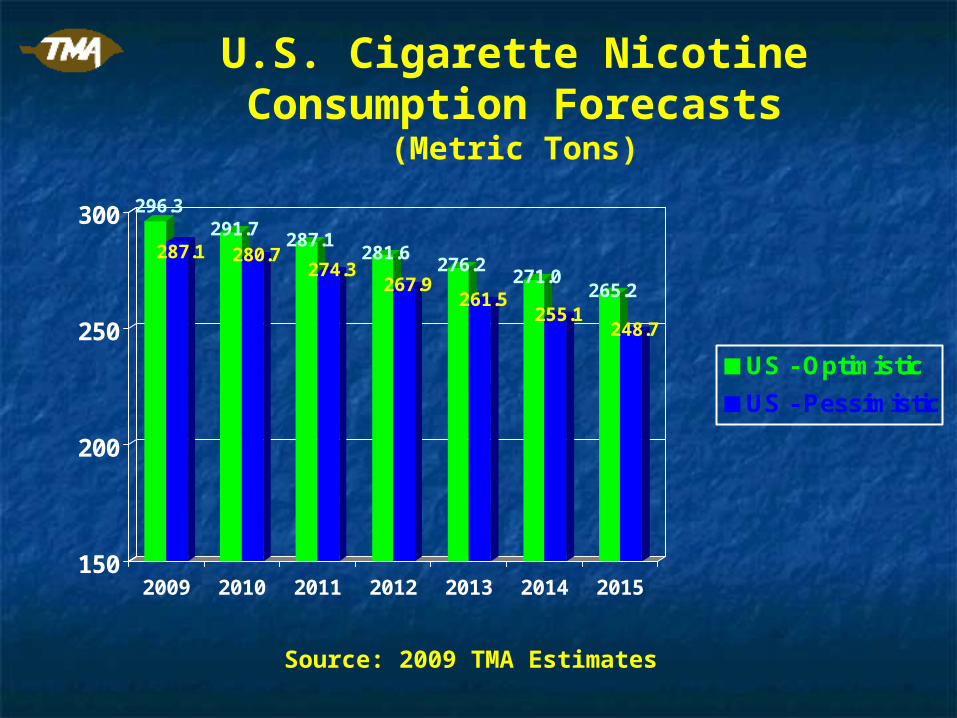
U.S. Cigarette Nicotine Consumption Forecasts
(Metric Tons)
296.3
287.1291.7
280.7287.1
274.3281.6
267.9276.2
261.5271.0
255.1265.2
248.7
150
200
250
300
2009 2010 2011 2012 2013 2014 2015
US - Optimistic
US - Pessimistic
Source: 2009 TMA Estimates

India: Multi-Ethnic,Multi-Lingual, Multi-
Tobacco

THANK YOU!THANK YOU!
And now to the World Leaf And now to the World Leaf Situation & Outlook withSituation & Outlook with
Jim StarkeyJim Starkey
(TMA Chairman and former SVP (TMA Chairman and former SVP Universal Leaf Tobacco)Universal Leaf Tobacco)

TMA Annual Meeting and Conference
Global Leaf Trends Changing Dynamics / Future Trends
Presentation By:
Jim Starkey
Williamsburg, VirginiaMay18, 2009

• Some Significant Changes• Market Implications• Current Supply and Demand Situation• Future Trends / Potential Beneficiaries• Final Observations

2008 Estimated World Leaf Production

Significant Changes
• Sources of leaf have shifted dramatically

Flue-Cured Tobacco Production
1960 2008

Burley Tobacco Production
1960 2008

A Dynamic Industry
• Sources of leaf have shifted dramatically• Consolidation has reduced the number of
industry players– Leaf dealers– Manufacturers

Leaf Industry Consolidation
Past
Universal LeafSocotab (49%)Thorpe & RicksGKCasalee
DibrellIntabexA.G. MonkAustin
TranscontinentalAdamsMeridional
Present
Universal Leaf
Alliance OneMonk Austin
DIMON
Standard Commercial

Manufacturer Consolidation
JT RJI/Gallaher
Imperial Altadis / Commonwealth
BAT ETI / RJ(42%) / Tekel / Scantoco
PM USA John Middleton / UST
PMI Lakson / Sampoerna / Rothmans, Canada
RJ Conwood

The Current SituationA Dynamic Industry
• Cigarette manufacturers expand portfolio– New products/smoking devices– New categories
• Cigars• Smokeless• Snus• Other

Market Implications
• New origins entail greater production risk– Less irrigation– Shift from large commercial farms to small scale– Shift from auction to contracting
• Result is greater downside production risk

Market Implications
• Increased production risk• Buyer/user consolidation
– Smaller numbers– No unplanned inventory– Shorter durations
• Higher market volatility

Market Implications
• Increased production risk• Market volatility• Higher production costs
– Fertilizers– Pesticides and herbicides– Fuel– Labor
• Plus alternative crops– Tobacco growers have alternatives– Crop prices have risen dramatically

Market Implications
• Cost of buyer-mandated programs– Improve leaf quality– Eliminate foreign matter– GAP– Social responsibility

Market Implications
Attractive Alternatives
Buyer Mandates
Higher Leaf
Prices
Increased: Production Risk Market Volatility Production Costs
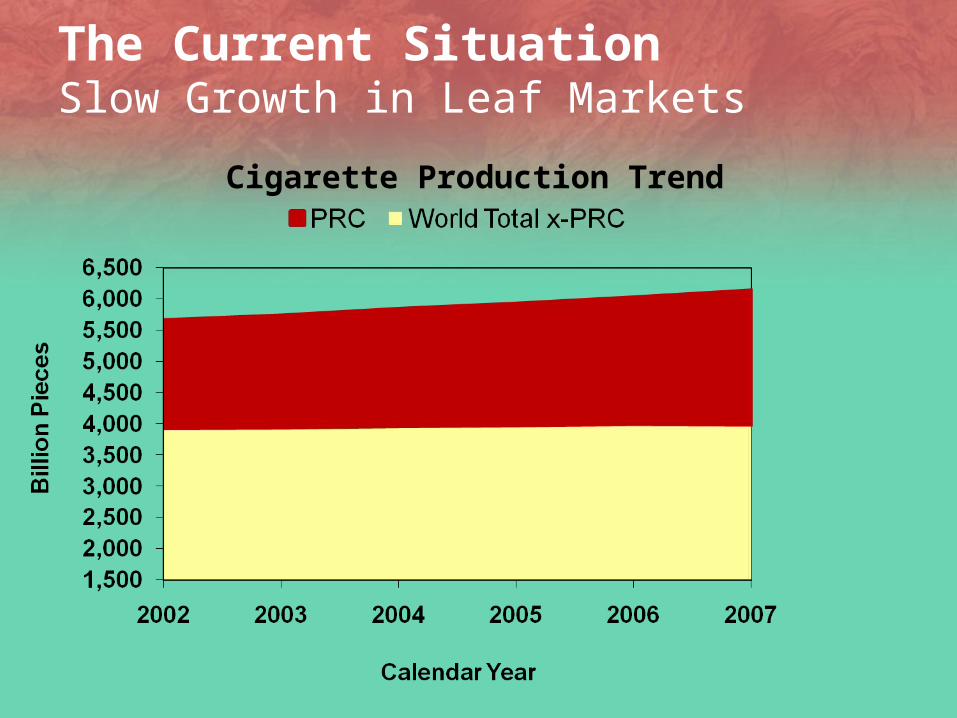
The Current SituationSlow Growth in Leaf Markets
Cigarette Production Trend

The Current SituationSlow Growth in Leaf Markets
• Growth mainly in:– Asia– Eastern Europe– Middle East
• Declines in developed countries– Characterized by:
• Increasing taxation• Increasing regulation• Production shifts
Population growth
Rising income levels

The Current SituationSlow Growth in Leaf Markets
• Less clear how much leaf utilization has increased, if at all outside PRC– New manufacturing technology uses less leaf/stick– Impact of industry consolidation
• Supply chain efficiency• Waste reduction/increased utilization
– American blend growth has stalled – affects burley demand

The Current Situation
FC Leaf Production 2003-2008 (Million Green Kgs)
3,3153,513
3,792 3,702 3,6563,969
PRC Other Exporters

The Current SituationFlue-Cured Leaf Production
• Two very different stories– PRC
• Dramatic growth• 500 mKgs or 28%• Only slightly greater than cigarette production growth (24%)

The Current SituationFlue-Cured Leaf Production
• Exporters down 2%
World Flue-Cured Exporters’ Leaf Production (x-PRC)

The Current SituationFlue-Cured Leaf Production
• 2008 declines in Brazil, Zimbabwe, other Africa and Canada
• More than offset increases in US, EU and India
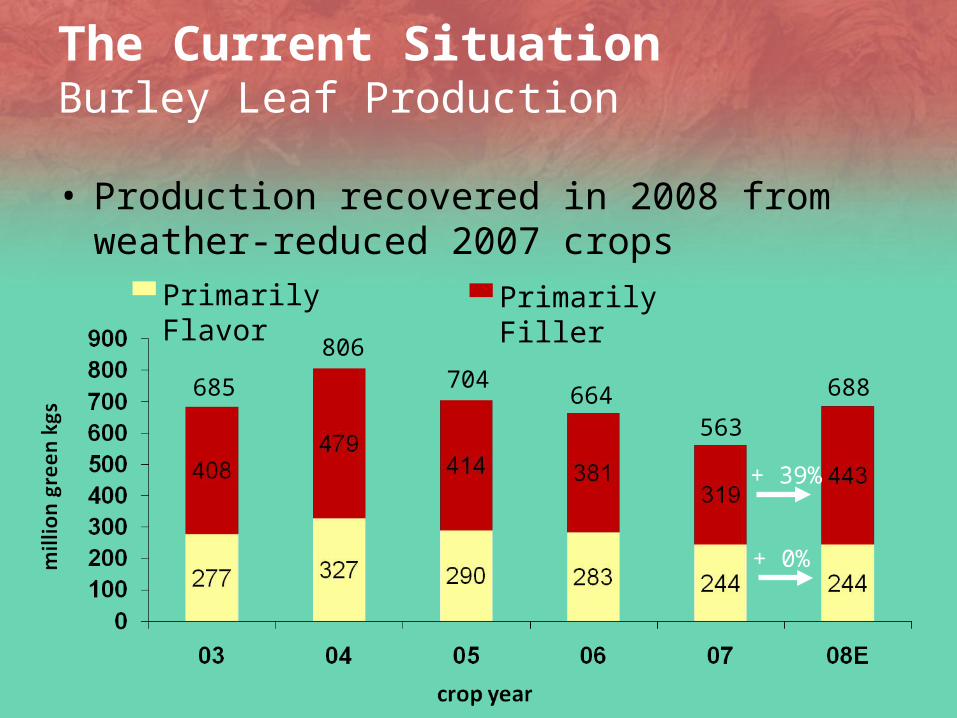
The Current SituationBurley Leaf Production
• Production recovered in 2008 from weather-reduced 2007 crops
685
806704
664563
Primarily Flavor Primarily Filler
+ 39%
+ 0%
688

The Current SituationBurley Leaf Production
• However– Filler primary beneficiary– Flavor styles flat– Burley supplies, particularly flavor remain tight

The Current SituationBurley Production - Flavor
Selected Countries
2000Million
Green Kgs
2007Million
Green Kgs
2008Million
Green Kgs
2007-08%
2000-08%
US 143 102 102 - -29
Brazil 95 105 100 -5 +5
Argentina 39 37 42 +14 +8

The Current SituationBurley Production - Filler
*EU exporters include Poland for all years
Selected Countries
2000Million
Green Kgs
2007Million
Green Kgs
2008Million
Green Kgs
2007-08%
2000-08%
Malawi 142 87 170 +95 +20
Mozambique 6 28 44 +57 +633
Zambia 3 5 12 +140 +300
India 9 15 23 +53 +185
Thailand 28 43 36 -16 +29
EU Exporters*
87 53 56 -3 -36
PRC 62 25 38 +52 -39
Philippines 27 8 9 +13 -67
Mexico 23 10 10 - -57
S. Korea 22 9 9 - -59

The Current SituationUnsold Stocks
• Last piece of market puzzle– Flue-cured unsold stocks
• At lowest level since 1991• Reflects lower 2008 production x-PRC

The Current SituationUnsold Stocks
85
128
151
187
98
72
U.S. Pool Others
World Uncommitted Flue-Cured Stocks as of June 30

The Current SituationUnsold Stocks
• Flue-cured markets balanced heading into 2009

The Current SituationUnsold Stocks
• Burley unsold stocks– Essentially gone
49
86 8572
29
U.S. Pool Others
9
World Uncommitted Burley Stocks as of June 30

The Current SituationUnsold Stocks
• Burley markets remain– Extremely tight for flavor– Still tight for filler

Future Trends/Potential Beneficiaries
• Cigarette Production– China will be main growth engine– Growth outside China will be slow (0-0.3%)
• Growth in Asia, Middle East, and Eastern Europe• Offset by continued declines in developed countries• Leaf markets will be at best flat

Future Trends/Potential Beneficiaries
• Leaf production – short term– 2009 Flue-cured
• Total production forecast to increase due to mainly PRC• Production by exporters x-PRC projected to rise
Estimated Flue-Cured Production in Million Green Kgs
2007 2008E 2009P Change over 08
Brazil 643 608 595 -13
India 260 270 280 10
US 220 231 227 -4
All x-PRC 1,706 1,669 1,750 81
PRC 1,950 2,150 2,200 50
Others 216 217 210 -7
World Total 3,873 4,028 4,160 132
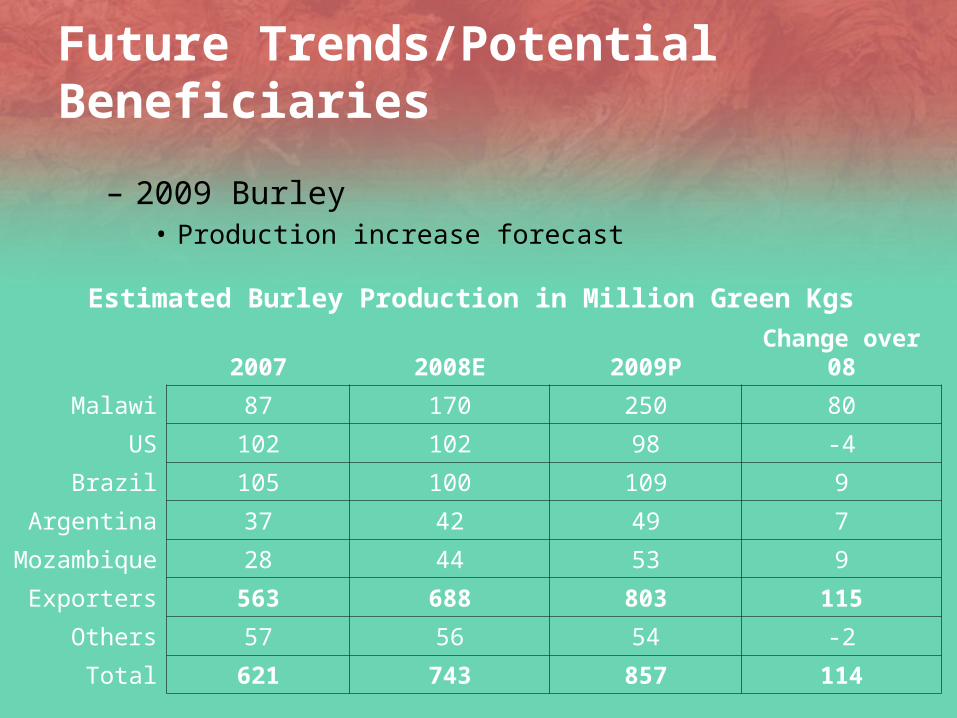
Future Trends/Potential Beneficiaries
– 2009 Burley• Production increase forecast
Estimated Burley Production in Million Green Kgs
2007 2008E 2009P Change over 08
Malawi 87 170 250 80
US 102 102 98 -4
Brazil 105 100 109 9
Argentina 37 42 49 7
Mozambique 28 44 53 9
Exporters 563 688 803 115
Others 57 56 54 -2
Total 621 743 857 114

Future Trends/Potential Beneficiaries
• Will not materially change tight supply situation, particularly flavor
• Significant downside risk

Future Trends/Potential BeneficiariesSlow Growth – What Could Change Trend?
• Higher production and leaf use– Development and consumer acceptance of reduced
risk products that look and act like traditional products– Increased consumption of OTP and snus could create
increased demand for dark air-cured leaf at expense of flue-cured and burley

Future Trends/Potential BeneficiariesSlow Growth – What Could Change Trend?
• Lower production and leaf use– Serious government effort to reduce PRC cigarette
consumption– Development and consumer acceptance of reduced
risk products using heating rather than burning technology
– These products require less leaf

Future Trends/Potential Beneficiaries
• Not much change from current situation• Flue-cured – Flavor
– Brazil• Will continue to dominate • Not immune to weather risk• Strong real raises dollar costs and prices
– U.S.• Termination of program improved leaf competitiveness• Quality remains best• Highest priced but dollar weakness reduces gap
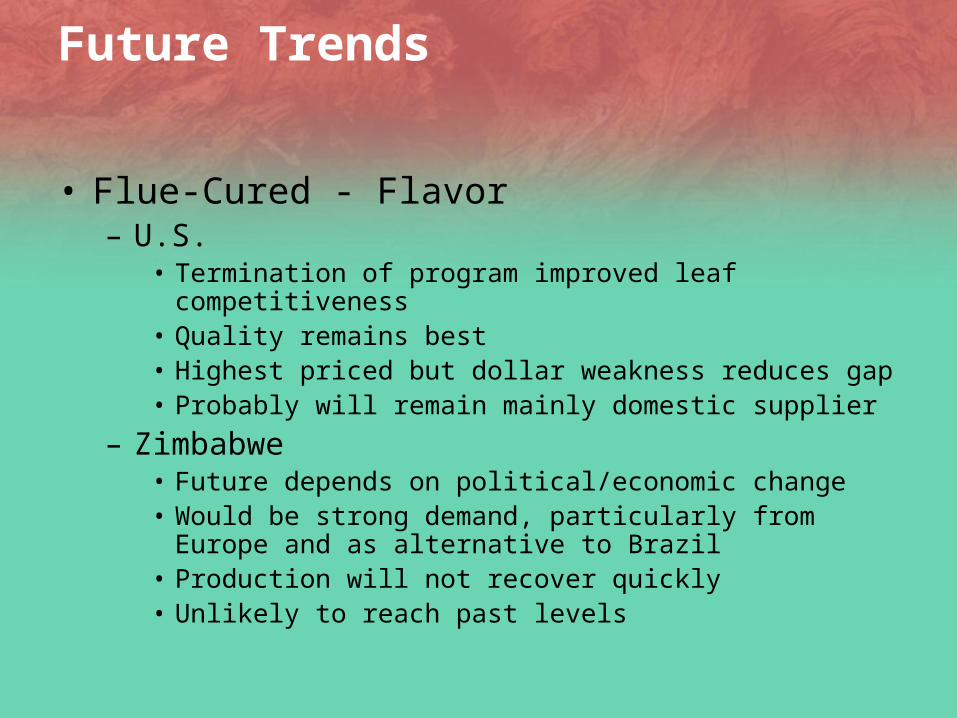
Future Trends
• Flue-Cured - Flavor– U.S.
• Termination of program improved leaf competitiveness• Quality remains best• Highest priced but dollar weakness reduces gap• Probably will remain mainly domestic supplier
– Zimbabwe• Future depends on political/economic change• Would be strong demand, particularly from Europe and as
alternative to Brazil• Production will not recover quickly• Unlikely to reach past levels

Future Trends
• Flue-Cured – Filler

Future Trends
• Flue-Cured – Filler– PRC
• Will grow to meet domestic demand• Exports face increasing competition from India• Reliable supplier concerns make PRC alternate choice
• Questions:– Will PRC continue domestic focus or seek to expand
exports– Can PRC produce significant quantities of an
“acceptable” flavor style

Future TrendsWinners and Losers
• Flue-Cured – Filler– Other Africa
• Zambia, Malawi, Tanzania and Uganda have potential• Excellent conditions including land, labor and climate• Lack of infrastructure/high cost of expansion• Affects competitiveness in market• Absence of land tenure systems is a major problem in some
African countries
– India, Pakistan, Bangladesh• Very competitive in price/quality• Production increasing• Could benefit from European decline• However all have growing domestic markets

Future TrendsWinners and Losers
• Flue-Cured – Filler– Europe
• Full decoupling in 2011 could result in significant decline in production
• Some member states have talked about national subsidies to maintain industry/employment
– Canada• Is essentially a domestic crop now

Future TrendsWinners and Losers
• Burley situation is very tight and demand remains strong
• Uncommitted stocks likely continuing at very low levels
• Burley flavor– Brazil
• Only Brazil has potential for significant increases in short term
• Costs/prices will go up– Strength of real– Prices of other crops – maize, soybeans

Future TrendsWinners and Losers
• Burley flavor– U.S.
• Little interest in producing more even at higher prices in traditional areas
• Further U.S. increases will depend on developing non-traditional areas

Future TrendsWinners and Losers
• Burley – Filler– Malawi
• May be reaching practical limits• Weather risk, particularly drought may be increasing• Prices likely to increase
– Mozambique• Could double production with existing infrastructure• Additional increases possible with additional infrastructure
investment• Dollar prices will have to double to offset impact of strong
currency on local costs and grower incomes

Some Final ObservationsManufacturers Will Determine Where Leaf is Produced
• Price/quality• Risk diversification
– Weather– Political/economic– Reliability of supply
• Scale is important• Other factors
– Social responsibility– Sustainable production practices– Environmental stewardship

Some Final ObservationsProduction Will Likely Remain in Traditional Origins
• New origins are expensive to develop• Dealers can’t afford w/o manufacturer support• More than enough capacity in traditional areas

Some Final Observations
• Production volatility will increase– Shift to non-irrigated production– Little irrigation in new origins– Long term (20-50 year) forecast is:
• Drier weather patterns in Southern Hemisphere• Periods of much wetter and much drier weather
• Shift from auction to direct contracting shifts risk from growers to dealers

Some Final ObservationsContinued
• Leaf prices will rise– Offset dollar decline on local currency costs and
incomes outside U.S.– Rising prices of alternative crops– Cover costs of programs promoted by manufacturers
to:• Improve quality• GAP• Social responsibility

Some Final ObservationsContinued
• Reduced risk products could revolutionize and revitalize industry– Impact level of cigarette and other product
manufacture– Leaf requirements– Future origins

TMA Annual Meeting and Conference
Global Leaf Trends Changing Dynamics / Future Trends
Presentation By:
Jim Starkey
Williamsburg, VirginiaMay18, 2009