west african economic and monetary union: staff report on - imf
TRANSCRIPT

©2011 International Monetary Fund May 2011 IMF Country Report No. 11/98
January 29, 2001 West African Economic and Monetary Union: Staff Report on Common Policies of Member Countries—Regional Consultation on Economic Issues and Policies—Staff Report, Public Information Notice Informational Annex, Staff Statement, Executive Director’s Statement This staff report on discussions with regional institutions for the West African Economic and Monetary Union (WAEMU) was prepared by a staff team of the International Monetary Fund in the context of the periodic regional surveillance of the WAEMU. The regional perspective of such discussions is intended to strengthen the bilateral discussions that the IMF holds with the members in the region under Article IV of the IMF’s Articles of Agreement. The following documents have been released and are included in this package: The staff report, prepared by a staff team of the IMF, following discussions that ended on
January 21, 2011 with the officials of the WAEMU regional institutions on economic developments and policies. Based on the information available at the time of these discussions, the staff report was completed on February 25, 2011. The views expressed in the staff report are those of the staff team and do not necessarily reflect the views of the Executive Board of the IMF.
Public Information Notice
Informational Annex
Staff Statement
Executive Director’s Statement
The policy of publication of staff reports and other documents allows for the deletion of market-sensitive information.
Copies of this report are available to the public from
International Monetary Fund Publication Services 700 19th Street, N.W. Washington, D.C. 20431
Telephone: (202) 623-7430 Telefax: (202) 623-7201 E-mail: [email protected] Internet: http://www.imf.org
International Monetary Fund Washington, D.C.

INTERNATIONAL MONETARY FUND
West African Economic and Monetary Union Staff Report on Common Policies of Member Countries
Regional Consultation on Economic Issues and Policies
Prepared by the African Department (In consultation with other departments)
Approved by Roger Nord and Thomas Dorsey
February 25, 2011
Policy discussions in the context of regional surveillance with member countries of the West African Economic and Monetary Union (WAEMU) were held with the WAEMU Commission in Ouagadougou January 11–14 and the Central Bank of West African States (BCEAO) in Dakar January 17–21. WAEMU countries are Benin, Burkina-Faso, Côte d’Ivoire, Guinea-Bissau, Mali, Niger, Senegal, and Togo.
The mission comprised Messrs. Funke (head), Mlachila, Lonkeng, and Vermeulen (all AFR) and Mr. Yèhoué (MCM), as well as the resident representatives in Ouagadougou (Ms. Adenauer) and Dakar (Ms. Fichera). Mr. Allé (OED) accompanied the mission. Mr. Nord (AFR) joined the policy discussions in Dakar. The mission met with the president and other officials of the WAEMU Commission, the Court of Auditors, the Court of Justice, and the governor and senior officials of the BCEAO and the WAEMU Banking Commission. The mission also met with representatives of the private sector, the donor community, and academia.
Building on previous staff analysis, discussions focused on policies to unlock growth potential, while improving the quality of growth and ensuring continued fiscal sustainability.
2
Contents Page
Executive Summary ...................................................................................................................5 I. An Ongoing Recovery: Recent Economic Developments and Outlook .................................6 II. Policy Discussions...............................................................................................................10
A. Fiscal Policies to Support Growth ..........................................................................10 B. Monetary Policy to Maintain Low Inflation ...........................................................14
III. Coordination of Domestic Policies ....................................................................................17 A. Convergence............................................................................................................17 B. Eliminating Domestic Arrears .................................................................................17 C. Public Financial Management .................................................................................18 D. Regional Economic Program .................................................................................18
IV. Trade and Competitiveness ................................................................................................19 A. Trade .......................................................................................................................19 B. Exchange Rate Assessment .....................................................................................19 C. Non-Price Competitiveness .....................................................................................21
V. Financial Sector Reforms ....................................................................................................21 A. Financial Sector Soundness ....................................................................................21 B. Financing Growth: Financial Sector Development .................................................23
VI. Staff Appraisal ...................................................................................................................23 Tables 1. Selected Economic and Financial Indicators, 2007–2015 ...................................................25 2. Sub-Saharan Africa: Cross-Group Comparison, 2007–2015..............................................26 3. Main Features of WAEMU Economies in 2009 ..................................................................27 4. Selected National Accounts and Inflation Statistics, 2007–2015 ........................................28 5. Fiscal Balances, 2007–2015 .................................................................................................29 6. External Balances, 2007–2015 .............................................................................................30 7. Government Debt, 2007–2015 .............................................................................................31 8. Monetary Survey, December 2007–September 2010 ..........................................................32 9. Financial Soundness Indicators for the Banking Sector, 2005–10 ......................................33 Figures 1. Recent Economic Developments, 2000–2010 .......................................................................7 2. Medium-Term Outlook, 2009–2015 ....................................................................................11 3. Comparing WAEMU to SSA High-Growth Non-Oil Exporters .........................................12 4. Fiscal Developments, 2009–2011 ........................................................................................13 5. Monetary Policy and Inflation, 2007–2010 .........................................................................16 6. Exchange Rate and Competitiveness, 1980–2010 ...............................................................20 7. Financial Soundness Indicators, 2005–2010 ........................................................................22 Boxes 1. The Economic Impact of the Crisis in Côte d’Ivoire on the WAEMU region .....................8 2. The New Institutional Framework of the BCEAO: Some Key Changes.............................15

3
Appendixes 1: The Quality of Growth in the WAEMU. .............................................................................34 2. Petroleum Pricing Policies in WAEMU Countries ..............................................................39 3. Exchange Rate Assessment for the WAEMU .....................................................................43 4. FSAP Follow-up ..................................................................................................................48 5. The Regional Debt Market...................................................................................................50 6. Public Information Notice ....................................................................................................54

4
List of Acronyms BCEAO Central Bank of West African States CFAF CFA Franc DSA Debt Sustainability Analysis ECF Extended Credit Facility ESF Exogenous Shocks Facility FDI foreign direct investment FSAP Financial Sector Assessment Program GDP gross domestic product MDG Millennium Development Goals MDRI Multilateral Debt Relief Initiative NFA net foreign assets NIR net international reserves NPV net present value NPL nonperforming loan PFM public financial management PPP public–private partnership PRGF Poverty Reduction and Growth Facility PRSP Poverty Reduction Strategy Paper PSI Policy Support Instrument REER real effective exchange rate SDR Special Drawing Rights SSA Sub-Saharan Africa VAT value-added tax WAEMU West African Economic and Monetary Union

5
Executive Summary Recent economic developments: The WAEMU has weathered the global financial crisis relatively well. A recovery has been supported by broadly appropriate monetary and fiscal policies, a revival in the region’s main trading partners, and a pick-up in growth in Guinea-Bissau and Togo. Economic outlook and risks: The economic recovery is expected to continue in the baseline scenario, under the assumption that the crisis in Côte d’Ivoire comes soon to a peaceful end. But risks are considerable. In particular, the crisis in Côte d’Ivoire, if not resolved soon, risks having significant negative spillover effects, reducing growth prospects and increasing human tragedy. A more sluggish global economy could also slow the recovery by dampening exports, remittances, and capital inflows. Globally rising food and fuel prices, exacerbated by regional trade disruptions stemming from the crisis in Côte d’Ivoire, pose upside inflationary risks. Key policy priorities: Staff and the authorities agreed that achieving higher growth and reducing vulnerabilities requires a stable political and macroeconomic environment and a faster pace of reforms to address key structural constraints, including infrastructure bottlenecks. Macroeconomic policies: Over the medium term fiscal policy must balance aggregate demand effects, investment needs to overcome severe infrastructure deficiencies, and debt sustainability considerations. The central bank should stand ready to tighten monetary policy, if rising food and fuel prices were to spill over into core inflation and inflation expectations. Laudable progress in implementing a new monetary policy framework needs to be supported by additional analytical underpinnings and a clear and transparent communication strategy.
Competitiveness: Fostering competitiveness is critical, in particular non-price competitiveness, including better infrastructure, quality of institutions, and trade integration. The past year’s weakness of the euro—to which the CFA franc is pegged—has helped to counteract some of the previous erosion of price competitiveness.
Financial sector: Notwithstanding progress made to date, the pace of reform needs to be accelerated. The 2009 slowdown of economic activity has further weakened asset quality. To strengthen supervision, more timely collection of financial soundness indicators and stepped-up financial stability analysis will be important. The sector’s contribution to financing growth should be strengthened through further institutional reforms, including those that facilitate the use of collateral, information sharing, and maturity transformation.

6
I. AN ONGOING RECOVERY: RECENT ECONOMIC DEVELOPMENTS AND OUTLOOK
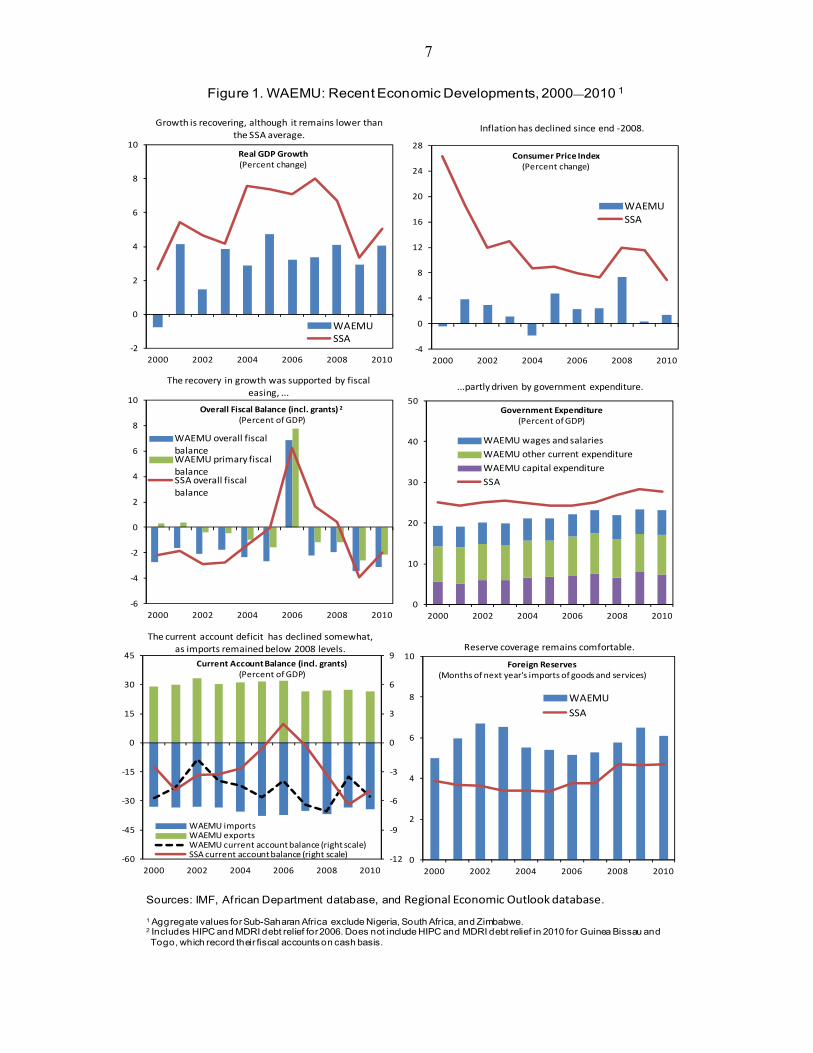
1. A recovery is underway. In 2010, economic growth in the WAEMU is estimated to have on average returned to levels prior to the global food and fuel price shocks and the global financial crisis (Figure 1)1, supported by monetary and fiscal easing, good agricultural production, recovery in the region’s main trading partners, and a pick-up in Guinea-Bissau and Togo.
2. In 2010, average inflation remained low in all WAEMU countries, but edged up in the second half of the year. On average, annual consumer price inflation reached 1.4 percent, up from 0.4 percent in 2009. More recently, however, higher international oil and food prices have started to feed through to inflation, but, while rising, core inflation has remained subdued.
3. After a moderate fiscal easing by about 1½ percentage points of GDP in 2009, mostly the result of higher capital spending, the area-wide average deficit is estimated to have declined slightly to 3.1 percent of GDP in 2010. Revenues have started to recover, while government expenditure has stabilized.
4. Following a compression of imports in 2009, the region’s external current account deficit is estimated to have returned to about 5½ percent of GDP in 2010. International reserves were above 6 months of imports of goods and services (excluding intra-WAEMU imports) in 2009 and 2010, supported by the SDR allocation.
5. The economic recovery is expected to continue, assuming that the political crisis in Côte d’Ivoire is resolved soon. Notwithstanding projected further strengthening of activity to close to 4½ percent in 2011 and above 5 percent in the medium term, supported by structural reforms, regional growth will continue to lag the SSA average. With recently rising international food and fuel prices and the disruption in Côte d’Ivoire, inflation is projected to edge up.
6. Risks to the projected recovery are considerable. In particular, the crisis in Côte d’Ivoire, if not resolved soon, risks having significant negative spillover effects that are hard to quantify (Box 1). A more sluggish global economy could also slow the recovery by dampening exports, remittances, and capital inflows. This could put pressure on the current account and on the quality of the loan portfolios of banks and complicate the financing of fiscal deficits. A persistent rise in international food and fuel prices poses inflationary risks, which may be
1 WAEMU-wide data typically refer to weighted averages.
Benin
Burkina Faso
Côte d'Ivoire
Guinea-Bissau
Mali
Niger
Senegal
Togo
WAEMU
CEMAC
SSA
0
1
2
3
4
5
6
7
8
9
0 1 2 3 4 5 6 7 8 9
20
10
Average 2004—2008
Real GDP Growth(Percent change)
7
The current account deficit has declined somewhat,
as imports remained below 2008 levels.
Figure 1. WAEMU: Recent Economic Developments, 2000—2010 1
Sources: IMF, African Department database, and Regional Economic Outlook database.
1 Aggregate values for Sub-Saharan Africa exclude Nigeria, South Africa, and Zimbabwe.2 Includes HIPC and MDRI debt relief for 2006. Does not include HIPC and MDRI debt relief in 2010 for Guinea Bissau andTogo, which record their fiscal accounts on cash basis.
-2
0
2
4
6
8
10
2000 2002 2004 2006 2008 2010
Real GDP Growth(Percent change)
WAEMUSSA
-12
-9
-6
-3
0
3
6
9
-60
-45
-30
-15
0
15
30
45
2000 2002 2004 2006 2008 2010
Current Account Balance (incl. grants)(Percent of GDP)
WAEMU importsWAEMU exportsWAEMU current account balance (right scale)SSA current account balance (right scale)
-6
-4
-2
0
2
4
6
8
10
2000 2002 2004 2006 2008 2010
Overall Fiscal Balance (incl. grants) 2
(Percent of GDP)
WAEMU overall fiscal
balanceWAEMU primary fiscal
balanceSSA overall fiscal
balance
-4
0
4
8
12
16
20
24
28
2000 2002 2004 2006 2008 2010
Consumer Price Index(Percent change)
WAEMUSSA
0
10
20
30
40
50
2000 2002 2004 2006 2008 2010
Government Expenditure(Percent of GDP)
WAEMU wages and salaries
WAEMU other current expenditure
WAEMU capital expenditure
SSA
0
2
4
6
8
10
2000 2002 2004 2006 2008 2010
Foreign Reserves(Months of next year's imports of goods and services)
WAEMU
SSA
Growth is recovering, although it remains lower than
the SSA average.
...partly driven by government expenditure.
Inflation has declined since end -2008.
Reserve coverage remains comfortable.
The recovery in growth was supported by fiscal
easing, ...

8
Box 1: The Economic Impact of the Crisis in Côte d’Ivoire on the WAEMU Region1 Importance of Côte d’Ivoire in the region With about a third of WAEMU output, Côte d’Ivoire remains the biggest economy in the region, although its share of regional output is down from almost 45 percent during the 1980s. While WAEMU countries’ exports to the Ivorian market have been consistently very low (less than one percent of their GDP), these countries’ imports from Côte d’Ivoire were more significant. This is especially true for hinterland countries (Burkina Faso, Mali and Niger) for which imports from Côte d’Ivoire amounted to some 5.7 percent of their GDP in the late 90s. Impact of the political crisis during the last decade The Ivorian political crisis during the last decade resulted in trade diversion and higher transportation costs for landlocked countries, which were forced to use longer and costlier alternative routes to seaports elsewhere.2 As a consequence, hinterland countries’ imports from Côte d’Ivoire (in percent of their GDP) dropped by half while the remaining WAEMU countries’ (Benin, Guinea-Bissau, Senegal and Togo) relatively low imports declined only slightly. The main transmission channels included (i) trade and transport links; and (ii) remittances and migration: Côte d’Ivoire is a significant source of remittances for Burkina Faso and to a lesser extent for other countries in the region. Despite its declining role, Côte d’Ivoire remains important as an engine for growth. It played an important role in the growth patterns of some smaller countries in the WAEMU. However, with its political crisis over the last decade, the correlation of growth between Côte d’Ivoire and the other WAEMU countries weakened. A key lesson for the hinterland countries has been to reduce their reliance on Côte d’Ivoire through the development of alternate transport routes, notably through Ghana, Senegal, and Togo.
0
1
2
3
4
5
6
1995 1997 1999 2001 2003 2005 2007 2009
Hinterland countries ¹ Other WAEMU
Imports from Côte d'Ivoire(Percent of GDP)
Source: IMF Trade Statistics and staf f estimates.1 Includes Burkina Faso, Mali and Niger.
-0.4
-0.2
0
0.2
0.4
0.6
0.8
1
1986 1989 1993 1997 2001 2005 2009
Growth Correlation in Côte d'Ivoire and other WAEMU countries 1
(Percent)
Hinterland Coastal
1 Three-year moving averages of rolling correlations over f ive-year window. Hinterland countries are Burkina Faso, Mali, and Niger; and coastal countries are Benin, Togo, and Senegal. Guinea-Bissau is excluded due to data consistency.

9
Box 1: The Economic Impact of the Crisis in Côte d’Ivoire on the WAEMU Region (continued)
Post-2010 election crisis
Presidential elections in October/November 2010 that were to end the division of the country instead have intensified the political crisis. While the government proclaimed by Alassane Ouattara appears to have received broad-based international support, outgoing President Gbagbo has refused to transfer power. Several countries and the EU have imposed sanctions against Gbagbo, his close allies, and a number of Ivorian state enterprises.
The economic impact of this renewed crisis is still unfolding, but is becoming more severe while it persists. Economic activity in some sectors appears to have come to a stand-still; in others the impact has been more limited so far. The recent closing of the BCEAO offices has left the banking system in Côte d’Ivoire in disarray, with the major banks initially setting up rudimentary bilateral clearing arrangements, and starting to introduce cash withdrawal limits. A growing number of banks have closed temporarily. Liquidity is reportedly scarce, which is likely to increasingly constrain private sector activity. For the region, compared to the earlier crisis last decade, financial sector linkages pose a much larger risk. Outstanding issues of Côte d’Ivoire treasury bills and bonds amounted to some CFAF 900 billion at end-2010, of which treasury bills accounted for some CFAF 600 billion accounting for about 60 percent of outstanding treasury bills in the market. To reduce liquidity and solvency risks in the banking sector, in December 2010 the BCEAO decided to roll over maturing Ivorian government paper, which is mostly held by banks in the region, according to estimates notably by banks in Côte d’Ivoire, Senegal, Benin, Burkina Faso, and to a lesser extent Mali. Côte d’Ivoire also technically defaulted on its US$2.3 billion Eurobond due 2032 in early February, after missing an end-of-January grace period deadline for a US$29 million coupon payment. The operations of the Banking Commission in Côte d’Ivoire are temporarily closed. The BCEAO continues to collect financial information of banks in other WAEMU countries through its national offices. Interruptions of operations in Côte d’Ivoire require enhanced crisis management and contingency planning. In sum, a rapid peaceful resolution would limit the economic impact, particularly for bordering countries that have diversified trade and transit routes over the past decade. But a prolonged and violent crisis could result in a much larger—hard to quantify—disruption and impact on the region, stressing the need for a crisis preparedness plan. A drop in output in Côte d’Ivoire, as was the case in 2000 and 2002, could push average regional growth to below 3 percent and a decline in per capita income. ------------------------------------- 1/ Prepared by Calixte Ahokpossi, Norbert Funke, Ngoc Le, Montie Mlachila, and Doris Ross. 2/ P. Egoumé and A. Nayo, 2011, “Feeling the Elephant’s Weight: The Impact of Côte d’Ivoire’s Crisis on WAEMU Trade”, IMF Working Paper, Forthcoming.
exacerbated by distortions to regional trade stemming from the crisis in Côte d’Ivoire. Because of higher food and fuel prices, governments could be tempted to lower indirect taxes or to resort to other means of subsidizing food and fuel consumption to contain the impact on poor households, which could have undesirable consequences for the fiscal outlook. In the longer term, excessive fiscal expansion to finance public investment without strengthening the selection or implementation of these investments could jeopardize the union’s debt sustainability. On the positive side, a faster global recovery or further strengthening of some commodity prices (e.g., gold and cotton) would benefit some WAEMU countries.

10
II. POLICY DISCUSSIONS
7. The policy discussions focused on accelerating long-term quality growth and reducing vulnerabilities to shocks. The authorities shared staff’s view that several complementary reforms are needed to support the growth momentum. During the past 15 years, WAEMU growth performance lagged behind the best-performing countries in SSA (Figures 2 and 3) 2. Comparing WAEMU countries to fast-growing sub-Saharan African countries3, a recent staff analysis shows that fostering competitiveness is critical, in particular non-price competitiveness, including infrastructure levels, quality of institutions, and trade integration (see Appendix 1).
8. Since the last regional consultation, economic policies have been broadly in line with Fund advice, mostly in the context of Fund-supported programs, but progress on structural reforms has been slow. The tightening of economic policies has been delayed, as uncertainties over the global and regional recovery have persisted and inflationary pressure remained low. The reform of the monetary framework is a major step forward. A difficult external environment may have slowed progress on the structural side.
A. Fiscal Policies to Support Growth
9. The authorities and staff agreed that fiscal policy must balance aggregate demand effects, investment needs to overcome severe infrastructure deficiencies and debt sustainability considerations. In 2011, the average fiscal deficit is projected to remain almost unchanged at 3.2 percent of GDP, but with some cross-country differences (Figure 4). With the need for more priority spending and relatively low levels of total debt in most countries, continued easing of fiscal policy to accommodate higher capital spending appears appropriate in some countries (e.g., Senegal). In other countries, where the risk of debt distress is higher, fiscal consolidation should occur earlier as the recovery takes hold. Staff emphasized that rebuilding policy buffers would help to avoid
2 See IMF, 2010, “The Quest for Higher Growth in the West African Economic and Monetary Union (WAEMU) and Implications for Fiscal Policy,” Regional Economic Outlook: Sub-Saharan Africa (Washington, October).
3 High-growth non-oil exporters refer to SSA countries with an average GDP per capita growth of at least 3 percent during 1995–2009: Botswana, Cape-Verde, Ethiopia, Mauritius, Mozambique, Rwanda, Tanzania, and Uganda.
2006 2007 2008 2009 2010 2011 2012Est. Proj. Proj.
Government revenue and grants 29.4 21.3 20.4 20.4 20.7 20.8 21.2of which : tax revenue 15.1 15.6 15.1 15.6 16.1 16.4 16.8
Government expenditure 22.6 23.5 22.4 23.9 23.8 24.0 24.1Current 15.6 15.8 15.9 15.9 16.4 16.0 15.8Capital 7.0 7.7 6.5 8.0 7.5 8.0 8.4
Overall fiscal balance (including grants) 6.8 -2.2 -2.0 -3.5 -3.1 -3.2 -3.0Overall fiscal balance (excluding grants) -5.5 -5.3 -4.8 -6.5 -5.8 -5.9 -5.7Primary balance (including grants) 7.7 -1.2 -1.1 -2.6 -2.2 -2.2 -1.8
Total public debt 46.2 48.2 42.9 45.4 44.1 43.4 39.4
of which:
External 1 38.2 39.7 33.8 36.0 35.0 34.5 30.9(excluding Côte d'Ivoire, Guinea-Bissau, and Togo) 24.5 25.5 25.2 30.3 32.8 33.0 33.1
Sources: IMF, African Department database; and staff estimates.
1 Before HIPC and MDRI completion point debt relief for Guinea Bissau and Togo.
WAEMU: Selected Fiscal Indicators(percent of GDP)

11
Figure 2. WAEMU: Medium Term Outlook, 2009—2015 1
Sources: IMF, African Department database, and Regional Economic Outlook database.
1 Aggregate values for Sub-Saharan Africa exclude Nigeria, South Africa, and Zimbabwe.2 Historical series based on BCEAO data, projections based on Regional Economic Outlook database.
0
1
2
3
4
5
6
7
8
9
10
2009 2011 2013 2015
Real GDP Growth(Percent change)
WAEMUSSA
-12
-9
-6
-3
0
3
6
9
-60
-45
-30
-15
0
15
30
45
2009 2011 2013 2015
Current Account Balance (incl. grants)(Percent of GDP)
WAEMU importsWAEMU exportsWAEMU current account balance (right scale)SSA current account balance (right scale)
-10
-8
-6
-4
-2
0
2
2009 2011 2013 2015
Overall Fiscal Balance (excl. grants)(Percent of GDP)
WAEMU overall fiscal balance
WAEMU primary fiscal balance
SSA overall fiscal balance
0
2
4
6
8
10
12
14
2009 2011 2013 2015
Consumer Price Index(Percent change)
WAEMUSSA
0
10
20
30
40
50
2009 2011 2013 2015
Government Expenditure(Percent of GDP)
WAEMU wages and salariesWAEMU other current expenditureWAEMU capital expenditureSSA
0
2
4
6
8
10
2009 2011 2013 2015
Foreign Reserves(Months of next year's imports of goods and services)
WAEMU ²
SSA
...and inflation to stay low over the medium term,
(despite a temporary increase in 2011).Real GDP growth is projected to reach about
5 percent, ...
and international reserves are projected to stay close
to current levels.The current account deficit ....
...while expenditure as a share of GDP remains
stable.The overall fiscal deficit is projected to decline,
supported by higher revenues, ...

12
Figure 3. WAEMU: Comparing WAEMU to SSA High-Growth Non-Oil Exporters1
Sources: Senegalese authorities; World Bank; African Department Database; and IMF staf f calculations and estimates.
1 High-growth non-oil exporters comprise Botswana, Cape Verde, Ethiopia, Mauritius, Mozambique, Rwanda, Tanzania, and Uganda;while fast growing WAEMU comprise Benin, Burkina Faso, Mali, and Senegal.
2 Variables vary from 0 to 5, with higher numbers indicating better quality of institutions.
Global competitiveness
Business competitiveness
GovernanceCorruption perceptions
Doing business
High-growth non-oil exportersWAEMUFast-growing WAEMU
Lines farther from the center represent a better relative position.
-6
-4
-2
0
2
4
6
8
1980 1984 1988 1992 1996 2000 2004 2008
High-growth non-oil exportersWAEMUFast-growing WAEMU
Real per capita GDP Growth(3-year moving average)
1.0
1.2
1.4
1.6
1.8
2.0
2.2
2.4
High-growth non-oil exporters
WAEMU Fast-growing WAEMU
Budget Index(Average overall score)
Real GDP growth in the WAEMU has remained well below growth in high-growth non-oil exporting SSA countries.
To accelerate growth, reforms should focus on
improving infrastructure, ....
...consolidating progress in public financial management,...
...increasing non-price competitiveness,...
... and accelerating structural reforms to improve governance, health, education, and the financial sector.
High-growth
non-oil
exporters1
WAEMU
Fast-
growing
WAEMU
Pav ed road density (km/1000 km^2) 176 2 14 11
Mobile density (per 1000 people) 138 50 51
Internet density (% of households w ith access) 4 2 2
Generation capacity ((MW/1 Mil. people) 99 20 19
Electricity cov erage (% Households) 25 17 18
Improv ed w ater (% Households) 71 60 60
Improv ed sanitation (% Households) 45 33 35
Source: AICD.1 Ex cluding Mozambique.2 When ex cluding Cape Verde and Mauritius, equals 13 km/1000 km2.
Benchmarking WAEMU Infrastructure with Other Country Groupings
(Years)(Percent of relevant
age group)(Percent of GDP)
Sub-Saharan Africa 1.9 1.8 53.1 57.3 20.8
High-growth non-oil exporters
2.4 2.4 54.1 64.2 22.5
WAEMU 1.9 1.7 52.5 41.3 13.0Of which: fast-growing 2.0 2.0 52.5 39.6 15.4
(Index 2 )
Other Structural Indicators, 1995–20091996–2008 1995–2009
CorruptionRule of
LawLife
ExpectancyPrimary
Completion RateDomestic Credit tothe Private Sector

13
Figure 4. WAEMU: Fiscal Developments, 2009—2011
Sources: IMF, African Department database, and Regional Economic Outlook database.
1 Does not include HIPC and MDRI debt relief in 2010 for Guinea Bissau and Togo, which record their fiscal accounts on cash basis
0
4
8
12
16
20
24
28Total Revenue (excl. grants)
(Percent of GDP)
2009 2010 2011
0
2
4
6
8
10
12
14
16
18Capital Expenditure
(Percent of GDP)
2009 2010 2011
0
2
4
6
8
10Wage Bill
(Percent of GDP)
2009 2010 2011
0
20
40
60
80
100
120
140External Public Debt
(Percent of GDP)
2009 2010 2011
-6
-5
-4
-3
-2
-1
0
1
2
3
4Overall Fiscal Balance (incl. grants) 1
(Percent of GDP)
2009 2010 2011
0
5
10
15
20
25
30
35
40Government Expenditure and Net Lending
(Percent of GDP)
2009 2010 2011
The average fiscal deficit fell below 3½ percent of GDP. Further efforts are needed to increase revenue, ...
... and contain expenditure as a share of GDP, ... ... including upward pressure on wages in some
countries,...
... to create more fiscal space for capital expenditure, ... ... and keep external debt at manageable levels.

14
new arrears accumulation, facilitate the repayment of the Central Bank of West African States (BCEAO) loans over the medium term, and cushion the impact of a possible reduction in future aid.
10. The authorities and staff concurred that all countries should increase fiscal space for priority spending, including infrastructure. Further improvements in tax administration and broad-based tax reforms would be conducive to higher revenue. Better prioritization of spending and economic profitability assessments for large investment projects could help improve the quality of spending. Moreover, staff suggested that a common regional understanding—led by the WAEMU Commission—to maintain or implement and apply automatic fuel price adjustments (Appendix 2), together with a push for energy tariffs that reflect costs, would limit the drain on budgets and reduce fiscal risks. Staff estimates that not passing through a 10 percent increase in international oil prices could lead to implicit subsidies of about ½ percent of GDP. More targeted compensatory measures to mitigate the impact of price increases on the poor should be explored, such as cash transfer systems and school lunch programs.
B. Monetary Policy to Maintain Low Inflation
11. Monetary policy has appropriately supported the recovery (Figure 5). Since mid-2009, with inflation falling, monetary easing has helped cushion the impact of the global financial crisis. The BCEAO used a variety of instruments: (i) a cut in the key policy rate by 50 basis points to 4.25 percent (still well above rates in the euro area); (ii) adoption of uniform reserve requirements (7 percent, effective December 16, 2010), broadly in line with previous staff recommendations; (iii) regular liquidity injections through its weekly facility; and (iv) other measures to help countries reduce domestic arrears.
12. Staff and the authorities agreed that monetary policy needs to be vigilant, in particular in an environment with increasing food and fuel prices. They also agreed that the BCEAO’s lending of the domestic currency equivalent of the SDR allocation in 2009 should be seen as a one-off operation to cushion the impact of the global financial crisis. Staff emphasized that the BCEAO should stand ready to tighten monetary policy, if these developments were to persist and risk spilling over into core inflation and inflation expectations. The BCEAO noted that an increase in policy rates should not be seen as an automatic response to rising inflationary pressures in the short-term. The larger share of food and energy in the consumption basket would contribute to higher volatility of headline inflation in the WAEMU compared to the euro area. The new monetary policy framework would focus on a 2-year horizon for inflation. Staff and the authorities agreed that the analysis of core inflation deserves close attention.
13. The modernization of the institutional framework for monetary policy is an important step in the right direction (Box 2), but staff also pointed to the need for further improvement. Analytical underpinnings, transparency, and communication need to be strengthened. Staff emphasized the importance of giving the monetary policy committee (MPC) the necessary analysis and tools to make well-informed decisions. This includes more

15
Box 2: The New Institutional Framework of the BCEAO: Some Key Changes1
The new framework includes changes to the BCEAO’s decision-making bodies, revisions to the objectives of monetary policy, and a larger set of operational tools.
Decision making bodies
Following the recent institutional reform, the BCEAO’s main decision-making bodies are the governor, the Monetary Policy Committee (MPC), the Board of Directors, the Audit Committee, and the National Credit Councils with one council in each member state of WAEMU.
To strengthen financial supervision, a Financial Stability Committee (FSC), headed by the governor and comprising mainly regulators (Banking Commission, social security regulator, insurance regulator, and the regional council for saving and financial markets) has also been put in place. The FSC meets twice a year (in May and December) and publishes an annual report on financial stability in the WAEMU. The first report will be published in December 2011. The FSC is responsible for macroprudential surveillance and crisis preparedness, and also coordinates supervisors’ and regulators’ actions.
Monetary Policy Committee
The MPC was established in September 2010 and is headed by the governor. It is responsible for setting monetary policy within WAEMU. The MPC is also responsible for defining the instruments to be used to achieve the policy objectives. It meets four times a year for ordinary sessions. In addition, other ad hoc sessions could be called.
The newly established MPC has set an inflation objective of 2 (±1) percent over a 24-month horizon.
At its December 1, 2010, meeting the MPC decided to adopt a uniform reserve requirement ratio of 7 percent for all the banks in WAEMU member countries, effective December 16, 2010. This harmonization has been gradual starting from June 2009.
Monetary Operations
The BCEAO conducts weekly open-market operations for liquidity injections.
The securities eligible as collateral for monetary policy operations are BCEAO bonds, treasury bonds, and other government securities; liquidity management instruments (billets de trésorerie) and certificates of deposit; regional financial institution securities (in particular BOAD); and any security issued or guaranteed by a government or issued by a body established in a WAEMU country, by decision of the Board of Directors of the BCEAO making them eligible. In addition:
A uniform refinancing rate of securities—90 percent of the residual value of the security, regardless of the maturity—has been set up.
The longest maturity for securities in the portfolio of the central bank has been doubled, from 10 years to 20 years, and the MPC can change this maturity.
Exposure to governments: The BCEAO’s refinancing exposure to government securities has been limited to at most 35 percent of the fiscal revenues of the preceding year, compared to a ceiling of 20 percent under previous statutes. There is no direct BCEAO financing.
Transparency and Publication
More detailed press releases after MPC meetings have started to increase transparency. Publication of more detailed analyses of inflation projections (e.g., an inflation report) could further strengthen transparency. Other measures, such as timely publication of the BCEAO’s financial statements, would also support transparency.
------------- 1 Prepared by Etienne Yèhoué.

16
... while inflationary pressure is rising, ... ... driven by world food and fuel price developments.
Figure 5. WAEMU: Monetary Policy and Inflation, 2007—2010
Sources: BCEAO, IMF, African Department database, and Regional Economic Outlook database.
1 Excess reserves as a percentage of required reserves.
-80
-60
-40
-20
0
20
40
60
80
100
120
De
c-0
6
Mar
-07
Jun
-07
Sep
-07
De
c-0
7
Mar
-08
Jun
-08
Sep
-08
De
c-0
8
Mar
-09
Jun
-09
Sep
-09
De
c-0
9
Mar
-10
Jun
-10
Sep
-10
De
c-1
0
World Price Inflation(Percent change, yoy)
FuelFood and Beverage
0
1
2
3
4
5
6
De
c-0
6
Mar
-07
Jun
-07
Sep
-07
De
c-0
7
Mar
-08
Jun
-08
Sep
-08
De
c-0
8
Mar
-09
Jun
-09
Sep
-09
De
c-0
9
Mar
-10
Jun
-10
Sep
-10
De
c-1
0
Policy Interest Rates(Percent, average)
ECB policy rate
BCEAO policy rate0
1
2
3
4
5
6
7
8
De
c-0
7
Mar
-08
Jun
-08
Sep
-08
De
c-0
8
Mar
-09
Jun
-09
Sep
-09
De
c-0
9
Mar
-10
Jun
-10
Sep
-10
De
c-1
0
Selected Policy Interest Rates(Percent)
One-week interbank rate
BCEAO marginal rate of liquidity injectionBCEAO policy rate
0
1
2
3
4
5
6
7
De
c-0
6
Mar
-07
Jun
-07
Sep
-07
De
c-0
7
Mar
-08
Jun
-08
Sep
-08
De
c-0
8
Mar
-09
Jun
-09
Sep
-09
De
c-0
9
Mar
-10
Jun
-10
Sep
-10
De
c-1
0
Interbank Interest Rates(Percent)
WAEMU average interbank rate
Euro area average interbank rate
Interbank rates remain generally in the corridor, ...
... but above Euro area rates.
Following a decline during 2009, policy rates
remained stable.
-2
0
2
4
6
8
10
12
De
c-0
6
Mar
-07
Jun
-07
Sep
-07
De
c-0
7
Mar
-08
Jun
-08
Sep
-08
De
c-0
8
Mar
-09
Jun
-09
Sep
-09
De
c-0
9
Mar
-10
Jun
-10
Sep
-10
De
c-1
0
Consumer Price Inflation(Percent change, yoy)
Headline Inflation
Core inflation (excl. food and energy)
0
30
60
90
120
150
0
5
10
15
20
25
De
c-0
6
Mar
-07
Jun
-07
Sep
-07
De
c-0
7
Mar
-08
Jun
-08
Sep
-08
De
c-0
8
Mar
-09
Jun
-09
Sep
-09
De
c-0
9
Mar
-10
Jun
-10
Sep
-10
De
c-1
0
Liquidity Conditions(Percent)
Broad money growthExcess reserves (rhs) ¹
Excess liquidity continues to prevail, ...

17
analytically robust medium-term inflation projections, a better understanding of monetary policy transmission mechanisms, and a clear communication strategy. Publication of a quarterly monetary policy/inflation report could be helpful. Staff welcomed the BCEAO’s initiative to update its website to increase transparency and facilitate public access to information.
III. COORDINATION OF DOMESTIC POLICIES
A. Convergence
14. Building on progress, further convergence in economic development is desirable. On the positive side, all countries have respected the convergence criterion on inflation. Also, debt remains mostly at manageable levels. In countries that benefited already from earlier debt relief, debt levels have risen, though from a low base. In several countries, the risk of debt distress remains low or moderate (Benin, Mali, Niger, and Senegal). Debt levels have declined sharply in Guinea-Bissau and Togo owing to recent debt relief. Only in Côte d’Ivoire, which has not yet reached the completion point, debt is above the 70 percent of GDP threshold. On the negative side, most countries do not meet the secondary convergence criteria.
15. Although convergence criteria give an important medium-term orientation, for macroeconomic stability and fiscal discipline in the region coherence and clear definitions of criteria are important. Staff emphasized that the 70 percent of debt-to-GDP limit for total debt is higher than what has traditionally been seen as a reasonable limit for developing and emerging markets and may give misleading signals to WAEMU authorities. Lower thresholds in line with joint Bank-Fund debt sustainability analyses would be desirable. The authorities took note and explained that they are in the process of strengthening monitoring and clarifying and harmonizing some criteria, including those related to wages and arrears. The authorities have already refined the calculation of the basic fiscal balance (see text table).
B. Eliminating Domestic Arrears
16. Several policies have been put in place to facilitate reducing government domestic arrears. According to a survey of member governments compiled by the central bank, the stock of government domestic arrears was estimated at 4.3 percent of WAEMU GDP in April 2009.
2007 2008 2009 2010Est.
First-order criteria
Basic fiscal balance/GDP (≥ 0 percent) 1
7 7 6 3Average consumer price inflation (≤ 3 percent) 2 8 0 0Total debt/GDP (≤ 70 percent) 3 3 3 1Change in domestic arrears (≤ 0) 2 0 0 1Change in external arrears (≤ 0) 3 2 0 1
Second-order criteriaWages and salaries/tax revenue (≤ 35 percent) 3 4 5 5Capital expenditure domestically financed/tax revenue (≥ 20 percent) 4 3 3 3External current account balance, excluding grants/GDP (≥ -5 percent) 7 7 7 7Tax revenue/GDP (≥ 17 percent) 7 6 7 6
Sources: WAEMU; Central Bank of West African States (BCEAO); and staff estimates.
WAEMU: Compliance with Convergence Criteria, 2007-2010(Number of countries violating)
1 Total fiscal revenues, excluding grants, minus total expenditures excluding foreign-financed
investment expenditure. From 2009, total fiscal revenues plus budget support grants plus counterpart of HIPC/MDRI-related spending for both current and capital spending less current expenditure and capital expenditure financed by own resources.

18
Two measures have aimed at reducing government arrears: the BCEAO’s lending of the domestic currency equivalent of the SDR allocation (1.5 percent of GDP), from which all countries benefited, and making eligible for refinancing an equal amount of government bonds issued to clear domestic arrears. Together with countries’ normal budgetary efforts to clear arrears, staff estimates that remaining arrears amount to about 1.8 percent of GDP. Staff welcomed ongoing initiatives to better monitor the development of domestic arrears and emphasized that clearance of remaining arrears will be critical to fully normalizing relations with the private sector and strengthening banks’ balance sheets and hence lending capacity. Monitoring the financial health of public enterprises also deserves more attention. Proper coordination of fiscal and monetary policies, enhanced management of liquidity on the regional financial market, improvements in debt management, and continued strengthening of public financial management (PFM) should help avoid re-occurrence of arrears.
C. Public Financial Management
17. The mission encouraged the WAEMU Commission to push for timely implementation of the ambitious program of PFM reforms in all member countries. To improve PFM, the new PFM directives incorporate new concepts and techniques such as program budgeting, medium-term budget and expenditure frameworks (MTBF/MTEF), accrual accounting, delegation of the minister of finance’s power to order payments to other ministers, and a single treasury account system. The new directives have several objectives, notably to (i) harmonize the rules for budget preparation, presentation, approval, execution, control and reporting in all member states; (ii) promote effective and transparent PFM in all member countries; and (iii) enable comparability of public finance data for effective multilateral surveillance of national budgetary policies. Staff suggested that regular follow-up, for example, in the semiannual surveillance reports (Rapport semestriel d’exécution de la surveillance) could help advance the agenda. Continued PFM reforms are necessary to improving the quality of spending.
D. Regional Economic Program
18. Staff welcomed the ongoing review of the first Regional Economic Program (REP) 2006–10, aimed at supporting growth and investment in the region. The majority of the REP’s resources are for infrastructure projects (roads, energy, telecommunications). Despite significant progress financial resource mobilization remains a constraint. The ongoing assessment should provide a good basis for a successor plan. Staff encouraged the authorities to base the selection and prioritization of projects on economic profitability assessments (including cash-flow analysis) and to fully integrate projects in medium-term budget frameworks. It would also be important to put in place clear rules for follow-up and auditing, including adequate resources and independence for the public procurement agencies, the Court of Auditors, and the Court of Justice, at the national and regional level.

19
1980 1995 2005 2010/1
Euro Area 54.2 45.4 35.3 28.0 of which France 31.2 24.1 19.9 10.6USA 5.2 4.3 6.2 6.5BRICs 2.1 5.7 8.0 19.0 of which China 1.4 1.6 4.0 14.1 India 0.3 2.9 2.8 3.8Intra-WAEMU 7.5 8.3 10.8 9.5Other selected countries Nigeria 3.9 5.2 10.5 6.7 Ghana 0.2 1.2 1.2 1.2
1/ based on first and second quarter figures.
Source: IMF Direction of Trade Statistics and Staff estimates
WAEMU: Partners' Shares (in percent of total trade)
IV. TRADE AND COMPETITIVENESS
A. Trade
19. While trade has been gradually shifting away from the EU toward emerging markets, including Brazil, Russia, India, and China (BRIC) in particular, progress on regional integration has been slower. The authorities concurred that the persistence of nontariff barriers, such as time-consuming border controls and frequent road blocks, limits intraregional trade.
20. Negotiations between the European Union (EU) and the West Africa region (ECOWAS plus Mauritania) for a full Economic Partnership Agreement (EPA) are ongoing. For an agreement on trade in goods, the main stumbling blocks are the length of the transition period to full EPA implementation and the level of EU access to the West African market. Staff welcomed the authorities’ ongoing efforts to assess the economic impact of the contemplated EPA on revenues and economic development more generally. Using Côte d’Ivoire’s interim agreement as an example, staff’s estimate suggests that the loss in revenue could in some countries reach up to 2 percent of GDP. The economic impact could be offset by the envisaged gradual phasing-in, a positive impact on welfare and GDP of trade liberalization, and by potential EU support to EPA countries.
21. The envisaged introduction of a fifth (35 percent) tariff band with the broadening of the common external tariff to all ECOWAS countries is a step back. Staff reiterated that the selection method for products to be included in this band should take into account all additional costs, and that the list should remain as limited as possible.
B. Exchange Rate Assessment
22. The authorities and staff agreed that last year’s depreciation of the real effective exchange rate (REER), largely driven by the decline in the euro, has helped competitiveness (Figure 6, Appendix 3). During 2010, the real effective exchange rate depreciated by about 6 percent, offsetting part of the previous increase. The staff-updated exchange rate assessment, based on the three common approaches—equilibrium real exchange

20
Figure 6. WAEMU: Exchange Rate and Competitiveness, 1980—2010
Sources: BCEAO, IMF, African Department database, and Regional Economic Outlook database.
-6
-4
-2
0
2
4
6
8
10
Jan
-03
May
-03
Sep
-03
Jan
-04
May
-04
Sep
-04
Jan
-05
May
-05
Sep
-05
Jan
-06
May
-06
Sep
-06
Jan
-07
May
-07
Sep
-07
Jan
-08
May
-08
Sep
-08
Jan
-09
May
-09
Sep
-09
Jan
-10
Inflation Differential(Percent change, yoy)
Euro areaUnited States
0.4
0.5
0.6
0.7
0.8
0.9
1.0
1.1
1.2
Jan
-03
May
-03
Sep
-03
Jan
-04
May
-04
Sep
-04
Jan
-05
May
-05
Sep
-05
Jan
-06
May
-06
Sep
-06
Jan
-07
May
-07
Sep
-07
Jan
-08
May
-08
Sep
-08
Jan
-09
May
-09
Sep
-09
Jan
-10
May
-10
Sep
-10
Euro/USD Exchange Rate(Euro per U.S. dollar)
With a favorable inflation differential vis-à-vis
important trading partners, ...... and the depreciation of the euro during the past
year, ...
... but most WAEMU countries rank relatively low on Doing Business Indictators.
... the real effective exchange rate has depreciated
during 2010, ...
60
80
100
120
140
160
180
200
220
1980 1984 1988 1992 1996 2000 2004 2008
Effective Exchange Rate(Index)
NEERREER
60
80
100
120
140
160
180
200
220
1980 1984 1988 1992 1996 2000 2004 2008
Equilibrium Effective Exchange Rate(Index)
Equilibrium REER (est.)REER
... remaining close to its estimated equilibrium value, ...
Burkina Côte Guinea-
Benin Faso d'Ivoire Bissau Mali Niger Senegal Togo WAEMU 1
Overall Rank 170 151 169 176 153 173 152 160 163Starting a business 157 119 172 183 117 159 101 169 147Dealing with construction permits 125 77 165 103 87 162 117 152 124Registering property 129 118 151 175 88 84 167 158 134Getting credit 152 152 152 152 152 152 152 152 152Protecting investors 154 147 154 132 147 154 167 147 150Paying taxes 167 148 153 133 159 144 170 157 154Trading across borders 127 175 160 117 154 174 67 93 133Enforcing contracts 177 108 126 139 133 138 148 151 140Closing a business 118 100 76 183 106 136 79 84 110
Source: Doing Business Report 2011, World Bank.1 Simple average.
Doing Business Indicators

21
rate, macroeconomic balance, and external sustainability—points in two cases to a mild but statitistically not significant overvaluation of the REER of up to 7 percent. The authorities’ estimates are broadly similar, though somewhat lower and within a smaller range. Overall, the real effective exchange rate appeared broadly in line with economic fundamentals in 2010. Higher volatility of the euro exchange rate, with over the years a declining share of trade with the euro area, has resulted in an increase in the volatility of the REER. To overcome any negative effect the exchange rate and volatility may have on growth, other policies need to be stronger. Supply-side reforms are priorities for WAEMU institutions as they address the real exchange rate appreciation trend.
C. Non-Price Competitiveness
23. The authorities agreed that improving non-price competitiveness, including the business climate, governance, and quality of institutions, is important to unlocking WAEMU’s growth potential. WAEMU countries generally are in the bottom 30 percent of Doing Business indicators and also perform relatively poorly compared to high-growth, non-oil exporters on other indicators of non-price competitiveness, including governance, corruption perception, and infrastructure. A major binding constraint is a lack of sufficient and cost-effective infrastructure, especially in electricity supply, road transport, and ports. Better infrastructure, including regional infrastructure, financed also in part with the help of public–private partnerships, should help promote trade and diversification. Adoption of an appropriate public–private partnership (PPP) framework that also limits fiscal risk would be essential.
V. FINANCIAL SECTOR REFORMS
A. Financial Sector Soundness
24. The growth slowdown has weakened credit quality and put some upward pressure on nonperforming loans, which were already high (Figure 7). Nonperforming loans represented about 17 ½ percent of total loans at end-September 2010. In addition, considerable single-borrower exposure continues to pose a key risk. In Benin, the collapse of a “Ponzi” scheme in mid-2010 added an additional challenge. Staff welcomed the increase in capital requirements, which was scheduled for completion by December 2010. The capital adequacy ratio for the region as a whole meets minimum requirements, but the BCEAO is still in the process of assessing compliance with the new minimum capital requirement at end-December 2010. Staff emphasized the need to take measures to accelerate compliance, in cases where it is not yet met.
25. Staff welcomed some progress with the Financial Sector Assessment Program (FSAP) follow-up (Appendix 4) but at the same time emphasized the need to focus more on implementation. Staff pointed to substantial further scope for the BCEAO and the Banking Commission to improve various areas. In particular, it is critical to (i) improve the timely collection of financial soundness indicators, make them publicly available to increase transparency, and perform stress tests at regular intervals as a step toward an early warning

22
Figure 7. WAEMU: Financial Soundness Indicators, 2005—2010
Sources: BCEAO, IMF, African Department database, and Regional Economic Outlook database.
* 2010 refers to June.
0
2
4
6
8
10
12
2005 2006 2007 2008 2009 2010
Capital Adequacy Ratio *(Percent)
15
16
17
18
19
20
21
2005 2006 2007 2008 2009 2010
Non performing Loans *(Percent of total loans)
0
10
20
30
40
50
60
70
80
90
100
Core Capital Fixed assets and NE participations
Loan to staff and management
Exposure to large borrower
Liquidity ratio Stable resouirces/M&L
term loans
Portfolio Structure
Prudential Regulations(Percent of banks complying)
2008
2009
June 2010
Overall, the banking sector appears well capitalized, ...
... but non performing loans are high, ...
... and access to credit continues to be comparatively low.
... while compliance with prudential regulation has diminished, ...
WAEMU 1 152 3 1 1.5 0.0Benin 152 3 1 10.4 0.0Burkina Faso 152 3 1 0.2 0.0Côte d'Ivoire 152 3 1 0.2 0.0Guinea-Bissau 152 3 1 0.3 0.0Mali 152 3 1 0.1 0.0Niger 152 3 1 0.1 0.0Senegal 152 3 1 0.4 0.0Togo 152 3 1 0.2 0.0
Mauritius 89 5 3 49.8 0.0Morocco 89 3 5 0.0 9.9 Source: Doing Business Report 2011, World Bank.
1 Simple average.
Private Bureau Coverage (percent of adults)
Access to CreditGetting
Credit RankStrength of Legal
Rights Index (0-10)Depth of Credit
Information Index (0-6)Public Registry Coverage
(percent of adults)

23
mechanism to detect risks and vulnerabilities; (ii) strengthen capacity to conduct macroprudential and financial stability analysis; and (iii) prepare preventive contingency plans and consider introducing a prompt corrective action mechanism that minimizes countries’ and supervisors’ discretion in dealing with distressed banks.
B. Financing Growth: Financial Sector Development
26. The authorities and staff concurred that the financial depth of WAEMU countries is below the SSA average, as shown, for example, in a private sector credit-to-GDP ratio below 20 percent for the WAEMU, above 30 percent for SSA, and above 20 percent for SSA excluding South Africa and Nigeria. Notwithstanding steady progress, the regional bond market remains shallow. High excess liquidity is in sharp contrast to a lack of long-term resources, which are needed to finance long-term investments. There are no liquid secondary markets, market dealers charge high fees, and other market characteristics, including a lack of an active institutional investor base, constrain market development. Access to finance for small and medium-size enterprises is also challenging.
27. The WAEMU needs a stronger regional bond market and stronger banking system to support investment and long-term growth. To broaden and deepen the regional bond market (Appendix 5), staff encouraged the authorities to review prudential regulations related to transforming resources to long-term lending. Reforms to improve access to finance should also be accelerated, for example, through legislation to facilitate the use of collateral (e.g., land titles) and reforms to encourage the development of private credit rating bureaus and leasing arrangements.
VI. STAFF APPRAISAL
28. Zone-wide economic activity has picked up. Political stability in the region is a precondition for the recovery to continue. With an expeditious and peaceful solution of the situation in Côte d’Ivoire, real GDP growth in 2011 could reach close to 4½ percent. Inflation is moderate but has risen recently, driven by higher international food and fuel prices and inflation risks are on the upside. However, the unresolved crisis in Côte d’Ivoire poses major risks to the region including through (i) trade and transport links; (ii) remittances and migration; (iii) and, importantly, financial sector linkages. Should the crisis persist, economic spill-overs for the region will be significant, at a severe human and financial cost for neighboring countries.
29. Key reforms needed to accelerate growth include (i) maintaining macroeconomic stability, supported by creating fiscal space for more priority spending through higher revenues and improvements in the quality of spending; (ii) deepening financial markets; (iii) strengthening coordination of domestic policies, including enhancing PFM through timely implementation of the PFM directives; and (iv) pursuing faster broad-based structural reforms to improve the business climate, governance, and the energy sector.

24
30. In terms of fiscal policies and PFM, countries should resist current spending pressures and reinforce tax collections to create scope for more infrastructure investment. Over the medium term, fiscal policy must balance aggregate demand effects, debt sustainability considerations, and investment needs.
31. The new institutional framework for monetary policy, including the newly established MPC, is an important step in the right direction. To make the framework more effective, the analytical underpinnings, transparency, and communication need to be improved.
32. Progress on meeting convergence criteria has been uneven, and reforms to foster regional integration should be continued. Ongoing initiatives to clarify some definitions of convergence criteria and to improve monitoring of arrears are welcome. The ongoing evaluation of the Regional Economic Program for 2006–10, which included a number of projects to foster regional integration, will provide a basis for its successor program. Regional projects should be based on sound economic profitability analyses.
33. The depreciation of the REER during 2010 of about 6 percent has somewhat reduced pressure on competitiveness. Based on standard approaches of exchange rate assessment, in 2010 the REER appeared broadly in line with economic fundamentals. The volatility of the euro exchange rate has translated in larger volatility of the WAEMU’s real effective exchange rate. To overcome any negative effect the exchange rate or exchange rate volatility may have on growth, supply side reforms need to regain momentum.
34. While there is some progress in various financial reforms, there is a need to step-up the follow-up on FSAP recommendations, in particular with regard to reform implementation. A lack of comprehensive and up-to-date banking data and vulnerability indicators hinders timely assessments of financial stability. A more timely collection of financial soundness indicators would be a first important step toward improving supervision. To broaden and deepen financial markets, reforms that facilitate the use of collateral, information sharing, and maturity transformation to support bond market development deserve special attention. In the short-term, with the temporary closure of major banks and the Banking Commission in Côte d’Ivoire; it is essential to focus on contingency planning and crisis management to minimize the risk of a systemic impact on the WAEMU financial system.
35. Improving trade and non-price competitiveness will be particularly critical in achieving the objectives of the union and making a bigger dent in poverty. Improving the business climate and the quality of infrastructure and institutions should be given the highest priority, together with the integration of WAEMU domestic markets and developments of the financial sector.
36. It is proposed that regional discussions with the WAEMU authorities remain on the standard 12-month consultation cycle.
25
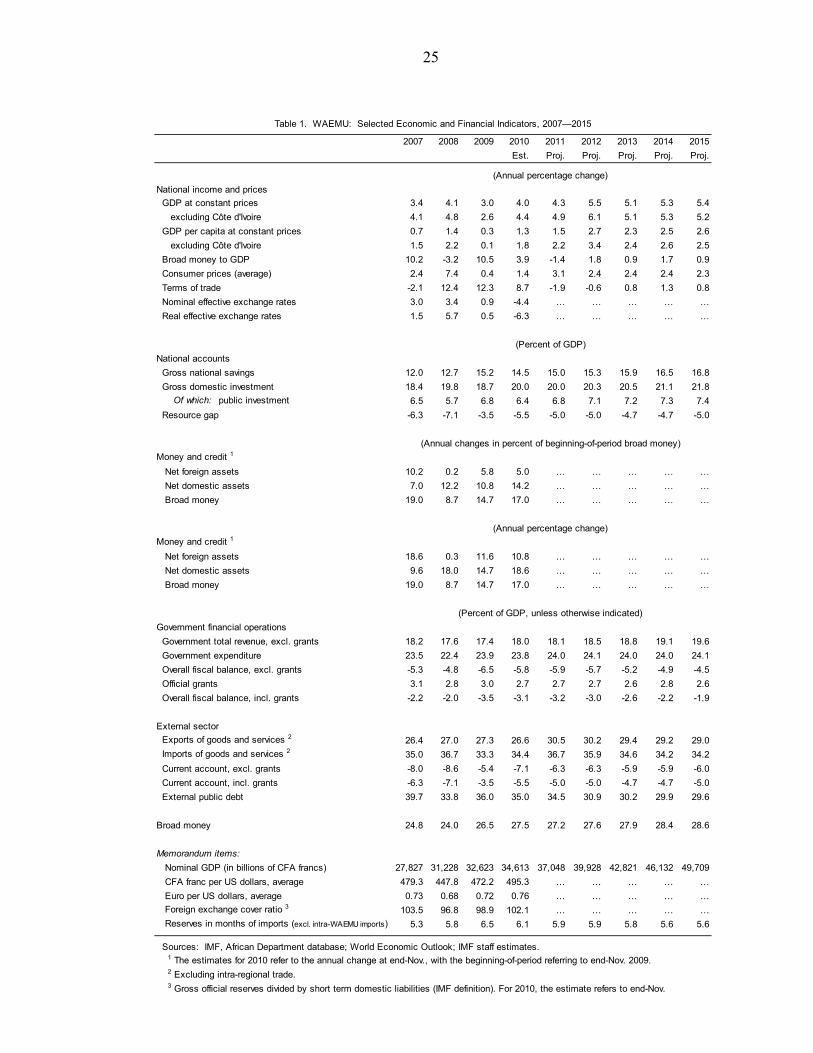
2007 2008 2009 2010 2011 2012 2013 2014 2015
Est. Proj. Proj. Proj. Proj. Proj.
National income and prices
GDP at constant prices 3.4 4.1 3.0 4.0 4.3 5.5 5.1 5.3 5.4
excluding Côte d'Ivoire 4.1 4.8 2.6 4.4 4.9 6.1 5.1 5.3 5.2
GDP per capita at constant prices 0.7 1.4 0.3 1.3 1.5 2.7 2.3 2.5 2.6
excluding Côte d'Ivoire 1.5 2.2 0.1 1.8 2.2 3.4 2.4 2.6 2.5
Broad money to GDP 10.2 -3.2 10.5 3.9 -1.4 1.8 0.9 1.7 0.9
Consumer prices (average) 2.4 7.4 0.4 1.4 3.1 2.4 2.4 2.4 2.3
Terms of trade -2.1 12.4 12.3 8.7 -1.9 -0.6 0.8 1.3 0.8
Nominal effective exchange rates 3.0 3.4 0.9 -4.4 … … … … …
Real effective exchange rates 1.5 5.7 0.5 -6.3 … … … … …
National accounts
Gross national savings 12.0 12.7 15.2 14.5 15.0 15.3 15.9 16.5 16.8
Gross domestic investment 18.4 19.8 18.7 20.0 20.0 20.3 20.5 21.1 21.8
Of which: public investment 6.5 5.7 6.8 6.4 6.8 7.1 7.2 7.3 7.4
Resource gap -6.3 -7.1 -3.5 -5.5 -5.0 -5.0 -4.7 -4.7 -5.0
Money and credit 1
Net foreign assets 10.2 0.2 5.8 5.0 … … … … …
Net domestic assets 7.0 12.2 10.8 14.2 … … … … …
Broad money 19.0 8.7 14.7 17.0 … … … … …
Money and credit 1
Net foreign assets 18.6 0.3 11.6 10.8 … … … … …
Net domestic assets 9.6 18.0 14.7 18.6 … … … … …
Broad money 19.0 8.7 14.7 17.0 … … … … …
Government financial operations
Government total revenue, excl. grants 18.2 17.6 17.4 18.0 18.1 18.5 18.8 19.1 19.6
Government expenditure 23.5 22.4 23.9 23.8 24.0 24.1 24.0 24.0 24.1
Overall fiscal balance, excl. grants -5.3 -4.8 -6.5 -5.8 -5.9 -5.7 -5.2 -4.9 -4.5
Official grants 3.1 2.8 3.0 2.7 2.7 2.7 2.6 2.8 2.6
Overall fiscal balance, incl. grants -2.2 -2.0 -3.5 -3.1 -3.2 -3.0 -2.6 -2.2 -1.9
External sector
Exports of goods and services 2 26.4 27.0 27.3 26.6 30.5 30.2 29.4 29.2 29.0
Imports of goods and services 2 35.0 36.7 33.3 34.4 36.7 35.9 34.6 34.2 34.2
Current account, excl. grants -8.0 -8.6 -5.4 -7.1 -6.3 -6.3 -5.9 -5.9 -6.0
Current account, incl. grants -6.3 -7.1 -3.5 -5.5 -5.0 -5.0 -4.7 -4.7 -5.0
External public debt 39.7 33.8 36.0 35.0 34.5 30.9 30.2 29.9 29.6
Broad money 24.8 24.0 26.5 27.5 27.2 27.6 27.9 28.4 28.6
Memorandum items:
Nominal GDP (in billions of CFA francs) 27,827 31,228 32,623 34,613 37,048 39,928 42,821 46,132 49,709
CFA franc per US dollars, average 479.3 447.8 472.2 495.3 … … … … …
Euro per US dollars, average 0.73 0.68 0.72 0.76 … … … … …
Foreign exchange cover ratio 3 103.5 96.8 98.9 102.1 … … … … …
Reserves in months of imports (excl. intra-WAEMU imports) 5.3 5.8 6.5 6.1 5.9 5.9 5.8 5.6 5.6
Sources: IMF, African Department database; World Economic Outlook; IMF staff estimates.
1 The estimates for 2010 refer to the annual change at end-Nov., with the beginning-of-period referring to end-Nov. 2009.
2 Excluding intra-regional trade.
3 Gross official reserves divided by short term domestic liabilities (IMF definition). For 2010, the estimate refers to end-Nov.
(Percent of GDP, unless otherwise indicated)
Table 1. WAEMU: Selected Economic and Financial Indicators, 2007—2015
(Annual percentage change)
(Percent of GDP)
(Annual changes in percent of beginning-of-period broad money)
(Annual percentage change)

26
2007 2008 2009 2010 2011 2012 2013 2014 2015Est. Proj. Proj. Proj. Proj. Proj.
Real GDP WAEMU 3.4 4.1 3.0 4.0 4.3 5.5 5.1 5.3 5.4
CEMAC 1
5.9 4.0 2.6 4.1 5.3 3.9 3.6 3.8 3.8
Sub-Saharan Africa 2
7.0 5.6 2.5 4.9 5.5 5.7 5.7 5.5 5.4
Inflation (annual averages) WAEMU 2.0 7.9 1.0 1.3 3.1 2.4 2.4 2.4 2.3
CEMAC 1
1.0 5.7 4.8 2.7 3.9 3.9 3.6 3.4 3.4
Sub-Saharan Africa 2
6.8 11.7 10.4 7.5 7.0 6.3 5.9 5.7 5.5
Gross national investment WAEMU 18.4 19.8 18.7 20.0 20.0 20.3 20.5 21.1 21.8
CEMAC 1
23.2 21.1 27.2 23.8 24.1 21.4 21.8 21.4 21.2
Sub-Saharan Africa 2
21.9 22.8 22.8 23.8 23.1 22.5 22.3 22.0 22.0
Overall fiscal balance, incl. grants WAEMU -2.2 -2.0 -3.5 -3.1 -3.2 -3.0 -2.6 -2.2 -1.9
CEMAC 1
8.9 10.1 -0.2 3.0 4.9 5.2 4.9 4.8 4.2
Sub-Saharan Africa 2
0.9 0.8 -5.7 -4.4 -3.3 -2.0 -1.2 -0.7 -0.4
External current account, incl. grants WAEMU -6.3 -7.1 -3.5 -5.5 -5.0 -5.0 -4.7 -4.7 -5.0
CEMAC 1
3.4 6.1 -7.0 -4.7 -0.8 0.1 -0.9 -1.3 -1.9
Sub-Saharan Africa 2
1.2 -0.1 -1.6 -1.0 -1.8 -1.4 -1.5 -1.3 -1.7
External public debt WAEMU 39.7 33.8 36.0 35.0 34.5 30.9 30.2 29.9 29.6
CEMAC 1
21.4 12.6 12.9 6.5 6.1 6.3 6.7 7.0 7.2
Sub-Saharan Africa 2
12.0 10.9 11.9 9.6 10.2 10.2 10.3 10.3 10.1
Foreign reserves cover ratio 3
WAEMU 103.5 96.8 98.9 102.1 ... ... ... ... ...
CEMAC 1
97.9 103.2 104.5 94.5 ... ... ... ... ...
Sources: IMF, African Department database; and staff estimates.
1 Central African Economic and Monetary Community (CEMAC).
2 Including Nigeria and South Africa.
3 Gross official reserves divided by (base money plus government deposits).
(Annual percentage change)
(Percent of GDP, unless otherwise indicated)
Table 2. Sub-Saharan Africa: Cross-Group Comparison, 2007—2015

27
Table 3. WAEMU: Main Features of WAEMU Economies in 2009 1
Burkina Côte Guinea- WAEMUBenin Faso d'Ivoire Bissau Mali Niger Senegal Togo Total
Population (millions) 8.9 15.8 21.1 1.6 13.0 15.3 12.5 6.6 94.8Land area (thousands of sq.km., 2008) 110.6 273.6 318.0 28.1 1220.2 1266.7 192.5 54.4 3464.2GNP (billions of U.S. dollars) 6.7 8.0 22.5 0.8 8.9 5.2 13.1 2.9 68.1GNP per capita (current U.S. dollars) 750 510 1070 510 680 340 1040 440 668
Agriculture, value added (percent of GDP; 2005) 2
32.2 34.1 22.8 54.9 36.6 40.0 16.7 43.7 35.1
Industry, value added (percent of GDP; 2005) 2
13.4 22.7 25.9 14.3 24.2 17.3 23.8 24.0 20.7
Services, etc. value added (percent of GDP; 2005) 2
54.4 43.2 51.3 30.8 39.3 42.7 59.5 32.4 44.2
Exports of goods (billions of U.S. dollars) 0.7 0.9 10.5 0.1 2.0 0.9 1.9 0.8 17.8Imports of goods (billions of U.S. dollars) 1.5 1.3 6.3 0.2 2.3 1.6 4.4 1.2 18.7
Intraregional trade 3
Exports (in percent of total) 15.7 7.1 10.0 2.0 6.6 0.9 28.0 36.8 13.2 Import (in percent of total) 3.6 32.0 1.1 17.5 23.7 11.1 3.3 5.7 8.0
Share of individual countries (in percent) 4
In GNP 9.9 11.8 33.1 1.2 13.0 7.6 19.2 4.2 100.0 In exports 4.2 4.8 59.1 0.6 11.2 4.9 10.7 4.7 100.0 In imports 7.9 7.1 33.7 1.0 12.1 8.6 23.3 6.5 100.0 In net domestic assets 7.1 6.4 31.0 0.2 5.3 3.6 18.0 4.9 76.5 In net foreign assets 12.8 11.2 22.9 1.6 14.6 3.9 17.0 4.8 88.7
Sources: World Bank, World Development Report ; IMF, Direction of Trade Statistics ; and staff estimates.
1 Unless otherwise indicated.
2 Data shown for Niger is from 2003.
3 Exports to and imports from WAEMU countries in percent of total exports and imports.
4 Totals may not add up to 100 because of statistical discrepancy.

28
2007 2008 2009 2010 2011 2012 2013 2014 2015Est. Proj. Proj. Proj. Proj. Proj.
Real GDP Benin 4.6 5.0 2.7 2.5 3.4 4.3 4.8 5.0 5.0 Burkina Faso 3.6 5.2 3.2 5.2 5.5 5.6 6.2 6.5 6.5 Côte d'Ivoire 1.6 2.3 3.8 3.0 2.8 4.0 4.9 5.5 6.0 Guinea-Bissau 3.2 3.2 3.0 3.5 4.3 4.5 4.7 4.7 4.7 Mali 4.3 5.0 4.5 4.5 6.0 5.4 4.8 4.9 5.0 Niger 3.4 8.7 -0.9 7.5 5.5 14.7 5.3 5.7 4.3 Senegal 5.0 3.2 2.2 4.0 4.4 4.7 4.8 4.9 5.0 Togo 2.3 2.4 3.2 3.4 3.7 4.0 4.1 3.9 4.0 WAEMU 3.4 4.1 3.0 4.0 4.3 5.5 5.1 5.3 5.4
Real GDP per capita Benin 1.8 2.2 -0.1 -0.3 0.6 1.4 2.0 2.1 2.1 Burkina Faso 1.2 2.8 0.9 2.8 3.1 3.2 3.8 4.1 4.1 Côte d'Ivoire -1.4 -0.7 0.7 0.0 -0.2 1.0 1.8 2.4 2.9 Guinea-Bissau 0.9 1.0 0.8 1.2 2.1 2.3 2.5 2.4 1.6 Mali 1.9 2.5 2.0 1.4 2.9 2.3 1.8 1.8 1.9 Niger 0.3 5.4 -3.8 4.3 2.3 11.3 2.1 2.5 1.1 Senegal 2.5 0.8 -0.2 1.6 2.0 2.2 2.4 2.4 2.6 Togo -0.2 -0.1 0.7 0.8 1.2 1.4 1.6 1.4 1.4 WAEMU 0.7 1.4 0.3 1.3 1.5 2.7 2.3 2.5 2.6
Inflation Benin 1.3 8.0 2.2 2.6 2.8 2.8 2.8 2.8 2.8 Burkina Faso -0.2 10.7 2.6 0.4 2.0 2.0 2.0 2.0 2.0 Côte d'Ivoire 1.9 6.3 1.0 1.4 2.5 2.5 2.5 2.5 2.5 Guinea-Bissau 4.6 10.4 -1.6 1.1 4.0 2.0 2.0 2.0 2.0 Mali 1.5 9.1 2.2 1.2 5.5 2.7 2.7 2.8 2.7 Niger 0.1 10.5 1.1 0.9 2.5 2.0 2.0 2.0 2.0 Senegal 5.9 5.8 -1.7 1.2 3.5 2.1 2.1 2.1 2.1 Togo 0.9 8.7 1.9 3.0 3.5 2.7 2.9 2.5 2.2 WAEMU 2.4 7.4 0.4 1.4 3.1 2.4 2.4 2.4 2.3
Gross national savings Benin 10.4 12.0 14.4 11.7 14.1 13.7 14.9 15.1 15.9 Burkina Faso 11.3 9.2 13.2 17.5 17.9 15.2 14.8 14.5 13.9 Côte d'Ivoire 8.0 12.1 17.6 15.6 12.5 13.7 14.5 15.5 15.7 Guinea-Bissau 7.3 3.9 4.1 3.7 3.5 6.6 7.2 8.2 9.6 Mali 10.0 4.4 10.1 8.5 11.7 12.1 12.7 13.6 14.6 Niger 14.6 19.3 4.3 16.3 16.6 18.6 20.0 20.7 21.2 Senegal 22.2 19.8 20.2 20.8 20.8 21.0 21.0 21.6 22.2 Togo 6.2 10.8 10.9 8.9 13.1 14.1 14.0 14.1 14.2 WAEMU 12.0 12.7 15.2 14.5 15.0 15.3 15.9 16.5 16.8
Gross domestic investment Benin 20.5 20.0 23.3 18.7 20.3 20.2 21.1 20.8 21.3 Burkina Faso 19.6 20.9 17.8 23.4 23.1 22.2 22.0 21.8 21.0 Côte d'Ivoire 8.7 10.1 10.2 9.5 8.6 10.6 13.0 15.1 16.7 Guinea-Bissau 11.7 8.7 10.1 9.8 10.4 11.0 11.3 11.8 12.0 Mali 16.9 17.2 17.6 17.0 19.3 20.0 20.7 21.7 23.1 Niger 22.8 32.3 33.0 47.0 38.8 32.4 26.5 24.0 24.2 Senegal 34.0 34.1 27.9 29.1 31.0 31.2 30.4 30.7 30.9 Togo 14.6 17.3 18.0 16.7 20.1 20.5 20.2 20.1 20.2 WAEMU 18.4 19.8 18.7 20.0 20.0 20.3 20.5 21.1 21.8
Sources: IMF, African Department database; and staff estimates.
(Percent of GDP)
Table 4. WAEMU: Selected National Accounts and Inflation Statistics, 2007—2015
(Annual percentage change)

29
2007 2008 2009 2010 2011 2012 2013 2014 2015Est. Proj. Proj. Proj. Proj. Proj.
Primary fiscal balance Benin 1.8 -1.4 -3.8 -1.0 -1.0 -0.7 -0.1 0.4 0.6 Burkina Faso -5.3 -4.1 -4.3 -4.3 -3.0 -3.0 -2.9 -1.1 -0.8 Côte d'Ivoire 1.0 1.2 0.0 -0.3 -0.3 -0.2 -0.1 -0.1 -0.2 Guinea-Bissau -5.3 -3.5 2.8 -1.9 -2.5 -0.6 -0.4 -0.4 -0.4 Mali -2.8 -1.9 -3.9 -3.1 -4.2 -3.1 -2.7 -2.7 -2.5 Niger -0.7 1.7 -5.1 -2.8 -1.7 -1.2 -0.7 0.0 2.5 Senegal -3.3 -4.2 -4.3 -3.8 -4.5 -3.9 -2.5 -2.2 -2.3 Togo 0.2 -0.1 -1.9 -1.8 -1.9 -1.8 -1.8 -1.8 -1.9 WAEMU -1.2 -1.1 -2.6 -2.2 -2.2 -1.8 -1.4 -1.0 -0.7
Overall fiscal balance (including grants) Benin 0.2 -1.7 -4.2 -1.6 -1.9 -1.7 -1.1 -0.4 -0.2 Burkina Faso -5.7 -4.5 -4.7 -4.8 -3.5 -3.5 -3.4 -1.6 -1.3 Côte d'Ivoire -0.8 -0.6 -1.6 -2.0 -1.8 -2.1 -2.2 -2.2 -2.3
Guinea-Bissau -3.6 -1.3 2.7 -1.7 -2.7 -0.8 -0.9 -0.9 -0.8 Mali -3.2 -2.2 -4.2 -3.6 -4.7 -3.5 -3.1 -3.0 -2.8 Niger -1.0 1.5 -5.3 -3.1 -2.0 -1.6 -1.1 -0.5 2.0 Senegal -3.7 -4.6 -4.9 -4.8 -5.8 -5.3 -3.9 -3.7 -3.7
Togo -1.9 -0.9 -2.8 -2.8 -2.7 -2.4 -2.2 -2.2 -2.2 WAEMU -2.2 -2.0 -3.5 -3.1 -3.2 -3.0 -2.6 -2.2 -1.9
Government revenue (commitment basis, excluding grants) Benin 20.6 19.4 18.4 18.4 18.7 19.1 19.6 19.8 20.0 Burkina Faso 13.5 13.1 13.5 15.6 16.3 16.5 17.3 17.9 18.6 Côte d'Ivoire 19.2 18.9 18.9 19.7 19.6 20.1 20.3 20.4 20.5 Guinea-Bissau 8.0 9.2 9.0 10.8 10.6 10.7 10.9 10.9 11.0 Mali 16.6 15.5 17.1 17.0 15.9 16.8 17.2 17.4 17.5 Niger 15.0 18.4 14.6 13.6 14.8 14.8 15.5 16.6 19.8 Senegal 21.1 19.4 18.6 19.7 19.9 20.1 20.2 20.4 20.6 Togo 16.8 15.6 16.9 17.1 19.2 18.4 18.5 18.5 18.5 WAEMU 18.2 17.6 17.4 18.0 18.1 18.5 18.8 19.1 19.6
Government expenditure Benin 23.4 22.9 25.8 21.4 23.0 22.8 22.6 22.2 22.0 Burkina Faso 25.7 21.6 24.1 26.7 25.4 25.6 26.0 26.0 25.0 Côte d'Ivoire 20.5 21.1 21.1 22.0 21.4 22.2 22.6 22.7 22.9 Guinea-Bissau 23.2 22.7 23.2 22.5 20.8 22.0 22.3 22.3 22.2 Mali 24.5 21.2 25.9 24.2 25.3 24.6 24.3 24.4 24.4 Niger 23.1 22.8 24.4 23.3 22.6 22.3 22.3 22.7 23.3 Senegal 27.6 26.5 26.7 26.9 28.0 27.7 26.3 26.4 26.6 Togo 20.4 17.9 21.3 22.3 25.2 25.1 24.9 24.9 24.8 WAEMU 23.5 22.4 23.9 23.8 24.0 24.1 24.0 24.0 24.1
Government current expenditure Benin 15.9 15.5 15.8 15.4 16.3 16.6 16.4 16.3 16.1 Burkina Faso 12.8 12.2 11.9 12.3 12.5 12.5 12.6 12.6 12.7 Côte d'Ivoire 17.6 17.9 17.9 18.8 18.7 18.6 18.2 17.8 17.9 Guinea-Bissau 14.8 13.9 12.8 11.8 11.8 11.8 12.1 12.1 12.0 Mali 12.8 11.7 13.0 13.4 13.4 13.3 13.3 13.4 13.5 Niger 11.6 12.5 12.0 12.9 12.2 10.4 10.5 10.6 10.8 Senegal 16.3 16.5 16.6 15.9 16.0 15.8 15.5 15.5 15.3 Togo 18.4 14.7 15.8 15.6 15.4 15.1 15.3 15.3 15.2 WAEMU 15.6 15.4 15.5 15.7 15.7 15.5 15.3 15.2 15.2
Government capital expenditure 1
Benin 7.5 5.8 9.6 5.4 6.7 6.2 6.2 6.0 5.9 Burkina Faso 12.8 9.1 12.1 12.9 12.8 13.0 13.3 13.4 12.3 Côte d'Ivoire 2.6 3.0 3.1 3.0 2.7 3.5 4.3 4.7 4.9 Guinea-Bissau 7.3 7.2 9.2 8.8 8.6 9.9 9.9 9.9 9.9 Mali 11.4 7.5 10.8 8.7 10.3 9.9 9.6 9.7 9.5 Niger 11.5 10.3 12.4 10.4 9.7 11.3 11.8 12.1 12.6 Senegal 11.2 10.0 10.1 10.8 11.8 11.9 10.8 10.9 11.3 Togo 2.0 3.2 5.5 6.7 9.8 10.0 9.6 9.6 9.6 WAEMU 7.7 6.5 8.0 7.5 8.0 8.4 8.5 8.6 8.6
Sources: IMF, African Department database; and staff estimates.1 Excludes net lending.
Table 5. WAEMU: Fiscal Balances, 2007—2015
(Percent of GDP)

30
2007 2008 2009 2010 2011 2012 2013 2014 2015Est. Proj. Proj. Proj. Proj. Proj.
Exports of goods and services Benin 16.8 17.6 16.5 16.5 17.1 17.1 17.0 17.1 17.2 Burkina Faso 10.5 9.8 11.8 15.9 21.7 20.2 19.9 19.3 20.1 Côte d'Ivoire 47.8 48.7 50.9 54.2 56.5 56.2 54.3 53.3 52.1 Guinea-Bissau 16.8 15.5 15.4 17.7 18.4 17.8 17.8 17.8 17.8 Mali 27.4 28.7 26.6 25.1 31.9 30.8 29.0 27.8 26.2 Niger 17.4 19.4 18.9 19.3 20.9 23.9 24.9 29.6 32.9 Senegal 25.5 26.3 24.1 24.5 25.7 25.5 25.3 25.2 25.3 Togo 36.5 33.8 34.4 34.0 33.8 34.1 33.8 33.5 33.2 WAEMU 26.4 27.0 27.3 26.6 30.5 30.2 29.4 29.2 29.0
Imports of goods and services Benin 32.4 30.9 29.7 28.1 28.0 27.8 27.4 27.0 26.7 Burkina Faso 24.7 26.5 22.5 27.0 31.3 32.1 31.4 30.4 29.3 Côte d'Ivoire 41.9 41.2 38.9 41.0 45.3 46.1 45.9 46.1 46.5 Guinea-Bissau 35.5 31.1 29.1 28.6 28.6 27.3 26.3 25.3 24.2 Mali 35.6 43.0 34.6 34.1 37.6 36.9 34.8 33.9 33.2 Niger 29.9 36.3 49.5 57.1 47.5 37.0 31.8 31.0 32.9 Senegal 47.8 52.8 44.1 44.1 46.4 45.5 43.9 43.5 42.9 Togo 55.2 49.9 49.1 51.2 51.5 51.7 51.0 50.8 50.5 WAEMU 35.0 36.7 33.3 34.4 36.7 35.9 34.6 34.2 34.2
External current account (excl. grants) Benin -12.9 -11.0 -12.7 -9.5 -8.9 -8.7 -8.5 -7.9 -7.5 Burkina Faso -12.5 -15.1 -8.9 -9.9 -8.5 -11.0 -10.6 -10.3 -8.5 Côte d'Ivoire -1.5 0.8 5.2 5.9 4.1 3.2 1.7 0.6 -0.9 Guinea-Bissau -9.5 -11.3 -14.0 -9.7 -9.8 -9.1 -8.9 -8.4 -7.9 Mali -8.7 -13.9 -8.8 -9.7 -8.6 -8.8 -9.0 -9.1 -9.5 Niger -10.4 -15.2 -29.8 -37.2 -25.4 -16.1 -8.6 -5.3 -5.0 Senegal -12.8 -14.8 -8.4 -8.7 -10.6 -10.6 -9.8 -9.6 -9.2 Togo -10.2 -8.0 -8.6 -10.3 -10.4 -10.7 -10.5 -10.2 -10.1 WAEMU -8.0 -8.6 -5.4 -7.1 -6.3 -6.3 -5.9 -5.9 -6.0
External current account (incl. grants) Benin -10.1 -8.0 -8.9 -7.0 -6.2 -6.5 -6.2 -5.7 -5.4 Burkina Faso -8.2 -11.7 -4.5 -5.9 -5.1 -7.0 -7.2 -7.3 -7.1 Côte d'Ivoire -0.7 1.9 7.4 6.1 3.9 3.1 1.5 0.4 -1.1 Guinea-Bissau -4.4 -4.9 -6.0 -6.2 -7.0 -4.4 -4.2 -3.7 -2.4 Mali -6.9 -12.7 -7.5 -8.5 -7.6 -7.8 -8.0 -8.1 -8.5 Niger -8.2 -13.0 -28.7 -30.7 -22.2 -13.8 -6.5 -3.2 -3.0 Senegal -11.8 -14.3 -7.7 -8.2 -10.2 -10.2 -9.3 -9.1 -8.7 Togo -8.5 -6.6 -7.1 -7.8 -7.1 -6.4 -6.2 -6.0 -6.0 WAEMU -6.3 -7.1 -3.5 -5.5 -5.0 -5.0 -4.7 -4.7 -5.0
Sources: IMF, African Department database; and staff estimates.
Table 6. WAEMU: External Balances, 2007—2015
(Percent of GDP)

31
2007 2008 2009 2010 2011 2012 2013 2014 2015Est. Proj. Proj. Proj. Proj. Proj.
External DebtBenin 12.6 15.5 17.1 19.1 18.8 18.4 18.0 17.7 17.6Burkina Faso 19.7 19.7 23.7 28.1 29.5 31.0 32.2 32.2 31.6Côte d'Ivoire 64.8 61.9 54.4 54.7 52.7 41.1 39.0 36.6 34.4Guinea-Bissau 149.1 122.8 127.8 20.0 21.4 21.8 21.5 20.2 19.3Mali 18.7 18.9 20.7 29.0 26.4 24.4 22.3 23.2 24.2Niger 15.9 13.9 15.8 17.6 19.2 18.9 19.9 20.7 21.7Senegal 17.9 19.7 27.0 30.4 31.9 33.7 34.0 35.3 36.5Togo 86.4 55.9 55.6 16.8 16.9 17.4 17.9 18.1 18.3 WAEMU 39.7 33.8 36.0 35.0 34.5 30.9 30.2 29.9 29.6
Domestic DebtBenin 9.2 10.0 11.7 11.7 12.6 11.8 10.6 9.5 8.1Burkina Faso 3.4 2.6 4.1 3.2 2.4 1.6 1.1 0.6 0.3Côte d'Ivoire 10.8 13.4 12.6 12.0 11.8 11.8 11.8 11.8 11.9Guinea-Bissau 38.4 34.8 36.0 29.9 27.2 25.1 22.7 20.5 18.5Mali 2.3 2.5 3.0 3.7 3.7 3.1 2.7 2.3 2.1Niger 8.9 7.0 8.1 6.7 5.6 4.3 3.4 2.6 1.9Senegal 6.6 5.3 7.6 8.4 10.3 11.1 11.9 11.2 10.7Togo 19.3 22.2 15.2 14.1 10.5 7.0 5.3 3.7 2.4 WAEMU 8.5 9.1 9.4 9.0 8.9 8.5 8.2 7.7 7.3
Total DebtBenin 21.8 25.5 28.9 30.8 31.3 30.2 28.7 27.1 25.7Burkina Faso 23.1 22.3 27.8 31.4 31.9 32.7 33.3 32.8 32.0Côte d'Ivoire 75.6 75.3 67.0 66.7 64.4 53.0 50.8 48.4 46.2Guinea-Bissau 187.5 157.6 163.8 50.0 48.6 46.8 44.2 40.7 37.7Mali 21.0 21.4 23.7 32.6 30.0 27.5 25.0 25.5 26.3Niger 24.8 20.9 23.9 24.3 24.8 23.3 23.4 23.3 23.6Senegal 24.5 25.0 34.6 38.8 42.2 44.8 45.8 46.5 47.2Togo 105.8 78.1 70.8 30.8 27.4 24.4 23.2 21.9 20.8 WAEMU 48.2 42.9 45.4 44.1 43.4 39.4 38.5 37.6 36.9
Source: IMF, African Department database.
Table 7. WAEMU: Government Debt, 2007—2015
(Percent of GDP)

32
2007 2008 2009 2009 2009 2009 2010 2010 2010Dec. Dec. Mar. Jun. Sep. Dec. Mar. Jun. Sep.
Net foreign assets 4,522 4,536 4,403 4,342 4,367 5,061 5,047 5,188 4,980
Net domestic assets 3,780 4,484 4,575 4,879 4,964 5,287 5,260 5,670 6,050
Domestic credit 5,337 6,080 6,252 6,468 6,681 7,193 7,218 7,450 7,987 Net credit to government 431 453 648 797 841 1,077 1,439 1,402 1,625 Net credit to the economy 4,905 5,627 5,604 5,670 5,840 6,116 5,779 6,049 6,362 Claims on private sector 4,904 5,626 5,603 5,668 5,839 6,114 5,778 6,046 6,357 Claims on other financial institutions 1 1 1 2 1 2 2 3 5
Other items, net 1,557 1,596 1,676 1,589 1,717 1,906 1,959 1,781 1,937
Broad Money 8,301 9,020 8,979 9,221 9,331 10,348 10,306 10,858 11,030 Money 5,596 5,989 5,831 5,929 5,963 6,741 6,677 6,947 6,933 of which: Currency in circulation 2,157 2,776 2,659 2,575 2,569 3,118 2,967 2,992 2,971 Quasi-money 2,705 3,031 3,148 3,292 3,368 3,607 3,629 3,911 4,097
Net foreign assets 18.6 0.3 3.7 -0.4 1.0 11.6 14.6 19.5 14.0
Net domestic assets 19.4 18.6 15.1 23.9 20.4 17.9 15.0 16.2 21.9
Domestic credit 13.5 13.9 15.1 17.7 16.1 18.3 15.5 15.2 19.5 Net credit to government -5.3 5.0 30.8 122.7 148.8 137.7 122.2 75.8 93.2 Net credit to the economy 15.5 14.7 13.5 10.4 7.8 8.7 3.1 6.7 8.9 Claims on private sector 15.5 14.7 13.5 10.4 7.8 8.7 3.1 6.7 8.9 Claims on other financial institutions 0.0 0.0 -33.6 31.1 31.8 60.6 57.6 55.0 294.5 Other items, net 1.3 2.5 15.1 2.0 5.2 19.4 16.8 12.1 12.8
Broad Money 19.0 8.7 9.2 11.1 10.5 14.7 14.8 17.7 18.2
Source: IMF, International Financial Statistics .
Table 8. WAEMU: Monetary Survey , December 2007—September 2010
(Billions of CFA francs)
(Year on year percent change)

33
2005 2006 2007 2008 2009 2010 2010Dec. Dec. Dec. Dec. Dec. June Sep.
Capital adequacy Regulatory capital to risk-weighted assets 9.2 8.4 6.8 9.8 10.2 11.0 … Tier 1 capital to risk-weighted assets 8.8 8.0 6.0 9.4 9.8 10.6 … Provisions to risks-weighted assets 15.0 14.2 12.8 12.2 11.0 12.9 … Capital to total assets 5.8 5.5 4.3 6.1 6.2 6.4 …Asset composition and quality Total loans to total assets 63.4 61.9 59.1 59.4 57.6 54.4 56.7 Concentration: loans to 5 largest borrowers to capital 175.1 173.8 212.0 135.6 135.6 135.6 135.6 Gross NPLs to total loans 19.9 20.5 18.9 19.2 17.2 18.8 17.7 Provisions to NPLs 66.9 66.2 65.7 68.1 61.5 64.4 65.9 NPLs net of provisions to total loans 7.6 8.0 7.4 7.1 7.4 7.6 7.7 NPLs net of provisions to capital 82.7 91.2 90.9 69.0 68.5 65.1 65.1Earnings and profitability
Average cost of borrowed funds 2.1 2.2 2.4 2.6 2.5 … … Average interest rate on loans 9.7 8.8 9.9 10.6 10.1 … …
Average interest margin 1
7.6 6.6 7.5 8.0 7.6 … … Noninterest expenses to net banking income 57.9 60.8 62.6 60.9 63.8 … … Salaries and wages to net banking income 26.5 27.8 27.6 26.5 27.1 … …Liquidity Liquid assets to total assets … … … … … … … Liquid assets to total deposits … … … … … … … Total loans to total deposits 83.8 82.4 78.9 81.8 78.5 74.8 75.1 Total deposits to total liabilities 75.7 75.2 74.9 72.7 73.4 72.7 75.5
Sight deposits to total liabilities 2
38.2 37.9 38.4 36.9 36.1 36.4 36.4Term deposits tot total liabilities 37.6 37.3 36.5 35.8 37.3 38.1 38.4
Source: BCEAO.1 This excludes the tax on banking operations.
2 This includes savings deposits.
Table 9. WAEMU: Financial Soundness Indicators for the Banking Sector, 2005–2010(Percent, unless otherwise indicated)

34
Appendix I: The Quality of Growth in the WAEMU1
This appendix analyzes the quality of growth in WAEMU countries, extending recent staff analysis that compared more generally the growth performance and growth determinants in WAEMU countries with high-growth non-oil exporters in sub-Saharan Africa (SSA).2 Results suggest that the quality of growth, as in the rest of sub-Saharan Africa, has improved. In some WAEMU countries growth translated into substantially better social indicators, though still lagging those in the best-performing countries in SSA. Higher high-quality growth is needed to close the gap. Good quality growth can be defined as growth that is stable and broad based and that leads to socially desirable outcomes, such as improved standards of living, especially lower poverty (Martinez and Mlachila, 2011). While real GDP growth in the WAEMU has picked up in the past 15 years, it has been close to 2 percentage points per year lower than in high-growth non-oil exporting SSA countries. At the same time total factor productivity growth remained lackluster. This note focuses on three aspects of quality of growth: the stability of growth, its nature, and its impact on socially desirable outcomes, such as improvements in health, education, and poverty indicators.
A. Background: Total Factor Productivity
A simple growth accounting exercise confirms poor productivity performance of the WAEMU. Based on data from Arezki and Cherif (2010), WAEMU countries in general had poor TFP growth and improved only slightly during the last 15 years (Table 1). Growth in capital per worker also remained lackluster. On the other hand, growth in both TFP and capital was higher in high-growth non-oil exporters. The empirical evidence from the literature shows that growth can be sustained only if accompanied by relatively high productivity growth.
Table 1. Growth Accounting, 1980–2007
Growth in Capital per Worker
Growth in TFP
Growth in Capital per Worker
Growth in TFP
High-growth non-oil exporters 2.9 0.7 2.8 3.4
WAEMU 0.4* -0.6* 0.7* 0.2*Of which: faster growing 1.0* 0.1* 1.7* 1.7*
(Percent change)
1980–94 1995–2007
Sources: Arezki and Cherif (2010); and IMF staff estimates.
Note: *indicates that the WAEMU average differed from that of SSA high-growth non-oil exporters at the 10 percent significance level.
1 Prepared by Montie Mlachila.
2 See IMF, 2010, “The Quest for Higher Growth in the West African Economic and Monetary Union (WAEMU) and Implications for Fiscal Policy,” Regional Economic Outlook: Sub-Saharan Africa (Washington, October). High-growth non-oil exporters in sub-Saharan Africa are countries with an average per capita growth rate of at least 3 percent during 1995–2009. The countries are Botswana, Cape Verde, Ethiopia, Mauritius, Mozambique, Rwanda, Tanzania, and Uganda.

35
B. Stability of Growth
Growth has become more stable, as evidenced by a general decline in volatility of growth in sub-Saharan African countries since the mid-1990s (Figure 1). This at least in part reflects an improvement in macroeconomic policy implementation, which increased the policy space, especially on the fiscal front, for countries to react more easily to shocks. While the WAEMU had somewhat higher growth volatility compared to SSA high-growth non-oil exporting countries before 2005, in more recent years, this has diminished considerably and is now at par with the latter group.
Figure 1. Volatility of Growth, 1980—2008(standard deviation)
Source: Martinez and Mlachila (2011)
0
1
2
3
4
5
6
7
1980-84 1985-89 1990-94 1995-99 2000-04 2005-08
WAEMUHigh-growth countriesAll countries
C. Nature of Growth
The nature of growth, whether it is broad-based or not, matters. Broad-based growth is likely to benefit a larger share of the population. In this regard, the sectoral composition of growth may serve as one proxy to assess the nature of growth. Also, if growth is broad based, it is likely to be more stable. If most of the population is rural, high agricultural growth is likely to lead to an increase in rural incomes. At the same time, rain-fed agriculture, especially in the Sahel, is particularly vulnerable to droughts. In general, WAEMU countries have a narrower base of growth compared to high-growth SSA countries. In the latter, services and industry to some extent, have become the main drivers of growth, while in the WAEMU agriculture is still relatively important (Figure 2).
, p , p , , q , , , g
Figure 2. Sectoral Composition of Growth, 1980—2008(in percent)
Source: Martinez and Mlachila (2001).
-10
-5
0
5
10
15Agr IndServ Total
-1
0
1
2
3
4
5
6
7
8
Agr IndServ Total
WAEMU High-Growth SSA Countries 1/
1/ Botswana, Cape Verde, Ethiopia, Mauritius, Mozambique, Rwanda, Tanzania, and Uganda

36
D. Social Indicators
In principle, the improvement of per capita growth should increase the resources available for social spending and increase incomes of the population. In practice, improvement in growth may not necessarily be accompanied by socially desirable outcomes for several reasons. First, while social spending may increase, it may not be effective because of institutional weaknesses. Second, a number of social indicators such as life expectancy and infant mortality are “slow moving” and are partly driven by exogenous factors such as medical advances and external aid. Finally, increases in per capita income may not necessarily translate into poverty reduction, depending on income inequality and the sources of the GDP growth (Kraay, 2006). Given the paucity of data on social indicators, especially income poverty, it is difficult to conduct rigorous assessments. Nonetheless, a number of stylized facts emerge. First, there has been a trend improvement in social indicators in all of SSA, especially over the past 15 years, although the improvements vary from country to country.3 Second, the biggest improvements have been recorded in primary school enrollment ratios and reduction of infant mortality. Third, progress in headcount poverty measurements has been relatively slow according to official statistics. In almost all social indicators, the WAEMU region lags both SSA and high-growth countries (Figures 3 and 4). This is particularly the case in secondary education, where less than 30 percent of eligible students are enrolled. Nonetheless, a number of WAEMU countries have been among the best performers in SSA in terms of improvements. For instance, Burkina Faso, Mali, and Senegal are among the top ten SSA countries with the most significant improvements in infant mortality rates. On average these countries saw a reduction of the order of 25 percent during 1995–2008 compared to the previous 15 years. Benin is among the top 10 SSA performers in improvements in both primary and secondary school enrollment ratios. For instance, primary school enrollment reached an average of over 96 percent during the past 15 years compared to only 58 percent during the previous 15. That said, in terms of levels, WAEMU countries, especially Guinea Bissau, Togo, and Niger, still have a long way to go.
E. Conclusion
Broadly speaking, while the quality of growth in the WAEMU—like in the rest of SSA—has improved, it has significantly lagged the rest of SSA, especially when compared to high-growth SSA countries. The fundamentals of growth have all improved relative to the previous 15 years: growth is stronger, less volatile, accompanied by productivity improvements, and more broad-based. There are also indications that most social indicators are going in the right direction, albeit from a low starting point, but there is considerable heterogeneity among countries
3 See, for instance, Sala-i-Martin and Pinkovskiy (2010) and Young (2009) who suggest that social indicators in Africa, and poverty more generally, are falling much faster than official indicators show. Young, for instance, argues that real household consumption in sub-Saharan Africa is actually growing at about 3.3 percent per annum, compared with around 1 percent using official numbers.

37
Figure 3. School Enrollment Ratios, 1980—2008
(in percent of eligible students)
0
20
40
60
80
100
120
1980-84 1985-89 1990-94 1995-99 2000-04 2005-08
WAEMUHigh-growth countriesAll Countries
0
5
10
15
20
25
30
35
40
45
1980-84 1985-89 1990-94 1995-99 2000-04 2005-08
WAEMUHigh-growth countriesAll countries
Primary School` Secondary School
Figure 4. Infant Mortality, 1980—2008(per 1000 children born)
0
50
100
150
200
250
1980-84 1985-89 1990-94 1995-99 2000-04 2005-08
WAEMUHigh-growth countriesAll countries
. A number of WAEMU countries such as Benin, Burkina Faso, Mali, and Senegal have recorded fairly strong relative improvements in social indicators. These are also countries that recorded relatively high growth. In other words, high growth is certainly good for social indicators. However, the actual social outcomes depend crucially on the intrinsic quality of growth (stability, composition) and on political will and quality of institutions to ensure that higher growth gets effectively translated into higher and good-quality social spending.
References Arezki, R., and R. Cheri, 2010, “Development Accounting and the Rise of TFP,” IMF Working
Paper 10/101 (Washington: International Monetary Fund).
International Monetary Fund, 2010, “The Quest for Higher Growth in the West African Economic and Monetary Union (WAEMU) and Implications for Fiscal Policy” in Sub-Saharan Africa Regional Economic Outlook, Fall, pp. 43–68.
Kraay, A. 2006, “When is Growth Pro-poor? Evidence from a Panel of Countries,” World Development, Vol. 80, No. 1, pp.198–227.
Martinez, M., and M. Mlachila, 2011, “The Quality of the Recent High-Growth Episode in Sub-Saharan Africa,” IMF Working Paper forthcoming (Washington: International Monetary Fund).

38
Ravallion, M., and S. Chen, 1997, “What Can New Survey Data Tell Us About Recent Changes in
Distribution and Poverty?” World Bank Economic Review, Vol. 11, No. 2, pp. 357–82.
Sala-i-Martin, X., and M. Pinkovskiy, 2010, “African Poverty is Falling … Much Faster Than You Think!” NBER Working Paper Series 15775 (Cambridge, Massachusetts: National Bureau of Economic Research).
Young, A., 2009, “The African Growth Miracle,” (London: London School of Economics). Available via the Internet: http://econ.as.nyu.edu/docs/IO/11950/AfricanGrowthMiracle.pdf

39
Appendix II. Petroleum Pricing Policies in WAEMU Countries1 Most WAEMU countries have adopted automatic adjustment pricing policies for petroleum products in principle, but in practice these policies have not been fully implemented. Only Guinea-Bissau and Mali continue to have a system where prices are adjusted on an ad hoc basis rather than following a prespecified mechanism based on international prices. Especially since the oil price shock starting in mid-2007, many countries that had automatic pricing schemes in principle, such as Benin, Burkina Faso, Côte d’Ivoire, Niger, and Togo suspended the full operation of their schemes to insulate domestic prices from international fluctuations in prices (Figure 1). Taxation levels for petroleum products differ across countries in the region, reflecting different policy approaches to pricing and government revenue needs. Retail prices in WAEMU countries are usually derived from formulas based on import costs, storage and distribution margins, and different types of taxes (excise, VAT, others). Typically, kerosene is less heavily taxed for social reasons. Taxes on petroleum products can be a significant source of fiscal revenue, as indicated in Table 1.
Persistent price disparities exist across countries within the WAEMU zone and with neighboring countries such as Nigeria and Ghana, which are likely to stimulate informal trade and arbitrage. Gasoline prices in Ghana and Nigeria were substantially lower than the WAEMU average of about CFAF 600 per liter. In 2010, for example, gasoline was about CFAF400 per liter in Ghana and just over CFAF 200 per liter in Nigeria. Smuggling and informal trade can lead to a fiscal revenue loss. Recent empirical work has confirmed the importance of cross-country spillovers stemming from differences in pricing policies (David, El-Harrak, Mills, Ocampos, 2010). It is also interesting to note that most countries that adopt ad hoc adjustment mechanisms, supposedly to increase the smoothing of international prices, did not experience lower volatility in prices, as measured by the coefficient of variation, in the period from January 2006 to October 2010 (see the last three panels of Figure 1). Benin, Niger, and Côte d’Ivoire, countries where automatic adjustment mechanisms have at times not been
1 This note was prepared by Antonio C. David and Mohamed El Harrak.
2008 2009 2010
Benin 2 0.1 0.2 0.3
Burkina Faso 0.7 0.7 0.7
Côte d'Ivoire 0.9 1.7 1.8
Guinea Bissau 0.6 0.8 0.7
Mali 3 0.9 0.5 0.5
Niger 4 0.8 0.9 0.9
Senegal 3.3 3.0 2.8
Togo n.a. n.a. n.a.1 Excises, import duties, and VAT.2 Only excises and import duties.3 Only excises.4 Only import duties.
Table 1. Petroleum Product Related Tax Revenue 1
(Percent of GDP)

40
0.04
0.050.06
0.080.09 0.10
0.130.14
0.00
0.02
0.04
0.06
0.08
0.10
0.12
0.14
0.16Coefficient of Variation for Gasoline Prices
0.04
0.060.07
0.09
0.120.13
0.14 0.14
0.00
0.02
0.04
0.06
0.08
0.10
0.12
0.14
0.16Coefficient of Variation for Diesel Prices
0.04 0.04
0.06
0.110.11 0.12
0.13
0.00
0.02
0.04
0.06
0.08
0.10
0.12
0.14
0.16Coefficient of Variation of Kerosene Prices
50
70
90
110
130
150
170
190
210Ja
n-0
6
May
-06
Sep
-06
Jan
-07
May
-07
Sep
-07
Jan
-08
May
-08
Sep
-08
Jan
-09
May
-09
Sep
-09
Jan
-10
May
-10
Sep
-10
Burkina FasoBeninTogoNigerInternational Price
Gasoline Retail Price Index
2006=100
50
70
90
110
130
150
170
190
210
Jan
-06
May
-06
Sep
-06
Jan
-07
May
-07
Sep
-07
Jan
-08
May
-08
Sep
-08
Jan
-09
May
-09
Sep
-09
Jan
-10
May
-10
Sep
-10
Mali
Côte d'Ivoire
Guinea-Bissau
Senegal
International Price
Gasoline Retail Price Index2006=100
590632
564607
508564
525558
433464
411454
0
100
200
300
400
500
600
700
2007 2008 2009 2010
Gasoline
Diesel
Kerosene
Average Retail Prices Across WAEMU Countries (CFAF/Liter)
Figure 1. WAEMU: Movements in Petroleum Product Prices, 2006–2010
Source: Country authorities, U.S. Energy Information Administration, and IMF staf f calculations. International prices refer to Rotterdam (ARA) conventional gasoline prices.

41
applied consistently, had the most volatile prices in the region for the three types of products considered. Partial pass-through of international price movements constitutes an implicit subsidy that is usually costly and poorly targeted. Although most countries in the region do not include direct subsidies to petroleum products in their pricing formulas (Niger is an exception with subsidies for gasoline and for kerosene), a nonadjustment of retail prices when prices in international markets rise can constitute a large and often unbudgeted “implicit” subsidy to the consumers of petroleum products. Staff estimates suggest that these implicit subsidies vary by type of product and country and can reach significant amounts (up to 3.2 percent of GDP during the oil price shock in 2008). While diesel and kerosene prices tend to be implicitly subsidized in most WAEMU countries, this is not the case for gasoline prices (Table 2). For example, estimates using data on consumption of petroleum products2 show gasoline subsidies ranging from 1.6 percent of GDP to -0.8 percent of GDP,3 depending on the country and year. Kerosene is implicitly subsidized in all WAEMU countries. The recent increase in international oil prices will pose fiscal risks to WAEMU countries if reform efforts on petroleum product pricing policies are not sustained. Countries such as Togo and Niger have recently implemented or announced new automatic adjustment mechanisms for petroleum product pricing, based in part on technical advice provided by IMF staff. But historical experience demonstrates that maintaining such policies can at times be politically difficult in an adverse environment. Using the assumptions above, it is possible to calculate implicit subsidies if international price developments are not passed through. For a hypothetical 10 percent increase in international prices for these products, the calculations suggest that compared to 2010 levels, tax-inclusive subsidies for the region as a whole would increase to 0.2 percent of GDP for diesel and 0.3 percent of GDP for kerosene and 0.1 percent of GDP for gasoline.
2 Data from the International Energy Agency (IEA) includes consumption of petroleum products by households and enterprises. 2008 is the latest year for which information was available for a large set of WAEMU countries. Consumption in 2009 and 2010 was inferred using real GDP growth rates for individual countries.
3 In this case, the estimates imply that taxation is actually above benchmark levels.
Gasoline
Range
Diesel
Range
Kerosene
Range
Table 2. WAEMU: Tax Inclusive Implicit Subsidies.(Percent of GDP)
201020092008
(-0.78, 0.85) (-0.59,1.56) (-0.52,1.2)
(-1.46,1.34)
-0.20 -0.15 -0.09
0.36 -0.30 -0.06
Source: IMF staff estimates based on information provided by country authorities. Estimates of tax-inclusive, implicit subsidies are based on the methodology proposed by Coady and others, 2010, assuming a benchmark tax rate of US$ 0.40 per liter. A positive number in the table implies a subsidy; a negative number implies that actual tax rates are above the assumed benchmark rate.
(0.02, 3.20)
(-0.63, 0.60) (-0.31, 0.43)
(0.02,1.31) (0.03, 1.14)
0.56 0.24 0.23

42
WAEMU countries would benefit from boosting efforts to promote some policy convergence in petroleum product pricing. The WAEMU commission could take a lead role in the dialogue of setting agreed general principles for price-setting mechanisms. One of the main objectives would be that countries (especially larger and oil-producing countries) internalize some of the spillovers of their own policies on their neighbors. Coordination in tax policy on petroleum products could also ensure that current differentials in retail price levels are not conducive to arbitrage. Nevertheless, while policy convergence is desirable, it is clear that differences in price levels across countries will persist to some degree, reflecting differences in geography (landlocked vs. coastal countries) and resource endowments (oil producers vs. oil importers). To protect vulnerable households, targeted compensatory measures to mitigate the impact of eventual price fluctuations on the poor should be explored. Generally, research suggests that well-targeted subsidies and compensatory measures are more effective at alleviating poverty than subsidies to petroleum products, which tend to be regressive and have high opportunity costs (Baig and others, 2007, and Coady and others, 2010). The effect of oil price increases on the poor also could be mitigated by more indirect policies such as additional investments in infrastructure and public transportation.
References Baig, T., and others, 2007, “Domestic Petroleum Product Prices and Subsidies: Recent
Developments and Reform Strategies,” IMF Working Paper 07/71, March (Washington, International Monetary Fund).
Coady, D., and others, 2010, “Petroleum Product Subsidies: Costly, Inequitable, and Rising,” IMF Staff Position Note SPN/10/05, February (Washington, International Monetary Fund).
David, A. C., M. El-Harrak., M. Mills, and L. Ocampos, 2010, “Oil Spill(over)s: Linkages in Petroleum Product Pricing Policies in West African Countries,” African Department, mimeo (Washington: International Monetary Fund).
IMF, 2010, “Adopting an Automatic Fuel Pricing Mechanism in Niger,” Fiscal Affairs Department, mimeo (Washington: International Monetary Fund).

43
Appendix III. Exchange Rate Assessment for the WAEMU1 This note updates the assessment of external stability from the 2009 regional consultation. Similar to the analysis at the time, the note uses the three approaches advocated by the IMF’s Consultative Group on Exchange Rate Issues (CGER): the equilibrium real effective exchange rate (EREER) approach, the macroeconomic balance (MB) approach, and the external sustainability (ES) approach. The 2009 assessment found that the real effective exchange rate (REER) was modestly overvalued in 2008. Since end-2008, the actual REER remained almost unchanged in 2009 and depreciated by some 6 percent in 2010, based on data as of October 2010. The updated assessment finds that the REER remains close its estimated equilibrium values. Table 1 summarizes the results. The MB approach and the ES approach, respectively, show the same results for 2009 and 2010 because they assume the same underlying current account and NFA for both years.
A. Exchange Rate Developments in the WAEMU: 1985Q1–2010Q3 The REER appreciated strongly in the early 1980s and then fluctuated around the higher level until the devaluation in January 1994. Since the devaluation of the CFA franc, in particular since 2001Q1, the REER of the WAEMU has been gradually trending up, reducing the competitiveness gain from the devaluation (Figure 1). During February 1994 and October 2010, the real effective exchange rate appreciated by nearly 20 percent. Taking into account the depreciation-related increase in inflation in the short term and using the first year after the devaluation as basis, the appreciation was about 10 percent.
1 Prepared by Constant Lonkeng Ngouana.
2008(2009 Report)
2009(this report)
2010 prel. est.
(this report)1
EREER approach 11.3 6.2 -2.4
MB approach 5.1 6.7 6.7
ES approach 7.7 5.4 5.4
Table 1: Summary of the Results from the Three Approaches at the Regional Level(Percent of GDP)
Source: INS, WEO; and staff estimates.1 The estimates for 2010 are based on partial REER data from the WEO, as of October 2010.

44
The sources of variation in the actual REER have changed over time. Whereas inflation differentials contributed a lot to these changes in the pre-devaluation period, the real effective exchange rate seems to be moving closely with the nominal effective exchange rate in the post-devaluation period. The nominal effective exchange rate (NEER) in turn depends closely on developments in the euro exchange rate vis-à-vis WAEMU’s main trading partners. Recent volatility of the euro exchange rate has led to an increase of the volatility of the nominal and real effective exchange rate of the CFA franc.
B. The Equilibrium Real Exchange Rate Approach We estimate the following vector error correction model using the Johansen cointegration method:
Where and are square matrices of coefficients representing the cointegrating relation(s) and the speed of adjustment of the system to the long-run equilibrium respectively. DUM is a set of dummy variables (devaluation in our case). The vector Y comprises the REER (variable of interest), and a set of equilibrium exchange rate fundamentals (terms of trade, public consumption to GDP, investment-to-GDP ratio, openness as captured by the sum of exports and imports to GDP ratio, and the relative real GDP per capita as proxy for the productivity
Figure 1. WAEMU: Real and Nominal Exchange Rates and Relative Price, 1985Q1–2010Q3
(Index, 2005=100)
60
80
100
120
140
160
180
1985Q1 1989Q1 1993Q1 1997Q1 2001Q1 2005Q1 2009Q1
NEER
REERRelative price
Source: INS
Figure 2. WAEMU: Volatility Comparators1, Dec.1996–Oct.2010
(Standard deviation)
0.0
0.5
1.0
1.5
2.0
2.5
3.0
3.5
0.0
0.2
0.4
0.6
0.8
1.0
1.2
1.4
1.6
1.8
2.0
WAEMU NEER (left axis)
Euro/dollar exchange rate (right axis)
Source: INS and staf f estimates.
1 The volatility is defined as the standard deviation over a rolling window of 36 months.

45
differential).2 All the variables have been logged, making it possible to interpret the coefficients as elasticities. Figure 3 plots the estimated long-term EREER along with the actual. The estimated EREER is computed by fitting the long-run values of macroeconomic fundamentals into the estimated cointegrating equation.3 The permanent components of fundamentals are obtained by applying the Hodrick-Prescott (HP) filter to the original series. Estimates suggest that the WAEMU REER is broadly in line with macroeconomic fundamentals. Estimates indicate that the REER would be slightly below its equilibrium level in 2010 (by some 2.4 percent).4 Positive terms of trade and growing public current consumption over the past few years are the main drivers of changes in the equilibrium exchange rate.
C. The Macroeconomic Balance Approach
This approach provides a bridge between the equilibrium real exchange rate and the external sustainability approaches presented in the next section. It uses econometric-based methods as does the former and also relies on medium-term current account projections or the underlying current account as does the latter. It consists of three steps. First, an equilibrium relationship between the current account and a set of fundamentals is estimated using panel data likely to affect investment/saving decisions at a country or regional level, including relative fiscal stance, demographics, net foreign asset position, level of development, oil balance, economic growth, etc. Second, an equilibrium current account or “current account norm” is computed by applying the coefficients from the cross-country panel estimates to the level of fundamentals projected to prevail in the medium-term in the country (or group of countries in our case) under consideration.5 Third, the 2 To ensure comparability across time, we kept the set of fundamentals used in the previous reports.
3 For this estimate, WAEMU countries were aggregated into a single entity. An alternative option is to pool country data and use panel econometric methods.
4 Given the likely future revisions in country data, this result should be interpreted very cautiously at this stage. 5 As it is the case in the previous analysis, the estimated equilibrium current account coefficients derive from existing cross-country studies (see Lee and others, 2008). For another recent study see Christiansen et al (2009). However, investment/saving decisions in the WAEMU might differ somewhat from that of the pool of countries used in previous studies.
Figure 3. WAEMU: Actual vs. EstimatedEquilibrium REER, 2005–2010
(Index, 2000=100)
80
100
120
140
160
180
1985 1990 1995 2000 2005 2010
REER (actual)
Estimated equilibrium REER (Johansen method)
Source: IMF, World Economic Outlook; and staf f estimates.
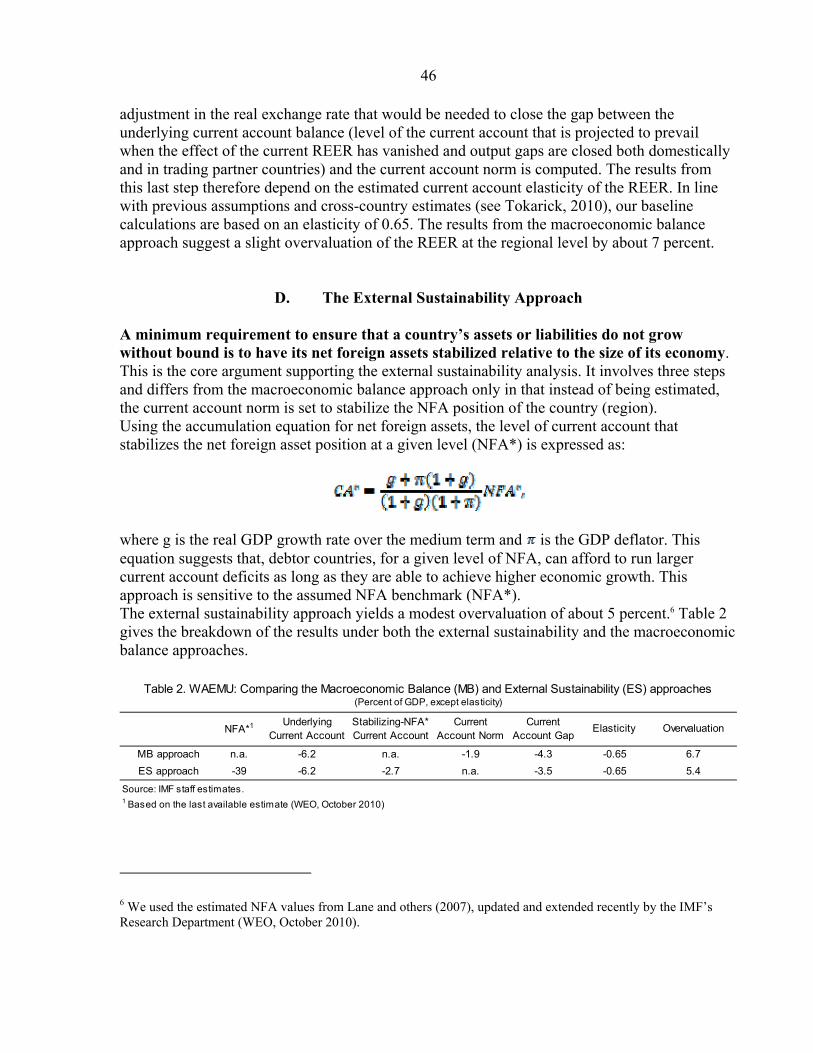
46
adjustment in the real exchange rate that would be needed to close the gap between the underlying current account balance (level of the current account that is projected to prevail when the effect of the current REER has vanished and output gaps are closed both domestically and in trading partner countries) and the current account norm is computed. The results from this last step therefore depend on the estimated current account elasticity of the REER. In line with previous assumptions and cross-country estimates (see Tokarick, 2010), our baseline calculations are based on an elasticity of 0.65. The results from the macroeconomic balance approach suggest a slight overvaluation of the REER at the regional level by about 7 percent.
D. The External Sustainability Approach A minimum requirement to ensure that a country’s assets or liabilities do not grow without bound is to have its net foreign assets stabilized relative to the size of its economy. This is the core argument supporting the external sustainability analysis. It involves three steps and differs from the macroeconomic balance approach only in that instead of being estimated, the current account norm is set to stabilize the NFA position of the country (region). Using the accumulation equation for net foreign assets, the level of current account that stabilizes the net foreign asset position at a given level (NFA*) is expressed as:
where g is the real GDP growth rate over the medium term and is the GDP deflator. This equation suggests that, debtor countries, for a given level of NFA, can afford to run larger current account deficits as long as they are able to achieve higher economic growth. This approach is sensitive to the assumed NFA benchmark (NFA*). The external sustainability approach yields a modest overvaluation of about 5 percent.6 Table 2 gives the breakdown of the results under both the external sustainability and the macroeconomic balance approaches.
NFA*1 Underlying Current Account
Stabilizing-NFA* Current Account
Current Account Norm
Current Account Gap
Elasticity Overvaluation
MB approach n.a. -6.2 n.a. -1.9 -4.3 -0.65 6.7
ES approach -39 -6.2 -2.7 n.a. -3.5 -0.65 5.4
Source: IMF staff estimates.1 Based on the last available estimate (WEO, October 2010)
Table 2. WAEMU: Comparing the Macroeconomic Balance (MB) and External Sustainability (ES) approaches(Percent of GDP, except elasticity)
6 We used the estimated NFA values from Lane and others (2007), updated and extended recently by the IMF’s Research Department (WEO, October 2010).

47
E. Concluding Remarks
The gradual appreciation of the REER since the devaluation of the CFA franc in January 1994 is a common feature among WAEMU countries. But the depreciation of the euro over the past year has helped to counteract some of the previous erosion of price competitiveness. No evidence of misalignment is found under the equilibrium real exchange rate approach. The assessment using the macroeconomic balance approach and the external sustainability analysis points to some modest overvaluation of up to 7 percent. However, taking into account the statistical margins of error, overall the REER of the WAEMU seemed to be broadly in line with macroeconomic fundamentals in 2010.
Selected References
Christiansen L., A. Prati, L.A. Ricci, and T. Tressel, 2009, “External Balance in Low Income Countries”, IMF Working Paper 09/221, Washington D.C.
International Monetary Fund, 2010, “Updated and Extended Version of the Lane and Milesi-Ferretti (2007) Dataset”, Research Department, Washington D.C.
IMF, 2008, SPR note: “How to Apply CGER Methodologies to Non-CGER Countries: A Guide for Desk Economists”, Washington D.C.
Lee, J., G.M. Milesi-Ferretti, J. Ostry, A. Prati, L.A. Ricci, 2008, “Exchange Rate Assessments: CGER Methodologies”, IMF Occasional Paper No. 261, Washington D.C.
Lane, P.R,, and G.M, Milesi-Ferretti, “The External Wealth of Nations Mark II: Revised and Extended Estimates of Foreign Assets and Liabilities, 1970-2004”, Journal of International Economics 73, November 2007, pp. 223–250.
Tokarick S., 2010, “A Method for Calculating Export Supply and Import Demand Elasticities” IMF Working Paper 10/180, Washington D.C.

48
Appendix IV: FSAP Follow-Up 1/ Recommendations Status of Implementation
Supervision and Operational Framework of the Banking Sector Gradually align prudential norms to international best practice: i.e., CAR, credit exposure, delinquent loan classification threshold.
Prudential norms are under review because a new regulatory framework will be introduced (Basel II or III). Regional specificities related to the structure of the economies (particularly crop financing) in the authorities’ view may justify some deviation from international norms.
Enforce the minimum statutory capital requirement to encourage bank mergers and end BCEAO and government participation in the capital structure of banks.
The BCEAO is in the process of assessing banks’ compliance with the higher minimum capital requirement at end-December 2010 and will devise corrective measures where needed. While the majority of member states comply with the prudential norm that limits states’ participation in financial institutions to 25 percent of equity, some member states do not yet observe this norm. In contrast, although Article 27 of the BCEAO’s new statutes allows for its participation in financial institutions, the BCEAO has divested from 7 institutions since late 2008.
Strengthen the WAEMU Banking Commission (BC) and make it accountable for (i) enforcing regulations more strictly; (ii) putting in place early warning procedures for when prudential action is needed in response to distress in a credit institution; and (iii) establishing a procedure resolving banking crises, especially in a systemic case.
The Institutional Reform that came into effect April 1, 2010, strengthened the BC’s autonomy in enforcing regulations and resolving crises. Critically, it now has the power to propose administrators, and it can be overruled only by the WAEMU Council of Ministers upon a member state’s appeal. An early warning procedure has not yet been put in place.
Open Market Operations and Public Securities Markets Enhance the effectiveness of the operational framework for monetary policy: e.g., collectivize open market operations with prime quality assets, provide daily forecasts through a bank liquidity monitoring committee, and establish active national cash committees.
In progress. Following its recent institutional reform, the BCEAO is enhancing the operational framework of monetary policy. However, the BCEAO continues to internally assess the quality of assets and does not currently use external ratings. The BCEAO is in the process of putting in place active national treasury cash flow committees, but national authorities’ compliance, which would lead to better liquidity forecasts is presently very weak in most countries. Providing daily forecasts of liquidity is yet to materialize.
Produce reliable annual schedules of securities issuance.
In progress. The BCEAO is in discussions with national treasuries on this issue, but the discussions have not produced the expected results.
Issue all public debt securities by auction. Implemented. The BCEAO has clearly favored issuance by auction.
Put in place a network of primary dealers. In progress—but not operational yet.

49
Establish a regional legal framework for repurchase operations.
Not implemented—but under review.
Set up a government bond issues coordination committee under the authority of the Council of Ministers.
Adopted in 2010, but is not yet operational because of the national authorities’ difficulty complying.
Securities and Exchange Market and Accounting and Audit Framework Complete the study of restructuring the market and address the following issues: (i) number of enterprises that can be listed; (ii) potential for venture capital; (iii) possibility of platforms shared by several exchanges (Nigeria, Ghana); (iv) potential afforded by institutional savings; and (v) incentives to attract foreign investment.
Not implemented, though the principle of creating incentives for the emergence of venture capital is adopted.
Gradually align bank accounting and auditing with international standards (IFRS and ISA) while maintaining financial reporting in accordance with the prudential rules.
In progress. The BCEAO intends to recruit an international audit and accounting firm in 2011 to train BCEAO staff and help migrate to IFRS and ISA norms.
Ease accounting requirements for companies that wish to list their shares on the exchange by reducing the number of audited fiscal years required from five to three.
Not implemented—but under review.
Determine under what conditions the guarantee system could be replaced with ratings.
Implemented since 2010—private entities with good ratings do not need any external guarantees before issuing securities. However, private entities with no ratings or bad ratings are still required to use guarantee funds or institutions.
Harmonize securities taxation in the WAEMU. Review pricing of services with a view to significantly lowering the cost of transactions.
Implemented—adopted in 2010, review of pricing in progress.
1/ Prepared by Ruud Vermeulen and Etienne Yèhoué

50
Appendix V. The Regional Debt Market1
The regional securities market has played an increasing role in providing WAEMU member countries with financing, although its development faces important challenges. Since it was created in 1998, transactions have increased steadily as more countries tapped into its resources. Notwithstanding the recent increase in transactions, there are still a number of impediments to the market’s development, including a narrow investor base, a lack of coordination of member countries’ issuances, an undeveloped secondary market, and high financing costs for borrowers.
A. Instruments and Market Developments
The WAEMU market offers four investment instruments:
Treasury bills (T-bills) are short-term instruments with maturities ranging from 1 to 24 months, 2 issued by treasuries of WAEMU member countries.
Governments bonds (T-bonds) are issued by treasuries through either the BCEAO (by auction) or the Abidjan Regional Stock Exchange (BRVM)3 (by syndication or auction). T-bonds’ maturities range from 3 to 10 years.
Corporate bonds are issued by corporations that are authorized to intervene on the market.
Regional bonds are issued by regional institutions, mostly the West African Development Bank (BOAD).
Kola bonds are issued by international agencies. The first issue was made by the International Finance Corporation (IFC) in 2006. The French Development Agency (AFD) also issued Kola bonds in 2008.
The market expanded relatively rapidly in recent years, following regular issuance of government securities (Figure 1). The market benefited from BCEAO’s decision to phase out statutory advances in 1998. As a result, issuance of government securities accelerated, while issuance by corporate and regional institutions remained marginal. The total amount of publicly placed securities went from CFAF 79 billion in 2001 to CFAF 2.3 trillion in 2010. In 2010, about 95 percent of these securities were issued by the region’s governments.
1 Prepared by Mame Astou Diouf and François Boutin-Dufresne. 2 T-bills’ maturities range typically from 3 to 12 months, with a predominance of three- and six-month maturities. In some rare occasions, T-bills of 24-month maturity were issued (the latest one was issued by Senegal in August 2009). 3 The regional bond market (Bourse régionale des valeurs mobilières).

51
0
20
40
60
80
100
0
500
1,000
1,500
2,000
2,500
2001 2002 2003 2004 2005 2006 2007 2008 2009 2010
(Per
cen
t of t
ota
l am
oun
t)
(CF
AF
bill
ion)
Other securitiesBondsTreasury billsBonds and other securities (rhs)
Gross Issuances of Publicly Placed Securities
0
20
40
60
80
100
2001 2002 2003 2004 2005 2006 2007 2008 2009 2010
Share of Government Securities in Total Gross Issuances (Percent)
Sources: BCEAO and IMF staff calculations.
Figure 1. WAEMU: Issuances of Debt Securities, 2001–2010
50
Issuances were dominated by short-term borrowing by WAEMU member countries, notably Côte D’Ivoire, to accommodate their liquidity needs and banks’ appetite for such securities.4 Since T-bill issuances started in 2001, they have generally dominated market operations (Figure 1). In 2010,5 Côte d’Ivoire alone issued about 70 percent of the total amount of traded T-bills (for about CFAF 1.4 trillion) while Senegal, Benin, and Mali accounted for another 21 percent of the issuances. A large part of those T-bills was held by banks and had less than 6-month maturities. Interest rates on T-bills remained relatively high (more than 5 percent, on average, during 2010).
Long-term securities also show a high concentration of issuers and low diversification in maturities. The governments of Côte d’Ivoire, Senegal, and Burkina Faso remain the main issuers in the market for these types of instruments, with close to half of the total long-term securities issued during 1999 through June 2010. Most of the long-term securities have five- to seven-year maturities. 4 Acquisition of T-bills by banks does not hinder their liquidity management because most of the T-bills have less than one-year maturities. Moreover, T-bills can be traded in any of the eight WAEMU countries, and can be used for refinancing at the central bank. Besides, they bear a zero-risk weight in the calculation of capital adequacy ratios. 5 As of December 27, 2010.
Cote d'Ivoire70%
Senegal8%
Benin8%
Mali5%
Other9%
Sources: BCEAO and IMF staf f calculations.
Figure 2. WAEMU: Gross Issuances of T-bills by Country, 2010(Percent)

52
B. Overcoming Obstacles to Market Development
Notwithstanding its recent expansion, the securities market still faces several constraints. Key obstacles to the development of the market need to be addressed to enable the market to reach its full potential. These include:
Lack of reliable schedules of public debt issuance. Despite recent progress made in some countries, treasury cash flow management remains generally weak in the WAEMU region. The preparation of better treasury cash flow plans would allow member countries to prepare and communicate to market participants more reliable information on their securities issuance programs.
Lack of coordination on countries’ issuance schedules. Although countries’are required to communicate their borrowing schedules to the BCEAO, the lack of coordination persists, leading to occasional bunching up of securities issuances. Better coordination could help develop the market and reduce financing costs for issuers.
A regulatory environment which encourages banks’ preference for short-term instruments. The banking system’s assets are predominantly short-term. This, together with the regional prudential regulation that requires banks to cover at least 75 percent of their long-term assets with their long-term resources (2+ years), makes it difficult for financial institutions to invest in the bond market.
Undeveloped secondary market. Excess liquidity in the banking system, combined with the lack of alternative investment instruments, tends to encourage investors to buy-and-hold their government securities until maturity. Setting up a regional network of primary dealers could help develop secondary markets and reduce the cost of financing for governments, because primary dealers could bring more liquidity to the market at offering.

53
References
Cabrillac, Bruno, and Emmanuel Rocher, 2009, “Government Debt Markets in African
Developing Countries: Recent Developments and Main Challenges,” Quarterly Selection of Articles, No. 15, Autumn, pp. 5–25 (Paris: Banque de France
International Monetary Fund, 2008, West African Economic and Monetary Union—Financial System Stability Assessment, May (Washington: International Monetary Fund).
International Monetary Fund/World Bank, 2008, Financial Sector Assessment Program, West African Economic and Monetary Union (WAEMU), Government Securities Technical Note, June.

54
Appendix IV
Public Information Notice (PIN) No. 11/37 FOR IMMEDIATE RELEASE March 17, 2011
IMF Executive Board Concludes 2011 Discussion on Common
Policies of Member Countries of the West African Economic and Monetary Union
On March 14, 2011, the Executive Board of the International Monetary Fund (IMF) concluded the annual Discussion1 on Common Policies of Member Countries of the West African Economic and Monetary Union (WAEMU). 2 Background An economic recovery has started in the WAEMU last year following a slowdown in growth in 2009. In 2010, economic growth is estimated to have on average returned to levels similar to those prior to the previous global food and fuel price shocks and the global financial crisis. Growth has been supported by monetary and fiscal easing, good
1 Under Article IV of the IMF's Articles of Agreement, the IMF holds bilateral discussions with members, usually every year. In the context of these bilateral Article IV consultation discussions, staff hold separate annual discussions with the regional institutions responsible for common policies in four currency unions—the Euro Area, the Eastern Caribbean Currency Union, the Central African Economic and Monetary Union, and the West African Economic and Monetary Union. For each of the currency unions, staff teams visits the regional institutions responsible for common policies in the currency union, collects economic and financial information, and discusses with officials the currency union’s economic developments and policies. On return to headquarters, the staff prepares a report, which forms the basis for discussion by the Executive Board. Both staff’s discussions with the regional institutions and the Board discussion of the annual staff report will be considered an integral part of the Article IV consultation with each member. At the conclusion of the discussion, the Managing Director, as Chairman of the Board, summarizes the views of Executive Directors, and this summary is transmitted to the country's authorities. An explanation of any qualifiers used in summings up can be found here: http://www.imf.org/external/np/sec/misc/qualifiers.htm. 2 WAEMU’s members are Benin, Burkina Faso, Côte d’Ivoire, Guinea-Bissau, Mali, Niger, Senegal and Togo.
International Monetary Fund 700 19th Street, NW Washington, D. C. 20431 USA

55
agricultural production, recovery in the region’s main trading partners, and a pick-up in Guinea-Bissau and Togo. In 2010, average inflation remained low in all WAEMU countries, but edged up in the second half of the year. On average, annual consumer price inflation reached 1.4 percent, up from 0.4 percent in 2009. More recently, however, higher international oil and food prices have started to feed through to inflation, but core inflation has remained subdued. After a moderate fiscal easing by about 1½ percentage points of GDP in 2009, mostly the result of higher capital spending, the area-wide average deficit is estimated to have declined slightly to 3.2 percent of gross domestic product (GDP) in 2010. Revenues have started to recover, while government expenditure has stabilized. Following a compression of imports in 2009, the region’s external current account deficit is estimated to have reached about 5½ percent of GDP in 2010. In months of imports of goods and services, international reserves were comfortable at well above 6 months in 2009 and 2010, in part due to the SDR allocation made by the IMF to all member countries in 2009. Political stability in the region is a precondition for the recovery to continue. With a rapid and peaceful solution in Côte d’Ivoire and the right policies, the region could still experience a continuation of the recovery to close to 4½ percent in 2011, and above 5 percent in the medium term, but regional growth will continue to lag the Sub-Saharan Africa average. With recently rising international food and fuel prices, inflation is projected to edge up. There are considerable risks to the projected recovery. In particular, the political crisis in Côte d’Ivoire has intensified in recent weeks with significant adverse fallout for domestic financial and economic activity. If not resolved soon, this could also have severe human and financial cost for neighboring countries in the WAEMU and the region, including though trade, migration, and financial sector channels. A more sluggish global economy could slow the regional recovery by dampening exports, remittances, and capital inflows. In turn, this could put pressure on the current account and on the quality of the loan portfolios of banks, and reduce the amounts available for the financing of fiscal deficits. A persistent rise in international food and fuel prices poses inflationary risks, which should be monitored carefully. Executive Board Assessment While an economic recovery is underway, Executive Directors expressed deep concern that the ongoing political crisis in Côte d’Ivoire poses serious risks—in particular, through trade and financial sector linkages—and that the spillovers for the region could be severe should the crisis persist. In addition, rising food and fuel prices could risk inflationary pressures, with an adverse impact on poverty. In this context, Directors emphasized the importance of an increased focus on contingency planning and crisis management to limit

56
the impact of the crisis, and underscored the need to closely monitor the economic and financial situation in WAEMU member countries. Directors considered that fiscal policy should balance support for growth, including large investment needs, with debt sustainability. They emphasized the need to create fiscal space for priority spending—including for infrastructure investment—through broad-based tax and administration reforms, better quality expenditures, and control on recurrent spending. Directors recognized the potential impact of rising food and fuel prices on the poorest segment of the population and underscored that any transfers or subsidies should be carefully targeted to protect the most vulnerable. Directors also called for timely implementation of the WAEMU directives in public financial management. Directors urged the authorities to be vigilant to upside inflation pressures from higher international food and fuel prices and possible spillovers from the crisis in Côte d’Ivoire. They welcomed the new institutional framework for monetary policy, including the newly established Monetary Policy Committee. To make the framework effective, Directors recommended improving analytical underpinnings, transparency, and communication. Directors noted the staff’s assessment that the real effective exchange rate appears broadly in line with economic fundamentals. However, the recent large movements in the euro exchange rate have resulted in greater volatility of the WAEMU’s real effective exchange rate. Directors emphasized that it will be critical to make further efforts in supply-side reforms, including reducing infrastructure bottlenecks and improving the business climate and governance. Directors stressed that restoring the functioning of the Banking Commission is critical to ensure effective supervision and minimize the spillover risk from Côte d’Ivoire. They encouraged the authorities to accelerate the follow-up work on the Financial Sector Assessment Program recommendations, and emphasized the importance of comprehensive and up-to-date banking data and vulnerability indicators to ensure timely assessments of financial stability. Directors also called for further reforms to broaden and deepen financial market development. The views expressed by Executive Directors today will form part of the Article IV consultation discussions on individual members of the WAEMU that take place until the next Board discussion of WAEMU common policies.
Public Information Notices (PINs) form part of the IMF's efforts to promote transparency of the IMF's views and analysis of economic developments and policies. With the consent of the country (or countries) concerned, PINs are issued after Executive Board discussions of Article IV consultations with member countries, of its surveillance of developments at the regional level, of post-program monitoring, and of ex post assessments of member countries with longer-term program engagements. PINs are also issued after Executive Board discussions of general policy matters, unless otherwise decided by the Executive Board in a particular case.

57
WAEMU: Selected Economic and Financial Indicators, 2008—2012
2008 2009 2010 2011 Est. Proj. 1
(Annual percentage change) National income and prices GDP at constant prices 4.1 3.0 4.0 4.3 GDP per capita at constant prices 1.4 0.3 1.3 1.5 Consumer prices (average) 7.4 0.4 1.4 3.1 Terms of trade 12.4 12.3 8.7 -1.9 Real effective exchange rates 5.7 0.5 -6.3 …
(Annual percentage change) Money and credit 2 Net foreign assets 0.3 11.6 10.8 … Net domestic assets 18.0 14.7 18.6 … Broad money 8.7 14.7 17.0 …
(Percent of GDP, unless otherwise indicated)Government financial operations Government total revenue, excl. grants 17.6 17.4 18.0 18.1 Government expenditure 22.4 23.9 23.8 24.0 Overall fiscal balance, excl. grants -4.8 -6.5 -5.8 -5.9 Overall fiscal balance, incl. grants -2.0 -3.5 -3.1 -3.2External sector Exports of goods and services 3 27.0 27.3 26.6 30.5 Imports of goods and services 3 36.7 33.3 34.4 36.7 Current account, excl. grants -8.6 -5.4 -7.1 -6.3 Current account, incl. grants -7.1 -3.5 -5.5 -5.0 External public debt 33.8 36.0 35.0 34.5Memorandum items: Nominal GDP (in billions of CFA francs) 31,228 32,623 34,613 37,048 CFA franc per US dollars, average 447.8 472.2 495.3 … Reserves in months of imports (excl. intra-WAEMU imports) 5.8 6.5 6.1 6.0
Sources: IMF, African Department database; World Economic Outlook; IMF staff estimates.
1 Projections based on end-January WEO assumptions. 2 The estimates for 2010 refer to the annual change at end-Nov. 3 Excluding intra-regional trade.

INTERNATIONAL MONETARY FUND
West African Economic and Monetary Union Staff Report on Common Policies of Member Countries
Regional Consultation on Economic Issues and Policies
Informational Annex
Prepared by the African Department (In consultation with other departments)
Approved by Roger Nord and Thomas Dorsey
February 25, 2011
Contents Page
Fund Relations with Member Countries ....................................................................................2

2
Fund Relations with WAEMU Member Countries
I. Membership Status
Senegal and Togo joined the IMF in 1962; Benin, Burkina Faso, Côte d’Ivoire, Niger, and Mali in 1963; and Guinea-Bissau in 1977. Each of these members of WAEMU accepted the obligation of Article VIII on June 1996, except for Guinea-Bissau, which accepted them on January 1, 1997.
II. Member Country Relations with the Fund
Benin: The most recent Article IV consultation was concluded in June 2010, at which time the Executive Board also approved a new three-year ECF arrangement with access of SDR 74.28 million (120 percent of quota). The first review of the ECF arrangement was completed on February 16, 2011. Benin reached the HIPC completion point in March 2003 and received debt relief under the Multilateral Debt Relief Initiative (MDRI) in January 2006.
Burkina Faso: Fund relations. The IMF has supported Burkina Faso almost continuously since 1993 through arrangements under the Enhanced Structural Adjustment Facility (ESAF), the Poverty Reduction and Growth Facility (PRGF), and the Extended Credit Facility (ECF). Burkina Faso reached the HIPC completion point in April 2002 and received debt relief under the Multilateral Debt Relief Initiative (MDRI) in early 2006. The Board concluded the 2009 Article IV Consultation and the fifth review under the PRGF arrangement on December 14, 2009, at which time it approved an increase in access by 55 percent of quota to help mitigate the impact of the global economic downturn, and other exogenous shocks that affected the economy in 2008-09. On June 14, 2010, the Board approved a three-year ECF arrangement with an access level of 76.67 percent of quota. The first review under the new program was completed by the Board on December 3, 2010.
Côte d’Ivoire: Fund relations: ECF arrangement approved March 27, 2009; HIPC decision point April 1, 2009. Second ECF review completed July 9, 2010. Executive Directors remained skeptical about the track record, in particular delays in structural measures. Completion of the next program review is awaiting a resolution of the internal political crisis and agreement on a new annual economic program with an internationally recognized government.
Guinea-Bissau: Fund relations: On May 7, 2010, the Executive Board approved a three-year (2010–13) arrangement under the ECF in an amount equivalent to SDR 22.365 million (US$33.3 million) to support Guinea Bissau’s medium-term economic program. The Executive Board also approved the second tranche of interim assistance under the HIPC Initiative of SDR 1.016 million (US$1.5 million). In December 2010,

3
the Executive Boards of the Fund and the Bank approved the completion point under the HIPC Initiative.
Mali: Fund relations: Mali reached the HIPC completion point in March 2003 and received debt relief under the Multilateral Debt Relief Initiative (MDRI) in early 2006. Mali’s current three-year ECF arrangement, with front-loaded access to help address fuel and food price shocks, was approved by the Board on May 28, 2008 and remains on track; the fifth review was completed on January 26, 2011.
Niger: Fund relations: Niger reached the HIPC completion point in April 2004 and received debt relief under the Multilateral Debt Relief Initiative (MDRI) in early 2006. Based on satisfactory performance through end-September 2009 and adequate commitment to the program going forward, the Executive Board completed the third review of Niger’s ECF-supported program on February 12, 2010. Following the February 18th coup d’état, the program was suspended until a poll of the membership endorsed the recognition of the current authorities. Relations were reestablished in September 2010. A mission was fielded shortly thereafter to discuss the combined 4th and 5th ECF- reviews. In light of the delays in the discussions, the reviews will likely be concluded after the newly elected government takes office in April 2011.
Senegal: Fund relations: Senegal reached the HIPC completion point in April 2004 and received debt relief under the Multilateral Debt Relief Initiative (MDRI) in early 2006. The Board approved a new three-year PSI on December 3, 2010. A three-year Policy Support Instrument (PSI) ended on December 3, 2010 upon completion of the sixth and final review. An 18-month Exogenous Shocks Facility (ESF) arrangement was fully disbursed (a total of SDR 121.35 million, about US$178.8 million) and expired in June 2010. The last Article IV consultation was concluded in May 2010.
Togo: Fund relations: Togo’s three-year ECF arrangement was approved in April 2008, in an amount of SDR 66.06 million (90 percent of quota). Following augmentations of access in September 2008 and most recently on June 25, 2010, total access has reached SDR 95.41 million (130 percent of quota). The HIPC decision point was reached in November 2008, and the completion point on December 14, 2010. The latest augmentation (SDR 11 million, 15 percent of quota) helped close a residual financing gap for 2010 related to countercyclical fiscal policies to offset the global recession.
III. Safeguards Assessments
The Central Bank of West African States (BCEAO) is the central bank of the West African Economic and Monetary Union (WAEMU). The most recent safeguards assessment of the BCEAO was completed on March 1, 2010. The 2010 update assessment found that the BCEAO continues to have controls in place at the operational level. The overall governance framework needed nonetheless to be strengthened by the

4
addition of an audit committee to ensure that the Board of Directors exercises appropriate oversight over the control structure, including the audit mechanisms and financial statements. The Institutional Reform of the WAMU and the BCEAO completed after the approval of the safeguards report stipulated creation of the Audit Committee, which should now start working. Efforts to implement fully the International Financial Reporting Standards reporting framework should also be pursued.
IV. Exchange System
The regional currency is the CFA franc. From 1948 to 1999 it was pegged to the French franc. Since January 1, 1999, it has been pegged to the euro at the rate of CFAF 655.957 per euro.
V. Regional Discussions
Regional consultation discussions take place annually. With the Board decision (Decision No. 13656-(06/1)) on January 6, 2006, consultations with WAEMU formally became an integral part of Article IV consultations with WAEMU member countries.
VI. FSAP Participation and ROSCs
A regional WAEMU FSAP was conducted in 2007/08. Follow-up country FSAPs have been conducted for Mali and Burkina Faso in 2008 and for Niger and Côte d’Ivoire in 2009. Senegal had an FSAP in 2001, with an update in 2004.
VII. Technical Assistance to WAEMU/BCEAO
AFRITAC (AFW) has provided and continues to provide technical assistance to the WAEMU Commission, notably in the fiscal area.
There has been no MCM technical assistance to the BCEAO in recent years.
2000 Fiscal Affairs Department (FAD) mission on harmonizing taxation of petroleum products
2001 Three FAD mission on tax administration 2001 FAD visit to WAEMU for workshop on customs exemptions 2001-02 Two FAD missions on public expenditure management 2001-02 Two FAD missions on tax policy 2001-03 Long-term resident advisor on government finance statistic 2004 FAD mission on public finance management directives 2005 Two FAD missions on public finance management directives 2005 WAEMU seminar on Taxation and development 2008-09 FAD missions on the revisions of public financial management directives and
their dissemination and implementation 2010 STA mission on Government Finance Statistics 2010 LEG mission on Banking Law 2010-11 FAD missions on implementation of public financial management directives

Statement by Staff Representative on WAEMU—Regional Consultation on Economic Issues and Policies
Executive Board Meeting March 14, 2011
This statement provides information that has become available since the Staff Report (SM/11/39) was circulated to the Executive Board on February 28, 2011. The information does not alter the thrust of the staff appraisal, although the risks to the outlook have increased. The security situation in Abidjan is extremely volatile, with increasingly frequent fighting between security forces of the government in place and supporters of the internationally recognized government, as well as incidents of aggression against the UN presence. The Gbagbo administration has restricted media operations, with nine non-government newspapers closed and UN, BBC and RFI radio broadcasts blocked in early March. Banking system operations in Côte d’Ivoire are very limited. Out of 19 commercial banks, only four government-owned banks are still operating; the others closed their operations. Press reports indicate that the Gbagbo government has since nationalized four foreign-owned banks and is in the process of re-opening two of them for limited operations. Overall, banking system operations on the ground seem very limited. The rest of the Ivorian economy has been hit hard. Industrial production is grinding to a halt due to shortage of liquidity, and lack of inputs and financial services. Most exports—especially of cocoa—have virtually stopped as a result of the economic sanctions and following a ban on cocoa exports in late January. In addition, shortages of electricity, cooking gas, fuel and medicine—leading to accelerating inflation—are negatively affecting everyday life. The Gbagbo administration stopped the provision of electricity and piped water to the North of the country in early March. The BCEAO has been monitoring the situation closely, although this has become increasingly difficult. The BCEAO has set up a crisis committee which meets daily, headed by the Governor. A major challenge is information gathering as the BCEAO no longer receives information from government agencies in Côte d’Ivoire. The crisis has affected the operations of regional institutions. The premises of the Banking Commission, which was based in Côte d’Ivoire, have been taken over by the Gbagbo administration. The Commission is in the process of reestablishing its operations in Dakar with core staff. It is expected that it could resume its operations by mid-March for the rest of the region (excluding Côte d’Ivoire). The regional stock exchange, Bourse Régionale des Valeurs Mobilières (BRVM), closed its operations in Côte d’Ivoire. After relocating to Mali recently, it appears to be in full operation. To mitigate the effects of the crisis on the banking system in the region, the central bank has continued to roll over maturing Ivorian treasury bills and capitalized interest. This was done
2
initially in agreement with the Gbagbo administration, and subsequently with the Ouattara administration. So far, no liquidity shortages have been observed outside of Côte d’Ivoire. Given the exceptional degree of uncertainty, it is difficult to quantify the macroeconomic impact of the crisis, but the outlook for the region has worsened. If the crisis persists for a significant part of the year, output in Côte d’Ivoire is likely to fall in 2011. Although countries in the region have diversified regional trade links during the past decade, a prolonged crisis can be expected to affect regional growth, likely more in Hinterland countries—in particular Burkina Faso and Mali. The economic recovery, which was expected to restore regional growth to about 4½ percent in 2011, is threatened by the crisis in Côte d’Ivoire.

Statement by Kossi Assimaidou Executive Director for West African Economic and Monetary Union
March 14, 2011
My WAEMU authorities appreciate the constructive discussions with staff in the context of regional surveillance. They broadly share the thrust of the staff report which gives a first-hand assessment of the policy reforms within the region as well as the institutional framework underpinning the integration efforts of member countries of the WAEMU. The cooperation with the Fund has helped the countries stabilize their macroeconomic environment, improve growth rates, lower debt ratios, and foster structural reforms. Nonetheless, development prospects remain fragile, in view of the potential shocks stemming from the still adverse international environment and the impact of the decade-long political crisis in Cote d’Ivoire, the largest economy of the WAEMU. Recent Economic Developments After slowing in recent years, as a consequence of the fuel and food crisis and the global financial meltdown, GDP growth is resuming in the region, recording 4 percent in 2010 in real terms against 3 percent in 2009. The main drivers of this positive development were buoyant output in the mineral and food sectors, favorable terms of trade, and dynamic construction activities. Annual Inflation is slightly on the rise at 1.4 percent, compared to 0.4 percent in 2009, especially because of trade disruptions stemming from the crisis in Côte d’Ivoire. Nonetheless, inflation remains well below the regional convergence threshold of 3 percent. On the external front, the Union posted comfortable levels of reserves, at 6 months of imports coverage. My authorities are committed to implementing policies to address the downside risks to the outlook. In this regard, WAEMU authorities are joining efforts with the Economic Community of West African States (ECOWAS) and the African Union to expeditiously and peacefully resolve the post-election crisis in Cote d’Ivoire. In the meantime, appropriate measures are being taken to lower its impact on the region. Landlocked countries have turned to alternative means for their imports, with the view to curbing down inflationary pressures linked to the ensued trade distortions. As regards the financial sector, my authorities have taken steps to safeguard the regional banking system from liquidity and solvency risks, especially by rolling over maturing Ivorian government paper mainly held by banks in the region. Though 15 out of 19 commercial banks operating in Cote d’Ivoire have suspended their activities, the BCEAO is in constant consultation with them to secure their important assets and limit the impact of this disruption on the whole regional financial system. A temporary relocation in other member countries of regional financial institutions such as the stock exchange market is also envisaged. Achievements on Common Policies and Outlook My WAEMU authorities have achieved noticeable results on their economic integration agenda. Member countries have significantly improved their performance on meeting the

2
convergence criteria. In the area of public finance, six out of eight countries met the criterion on the primary fiscal balance while most of them have now addressed the issue of stock arrears thanks to the last SDR allocation. Going forward, the authorities are taking initiatives which will allow member countries to better assess the scope of domestic arrears and hence improve the reporting on public finance data. As regards debt levels, all countries but Côte d’Ivoire posted reassuring ratios, for having benefitted from the HIPC and MDRI initiatives. My authorities’ policy actions, paired with the resolution at a sooner date of the crisis in Côte d’Ivoire and a more favorable international environment, should help economic recovery to take hold. Output growth is projected at 4.5 percent in 2011 and above 5 percent over the medium term. Policies that should underpin this momentum are planned in many areas, including the fiscal, financial, and private sectors, not to mention many reforms regarding competitiveness, infrastructure and the institutional framework of the WAEMU. In the fiscal area, my authorities have taken note that most of the measures of giving up taxes to offset the impact of the food and fuel crisis have come to an end. Mindful of the lessons learned from this experience, in terms of disruption in the coordination of fiscal policies, my authorities have decided to establish a list of basic foodstuff which will be entitled a lower VAT rate. This measure will benefit lowincome households and improve the predictability of governments’ revenues in case of shocks. Going forward, my authorities are working steadfastly on their program of fiscal transition aimed at increasing the share of domestic tax revenue compared to customs and duties in the financing of government budgets. To this end, the WAEMU Commission is pushing for the implementation of broad-based tax reforms and for further improvements in tax administrations, notably the modernization of procedures, capacity building, and the harmonization of practices. At the same time, the authorities are pursuing their efforts of keeping in check current spending; especially wage bills. My authorities have improved the conduct of monetary policy and ongoing work will contribute to the development of the financial sector. The recent institutional reform of the BCEAO has brought in key changes and new decision-making bodies. The Monetary Policy Committee (MPC) was established in September 2010 and has already made important decisions such as the clear adoption of inflation targeting policy and the setting of an objective of 2 (±1) percent over a 24-month horizon. Transparency is being strengthened by the detailed press release following MPC meetings. Moreover, the work of the MPC has had a positive impact in terms of demand for more analysis and research, including in new areas, which will help better understand and remove impediments to the development of the financial sector. Cognizant of the key role of the banking sector in supporting growth, my authorities are working on many other fronts to help build strong banks in the region with the view to enhancing lending activity. Thanks to efforts in harmonization of practices within the ECOWAS, there is more diversification of the banking sector with non-traditional banks opening branches in the WAEMU region. The authorities concur with staff that there is a need of new legislation to facilitate and broaden types of collateral required from borrowers. New instruments will be introduced in the existing institutional framework, which should help better inform banks on clients and boost lending to the private sector, especially SMEs. As regards competitiveness, my WAEMU authorities agree with staff that in 2010 the REER appeared broadly in line with economic fundamentals. My authorities are committed to implementing needed supply side reforms to maintain price competitiveness. As regards non-

3
price competitiveness, my authorities will continue to help member countries improve governance and the business environment within the region, especially by pushing for one-stop shops for business registration. An investment code for the Union is being finalized and should be adopted by end-2011. My authorities intend to launch discussions on a private sector development strategy in 2012, and a policy framework for public-private partnerships is planned for 2012–13. In the same vein, my authorities have unveiled plans to close the infrastructure gap and address the issue of energy shortages within the region. Many transnational roads are under construction, such as the Bamako-Dakar highway which should be operational at end-2011. Regarding the energy sector, a regional fund for the financing of projects has been set at the West African Development Bank. Its primary objective is to prevent the WAEMU countries from experiencing electricity outages in2011. Over the medium term, it should serve as basis for a broader solution to the global energy problem within the region. Overall, we concur with staff that a major binding constraint to growth is the lack of sufficient and cost-effective infrastructure, especially in electricity supply, road transport, and ports. My authorities strongly believe that there is an urgent need to address those binding constraints; and this will need some fiscal easing, at least in the short run. The debate on how to strike the right balance between growth-enhancing investment and concerns of debt sustainability should be conducted thoughtfully and long-term yields be emphasized. Otherwise, there is the risk of falling into a vicious circle, with slow growth and widespread poverty. Conclusion The WAEMU member countries have made significant inroads on the path of economic integration. Most individual countries display a stronger macroeconomic framework today than years before, and have built good track records of reform implementation. The institutional framework of the Union has undergone major changes and its continuous improvement has helped better coordinate domestic policies. Overall, the WAEMU policy instruments have contributed to weather well the food and fuel crisis followed by the global financial turmoil. Growth prospects remain favorable and should gain momentum with the expected settlement of the post-election crisis in Côte d’Ivoire. Exogenous shocks, paired with domestic political and economic turmoil, are the costly reminders of the challenges still facing the construction of the WAEMU as a viable economic space capable of generating greater prosperity for its populations. My authorities are fully committed to tackling this daunting challenge to which the contribution of the international community is well appreciated.