west coast institute is the trading name for west coast ... · pdf filein accordance with the...
TRANSCRIPT

West Coast Institute is the trading name for West Coast Institute of Training

West Coast Institute | Annual Report 2015
Contents
Letter to the Minister ......................................................................................................................................... 3 Section One: West Coast Institute of Training Overview ..................................................................................... 4
Message from the Chair and Managing Director ............................................................................................. 4 Executive Summary ...................................................................................................................................... 6 Corporate Governance .................................................................................................................................. 7 Organisational Structure .............................................................................................................................. 10 Senior Leadership ....................................................................................................................................... 11 Overview .................................................................................................................................................... 12
Section Two: Strategic Plan 2013 - 2015 ......................................................................................................... 13 Our Vision................................................................................................................................................... 13 Our Role ..................................................................................................................................................... 13 Our Goals ................................................................................................................................................... 13 Our Values ................................................................................................................................................. 13 The West Coast Way .................................................................................................................................. 13
Section Three: Report on 2015 Business Plan ................................................................................................. 14 Section Four: Key Performance Indicators ....................................................................................................... 26 Section Five: Financial Statements .................................................................................................................. 32 Contact........................................................................................................................................................... 77
Page 2 of 77

West Coast Institute | Annual Report 2015
Letter to the Minister Hon. Liza Harvey MLA Minister for Training and Workforce Development 11th Floor Dumas House 2 Havelock Street West Perth WA 6005
In accordance with the requirements of Section 54 of the Vocational Education Training Act 1996 and Section 61 of the Financial Management Act 2006, we hereby submit for your information and presentation to Parliament, the Annual Report of West Coast Institute of Training for the year ended 31 December 2015.
Graham Droppert Michelle Hoad
Governing Council Chair Managing Director 15 February 2016 15 February 2016
Page 3 of 77

West Coast Institute | Annual Report 2015
Section One: West Coast Institute of Training Overview Message from the Chair and Managing Director We are pleased to present the West Coast Institute 2015 Annual Report.
In a year full of challenges West Coast, students and staff demonstrated their ability and commitment to excel in their chosen fields. Our passionate staff, as always,have gone above and beyond to help our students to reach their full potential. Over 8,000 students
called the Institute home in 2015 as they undertook their training via traditional classroom activity; online; on the job; or a flexible delivery which combines several methods. Throughout the year the Institute continued to assist the State Government in developing a skilled workforce by increasing training delivery in skill shortage areas and employment based training. In addition, 50% of courses were delivered at Certificate IV and higher, providing high end skills acquisition and skills deepening to increase the productivity of individuals. The Institute continued to engage existing workers in training, enabling them to obtain a formal qualification through the recognition of prior learning (RPL) and skills gap training. RPL delivery accounted for approximately 12% of the total profile training delivery. Our focus on learners was rewarded with the achievement of a student satisfaction rating of 89.7%, approximately 2% higher than the state average. This is a wonderful reflection on the calibre of lecturing staff at the Institute and reinforces the Institute’s student centric approach to providing high quality training and assessment practices. Building and infrastructure work continued at the McLarty Ave campus and it is hoped that the new simulation hospital ward, to be officially opened in early 2016, will provide health and wellness students with an opportunity to train in a learning environment that reflects industry standards. Celebrating the success of students and staff, the Institute’s annual awards evening was held outdoors underneath the stars. Trainee of the Year Emma Grant, an early childhood educator, took out
the coveted Student of the Year Award and Tracey Hennessy won the Trainer of the Year, In further recognition of the quality of trainers and staff at the Institute, hospitality lecturer Chad Tilbury was awarded the prestigious Bill Thompson Award at the Catering Institute of Australia (WA) Gold Plate Awards for exhibiting outstanding front –of-house service. A highlight of the year was a lives work project in which our wonderful students and lecturers worked with Industry to produce Anzac Tom. Anzac Tom is an augmented reality creation which will accentuate the tourist experience, at Kings Park, for many years to come. Enabling existing workers to continue their learning journey, the first cohort of students continued the Bachelor of Management (BAM) program at the Kendrew campus. Utilising an innovative approach to combine face-to-face, online and self paced learning, the BAM has been able to provide mature aged students with an oportunity to recognise their existing learning and work experience to progress into a Bachelor program and obtain a University degree, with graduation expected in 2016. As part of a revamped business development focus, a ‘Women in Leadership’ forum was conducted in May as part of the Institute’s Workforce Solutions offerings. The forum featured some of Western Australia’s most successful and powerful business women who captivated the audience as they spoke about their experiences as women in leading roles in the workforce. Our Clarkson campus, Trades North, opened its doors to the local community in November to give prospective students and family an opportunity to see the facilities up close and talk to the lecturers about the training on offer. The Institute has continued to work with community based organisations, like Trade Up Australia, to assist in encouraging more girls/women into a trades training pathway. Continually reinventing a highly dynamic and complex entity to remain focussed on the volatile skills needs of industry and the community is not easy, and we would like to thank all of our members on the Councils of Industry Partners (CoIPs) and the Aboriginal Education Employment and Training Committee (AEETC) for their time and sharing their invaluable insight and knowledge. The continuous feedback provided by our CoIPs and AEETC ensures that our training remains relevant to address the skill needs of indiviuals and
Page 4 of 77

West Coast Institute | Annual Report 2015
our surrounding community reflects the role of training in economic development. We would like to thank all Governing Council members for their efforts throughout the year; particularly retiring members Kim Allen, Catherine Brody, Paul Darcy, Gary Ellis and Laurie Kruise; their input and advice has been greatly appreciated. We would particularly like to acknowledge the outstanding contribution over a ten year period of our former Chair, Dr Russel Perry, who sadly passed away mid year. Dr Perry’s legacy will be reflected at the Institue for many years to come. While 2015 was a year to celebrate student and staff success, industry partnerships and community collaboration, it is the road ahead that will require the Institute to maintain our high levels of service,
innovative thinking and collaborative approach. It is with great enthusiasim that we look forward to contributing to a dynamic training sector that will continue to transform individuals lives and strengthen business bottom lines throughout Western Australia.
Graham Droppert Michelle Hoad Chair, Governing Council Managing Director
Left to right: Michelle Hoad (Managing Director), Hon. Liza Harvey MLA (Minister for Training and Workforce Development), Tracey Hennessy (Trainer of the Year), Emma Grant (Student of the Year), Marion Marik (Employee of the Year), Dr Russel Perry AM (Chair, Governing Council) and Ben de Klerk (Employer of the Year).
Page 5 of 77

West Coast Institute | Annual Report 2015
Executive Summary
West Coast Institute’s vision is ‘To be the first choice of students and industry’. Guided by this statement, the Institute seeks to ensure that enterprise and industry have access to job ready graduates and, more importantly that our students obtain relevant skills to assist them enter and prosper within the labour market.
In 2015 West Coast Institute:
• Delivered 1.97 million state funded student curriculum hours (SCH) and 2.57 million SCH in total
• Had approximately 250 full-time equivalent academic and support staff to help its students and clients meet their professional and personal goals
• Had an operating budget of $41.9 million
• Earned a commercial revenue of $5.86 million
• Cost per SCH was $16.28.
The Institute delivered over 120 qualifications from Certificate I to Associate Degrees via on-campus, online or on the job training across 38 study areas. 2015 highlights with regard to the Institute’s focus on addressing strategic issues were:
Achieving a student satisfaction rating of 89.7%, higher than the WA State average of 87.8%.
52% of its profile training in skill shortage areas and employment based training.
Continued focus on the Recognition of Prior Learning (RPL) delivery with RPL representing approximately 12% of profile delivery.
Consistent with State and Commonwealth Government agenda, a significant proportion of the Institute’s profile delivery (82%) is at Certificate III or higher.
Delivery at Certificate IV and above represents 50.5% of total profile delivery. This focus on the provision of high-end skills serves to increase the productivity of the State and Region’s labour force.
About our students Approximately, 51% of students are female. 63% of students study full time In regard to our age profile, students under 20 represent 36% of profile delivery, 21-49 – 57% of profile delivery and 50+ - 7% of profile delivery About Us SCH Activity 23% of delivery is commercial 77% of delivery is government subsidised (profile) Table 1. Share of Training Delivery ANZSCO Major Group % Achieved Managers 3.91% Professionals 8.83% Technicians and Trade Workers 19.91% Community and Personal Service Workers 45.27% Clerical and Administrative Workers 7.33% Sales Workers 1.28% Labourers 7.20% General Education 6.26% Report Total 100.00%
Page 6 of 77

West Coast Institute | Annual Report 2015
Corporate Governance
Governing Council Members 2015
Dr Russel PERRY Chairperson
Mr Graham DROPPERT Deputy Chairperson/Chairperson
Professor Julie QUINLIVAN Member/Deputy Chairperson
Ms Michelle HOAD Managing Director
Mr Kim ALLEN Member
Ms Kristy BRITTAIN Member
Ms Catherine BRODIE Member
Ms Zoe CLUNE Member
Mr Paul DARCY Member
Mr Gary ELLIS Member
Mr Jim ELLIS Member
Mr Peter HOUSE Member
Page 7 of 77

West Coast Institute | Annual Report 2015
Ms Alicia KELLY Member
Mr Laurie KRUIZE Member
Professor Arshad OMARI Member
Mr Michael SCOTT Member
Remuneration 2015 Table 1.1 2015 Governing Council Remuneration
Position Name Type of remuneration Period of Membership Gross remuneration 2015 financial year
Chair Russel Perry Annual ceased 30/06/2015 9558.57
Graham Droppert Annual 1/07/2015 9854.91
Deputy Chair Graham Droppert Sessional 29/06/2012 2472
Julie Quinlivan Sessional 1/07/2015 4362
Member Kristy Brittain Sessional 10/12/2013 2943
Zoe Clune Sessional 10/12/2013 2943
James (Jim) Ellis Sessional 1/07/2015 830
Peter House Sessional 1/07/2015 1811
Alicia Kelly Sessional 1/07/2015 1484
Arshad Omari Sessional 10/12/2013 2792
Michael Scott Sessional 1/07/2015 830
Kim Allen Sessional ceased 30/06/2015 1635
Cate Brodie Sessional ceased 30/06/2015 1308
Paul Darcy Sessional ceased 30/06/2015 327
Gary Ellis Sessional ceased 30/06/2015 654
Laurie Kruize Sessional ceased 30/06/2015 1962
Functions The functions of the Institute Governing Council are specified under Section 42 of the Vocational Education and Training Act 1996. The Governing Council is the governing body of the Institute, with authority in the name of the Institute to perform the functions of the Institute and govern its operations and affairs. In performing its functions the Governing Council is to: • Prepare the Institute training profile for the approval of the Minister as and when required. • Develop and implement strategic and management plans for the Institute. • Ensure the Institute courses, programs and services are responsive to, and meet the needs of, students,
industry and the community.
Page 8 of 77

West Coast Institute | Annual Report 2015
• Ensure that the Institute’s commitments, under its Resource Agreement and any other contractual
agreements, are met.
Accountability and Transparency The Accountable Authority for West Coast Institute of Training is the Governing Council. Members are expected to act honestly and to exercise due diligence in managing the business of the Institute. The Council has independence to determine policies and activities to the provisions made in the Vocational Education and Training Act 1996 and other Statute Law. The Council conducted six meetings during the calendar year. All documentation produced by the Council is transparent and forms part of public record in compliance with provisions of the General Retention and Disposal Schedules, established by the Records Office of the State Archives Western Australia.
Behaviour and Ethics The Governing Council places the highest value on ethical behaviour. It is guided by the Codes of Conduct and Ethics (3.5) outlined in the ‘Guide for TAFE College Governing Councils’ and ‘West Coast Institute Code of Conduct’. The adoption and application of the Governing Council codes and ethics reflects the Institute’s commitment to honesty and integrity in all of its dealings.
Risk Management The Governing Council meets legislative and business requirements by progressively developing and reviewing risk management policies in accordance with Treasury Instruction 825.
The Institute’s Governance committee, made up of representatives of Governing Council, the Public Sector Commission and the Institute’s Corporate Executive, regularly review the Institute’s Governance framework to ensure adherence to legislative and business requirements, resulting in Risk Management Framework, Business Continuity Plan and associated Policy and Procedure being updated where required.
Conflict of Interest and Pecuniary Interest The Council operates in accordance with the protocol for conflict of interest outlined in the ‘Guide for TAFE College Governing Councils’. While acting in the capacity of Council member, Council members place public interest above personal interest. If a matter being considered is identified as a potential conflict of interest, the member may not be present at the discussion of the matter and does not vote on the matter. This includes any case where a member or associated entity may benefit from the Council’s decision. No conflict of interest was reported during 2015.
“ I’ve gained so much confidence through my traineeship. I also owe a lot of thanks to my lecturers for getting me where I am today. They have taught me so many different skills and strategies to work with young children.” Emma Grant 2015 Student of the Year
Page 9 of 77

West Coast Institute | Annual Report 2015
Organisational Structure
Minister Training and Workforce Development
West Coast Institute Governing Council
West Coast Institute Managing Director
General Manager Industry Skills Training
Executive Director Hospitality & Trades
Executive Director Education and Social
Sciences
Director Technology &
Commerce
Director Health Sciences
General Manager Student & Business
Services
Executive Director eBusiness
Manager Finance
Manager Workforce Services
Manager Student Services
Manager Facilities &
Sustainability
Executive Director Strategic & Business
Development
Director Marketing & Business
Development
Manager Continuous
Improvement
Page 10 of 77

West Coast Institute | Annual Report 2015
Senior Leadership
Michelle Hoad, Managing Director
With over 20 years’ experience in the education and training sector in regional and metropolitan Western Australia, Michelle brings a wealth of knowledge, insight and an innovative approach as the Institute’s Managing Director.
With a background in organisational psychology Michelle is passionate about the role of education and training in supporting individuals to achieve their potential and assisting enterprises to build their workforce capacity to increase productivity. Michelle is currently Chair of the Joondalup Learning Precinct board.
Norman Baker, General Manager – Industry Skills Training
Norman has been employed by the Institute for over a decade in a number of roles and he is responsible for overseeing the academic directorates of Hospitality & Trades; Education and Social Sciences; Technology and Commerce; and Health Sciences.
He is an experienced Senior Executive within the WA Public Sector who has had extensive VET management experience both internationally and within Western Australia.
Russell Coad, General Manager – Student & Business Services
As General Manager of Student & Business Services for the past 12 years, Russell is responsible for assessing the student administration and technical support services
Russell spent 13 years teaching secondary mathematics, 5 years as an independent school Principal and 19 years in the VET sector as an administrator.
Brett Dorney, Executive Director – Strategic & Business Development
As the Executive Director for Strategic & Business development Brett provides strategic leadership and management to initiate, facilitate and build on innovative practices directly impacting business growth across West Coast Institute.
Brett brings over 30 years of experience and knowledge in the areas of leadership and management, in both the State and Commonwealth Government service, to the Institute.
Page 11 of 77

West Coast Institute | Annual Report 2015
Overview The Institute provides vocational training and higher education locally, nationally and internationally to meet the demands of industry, enterprise, schools, individuals and the community. The Institute has six Academies of Excellence that are at the forefront of industry led training:
• Aboriginal Academy of Sport, Health and Education • Academy of Digital Technologies • Academy of Health Sciences • Academy of Hospitality and Culinary Arts • International Academy of Law Enforcement and Security • Trades North
West Coast delivers over 120 qualifications from Certificate I to Associate Degrees via on-campus, online or on the job training across the following study areas. Table 1.2 WCIT delivery areas
Commerce Accounting & Finance
Business & Management
Human Resources
Marketing
Police Preparation
Project Management
Retail Management
Security, Risk Management & Investigations
Spoken & Written English
Work Health & Safety
Technology Information & Communication
Technology
Multimedia & Animation
Software Development
Website Design
Hospitality Commercial Cookery
Events Hospitality Retail Baking
Trades Automotive Bricklaying Carpentry Conservation & Horticulture
Electrotechnology Metal Fabrication
Tiling & Solid Plastering
Health Sciences Allied Health Beauty Fitness Nursing
Health Services Mental Health
Education Access to Education
Early Childhood Education &
Care
Education Support
Social Sciences Community Services
Entertainment Training & Assessment
Youth Work
In 2015 West Coast Institute:
• Delivered 1.96 million state funded student curriculum hours (SCH) and 2.57 million SCH in total
• Had approximately 250 full-time equivalent academic and support staff to help its students and clients meet their professional and personal goals
• Had an operating budget of approximately $42 million
• Earned a commercial revenue of $5.86 million
Page 12 of 77

West Coast Institute | Annual Report 2015
Section Two: Strategic Plan 2013 - 2015 Our Vision To be the first choice of students and industry.
Our Role Through industry and community partnerships, West Coast Institute will provide world-class training for:
• Sustainable employment. • Workforce development. • Achieving personal aspirations.
Our Goals West Coast Institute’s major goals are to:
• Address the skills requirements of individuals and industry. • Enhance our customers’ experience. • Ensure our operations are sustainable.
Our Values Ethics - We will behave in a manner that demonstrates respect for one another and display honesty, fairness and integrity in all that we do. Accountability - We are responsible for our own actions. We will demonstrate social, financial and environmental responsibility to stakeholders. Continuous Improvement - We believe in investment in technology, resources and people and do this in order for the Institute to evolve. Customer Satisfaction - We believe in building and nurturing relationships that meet the needs and expectations of our internal and external customers. The West Coast Way To achieve success, the Institute must continue to develop training that is characterised by being: Resourceful - particularly in maximising the use of existing resources, such as existing industry equipment and facilities for the delivery of training products and services. Agile - particularly, in finding ways of delivery of training products and services in a mode, manner and time to suit student and customer needs. Partnered - delivery in partnership to improve the bottom line of all clients whether in industry, enterprise, the community or as an individual, frequently enhanced by other partnerships with other Institute Divisions, State Training Providers, higher education institutions and private providers.
Page 13 of 77

West Coast Institute | Annual Report 2015
Section Three: Report on 2015 Business Plan The following provides an outline of activities undertaken against the approved 2015 Business Plan. Priorities
1 Address the skills requirements of individuals and industry Increase the number of marginalised students undertaking training Increase the number of students undertaking training in skill shortage areas Learning reflects contemporary industry practice
KPI: EBT activity increases by 5% Increase of 5% in SCH delivered to marginalised students Course completions > 75%
2015 Outcomes;
EBT activity increased by 8% Marginalised students activity increased by 4.9% Course completions were 79.6%
2 Enhance our Customers’ experience
Engage with our customers via their chosen medium Provide customer focussed processes Deliver engaging and flexible training and assessment experiences to our customer
KPI: Student satisfaction survey (AQTF) ≥ 90% Employer satisfaction survey (AQTF) ≥ 90% MLCR = 80%
2015 Outcomes;
Student satisfaction survey (AQTF) - 93% Employer satisfaction survey (AQTF) - 100% MLCR - 79.8%
3 Ensure all operations are sustainable
Operate within an overarching governance framework Manage the triple bottom line Conduct daily operations more efficiently
KPI: Fee for Service activity surplus of at least 15% annually Cash reserve is greater than 60 days. Adjusted operating result is within +/- 3%
2015 Outcomes;
Fee for Service activity surplus is 14.87% Cash reserve is 153.4 days. Adjusted operating result is 1%
Page 14 of 77

West Coast Institute | Annual Report 2015
Compliance Reporting
Staff development Professional and staff development needs are aligned with Institute and Directorate business plans. Staff relate their developmental needs against the Institute’s Strategic Plan and the Branch Operational Plan and give effect to these needs through the performance development and public sector compliance processes. This ensures that staff training is strategic, relevant and ensures that training resource expenditure is monitored. To enable the Institute to meet its public sector obligations a number of professional development and compliance programs were conducted in 2015, these include:
• Development of online sessions including Discrimination & EEO, OSH Awareness, Cultural Competence, Records Awareness, Public Interest Disclosure, Mandatory Reporting for Child Sex Abuse (for lecturers) and Accountable & Ethical Decision Making.
• Staff selection skills for panel members. • Senior first aid. • Manual handling. • Fire warden and extinguisher training. • Code of conduct workshops.
The West Coast Leadership Program and a variety of other targeted training programs were successfully delivered in 2015. The Teaching and Learning Consultant continues to work with lecturers to develop teaching and learning competencies.
Legislative environment West Cost Institute of Training complies with the following relevant legislation:
• Archive Act 1983, Commonwealth. • Classification Enforcement Act 1996. • Commercial Tenancy (Retail Shops) Agreements Act 1985. • Copyright Act 1968, Commonwealth. • Corruption and Crime Commission Act 2003. • Disability Services Act 1993. • Education Service Providers (Full Fee Overseas Students) Registration Act 1991. • Education Services for Overseas Students Act 2000, Commonwealth. • Electoral Act 1907. • Equal Opportunity Act 1984. • Financial Management Act 2006. • Freedom of Information Act 1992. • Government Employees Superannuation Act 1987. • Higher Education Support Act 2003, Commonwealth. • Income Tax Assessment Act 1997. • Industrial Relations Act 1979. • Library Board of Western Australia Act 1951. • Minimum Conditions of Employment Act 1993. • Occupational Safety and Health Act 1984. • Privacy Act 1988, Commonwealth. • Public Interest Disclosure Act 2003. • Public Sector Management Act 1994. • Spam Act 2003, Commonwealth. • State Records Act 2000. • State Supply Commission Act 1991. • Statutory Corporations (Liability of Directors) Act 1996. • Vocational Education and Training Act 1996. • Workers’ Compensation and Injury Management Act 1981. • Working with Children (Criminal Record Checking) Act 2004. • Workplace Relations Act 1996, Commonwealth. • Workforce Reform Act 2014.
Page 15 of 77

West Coast Institute | Annual Report 2015
Industrial relations The Institute through its Joint Staff Consultative Committee, in accordance with the WA TAFE Lecturers’ Certified Agreement 2014 and the Public Service and Government Officers General Agreement 2014, has provided opportunity for the discussion and resolution of matters that impact on workplace issues. A number of matters have been resolved through consultation and negotiation. Targeted training activities, development of tools for lecturers and amendments to various policies and procedures continue to be made. The focus has been to provide them with as much information and support as possible to assist in managing often complex HR/IR issues. A number of information sessions on a range of IR topics have been held with positive feedback received. 20 voluntary severances were offered and accepted by selected employees. This process was managed in accordance with the Redeployment and Redundancy Regulations and included open and transparent communication with employees and the relevant Unions.
Public Sector Standards and Ethical Codes The Institute is committed to ensuring compliance and ‘best practice’ requirements of the Public Sector Standard in Human Resource Management, the Public Sector Code of Ethics and the Institute’s Code of Conduct. Human Resources (HR) policies and procedures are regularly reviewed and updated to ensure compliance with Public Sector Standards. All staff have access to HR policies and procedures – including policies that relate to recruitment, selection and appointment, transfer, secondment, temporary deployment and grievance resolution – through the Institute Intranet and via email communication from the Workforce Services Branch. Maintaining awareness of the Public Sector Standards and Code of Conduct is achieved through staff training, newsletters, staff meetings, email communication and the Institute Intranet. The Institute Code of Conduct was reviewed in 2015. All new staff complete an online induction program, including information concerning the Code of Conduct and Ethics through the Accountable and Ethical Decision Making (AEDM) awareness modules. As required under Section 31 of the Public Sector Management Act 1994, the Institute has complied with its reporting requirements to the Office of Public Sector Standards in relation to Public Sector Standards, Codes of Ethics and its Code of Conduct. One breach claim was lodged (Employment Standard) under the Public Sector Human Resource standards but was not upheld. No breaches of the Public Sector Code of Ethics were alleged. No Grievances were recorded during the reporting period. There were two disciplinary matters managed during the reporting period, both related to the Institute’s Code of Conduct. Actions taken to monitor, improve and ensure compliance included:
• Information about Standards and Codes are included on agency intranet and in induction materials. Information sessions are also presented.
• A continued cultural transformation process has been implemented to engage staff in working with shared values in an organisation that is Values Driven.
• Implementation of Accountable and Ethical Decision Making (AEDM) online awareness modules is ongoing.
• Code of Conduct workshops are conducted biannually for all staff
Public disclosures The Public Interest Disclosure Act 2003 came into effect on 1 July 2003, requiring the Institute to:
• Facilitate the disclosure of public interest information. • Provide protection for those making disclosures. • Provide protection for those who are the subject of a disclosure.
In accordance with the Act, the Institute appointed two Public Interest Disclosure (PID) Officers and has published internal policies and procedures related to its obligations. There was one PID application received for the reporting period. Allegations made were not substantiated.
Page 16 of 77

West Coast Institute | Annual Report 2015
Corruption prevention In line with the Institute’s policy and procedures seeking staff to prevent fraud and corruption, Accountable and Ethical Decision Making online awareness modules are undertaken by staff on joining the organisation and then every 5 years. In addition in 2015, training sessions were presented to managers and staff on Code of Conduct issues. There was one reported incident during the reporting period with a reprimand letter placed on the respondent’s personnel file.
Risk management
To ensure an ongoing focus on Risk Management the Institute has embedded risk management within its planning framework and the business case process and procedures required for any significant investment.
The Institute’s Governance committee, made up of representatives of Governing Council, the Public sector Commission and the Institute’s Corporate Executive, regularly review the Institute’s Governance framework to ensure adherence to legislative and business requirements, resulting in Risk Management Framework, Business Continuity Plan and associated Policy and Procedure being updated where required. Risk Management reviews are also integrated into the annual Business Planning Process. Sections will review plans annually with assistance available from the Institutes Project Coordinator as required. Significant Issues Impacting WCIT The introduction of the new Standards for Registered Training Organisations in April 2016, led to additional one-off activity in redesigning practices, procedures and forms to accommodate the largely administrative changes required to ensure compliance with the new standards. Changes to Commonwealth requirements, such as the introduction of the Unique Student Identifier (USI) and VET FEE help, created pressure on the Institute to adopt new administrative practices within a very short time frame and limited resources. Similarly, the rapidity with which changes to the pre-apprenticeship delivery model were made in regard to the treatment and funding of work experience placements, resulted in some initial confusion in Semester One 2016 and involved reworking of training delivery plans and timetables.
Director and Officer’s liability In 2015, the Institute paid an insurance premium of $10,043 to indemnify any ‘director’ (as defined in Part 3 of the Statutory Corporations (Liability of Directors) Act 1996) against a liability incurred under sections 13 or 14 of that Act.
Breach of Credit Card use The accountable authority may arrange for a WA Government credit card to be issued to officers and other authorised persons engaged by the agency in performing their functions.
Table 3.1: Credit Card Breaches 2015. Reporting Period 1 January 2015 to 31 December 2015
Personal expenditure under Treasurer's instruction 321 'Credit Cards - Authorised Use': a) the number of instances the WA Gov Purchasing Card has been used for a personal purpose; 3 b) the aggregate amount of personal use expenditure for the reporting period; $81.60 c) the aggregate amount of personal use expenditure settled by the due date; $81.60 d) the aggregate amount of personal use expenditure settled after the period required by paragraph (c); NIL e) the aggregate amount of personal use expenditure outstanding at the end of the reporting period; NIL f) the number of referrals for disciplinary action instigated by the notifiable authority during the reporting period NIL
Page 17 of 77

West Coast Institute | Annual Report 2015
Staff profile Table 3.2: Staffing numbers comparison from 2011 to 2015.
2011 %
Total FTE
2012 %
Total FTE
2013
%
Total FTE
2014
%
Total FTE
2015
%
Total FTE
FTE for year 309.11 299.14 286.15 277.46 249.88
Academic Delivery 166.53 53.87 167.67
56.05 165.31 57.77 151.94 54.76 136.06 54.45
Academic Support Services
52.7 17.05 55.63 18.60 51 17.82 21.6 7.8 32.8 13.12
Corporate Services
81.78 26.46 72.84 24.35 67.84 23.71 100.92 36.37 81.02 32.42
Unattached/Redeployees 0.5 0.16
3.0
1.00 2.0 0.06 3.0 1.1 0 0
Host Funded Positions Small Business
7.6*** 2.46 0 0 0 0 0 0 0 0
Workforce Data taken from West Coast Institute Electronic Information Management System and Empower HRMIS NB: Information provided as at December 2015. FTE figures can vary across the year by +/- 10% due to training demand fluctuations. Overall, FTE declined (9.9%) as a result of a decrease in funded activity via the Delivery and Performance Agreement. The shifts in FTE from Academic Support to Corporate Services reflect changes to reporting lines. In addition, there were 20 voluntary severances further reducing staff numbers. Statement of commitment to occupational safety and health and injury management The Institute’s Corporate Executive continues to commit to occupational safety and health and injury management through endorsement of a yearly Occupational Safety and Health (OSH) Business Plan.
The Executive treat OSH as a priority, having an Executive Director as a member of the OSH Committee and ensuring staff understand their responsibilities and are trained appropriately. The Institute was presented with the WorkSafe Gold Award this year, having met the standards expected at this level.
Support is given to staff through the Employee Assistance Program, training opportunities including the Mental Health First Aid Program and the Institute’s Wellness Program.
Workforce Services has been allocated with responsibility for the management of Workers Compensation and injury management within the Institute.
Formal mechanism for consultation with employees on occupational safety and health matters The Institute’s OSH Committee is the peak consultative forum for OSH in the Institute and met eight times throughout 2015. The Committee consists of all OSH representatives, a corporate executive member and management representatives
Incident trends are captured and reported to the OSH Committee where appropriate actions are considered and remedial action recommended. The committee also reviews budget and OSH Plan progress at each meeting.
A specialist OSH sub-committee operates at the Clarkson campus reflecting the higher level of risk associated with trades training.
OSH representatives consult with management in the investigation of incident reports and the recommendations for improvement of safety systems within their own areas of responsibility and the Institute in general.
The Institute currently has 19 trained OSH reps with refresher training available in 2016 for reps that have not had training in the last two years.
Page 18 of 77

West Coast Institute | Annual Report 2015
Statement of compliance with injury management requirements of the Workers’ Compensation and Injury Management Act 1981 including the development of return to work plans The Institute complies with injury management requirements and coordinates Return to Work programs. Policies and procedures are available on the Intranet.
Occupational safety and health management system The Institute has a documented safety and health management system that is communicated to staff through inductions, information sessions and is displayed on our Intranet for all staff members to view.
It documents responsibilities of management, staff, OSH Reps and Floor Wardens.
A full WorkSafe Plan Audit was conducted in June 2015 by Switched onto Safety (SOS), which resulted in a very positive report. Management commitment, planning, and training and supervision rated very highly.
WorkSafe awarded the Institute Gold Achievement Status after consideration of the report and analysis of our injury performance statistics.
Training for managers and supervisors is conducted annually, together with a variety of OSH related sessions for all staff throughout the year.
Table 3.3: Report of performance against the following targets Measure Actual results Results against Target
2014 2015 Target Comment on Result
Number of fatalities 0 0 Zero (0)
Lost time injury/disease (LTI/D) incidence rate
1.05% 0.36% Zero (0) or 10% improvement on the previous three (3) years
2 claims lodged 1 claim declined Result based on the 1 claim accepted
Lost time injury severity rate
0 0 Zero (0) or 10% improvement on the previous three (3) years
1 claim at 29.3 days only
Percentage of injured workers returned to work within
(i) 13 weeks and
(ii) 26 weeks
100%
100%
100%
NA
Greater than or equal to 80% return
Calculation based on 2015 claims lodged
Percentage of managers and supervisors trained in occupational safety, health and injury management responsibilities
85% (28/33)
80% Greater than or equal to 80%
OSH training included in Induction for new employees. Manager & supervisors to undertake refresher training every 2 years
4 Workers Compensation cases – 3 remaining open
• Shoulder strain – open (recurrence 2014) • Shoulder strain - open (2014) • Hernia – open (2016) • Stress – declined (2014)
Page 19 of 77

West Coast Institute | Annual Report 2015
8 Incident reports • 5 trips/falls • Falling objects from high shelf • Shoulder strain • Back pain
Ergonomic Assessments
Workforce Services provide ergonomic assessments which are available to all staff to assist in the prevention of office overuse injuries.
63 ergonomic assessments were conducted in 2015. 15 staff required specific ergonomic equipment.
Equal Employment Opportunity, Equity, Access & Diversity The Institute continues to address the Government’s priority to enhance diversity within the Public Sector. During the reporting period the Institute met its reporting obligations under equity based legislative and public sector management requirements. In accordance with Public Sector Commission requirements a Workforce Development Plan was developed which has integrated Equal Employment Opportunity (EEO) management initiatives. Developing an understanding and appreciation of cultural diversity and ethics is achieved through staff induction, professional development training and cultural awareness training. A range of policies and documentation including access to training and development guidelines, access and equity policy, grievance management processes, our Code of Conduct and performance management systems all have equity and diversity principles embedded in their scope. As part of the Institute’s EEO management, it has complied with the Department of Premier and Cabinet’s reporting requirements under Minimum Obligatory Information Requirements (MOIR).
Substantive Equality In accordance with the Government’s Policy Framework for Substantive Equality, the Institute has structures in place to monitor policies and processes that impact Aboriginal persons, people with disabilities and ethnic minorities. With an objective of substantive equality the Institute has committed and deployed significant human resources to give effect to substantive equality. This is undertaken through the roles of our Aboriginal Liaison Officer and Disability Services Officer.
Disability Services West Coast Institute continues to strive to improve access and inclusion for all students with a disability. West Coast is committed to promoting inclusive teaching practices to help overcome some of the difficulties experienced by students with a disability. West Coast updated their Disability Access and Inclusion Plan to include outcome seven. Disability Access and Inclusion Plan (DAIP) outcomes: People with disabilities have the same opportunities as other people to access the services of, and any events organised by, a public authority.
• Disability support staff have a visible presence at enrolments so that students can be made aware of the support that is available to them.
• The Inclusion of an interpreter for deaf students at a number of events • Provide students with a one shop stop support centre which has staff available to provide advice,
tutoring and support from 8:30am – 4:30pm daily
People with disabilities have the same opportunities as other people to access the buildings and other facilities of a public authority.
• As part of the major refurbishment to the McLarty campus a universal access ramp from administration to the canteen has been installed. Additionally, other activity at the campus included building a Universal Access Toilet in the Common Room toilet section, built ramps from car parks to enable wheelchair bound people access to every building from any location on the McLarty campus and also increased the number of ACROD permit parking bays.
Page 20 of 77

West Coast Institute | Annual Report 2015
• Servicing of lifts. • Grounds Maintenance especially at McLarty to ensure that there are no hazards.
People with disabilities receive information from a public authority in a format that will enable them to access the information, as readily as other people are able to access it.
• Conducted an audit of the Institute website and redevelopment to meet Web Content Accessibility Guidelines (WCAG) level AA rating. The Institute’s website accessibility rating is now ranked as good.
• Ongoing provision of materials books/texts, lesson notes and course information in the format most suited to the students’ needs.
• Increased provision of materials in electronic format, including online access to videos, journals and e-books.
• Interpreting services provided for two deaf students who attended and completed their course.
People with disabilities receive the same level and quality of service from the staff of a public authority as other people receive from the staff of that public authority.
• Information on the Institute’s Disability Access and Inclusion Plan is included in staff online induction. • Disability Support provides information and support to lecturing staff to assist them to understand
disability awareness and universal access. • Lecturing staff have free access to disability staff to assist in developing more accessible teaching
practices.
People with disabilities have the same opportunities as other people to make complaints to a public authority.
• Complaints forms available in plain English and in alternate formats on request. • Staff are available to assist students who wish to make a complaint. • Institute’s complaints process is published on our website.
People with disabilities have the same opportunities as other people to participate in any public consultation by a public authority.
• Students with disability are part of the Institute’s Disability Action Group. • Student with disability are encouraged to participate in any public consultation undertaken by the
Institute.
People with disability have the same opportunities as other people to obtain and maintain employment with a public authority.
• Recruitment practices are inclusive of and accessible to people with disability. • Continue to implement flexible employment practices.
Recordkeeping Plan The Institute operates within the sector-wide State Training Providers Recordkeeping Plan (RKP). The Institute is a member of the STP Records Management Network which oversees the process of reviewing the policies and procedures and monitoring the implementation of the key areas for improvements. WCI regularly monitors and reviews our record keeping system to ensure efficiency and effectiveness especially due to the increasing number of digital documents registered. The WCI record keeping system -Trim has been upgraded to the new HP Records Manager 8.1 system. Plans are underway to integrate RM8.1 with SharePoint which will deliver compliant records management for SharePoint content and archiving of SharePoint sites. Records Training is offered continually throughout the year either through a one on one session or through the scheduled basic or intermediate level training courses. All new staff need to complete the Records Awareness Training (RAT) which is offered online as part of the Institute’s induction program.
Page 21 of 77

West Coast Institute | Annual Report 2015
Aboriginal Training In consultation with the Aboriginal Employment Education Training Committee (AEETC), the Institute has developed an Aboriginal Training Plan that drives the promotion of training opportunities to the local Aboriginal community. One of the main events held for students is the NAIDOC celebration which in 2015 incorporated the launch of the WCI Reconciliation Action Plan. The WCI Reconciliation Action Plan actively reflects West Coast Institute’s commitment to driving better relationships and, through training, assists to bridge the various gaps between Aboriginal and Torres Strait Islander and non-Aboriginal people. The West Coast RAP incorporates the development of relationships, recognition and respect and looks for opportunities for Aboriginal and Torres Strait Islander people across the organisation and its stakeholders Other notable achievements for the year are; - Aboriginal enrolment days conducted each semester, 6 scholarships awards to Certificate IV or above students, targeted promotional activity highlighting WCI and support services which was played on Noongar Radio and Curtin FM. An advertisement outlining current Aboriginal courses at WCI was published in the Koori Mail. Specific training programs were run with Balga High School in partnership with Subiaco Football club and Yorganup for Grandcarers training. Community Services section held a workshop with 21agencies to discuss collaboration and training.
Electoral Act 1907 Section 175ZE Pursuant to the requirements of section 175ZE of the Electoral Act 1907, the following expenditures were incurred by, or on behalf of, the Institute as shown in the table below. Table 3.4: Expenditure for Advertising and Media Organisations Class of organisation Amount ex
GST Organisation Total
Expenditure in 2015
Advertising Agencies
Market Research Organisations
Nil Nil
Polling Organisations
Nil Nil
Direct Mail Organisations
Nil
Nil
Media Advertising Agencies
$141,842.61 $17,900.00 $10,619.62 $5,622.24
Carat (Mitchell and Partners) Google Facebook Adcorp
$141,842.61 $17,900.00 $10,619.62 $5,622.24
Graham Droppert Michelle Hoad Governing Council Chair Managing Director 15 February 2016 15 February 2016
Page 22 of 77

West Coast Institute | Annual Report 2015
Page 23 of 77

West Coast Institute | Annual Report 2015
Page 24 of 77

West Coast Institute | Annual Report 2015
Page 25 of 77

West Coast Institute | Annual Report 2015
Section Four: Key Performance Indicators
Certification of Key Performance Indicators We hereby certify that the key performance indicators are based on proper records, are relevant and appropriate for assisting users to assess West Coast Institute’s performance, and fairly represent the performance of West Coast Institute for the financial year ended 31 December 2015.
Graham Droppert
Michelle Hoad
Governing Council Chair Managing Director 15 February 2016 15 February 2016
Page 26 of 77

West Coast Institute | Annual Report 2015
Key Performance Indicators Desired Outcome. The provision of vocational education and training services to meet community and industry training needs. The Effectiveness Indicators have been developed to assist in the Institute’s monitoring and management processes, and to enhance accountability to the people of Western Australia. The data is subject to audit under the Financial Management Act 2006.
1. Effectiveness Indicators The effectiveness indicators measured in 2015 were:
• Student satisfaction. • Achievement of Institute profile.
Student Satisfaction Survey The 2015 Student Satisfaction Survey was conducted by Patterson Market Research on behalf of the Department of Training and Workforce Development (DTWD). A summary of the results is available in the publication, 2015 Student Satisfaction Survey West Coast Institute of Training Report, January 2016. The survey measured student perception of the:
• Quality of training. • Quality of assessment. • Student Experiences with training. • Student Experiences with quality of resources.
The WA Student Satisfaction Survey is an annual survey amongst students who are funded under the National Agreement for Skills and Workforce Development. The following student groups have been excluded from the scope of the survey: international full fee paying students, students undergoing training through a school-based program (VET in schools), students who are in a correctional facility and students aged less than 15 years. All data described in this report have been weighted to reflect the total student population based on a combination of student gender (male/female), age group (15-19, 20-29, 30-44, 45+), student status (IBS, EBS) and training provider. Weight cells with a zero count for the population and survey data were removed. A multiple data collection technique was employed, namely mail, online and Computer Assisted Telephone Interviewing. The process involved a two-stage mail-out, and a promotional campaign was undertaken to raise awareness of the survey, and encourage completion. The response rates achieved for West Coast Institute in 2015 are outlined in the table below. The response rate is in line with other similar surveys (NCVER etc.) to this target group (e.g. students) and as such, is considered reliable. Table 4.1: Student Satisfaction Response Rates 2015
West Coast Institute
Population (Usable Records) 3,153 Responses achieved 602 % of students responding 19.1% Overall margin of error 1.1% Confidence Interval 95%
1.1 Overall Student Satisfaction
This information is available in the publication, 2015 Student Satisfaction Survey West Coast Institute of Training Report, January 2016. The key objective of the Institute is to improve student satisfaction with their course experience. The student satisfaction performance indicator compares the number of very satisfied respondents with those who are satisfied, which is expressed as a proportion of the total survey respondents.
Page 27 of 77

West Coast Institute | Annual Report 2015
Table 4.2: Student Satisfaction Rate Trends
The Institute’s student satisfaction target was 90% and in 2015 this was almost achieved. It was pleasing to observe the increase in the overall total of very satisfied students and the Institute will continue to look towards increasing the quality of training provided to students as this is a key determinant of student satisfaction. Graduate Employment Status Given the Institute’s vision ‘To be the first choice of students and industry’ it is appropriate to use measures of employment status as an indicator of success. Table 4.3: Graduate Employment Status Response Rates 2015
West Coast Institute
Population (Usable Records) 2133 Responses achieved 532 % of students responding 24.9% Overall margin of error 3.68% Confidence Interval 95%
No targets for this indicator have been set as graduate destination is beyond the influence and control of the Institute. Table 4.4: Graduate Employment Status Trends.
2011 2012 2013 2014 2015
Employed 79% NA 82% NA 77%
Unemployed 13% NA 10% NA 12%
Not in Labour Force 8% NA 8% NA 11%
1.2 Graduate Satisfaction
Graduate satisfaction trends for West Coast Institute, WA and Australia. Table 4.5: Satisfied with the overall quality of training
2011 2012 2013 2014 2015
West Coast Institute 90% NA 88% NA 86%
Western Australia 90% NA 90% NA 88%
Australia 90% NA 88% NA 88%
2011 2012 2013 2014 2015 State 2015
Satisfied 48% 44.6% 44.4% 49.8% 45.4% 45.3%
Very Satisfied 38% 41.6% 42.7% 38.9% 44.3% 42.5%
Total 86% 86.2% 87.1% 88.7% 89.7% 87.8%
Page 28 of 77

West Coast Institute | Annual Report 2015
Table 4.6: Fully or partly achieving their main reason for training
2011 2012 2013 2014 2015
West Coast Institute 84% NA 84% NA 87%
Western Australia 88% NA 86% NA 88%
Australia 86% NA 84% NA 87%
1.3 Annual Institute Profile Target Achievement
The 2015 Delivery and Performance Agreement (DPA) contracted the Institute to deliver 2,130,000 Student Curriculum Hours (SCH). This purchased delivery by the State from West Coast Institute took into consideration the needs of the state as defined in the State Training Profile and the needs of the key stakeholders of the Institute. The diversity of delivery indicates the extent to which the Institute is required to meet the strategic training needs of the local community, and the training plans of industry and individuals. Measure A: Percentage of Achieved Delivery against Profile Delivery. The distribution of SCH is an effectiveness measure that indicates the extent to which the Institute is meeting its contractual obligations, as well as the training needs of the local community, individuals and industry. The Institute’s SCH delivery is translated through a range of courses that directly align with purchasing matrix cells that represent occupational classifications. This performance indicator shows the percentage of SCH achieved for profile funded VET delivery activities, original DPA target, as contracted with WA Department of Training and Workforce Development (DTWD) through the Delivery and Performance Agreement. Comparing training delivery purchased in the final 2014 DPA (2,277,247 SCH) to training delivery purchased in final 2015 DPA (2,047,193 SCH) the DTWD purchased 10.1% less SCH from the Institute. Additionally the ongoing impact of the Future Skills fees regime led to a decrease in demand from students as the market is still to find equilibrium. The Institute’s 2015 profile delivery (1,968,656 SCH) was 6.9% less than 2014 delivery (2,114,001 SCH) and reflects the combination of a decrease in purchased training delivery and the weaker demand from students. The table below provides a comparative assessment of performance against planned DPA activity, and also actual delivery in 2015. The planning process involves predicting likely demand for activity in early increases and decreases in actual SCH delivered represent unanticipated shifts in demand for training in various occupational areas. These variations highlight the willingness and ability of the Institute to accommodate changes in client demand.
Table 4.7: 2015 Delivery and Performance Agreement 2015 Delivery and Performance Agreement 2014 2015 2015 %
Major Group Sub-Group Achieved Planned Achieved Achieved
1. MANAGERS 11. Chief Executives, General Managers and Legislators
14,515 11,400 7,090 69.04%
12. Farmers and Farm Managers 250 0 1,055
13. Specialist Managers 4,545 800 940 117.50%
14. Hospitality, Retail and Service Managers 22,799 25,360 18,436 72.70%
1. MANAGERS 42,109 37,560 27,521 73.27%
2. PROFESSIONALS 21. Arts and Media Professionals
0 6,537
Page 29 of 77

West Coast Institute | Annual Report 2015
22. Business, Human Resource and Marketing Professionals
39,835 48,780 15,640 32.06%
23. Design, Engineering, Science and Transport Professionals
45,896 48,429 42,487 87.73%
24. Education Professionals 22,240 24,000 17,185 71.69% 26. ICT Professionals 80,072 80,580 67,783 84.12%
27. Legal, Social and Welfare Professionals 68,650 74,680 55,530 74.81%
2. PROFESSIONALS 256,693 276,469 205,162 74.34% 3. TECHNICIANS AND TRADES WORKERS
31. Engineering, ICT and Science Technicians 75,940 94,500 69,050 72.91%
32. Automotive and Engineering Trades Workers 26,918 26,951 20,601 76.44%
33. Construction Trades Workers 91,554 83,209 82,489 99.21%
34. Electrotechnology and Telecommunications Trades Workers
21,114 23,244 28,854 123.05%
35. Food Trades Workers 80,709 74,316 102,938 138.51%
36. Skilled Animal and Horticultural Workers 17,687 16,436 16,832 102.41%
39. Other Technicians and Trades Workers 19,515 20,520 11,035 53.78%
3. TECHNICIANS AND TRADES WORKERS 333,437 339,176 331,799 97.73%
4. COMMUNITY AND PERSONAL SERVICE WORKERS
41. Health and Welfare Support Workers 313,660 320,588 297,060 92.66%
42. Carers and Aides 402,200 357,160 416,911 116.73% 43. Hospitality Workers 25,668 27,060 32,710 120.88%
44. Protective Service Workers 2,530 3,000 2,560 85.33%
45. Sports and Personal Service Workers 184,792 189,672 124,911 65.86%
4. COMMUNITY AND PERSONAL SERVICE WORKERS
928,850 897,480 874,152 97.40%
5. CLERICAL AND ADMINISTRATIVE WORKERS
51. Office Managers and Program Administrators 30,795 27,200 33,050 121.03%
52. Personal Assistants and Secretaries 25,570 20,160 24,505 121.55%
53. General Clerical Workers 112,525 162,960 92,575 56.81% 54. Inquiry Clerks
0 5,820
55. Numerical Clerks 17,670 19,160 12,350 64.46%
59. Other Clerical and Administrative Workers 27,110 26,660 21,770 81.51%
5. CLERICAL AND ADMINISTRATIVE WORKERS
213,670 256,140 190,070 74.14%
6. SALES WORKERS 62. Sales Assistants and Salespersons 16,160 2,600 7,355 282.88%
6. SALES WORKERS 16,160 2,600 7,355 282.88%
Page 30 of 77

West Coast Institute | Annual Report 2015
8. LABOURERS 82. Construction and Mining Labourers 17,314 18,338 31,571 172.16%
83. Factory Process Workers 21,213 27,232 9,504 34.90%
84. Farm, Forestry and Garden Workers 14,662 10,940 28,329 261.00%
85. Food Preparation Assistants 6,040 9,012 9,042 100.33%
89. Other Labourers 75,523 80,873 66,793 82.54% 8. LABOURERS 134,752 146,395 145,239 99.34% G. GENERAL EDUCATION G0. General Education 188,330 174,180 187,190 107.49% G. GENERAL EDUCATION 188,330 174,180 187,190 107.49% TOTAL 2,114,001 2,130,000 1,968,568 92.42%
Table 4.8: Trend data for SCH Achievement.
Attainment of % SCH does not reflect changes to pre-apprentice delivery that DTWD enacted in January 2015 and the final negotiated 2015 Delivery and Performance Agreement – which reflects supply and demand issues within the labour market and the training market is still trying to find equilibrium following the introduction of a new fees regime in 2014. Note: The SCH achievement % is based on the original DPA and not the final agreed figure
2. Efficiency Indicators The efficiency indicator is a measure that shows the average cost of training delivery per student curriculum hour (SCH). 2.1 Overall Cost per SCH The overall cost per SCH shows the aggregate unit cost of delivery output per SCH, based on the delivery costs (Total Cost of Services) as detailed in the 2014 Financial Statements. The cost per SCH for aggregate Institute delivery for 2015 was $16.28. Table 4.9: Overall Cost per SCH.
2011 2012 2013 2014 2015 2015 Section 40 Targets
Total cost of services $42,084,450 $42,858,124 $40,916,890 $41,474,917 $41,885,038 $44,694,752
Total SCH Delivered 3,055,780 3,250,955 2,885,196 2,675,938 2,572,269 2,826,055
Total Cost per SCH delivered
$13.77 $13.18 $14.18 $15.50 $16.28 $15.82
The Total SCH delivered comprises of 603,701 non–profile funded SCH (561,937 SCH in 2014) and 1,968,568 profile funded SCH (2,114,001 in 2014).
The increase in total cost of services, compared to 2014, is largely due to a one off payment for voluntary severances ($1,914,502) which if taken out of the Cost of Services would equate to a Cost/SCH of $15.54. Additionally, changes to pre-apprenticeship delivery funding (introduced by DTWD in early January 2015) resulted in a reduction of 68,000 SCH but not in cost of services – if this was factored in the Institute would see a total cost of service/SCH of $15.14. The discrepancy in the Total cost of services between 2015 actuals and S40 budget can be attributed to delays in construction and refurbishment activity at McLarty campus.
DPA 2011 2012 2013 2014 2015 % SCH Achieved 104.6% 99.87% 106.3% 92.83% 92.42%
Page 31 of 77

West Coast Institute | Annual Report 2015
Section Five: Financial Statements
Certification of Financial Statements for the Year Ending 31 December 2015
The accompanying financial statements of West Coast Institute have been prepared in compliance with the provisions of the Financial Management Act 2006 from proper accounts and records to present fairly the financial transactions for the financial year ended 31 December 2015 and the financial position as at 31 December 2015 At the date of signing we are not aware of any circumstances, which would render the particulars included in the financial statements misleading or inaccurate.
Graham Droppert Michelle Hoad Leighton Beeck Governing Council Chair Managing Director Chief Finance Officer
Page 32 of 77

West Coast Institute | Annual Report 2015
Financial Statements
For the year ended 31 December 2015
Page 33 of 77

West Coast Institute | Annual Report 2015
Financial Statements Certification of Financial Statements For the Year Ended 31 December 2015
The accompanying financial statements of West Coast Institute of Training have been prepared in compliance with the provisions of the Financial Management Act 2006 from proper accounts and records to present fairly the financial transactions for the financial year ended 31 December 2015 and the financial position as at 31 December 2015. At the date of signing we are not aware of any circumstances which would render the particulars included in the financial statements misleading or inaccurate.
LEIGHTON BEECK MICHELLE HOAD GRAHAM DROPPERT Chief Finance Officer Managing Director Governing Council Chair
Page 34 of 77

West Coast Institute | Annual Report 2015
STATEMENT OF COMPREHENSIVE INCOME FOR THE YEAR ENDED 31 DECEMBER 2015 2015 2014 Notes $ $ COST OF SERVICES Expenses Employee benefits expense 6 28,612,500 28,000,128 Supplies and services 7 8,477,255 8,419,396 Depreciation and amortisation expense 8 2,378,821 2,418,353 Cost of sales 13 108,775 156,314 Other expenses 9 2,307,687 2,480,726 Total cost of services 41,885,038 41,474,917
Income Revenue Fee for service 10 5,863,196 5,377,679 Student fees and charges 11 5,845,871 5,317,119 Ancillary trading 12 491,472 498,504 Sales 13 162,033 190,295 Interest revenue 14 636,251 797,733 Other revenue 15 1,037,420 382,745
Total revenue 14,036,243 12,564,075
Gains
Gain on disposal of non-current assets 16 7,603 23,770
Total gains 7,603 23,770
Total income other than income from State Government 14,043,846 12,587,845
NET COST OF SERVICES 31 27,841,192 28,887,072
INCOME FROM STATE GOVERNMENT Service Appropriation 17 25,384,811 26,432,461 Services received free of charge 17 1,049,111 828,745 Total income from State Government 26,433,922 27,261,206
SURPLUS / (DEFICIT) FOR PERIOD (1,407,270) (1,625,866)
OTHER COMPREHENSIVE INCOME Changes in asset revaluation surplus 30 351,140 870,243
Total other comprehensive income 351,140 870,243
TOTAL COMPREHENSIVE INCOME FOR THE PERIOD (1,056,130) (755,623) The Statement of Comprehensive Income should be read in conjunction with the accompanying notes.
Page 35 of 77

West Coast Institute | Annual Report 2015
STATEMENT OF FINANCIAL POSITION AS AT 31 DECEMBER 2015 2015 2014 Notes $ $ ASSETS Current Assets Cash and cash equivalents 31 215,796 3,154,383 Restricted cash and cash equivalents 18,31 1,847,725 49,340 Inventories 19 37,367 38,917 Receivables 20 763,303 558,635 Other financial assets 21,31 14,862,873 15,492,263 Other current assets 22 533,052 342,188
Total Current Assets 18,260,116 19,635,726 Non-Current Assets Restricted cash and cash equivalents 18,31 84,208 - Property, plant and equipment 23 109,198,068 108,162,180 Intangible assets 25 7,196 39,622
Total Non-Current Assets 109,289,472 108,201,802 TOTAL ASSETS 127,549,588 127,837,528
LIABILITIES Current Liabilities Payables 27 607,176 1,482,528 Provisions 28 3,361,685 4,109,072 Other current liabilities 29 955,734 1,408,497 Total Current Liabilities 4,924,595 7,000,097 Non-Current Liabilities Provisions 28 1,815,725 1,442,033 Total Non-Current Liabilities 1,815,725 1,442,033 Total Liabilities 6,740,320 8,442,130
NET ASSETS 120,809,268 119,395,398 Equity Contributed equity 30 57,586,140 55,116,140 Reserves 30 38,506,860 38,155,720 Accumulated surplus 30 24,716,268 26,123,538 TOTAL EQUITY 120,809,268 119,395,398 The Statement of Financial Position should be read in conjunction with the accompanying notes.
Page 36 of 77

West Coast Institute | Annual Report 2015
STATEMENT OF CHANGES IN EQUITY FOR THE YEAR ENDED 31 DECEMBER 2015
Contributed equity Reserves
Accumulated surplus / (deficit)
Total Equity
Note $ $ $ $ 30
Balance at 1 January 2014 53,269,085 37,285,477 27,749,404 118,303,966 Surplus/(deficit) (1,625,866) (1,625,866) Other comprehensive income 870,243 870,243 Total comprehensive income for the period 870,243 (1,625,866) (755,623) Transactions with owners in their capacity as owners
Other contributions by owners 1,847,055 1,847,055 Total 1,847,055 1,847,055
Balance at 31 December 2014 55,116,140 38,155,720 26,123,538 119,395,398
Balance at 1 January 2015 55,116,140 38,155,720 26,123,538 119,395,398 Surplus/(deficit) (1,407,270) (1,407,270) Other comprehensive income 351,140 351,140 Total comprehensive income for the period 351,140 (1,407,270) (1,056,130) Other contributions by owners 2,470,000 2,470,000 Total 2,470,000 2,470,000 Balance at 31 December 2015 57,586,140 38,506,860 24,716,268 120,809,268
The Statement of Change in Equity should be read in conjunction with the accompanying notes.
Page 37 of 77

West Coast Institute | Annual Report 2015
STATEMENT OF CASH FLOWS FOR THE YEAR ENDED 31 DECEMBER 2015 2015 2014 Notes $ $
CASH FLOWS FROM STATE GOVERNMENT Service Appropriation - Department of Training and Workforce Development 24,863,831 27,310,663
Net cash provided by State Government 24,863,831 27,310,663
Utilised as follows: CASH FLOWS FROM OPERATING ACTIVITIES Payments Employee benefits (29,210,728) (29,122,584) Supplies and services (8,033,837) (7,623,611) GST payments on purchases (862,004) (952,863) Other payments (2,391,445) (2,603,623) Receipts Fee for service 5,783,893 5,856,342 Student fees and charges 5,506,389 5,320,965 Ancillary trading 492,852 497,735 Commonwealth grants and contributions - 15,035 Interest received 759,378 706,956 GST receipts from sales 153,175 155,641 GST receipts from taxation authority 633,280 773,082 Other receipts 1,227,652 555,783
Net cash (used in) operating activities 31 (25,941,395) (26,421,142) CASH FLOWS FROM INVESTING ACTIVITIES Proceeds from the sale of non-current physical assets 4,112 16,357 Purchase of non-current physical assets (611,932) (1,712,125)
Net cash (used in) investing activities (607,820) (1,695,768) Net increase / (decrease) in cash and cash equivalents (1,685,384) (806,247)
Cash and cash equivalents at the beginning of period 18,695,986 19,502,233 CASH AND CASH EQUIVALENTS AT THE END OF PERIOD 31 17,010,602 18,695,986 The Cash Flow Statement should be read in conjunction with the accompanying notes.
Page 38 of 77

West Coast Institute | Annual Report 2015
1. Australian Accounting Standards (a) General
The Institute's financial statements for the year ended 31 December 2015 have been prepared in accordance with Australian Accounting Standards. The term ‘Australian Accounting Standards' refers to Standards and Interpretations made by the Australian Accounting Standards Board (AASB).
The Institute has adopted any applicable, new and revised Australian Accounting Standards from their operative dates.
(b) Early adoption of standards
The Authority cannot early adopt an Australian Accounting Standard unless specifically permitted by TI 1101 Application of Australian Accounting Standards and Other Pronouncements. Partial exemption permitting early adoption of AASB 2015 7 Amendments to Australian Accounting Standards – Fair Value Disclosures of Not for Profit Public Sector Entities has been granted. Aside from AASB 2015-7, there has been no early adoption of any other Australian Accounting Standards that have been issued or amended (but not operative) by the Authority for the annual reporting period ended 31 December 2015.
2. Summary of significant accounting policies
The following accounting policies have been adopted in the preparation of these financial statements. Unless otherwise stated, these policies are consistent with those adopted in the previous year.
(a) General Statement The financial statements constitute general purpose financial statements which have been prepared in accordance with the Australian Accounting Standards, the Framework, Statements of Accounting Concepts and other authoritative pronouncements of the AASB as applied by the Treasurer’s Instructions. Several of these are modified by the Treasurer’s Instructions to vary application, disclosure, format and wording.
The Financial Management Act 2006 and the Treasurer’s Instructions impose legislative provisions governing the preparation of financial statements and take precedence over the Accounting Standards, the Framework, Statements of Accounting Concepts and other authoritative pronouncements of the AASB.
Where modification is required and has had a material or significant financial effect upon the reported results, details of that modification and the resulting financial effect are disclosed in the notes to the financial statements.
(b) Basis of Preparation
The financial statements have been prepared on the accrual basis of accounting using the historical cost convention, except for land and buildings which have been measured at fair value.
The accounting policies adopted in the preparation of the financial statements have been consistently applied throughout all periods presented unless otherwise stated.
The financial statements are presented in Australian dollars ($).
Note 3 ‘Judgements made by management in applying accounting policies’ discloses judgements that have been made in the process of applying the Institute’s accounting policies resulting in the most significant effect on amounts recognised in the financial statements. Note 2 Summary of significant accounting policies continued
Note 4 ‘Key sources of estimation uncertainty’ discloses key assumptions made concerning the future, and other key sources of estimation uncertainty at the end of the reporting period, that have a significant risk of causing a material adjustment to the carrying amounts of assets and liabilities within the next financial year. (c) Reporting Entity
The reporting entity comprises the Institute and there are no related or affiliated entities (see also note 39 ‘Related and Affiliated bodies’). (d) Contributed Equity AASB Interpretation 1038 ‘Contributions by Owners Made to Wholly-Owned Public Sector Entities’ requires transfers in the nature of equity contributions, other than as a result of a restructure of administrative arrangements, to be designated by the Government (the owner) as contributions by owners (at the time of, or prior to transfer) before such transfers can be recognised as equity contributions. Capital appropriations have been designated as contributions by owners per TI 955 'Contributions by Owners made to Wholly Owned Public Sector Entities' and have been credited directly to Contributed Equity.
Page 39 of 77

West Coast Institute | Annual Report 2015
Transfer of net assets to/from other agencies, other than as a result of a restructure of administrative arrangements, are designated as contributions by/distributions to owners to where the transfers are non-discretionary and non-reciprocal (see note 30 'Equity'). (e) Income Revenue Recognition Revenue is measured at the fair value of consideration received or receivable. The majority of operating revenue of the Institute represents revenue earned from student fees and charges, fee for service, ancillary services, trading activities and Commonwealth grants and contributions. Sale of Goods Revenue is recognised from the sale of goods and disposal of other assets when the significant risks and rewards of ownership control transfer to the purchaser and can be measured reliably. Provision of services Revenue is recognised by reference to the stage of completion of the transaction. Interest Revenue is recognised as the interest accrues.
Service appropriations
Service appropriations are recognised as revenues at fair value in the period in which the Institute gains control of the appropriated funds. The Institute gains control of appropriated funds at the time those funds are deposited into the bank account. Grants, donations, gifts and other non-reciprocal contributions Revenue is recognised at fair value when the Institute obtains control over the assets comprising the contributions, usually when cash is received. Other non-reciprocal contributions that are not contributions by owners are recognised at their fair value. Contributions of services are only recognised when a fair value can be reliably determined and the services would be purchased if not donated.
Royalties for Regions funds are recognised as revenue at fair value in the period in which the Institute obtains control over the funds. The Institute obtains control of the funds at the time the funds are deposited into the Institute’s bank account
State funds
The funds received from the Department Training and Workforce Development in respect of the delivery of services forming part of the Delivery Performance Agreement are included in State funds, disclosed under ‘Income from State Government’. They are the result of training successfully tendered for under competitive tendering arrangements. This revenue is recognised at nominal value in the period in which the Institute meets the terms of the Agreement. See note 17 ‘Income from State Government’.
Gains
Realised or unrealised gains are usually recognised on a net basis. These include gains arising on the disposal of non-current assets and some revaluations of non-current assets.
(f) Property, Plant and Equipment
Capitalisation/expensing of assets
Items of property, plant and equipment costing $5,000 or more are recognised as assets and the cost of utilising assets is expensed (depreciated) over their useful lives. Where applicable in accordance with TI 1101, the capitalisation threshold has been applied to the aggregate value of a group or network of assets where the cost of individual item may be below the threshold but collectively the cost of the items in the group or network exceeds the threshold. An example of this is the Institute Library Collection where individual items are below the capitalisation threshold but the collection has a long useful life and a material value. Items of property, plant and equipment costing less than $5,000 are immediately expensed direct to the Statement of Comprehensive Income (other than where they form part of a group of similar items which are significant in total)
Initial recognition and measurement
Property, plant and equipment are initially recognised at cost. For items of property, plant and equipment acquired at no cost or for nominal consideration, the cost is their fair value at the date of acquisition.
Page 40 of 77

West Coast Institute | Annual Report 2015
Subsequent measurement
Subsequent to initial recognition of an asset, the revaluation model is used for the measurement of land and buildings and the cost model for all other property, plant and equipment. Land and buildings are carried at fair value less accumulated depreciation on buildings and accumulated impairment losses. All other items of property, plant and equipment are stated at historical cost less accumulated depreciation and accumulated impairment losses.
Where market-based evidence is available, the fair value of land and buildings is determined on the basis of current market values determined by reference to recent market transactions. When buildings are re-valued by reference to recent market transactions, the accumulated depreciation is eliminated against the gross carrying amount of the asset and the net amount restated to the revalued amount.
In the absence of market-based evidence, the fair value of land and buildings is determined on the basis of existing use. This normally applies where buildings are specialised or where land use is restricted. Fair value for existing use assets is determined by reference to the cost of replacing the remaining future economic benefits embodied in the asset, i.e. the depreciated replacement cost. Where the fair value of buildings is determined on the depreciated replacement cost basis, the accumulated depreciation is eliminated against the gross carrying amount of the asset and the net amount restated to the revalued amount. Fair value for restricted use land is determined by comparison with market evidence for land with similar approximate utility (high restricted use land) or market value of comparable unrestricted land less estimated rehabilitation costs (low restricted use land).
Land and buildings are independently valued annually by the Western Australian Land Information Authority (Valuation Services) and recognised with sufficient regularity to ensure that the carrying amount does not differ materially from the asset's fair value at the end of the reporting period.
The most significant assumptions in estimating fair value are made in assessing whether to apply the existing use basis to assets and in determining estimated economic life. Professional judgement by the valuer is required where the evidence does not provide a clear distinction between market type assets and existing use assets. Refer to note 23 'Property, plant and equipment' for further information on revaluations.
De-recognition Upon disposal or de-recognition of an item of property, plant and equipment, any revaluation surplus relating to that asset is retained in the asset revaluation surplus. Asset revaluation surplus The asset revaluation surplus is used to record increments and decrements on the revaluation of non-current assets as described in note 23 ‘Property, plant and equipment’ and note 24 ‘Fair value measurements’. Depreciation All non-current assets having a limited useful life are systematically depreciated over their estimated useful lives in a manner that reflects the consumption of their future economic benefits. Land is not depreciated. Depreciation on other assets is calculated using the straight line method over its useful life, using rates which are reviewed annually. Estimated useful lives for each class of depreciable asset are: Buildings 5 to 40 years Plant, furniture and general equipment 2 to 15 years Computing, communications and software (a) 3 to 15 years Leasehold improvements 5 years Motor vehicle, caravans and trailers 6.67 years (a) Software that is integral to the operation of related hardware Artworks and Library Collections Artworks The Institute’s artworks collection recorded on the Artworks Register is not classified as property, plant and equipment due to the value (currently at 1993 historical cost of $2,973) being immaterial to total property, plant and equipment, and a more current value not being reliably established. Similarly, no depreciation of these is recognised as the useful lives of these items are anticipated to be very long / indefinite, and their service potential has not, in any material sense, been consumed during the reporting period. Library Collection The Institute recognised the Library Collection as a grouped asset from 31 December 2006, requiring the first 100% depreciation of the first year’s (2003) purchases as at 31 December 2009, and following years’ depreciation in subsequent reporting periods. 2010 was the first year where purchases were de-recognised in accordance with the ‘rolling depreciation’ methodology (see note 23). Future years will be treated using the same methodology.
Page 41 of 77

West Coast Institute | Annual Report 2015
(g) Intangible Assets Capitalisation/Expensing of assets Acquisitions of intangible assets and internally generated intangible assets costing $5,000 or more are capitalised. The cost of utilising the assets is expensed (amortised) over their useful life. Costs incurred below these thresholds are immediately expensed directly to the Statement of Comprehensive Income. All acquired and internally developed intangible assets are initially recognised at cost. For assets acquired at no cost or for nominal consideration, the cost is their fair value at the date of acquisition. The cost model is applied for subsequent measurement requiring the asset to be carried at cost less any accumulated amortisation and accumulated impairment losses. Amortisation for intangible assets with finite useful lives is calculated for the period of the expected benefit (estimated useful life which is reviewed annually) on the straight line basis using rates which are reviewed annually. All intangible assets controlled by the Institute have a finite useful life and zero residual value. The expected useful lives for each class of intangible asset are:
Software (a) 2 to 5 years (a) Software that is not integral to the operation of any related hardware.
Computer Software Software that is an integral part of the related hardware is treated as property, plant and equipment. Software that is not an integral part of the related hardware is treated as an intangible asset. Software costing less than $5,000 is expensed in the year of acquisition. Web site costs Web site costs are charged as expenses when they are incurred unless they relate to the acquisition or development of an asset when they may be capitalised and amortised. Generally, costs in relation to feasibility studies during the planning phase of a web site, and ongoing costs of maintenance during the operating phase are expensed. Costs incurred in building or enhancing a web site, to the extent that they represent probable future economic benefits that can be reliably measured, are capitalised. (h) Impairment of Assets
Property, plant and equipment, and intangible assets are tested for any indication of impairment at the end of each reporting period. Where there is an indication of impairment, the recoverable amount is estimated. Where the recoverable amount is less than the carrying amount, the asset is considered impaired and is written down to the recoverable amount and an impairment loss is recognised. Where an asset measured at cost is written down to recoverable amount, an impairment loss is recognised in profit or loss. Where a previously revalued asset is written down to recoverable amount, the loss is recognised as a revaluation decrement in other comprehensive income. As the Institute is a not-for-profit entity, unless an asset has been identified as a surplus asset, the recoverable amount is the higher of an asset’s fair value less costs to sell and depreciated replacement cost.
The risk of impairment is generally limited to circumstances where an asset’s depreciation is materially understated, where the replacement cost is falling or where there is a significant change in useful life.
Each relevant class of assets is reviewed annually to verify that the accumulated depreciation/amortisation reflects the level of consumption or expiration of assets' future economic benefits and to evaluate any impairment risk from falling replacement costs.
Intangible assets with an indefinite useful life and intangible assets not yet available for use are tested for impairment at the end of each reporting period irrespective of whether there is any indication of impairment.
The recoverable amount of assets identified as surplus assets is the higher of fair value less costs to sell and the present value of future cash flows expected to be derived from the asset. Surplus assets carried at fair value have no risk of material impairment where fair value is determined by reference to market-based evidence. Where fair value is determined by reference to depreciated replacement cost, surplus assets are at risk of impairment and the recoverable amount is measured. Surplus assets at cost are tested for indications of impairment at the end of each reporting period.
See note 26 ‘Impairment of assets’ for the outcome of impairment reviews and testing. See note 2(n) ‘Receivables’ and note 20 ‘Receivables’ for impairment of receivables.
(i) Leases
The Institute has no finance leases. The Institute entered into operating lease arrangements for motor vehicles and accommodation. Lease payments are expensed on a straight line basis over the lease term as this represents the pattern of benefits derived from the leased vehicles and properties.
Page 42 of 77

West Coast Institute | Annual Report 2015
(j) Financial Instruments
In addition to cash and cash investment, the Institute has two categories of financial instrument:
• Loans and receivables; and • Financial liabilities measured at amortised cost.
These have been disaggregated into the following classes:
Financial Assets
• Cash and cash equivalents • Restricted cash • Receivables • Other financial assets (cash investment)
Financial Liabilities
• Payables
Initial recognition and measurement of financial instruments is at fair value which normally equates to the transaction cost or face value. Subsequent measurement is at amortised cost using the effective interest method.
The fair value of short-term receivables and payables is the transaction cost or the face value because there is no interest rate applicable and subsequent measurement is not required as the effect of discounting is not material.
(k) Cash and cash equivalents
For the purpose of the Statement of Cash Flows, cash and cash equivalents include restricted cash and cash equivalents. These are comprised of cash on hand and term deposits with original maturities of three to five months that are readily convertible to a known amount of cash and which are subject to insignificant risk of changes in value.
(l) Accrued Salaries
Accrued salaries (see note 27 'Payables') represent the amount due to staff but unpaid at the end of the financial year, as the end of the last pay period for that financial year does not coincide with the end of the financial year. Accrued salaries are settled within a fortnight of the financial year end. The Institute considers the carrying amount of accrued salaries to be equivalent to its fair value. The accrued salaries suspense account (see note 18 'Restricted cash and cash equivalents') consists of amounts paid annually into a suspense account over a period of ten financial years to largely meet the additional cash outlay in each eleventh year when 27 pay days occur instead of the normal 26. No interest is received on this account.
(m) Inventories
Inventories are measured at the lower of cost and the net realisable value. Costs are assigned by the method most appropriate to each particular class of inventory, with the majority being measured on an average cost basis.
Inventories not held for resale are valued at cost unless they are no longer required, in which case they are measured at net realisable value.
See note 19 ‘Inventories’.
(n) Receivables
Receivables are recognised and carried at original invoice amount less an allowance for any uncollectible amounts (i.e. impairment). The collectability of receivables is reviewed on an ongoing basis and any receivables identified as uncollectible are written off against the allowance account. The allowance for uncollectible amounts (doubtful debts) is raised when there is objective evidence that the Institute will not be able to collect the debts. The carrying amount is equivalent to fair value as it is due for settlement within 30 days. See note 2(j) ‘Financial Instruments’ and note 20 ‘Receivables’.
(o) Payables Payables are recognised at the amounts payable when the Institute becomes obliged to make future payments as a result of a purchase of assets or services. The carrying amount is equivalent to fair value, as they are generally settled within 30 days. See note 2(j) ‘Financial Instruments’ and note 27 ‘Payables’.
(p) Provisions Provisions are liabilities of uncertain timing or amount and are recognised where there is a present legal or constructive obligation as a result of a past event and when the outflow of resources embodying economic benefits is probable and a reliable estimate can be made of the amount of the obligation. Provisions are reviewed at the end of each reporting period. See note 28 ‘Provisions’.
Page 43 of 77

West Coast Institute | Annual Report 2015
(i) Provisions - employee benefits
All annual leave and long service leave provisions are in respect of employees’ services up to the end of the reporting period.
Annual Leave
Annual leave is not expected to be settled wholly within 12 months after the end of the reporting period and is therefore considered to be ‘other long term employee benefits’. The annual leave liability is recognised and measured at the present value of amounts expected to be paid when the liabilities are settled using the remuneration rate expected to apply at the time of settlement.
When assessing expected future payments consideration is given to expected future wage and salary levels including non-salary components such as employer superannuation contributions, as well as the experience of employee departures and periods of service. The expected future payments are discounted using market yields at the end of the reporting period on national government bonds with terms to maturity that match, as closely as possible, the estimated future cash outflows. The provision for annual leave is classified as a current liability as the Institute does not have an unconditional right to defer settlement of the liability for at least 12 months after the end of the reporting period. Long Service Leave A liability for long service leave is recognised for employees with over one year’s service, based on remuneration rates current as at the end of the reporting period.
An actuarial assessment of long service leave was undertaken by Price Waterhouse Coopers Actuaries at 31 December 2014 determined that the liability measured using the short hand measurement technique above was not materially different from the liability determined using the present value of expected future payments, and may be conducted for two out-years. This calculation is consistent with the Institute's experience of employee retention and leave taken.
Unconditional long service leave provisions are classified as current liabilities as the Institute does not have an unconditional right to defer settlement of the liability for at least 12 months after the end of the reporting period. Pre-conditional and conditional long service leave provisions are classified as non-current liabilities because the Institute has an unconditional right to defer the settlement of the liability until the employee has completed the requisite years of service.
Sick leave
Liabilities for sick leave are recognised when it is probable that sick leave paid in the future will be greater than the entitlement that will accrue in the future. Past history indicates that on average, sick leave taken each reporting period is less than the entitlement accrued. This is expected to continue in future periods. Accordingly, it is unlikely that existing accumulated entitlements will be used by employees and no liability for unused sick leave entitlements is recognised. As sick leave is non-vesting, an expense is recognised in the Statement of Comprehensive Income for this leave as it is taken
Deferred leave
The provision for deferred leave relates to Public Service employees who have entered into an agreement to self-fund an additional twelve months leave in the fifth year of the agreement. The provision recognises the value of salary set aside for employees to be used in the fifth year. This liability is measured on the same basis as annual leave. Deferred salary is reported as a current provision as employees can leave the scheme at their discretion at any time.
Superannuation
The Government Employees Superannuation Board (GESB) and other funds administer public sector superannuation arrangements in Western Australia in accordance with legislative requirements. Eligibility criteria for membership in particular schemes for public sector employees vary according to commencement and implementation dates.
Eligible employees contribute to the Pension Scheme, a defined benefit pension scheme closed to new members since 1987, or the Gold State Superannuation Scheme (GSS), a defined benefit lump sum scheme also closed to new members since 1995.
Employees commencing employment prior to 16 April 2007 who were not members of either the Pension Scheme or the GSS became non-contributory members of the West State Superannuation Scheme (WSS). Employees commencing employment on or after 16 April 2007 became members of the GESB Super Scheme (GESBS). From 30 March 2012, existing members of the WSS or GESBS and new employees have been able to choose their preferred superannuation fund provider. The Institute makes contributions to GESB or other funds providers on behalf of employees in compliance with the Commonwealth Government’s Superannuation Guarantee (Administration) Act 1992. Contributions to these accumulation schemes extinguish the Institute’s liability for superannuation charges in respect of employees who are not members of the Pension Scheme or GSS.
Page 44 of 77

West Coast Institute | Annual Report 2015
The GSS is a defined benefit scheme for the purposes of employees and whole of government reporting. However, it is a defined contribution plan for Institute purposes because the concurrent contributions (defined contributions) made by the Institute to GESB extinguishes the Institute’s obligations to the related superannuation liability.
The Institute has no liabilities under the Pension or the GSS Schemes. The liabilities for the unfunded Pension Scheme and the unfunded GSS Scheme transfer benefits attributable to members who transferred from the Pension Scheme, are assumed by the Treasurer. All other GSS obligations are funded by concurrent contributions made by the Institute to GESB.
GESB makes all benefit payments in respect of the Pension Scheme and GSS, and is recouped from the Treasurer for the employer’s share. See also note 2(q) ‘Superannuation expense’.
(ii) Provisions –Other
Employment On-Costs
Employment on-costs, including workers’ compensation insurance, are not employee benefits and are recognised separately as liabilities and expenses when the employment to which they relate has occurred. Employment on-costs are included as part of ‘Other expenses’ and are not included as part of the Institute’s ‘Employee benefits expense’. The related liability is included in ‘Employment on-costs provision’ (see note 9 ‘Other expenses’ and note 28 ‘Provisions’).
(q) Superannuation Expense
The superannuation expense in the Statement of Comprehensive Income comprises employer contributions paid to the GSS (concurrent contributions), the West State Superannuation Scheme (WSS), and the GESB Super Scheme (GESBS) and other superannuation funds.
(r) Services Received Free of Charge or for Nominal Cost
Services received free of charge or for nominal cost that can be reliably measured are recognised as income at fair value. Where the resource received represents a service that the authority would otherwise pay for, a corresponding expense is recognised.
Services received from other State Government agencies are separately disclosed under Income from State Government in the Statement of Comprehensive Income.
(s) Comparative Figures
Comparative figures are, where appropriate, reclassified to be comparable with the figures presented in the current financial year. 3. Judgements made by management in applying accounting policies The preparation of financial statements requires management to make judgements about the application of accounting policies that have a significant effect on the amounts recognised in the financial statements. The Institute evaluates these judgements regularly.
Operating lease commitments
The Institute has entered into several commercial leases and has determined that the lessor retains substantially all the significant risks incidental to ownership of the property. Accordingly, the leases have been classified as operating leases.
Valuation of Land and Buildings
Fair value has been determined on a current use valuation for land and depreciated replacement cost valuation for buildings. The Institute has adopted these valuations rather than market values on the assumption that the land and buildings will continue to be used as a State Training Provider.
4. Key sources of estimation uncertainty
Key estimates and assumptions concerning the future are based on historical experiences and various other factors that have a significant risk of causing a material adjustment to the carrying amount of assets and liabilities within the next financial year.
Page 45 of 77

West Coast Institute | Annual Report 2015
Valuation of Long Service Leave Liability Several estimations and assumptions in calculating the Institute’s long service leave provision include expected future salary rates, discount rates, employee retention rates and expected future payments. Changes in these estimations and assumptions may impact on the carrying amount of the long service leave provision. 5. Disclosure of changes in Accounting Policy and Estimates
Initial application of an Australian Accounting Standard
The Institute has applied the following Australian Accounting Standards effective for annual reporting periods beginning on or after 1 January 2015 that impacted on the Institute:
AASB 1055 Budgetary Reporting This Standard requires specific budgetary disclosures in the general purpose financial statements of not-for-profit entities within the General Government Sector. The Authority is required to disclose additional budgetary information and explanations of major variances between actual and budgeted amounts, though there is no financial impact
AASB 2013-9 Amendments to Australian Accounting Standards – Conceptual Framework, Materiality and Financial Instruments Part C of this Standard defers the application of AASB 9 to 1 January 2017. The application date of AASB 9 was subsequently deferred to 1 January 2018 by AASB 2014-1. The Authority has not yet determined the application or the potential impact of AASB 9.
AASB 2014-1 Amendments to Australian Accounting Standards Part A changes consist primarily of clarifications to Accounting Standards and have no financial impact for the Authority. Part B has no financial impact as the Authority contributes to schemes that are either defined contribution plans, or deemed to be defined contribution plans. Part C has no financial impact as the Standard removes references to AASB 1031 Materiality from a number of Accounting Standards
AASB 2014-8
Amendments to Australian Accounting Standards arising from AASB 9 (December 2014) – Application of AASB 9 (December 2009) and AASB 9 (December 2010) [AASB 9 (2009 & 2010)] This Standard makes amendments to AASB 9 Financial Instruments (December 2009) and AASB 9 Financial Instruments (December 2010), arising from the issuance of AASB 9 Financial Instruments in December 2014. The Authority is not currently permitted to early adopt the resultant financial instrument standard and has not yet determined the financial impact of the Standard.
AASB 2015-7 Amendments to Australian Accounting Standards – Fair Value Disclosures of Not for Profit Public Sector Entities [AASB 13] This Standard relieves not-for-profit public sector entities from the reporting burden associated with various disclosures required by AASB 13 for assets within the scope of AASB 116 that are held primarily for their current service potential rather than to generate future net cash inflows. It has no financial impact.
Page 46 of 77

West Coast Institute | Annual Report 2015
Voluntary changes in Accounting Policy There are no voluntary changes in Accounting Policy for the year ending 31 December 2015.
The Institute cannot early adopt an Australian Accounting Standard unless specifically permitted by TI 1101 'Application of Australian Accounting Standards and Other Pronouncements'. Consequently, the Institute has not applied early any of the following Australian Accounting Standards that have been issued that may impact the Institute. Where applicable, the Institute plans to apply these Australian Accounting Standards from their application date:
Operative for reporting periods beginning on / after
AASB 9 Financial Instruments
This Standard supersedes AASB 139 Financial Instruments: Recognition and Measurement, introducing a number of changes to accounting treatments.
The mandatory application date of this Standard is currently 1 January 2018 after being amended by AASB 2012 6, AASB 2013 9, and, AASB 2014 1 Amendments to Australian Accounting Standards. The Authority has not yet determined the application or the potential impact of the Standard.
1 Jan 2018
AASB 15 Revenue from Contracts with Customers
This Standard establishes the principles that the Authority shall apply to report useful information to users of financial statements about the nature, amount, timing and uncertainty of revenue and cash flows arising from a contract with a customer. The mandatory application date of this Standard has been amended by AASB 2015-8 to 1 January 2018. The Authority has not yet determined the application or the potential impact of the Standard.
1 Jan 2018
AASB 2010-7
Amendments to Australian Accounting Standards arising from AASB 9 (December 2010) [AASB 1, 3, 4, 5, 7, 101, 102, 108, 112, 118, 120, 121, 127, 128, 131, 132, 136, 137, 139, 1023 & 1038 and Int 2, 5, 10, 12, 19 & 127]
This Standard makes consequential amendments to other Australian Accounting Standards and Interpretations as a result of issuing AASB 9 in December 2010.
The mandatory application date of this Standard has been amended by AASB 2012 6 and AASB 2014 1 to 1 January 2018. The Authority has not yet determined the application or the potential impact of the Standard.
1 Jan 2018
AASB 2014-1
Amendments to Australian Accounting Standards
Part E makes amendments to AASB 9 and consequential amendments to other Standards. It has not yet been assessed by the Authority to determine the application or potential impact of the Standard.
1 Jan 2018
AASB 2014-3
Amendments to Australian Accounting Standards – Accounting for Acquisitions of Interests in Joint Operations [AASB 1 & 11]
The Authority establishes Joint Operations in pursuit of its objectives and does not routinely acquire interests in Joint Operations. Therefore, there is no financial impact on application of the Standard.
1 Jan 2016
AASB 1057
Application of Australian Accounting Standards
This Standard lists the application paragraphs for each other Standard (and Interpretation). There is no financial impact on application of the Standard.
1 Jan 2016
AASB 2014-5
Amendments to Australian Accounting Standards arising from AASB 15
This Standard gives effect to the consequential amendments to Australian Accounting Standards (including Interpretations) arising from the issuance of AASB 15. The Authority has not yet determined the application or the potential impact of the Standard.
1 Jan 2017
AASB 2014-9
Amendments to Australian Accounting Standards – Equity Method in Separate Financial Statements [AASB 1, 127 & 128]
This Standard amends AASB 127, and consequentially amends AASB 1 and AASB 128, to allow entities to use the equity method of accounting for investments in subsidiaries, joint ventures and associates in their separate financial statements. The Authority has not yet determined the application or the potential impact of the Standard.
1 Jan 2016
Note 5 Disclosure of changes in Accounting Policy and Estimates continued
Page 47 of 77

West Coast Institute | Annual Report 2015
Changes in accounting estimates No Changes have occurred in accounting policies or estimates for the year ended 31 December 2015.
Operative
for reporting periods beginning on / after
AASB 2014-10
Amendments to Australian Accounting Standards – Sale or Contribution of Assets between an Investor and its Associate or Joint Venture [AASB 10 & 128]
This Standard amends AASB 10 and AASB 128 to address an inconsistency between the requirements in AASB 10 and those in AASB 128 (August 2011), in dealing with the sale or contribution of assets between an investor and its associate or joint venture. The Authority has not yet determined the application or the potential impact of the Standard.
1 Jan 2016
AASB 2015-1
Amendments to Australian Accounting Standards – Annual Improvements to Australian Accounting Standards 2012–2014 Cycle [AASB 1, 2, 3, 5, 7, 11, 110, 119, 121, 133, 134, 137 & 140]
These amendments arise from the issuance of International Financial Reporting Standard Annual Improvements to IFRSs 2012–2014 Cycle in September 2014, and editorial corrections. The Authority has not yet determined the application or the potential impact of the Standard.
1 Jan 2016
AASB 2015-2
Amendments to Australian Accounting Standards – Disclosure Initiative: Amendments to AASB 101 [AASB 7, 101, 134 & 1049]
This Standard amends AASB 101 to provide clarification regarding the disclosure requirements in AASB 101. Specifically, the Standard proposes narrow-focus amendments to address some of the concerns expressed about existing presentation and disclosure requirements and to ensure entities are able to use judgement when applying a Standard in determining what information to disclose in their financial statements. There is no financial impact.
1 Jan 2016
AASB 2015-3
Amendments to Australian Accounting Standards arising from the Withdrawal of AASB 1031 Materiality
This Standard completes the withdrawal of references to AASB 1031 in all Australian Accounting Standards and Interpretations, allowing that Standard to effectively be withdrawn. There is no financial impact.
1 July 2015
AASB 2015-6
Amendments to Australian Accounting Standards – Extending Related Party Disclosures to Not-for-Profit Public Sector Entities [AASB 10, 124 & 1049]
The amendments extend the scope of AASB 124 to include application by not-for-profit public sector entities. Implementation guidance is included to assist application of the Standard by not-for-profit public sector entities. The Authority will be required to make related party disclosures, though there is no financial impact..
1 Jul 2016
AASB 2015-8
Amendments to Australian Accounting Standards – Effective Date of AASB 15
The Standard amends the mandatory effective date of AASB 15, consequential amendments originally set out in AASB 2014 5, and, Interpretation 1052 Tax Consolidation Accounting. There is no financial impact.
1 Jan 2017
Page 48 of 77

West Coast Institute | Annual Report 2015
2015 2014 $ $
6. Employee benefits expense Wages and Salaries (a)(b) 26,258,280 25,497,506 Superannuation – Defined contribution plans (c) 2,354,220 2,502,622 Total 28,612,500 28,000,128
a) Includes the value of the fringe benefit to the employee plus the fringe benefit tax component, leave entitlements including superannuation contribution component.
b) Employment on-costs such as worker’s compensation insurance are included at note 9 “Other Expenses” c) Defined contribution plans include West State, Gold State, Super Choice and GESB Super Scheme
(Contribution paid). The employment on-costs liability is included at note 28 “Provisions”. 7. Supplies and Services Consumables 1,315,791 1,212,280 Communication expenses 206,504 208,990 Utilities expenses 713,185 799,319 Consultancies and contracted services 3,325,887 3,246,234 Minor works and equipment 1,465,040 1,471,484 Repairs and maintenance 28,719 27,087 Operating lease and hire charges 283,845 291,660 Travel and passenger transport 108,495 109,349 Advertising and public relations 337,472 415,640 Supplies and services – PD staff activities
105,256 128,485 Supplies and services – other 587,061 508,868 Total 8,477,255 8,419,396
See note 35 Explanatory Statement for commentary on variations in 2015 for these expense items. 8. Depreciation and amortisation expense
Depreciation
Buildings 1,816,697 1,794,634 Leasehold improvements – Buildings (a)
- 5,861 Motor Vehicles 16,932 17,975 Plant, furniture and general equipment 259,760 259,918 Computers and communication network 175,317 246,375 Library Collection (b)
77,689 61,588 2,346,395 2,386,351
a) Depreciation of work carried out on leased property at Pappas Street, Wangara – now vacated. b) Third year of rolling depreciation of the Institute Library collection (See note 2 (f)).
Page 49 of 77

West Coast Institute | Annual Report 2015
8. Depreciation and amortisation expense continued Amortisation
2015
$
2014
$
Software 32,426 32,002 32,426 32,002 Total 2,378,821 2,418,353 9. Other Expenses
Building Expenses 438,439 449,640
Doubtful Debts Expense (a) 44,333 4,390
Employment on-costs (b) 1,720,043 1,873,257
Audit Fees 100,000 97,800
Student Prizes & Awards 4,870 15,959
Losses and write-offs 2 345
Other - 39,335
Total 2,307,687 2,480,726 (a) See note 20 for reconciliation of movement in doubtful debt expense (b) Includes workers' compensation insurance and other employment on-costs. The on-costs liability associated with the
recognition of annual and long service leave liability is included at note 28 'Provisions'. Superannuation contributions accrued as part of the provision for leave are employee benefits and are not included in employment on-costs
See note 35 Explanatory Statement for commentary on variations in 2015 for these expense items.
10. Fee for service
Fee for service – general 965,695 900,047
Fee for service – other government 100,829 121,240
International Division fees 4,796,672 4,356,392
Total 5,863,196 5,377,679
11. Student fees and charges
Tuition fees 4,837,271 4,288,525
Enrolment fees - 1,500
Resource fees 757,606 800,970
Recognition of Prior Learning Fees 163,172 136,223
Other Institute fees 87,822 89,901
Total 5,845,871 5,317,119
See note 35 Explanatory Statement for commentary on increases in 2015 for student fees and charges
12. Ancillary Trading
Live works (not a trading activity) (a) 488,278 473,714
Other ancillary revenue 3,194 24,790
Total 491,472 498,504
(a) The outcome of training delivery can provide goods and services which, on occasions, are able to be passed on for recovery of some of the inputs of labour and materials in the delivery. These ’live works’ are not a trading activity.
Page 50 of 77

West Coast Institute | Annual Report 2015
2015
2014
13. Trading Profit / (Loss)
$ $
Bookshop
Sales 162,033 190,295
Cost of Sales
Opening inventory (38,917) (66,016)
Purchases (107,225) (129,215)
(146,142) (195,231)
Closing Inventory 37,367 38,917
Cost of goods sold (108,775) (156,314)
Trading Profit / (Loss) – Bookshop 53,258 33,981
14. Interest Revenue
Interest Revenue (a) 636,251 797,733
Total 636,251 797,733
(a) Interest Revenue is earned on the Institute's operating bank account, term deposits and Investment at Treasury account. 15. Other Revenue
Rental and facilities fees 127,578 116,565
Other direct grants and subsidy revenue 30,000 60,000
Sponsorship and Donations revenue 21,069 30,481
General revenue(a) 858,773 175,699
Total 1,037,420 382,745
(a) General revenue includes an adjustment to the 2014 expected DPA Refund to DTWD ($736,670)
16. Net gain / (loss) on disposal of non-current assets Carrying amounts of Non-current assets disposed of Plant, furniture and general equipment - (7,840) Computers and communication network 3,491 15,253 3,491 7,413 Proceeds from Disposal of Non-current Assets Motor Vehicles - 16,357 Computers and communication network 4,112 - Net gain / (Loss) 7,603 23,770
See also note 23 Property, plant and equipment
Page 51 of 77

West Coast Institute | Annual Report 2015
2015 2014 17. Income from State Government $ $ Appropriation received during the year
Service Appropriation (a) (State funds received from Department of Training and Workforce Development)
Delivery and Performance Agreement (DPA) 23,792,365 26,625,271 Delivery and Performance Agreement (DPA) – Refund(a) (761,774) (1,299,924) Other recurrent funds 72,475 96,191 Voluntary Severance Scheme 2,281,745 158,801 Non- recurring Capital Grant from DTWD - 852,122
Total Service Appropriation 25,384,811 26,432,461
Services received free of charge (b) from other state government agencies during the financial period Department of Training and Workforce Development
Corporate Systems Support(c) 689,589 654,000 Human Resource, Industrial relations support 24,584 27,819 Other (d)(e) 327,334 122,137 1,041,507 803,956
Department of Education (e) - 11,101 Department of Finance - 7,754 Other Government (State Solicitor’s Office) 7,604 5,934 7,604 24,789 Total Services received free of charge 1,049,111 828,745
Total Income from State Government 26,433,922 27,261,206
(a) Service appropriations are accrual amounts reflecting the net cost of services delivered. A refund is made to the Department of Training and Workforce Development where there is a shortfall in agreed delivery. (b) Where assets or services have been received free of charge or for nominal cost are recognised as revenues at fair value of the assets and/or services that can be reliably measured and which would have been purchased if they were not donated. Contribution of assets or services in the nature of contributions by owners, are recognised direct to equity. (c) Corporate systems support has increased in 2015 due to an ongoing project to upgrade the Finance and HR systems. (d) Services include student satisfaction survey, and copyright and screenright licences. (e) HR and Finance services to the value of $260,711 were received from the Department of Training and Workforce Development Training Business Centre in 2015 in addition to those paid for ($307,160). The Training Business Centre transferred from the Department of Education to the Department of Training and Workforce Development on 1 July 2014.
Page 52 of 77
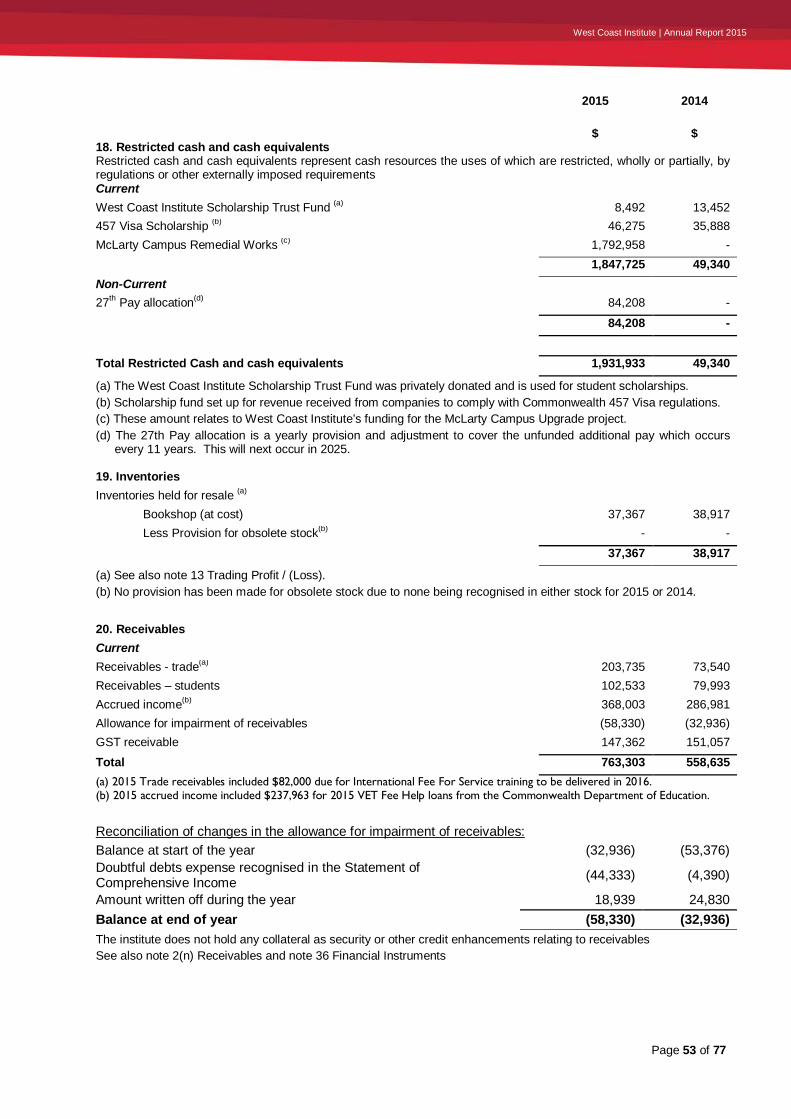
West Coast Institute | Annual Report 2015
2015 2014 18. Restricted cash and cash equivalents
$ $
Restricted cash and cash equivalents represent cash resources the uses of which are restricted, wholly or partially, by regulations or other externally imposed requirements Current West Coast Institute Scholarship Trust Fund (a) 8,492 13,452 457 Visa Scholarship (b) 46,275 35,888 McLarty Campus Remedial Works (c) 1,792,958 - 1,847,725 49,340 Non-Current 27th Pay allocation(d) 84,208 -
84,208 - Total Restricted Cash and cash equivalents 1,931,933 49,340
(a) The West Coast Institute Scholarship Trust Fund was privately donated and is used for student scholarships. (b) Scholarship fund set up for revenue received from companies to comply with Commonwealth 457 Visa regulations. (c) These amount relates to West Coast Institute’s funding for the McLarty Campus Upgrade project. (d) The 27th Pay allocation is a yearly provision and adjustment to cover the unfunded additional pay which occurs
every 11 years. This will next occur in 2025. 19. Inventories Inventories held for resale (a)
Bookshop (at cost) 37,367 38,917 Less Provision for obsolete stock(b) - -
37,367 38,917
(a) See also note 13 Trading Profit / (Loss). (b) No provision has been made for obsolete stock due to none being recognised in either stock for 2015 or 2014. 20. Receivables Current Receivables - trade(a) 203,735 73,540 Receivables – students 102,533 79,993 Accrued income(b) 368,003 286,981 Allowance for impairment of receivables (58,330) (32,936) GST receivable 147,362 151,057 Total 763,303 558,635 (a) 2015 Trade receivables included $82,000 due for International Fee For Service training to be delivered in 2016. (b) 2015 accrued income included $237,963 for 2015 VET Fee Help loans from the Commonwealth Department of Education.
Reconciliation of changes in the allowance for impairment of receivables: Balance at start of the year (32,936) (53,376) Doubtful debts expense recognised in the Statement of Comprehensive Income (44,333) (4,390)
Amount written off during the year 18,939 24,830 Balance at end of year (58,330) (32,936) The institute does not hold any collateral as security or other credit enhancements relating to receivables See also note 2(n) Receivables and note 36 Financial Instruments
Page 53 of 77

West Coast Institute | Annual Report 2015
2015 2014 21. Other financial assets $ $ Current Cash investments(a) 14,862,873 15,492,263 Total 14,862,873 15,492,263
(a) Cash investments balance represents seven term deposits: - $1,580,927 with a 6 month term and a maturity date of 27 February 2016 held with Westpac. - $2,431,235 with a 7 month term and a maturity date of 29 February 2016 held with Westpac. - $3,802,300 with a 6 month term and a maturity date of 30 March 2016 held with Bank of Queensland. - $2,538,229 with a 6 month term and a maturity date of 15 April 2016 held with Bank of Queensland. - $2,246,728 with a 6 month term and a maturity date of 24 May 2016 held with Westpac. - $744,905 with a 6 month term and a maturity date of 7 June 2016 held with Bank of Queensland. - $1,518,549 with a 6 month term and a maturity date of 16 June 2016 held with Bank of Queensland.
22. Other current assets
Prepayments 533,052 342,188 533,052 342,188 23. Property, plant and equipment
Land At Fair Value(a) (b) 37,500,000 35,030,000 37,500,000 35,030,000 Buildings At fair value(b) 69,581,000 70,092,000 69,581,000 70,092,000 (a)The land value for Clarkson campus ($2,470,000) was transferred from the Department of Education on 16th October 2015.
(b) Land and buildings were revalued as at 1 July 2015 by the Western Australian Land Information Authority (Valuation Services). The fair value of buildings: $69,581,000 (2014: $70,092,000) was determined on the basis of depreciated replacement cost and the fair value of land $37,500,000 (2014: $35,030,000) was determined on the basis of comparison with market evidence for land with low level utility (high restricted use land). See note 2(f) Property, plant and equipment.
Work in Progress Construction costs – building improvements 717,351 1,471,415
717,351 1,471,415 Motor Vehicles, caravans and trailers At cost 120,923 120,923 Accumulated depreciation (102,203) (85,271) 18,720 35,652 Plant, furniture and general equipment At cost 2,262,290 2,180,340 Accumulated depreciation (1,512,873) (1,253,196)
749,417 927,144
Page 54 of 77

West Coast Institute | Annual Report 2015
Note 23 Property, plant and equipment continued 2015 2014 $ $ Computer equipment, communication network At cost 1,846,686 1,763,744 Accumulated depreciation (1,516,369) (1,488,641) 330,317 275,103 Institute Library Collection (a) At cost 440,540 455,336 Accumulated Depreciation (139,277) (124,470) (a) See note 2(f) for information regarding recognition of the third year’s depreciation of the Institute Library Collection
301,263 330,866
Total 109,198,068 108,162,180
Page 55 of 77

West Coast Institute | Annual Report 2015
Note 23 Property, Plant and Equipment continued
Reconciliation of the carrying amounts of property, plant and equipment at the beginning and end of the reporting period are set out below:
2015 Land Buildings Work in Progress
Motor Vehicle
s
Plant, furniture
and general
equipment
Computer equip. comm.
Network
Library Collectio
n Total
Carrying amount at start of year 35,030,000 70,092,000 1,471,415 35,652 927,144 275,103 330,866 108,162,180
Additions(a) 2,470,000 255,944 67,499 248,662 48,086 3,090,191
Transfers(b) 954,557 (1,010,008) 14,534 (14,534) (55,451)
Disposals (3,597) (3,597)
Revaluation Increments/ (Decrements)
351,140 351,140
Depreciation expense
(1,816,697) (16,932)
(259,760) (175,317) (77,689) (2,346,395)
Carrying amount at end of year 37,500,000 69,581,000 717,351 18,720 749,417 330,317 301,263 109,198,068
(a) The land value for Clarkson campus ($2,470,000) was transferred from the Department of Education on 16th October 2015. (b) A payment which was initially treated as capital was subsequently deemed to be an expense and was transferred to Supplies
and Services (note 7).
2014 Land Buildings Work in Progress
Motor Vehicle
s
Plant, furniture
and general
equipment
Computer equip. comm.
Network
Library Collectio
n Total
Carrying amount at start of year 35,030,000 69,034,861 112,978 53,627 1,133,701 415,858 341,114 106,122,139
Additions 1,847,055 1,505,556 61,200 112,337 51,340 3,577,488
Transfers 140,336 (147,119) (6,783)
Disposals (7,840) (6,717) (14,557)
Revaluation Increments/ (Decrements)
870,243 870,243
Depreciation expense
(1,800,495) (17,975)
(259,917) (246,375) (61,588) (2,386,350)
Carrying amount at end of year 35,030,000 70,092,000 1,471,415 35,652 927,144 275,103 330,866 108,162,180
Page 56 of 77

West Coast Institute | Annual Report 2015
24. Fair Value Measurements
Level 1 Level 2 Level 3 Fair value at end of period
Assets measured at fair value: $ $ $ $
2015
Land (Note 24) 37,500,000 37,500,000
Buildings (Note 24) 69,581,000 69,581,000
107,081,000 107,081,000
2014
Land (Note 24) 35,030,000 35,030,000
Buildings (Note 24) 70,092,000 70,092,000
105,122,000 105,122,000
There were no transfers between levels 1, 2 or 3 during the current or prior year
Fair Value Measurements using significant unobservable inputs (Level 3)
Land Buildings 2015 $ $ Fair Value at start of period 35,030,00
0 70,092,00
0 Additions 2,470,000 954,557 Revaluation increments/(Decrements) recognised in Other Comprehensive Income
- 351,140
Disposals - - Depreciation Expense - (1,816,697
) Fair Value at end of period 37,500,00
0 69,581,00
0
Land Buildings 2014 $ $ Fair Value at start of period 35,030,00
0 69,034,86
1 Additions - 1,987,390 Revaluation increments/(Decrements) recognised in Other Comprehensive Income
- 870,244
Depreciation Expense - (1,800,495)
Fair Value at end of period 35,030,000
70,092,000
Page 57 of 77

West Coast Institute | Annual Report 2015
Valuation Process
There were no changes in valuation techniques during the period.
Transfers in and out of a fair value level are recognised on the date of the event or change in circumstances that caused the transfer. Transfers are generally limited to assets newly classified as non-current assets held for sale as Treasurer's instructions require valuations of land and buildings to be categorised within Level 3 where the valuations utilise significant Level 3 inputs on a recurring basis.
Land (Level 3 fair values)
Fair value for restricted use land is based on comparison with market evidence for land with low level utility (high restricted use land). The relevant comparators of land with low level utility is selected by the Western Australian Land Information Authority (Valuation Services) and represents the application of a significant Level 3 input in this valuation methodology. The fair value measurement is sensitive to values of comparator land, with higher values of comparator land correlating with higher estimated fair values of land.
Buildings (Level 3 fair values)
Fair value for existing use specialised buildings and infrastructure assets is determined by reference to the cost of replacing the remaining future economic benefits embodied in the asset, i.e. the depreciated replacement cost. Depreciated replacement cost is the current replacement cost of an asset less accumulated depreciation calculated on the basis of such cost to reflect the already consumed or expired economic benefit, or obsolescence, and optimisation (where applicable) of the asset. Current replacement cost is generally determined by reference to the market observable replacement cost of a substitute asset of comparable utility and the gross project size specifications. Valuation using depreciated replacement cost utilises the significant Level 3 input, consumed economic benefit/obsolescence of asset which is estimated by the Western Australian Land Information Authority (Valuation Services). The fair value measurement is sensitive to the estimate of consumption/obsolescence, with higher values of the estimate correlating with lower estimated fair values of buildings and infrastructure. Information about significant unobservable inputs (Level 3) in fair value measurements: Description Fair Value
2015 $
Fair Value 2014
$
Valuation techniques Unobservable inputs
Land 37,500,000 35,030,000 Market approach Selection of land approach with restricted utility
Buildings 69,581.000 70,092,000 Depreciated replacement cost
Consumed economic benefit/ obsolescence of asset Historical cost of building per square metre floor area (m2)
Reconciliations of the opening and closing balances are provided in Note 23. Basis of Valuation In the absence of market-based evidence due to the specialised nature of some non-financial assets, these assets are valued at Level 3 of the fair value hierarchy on an existing use basis. The existing use basis recognises that restrictions or limitations have been placed on their use and disposal when they are not determined to be surplus to requirements. These restrictions are imposed by virtue of the assets being held to deliver a specific community service and the Institute's enabling legislation.
Page 58 of 77

West Coast Institute | Annual Report 2015
2015 2014 $ $ 25. Intangible Assets Computer Software At cost 199,703 199,703 Accumulated amortisation (192,507) (160,081) Total 7,196 39,622 Reconciliation Carrying amount at start of period 39,622 61,179 Additions - 10,445 Disposal - (16,322) Amortisation Expense (32,426) (32,002) Amortisation write back on disposal - 16,322 Carrying amount at end of period 7,196 39,622 26. Impairment of Assets There were no indications of impairment of property plant, equipment and intangibles as at 31 December 2015. The Institute held no goodwill or intangible assets with an indefinite useful life during the reporting period and at the end of the reporting period there were no intangible assets not yet available for use. All surplus assets as at 31 December 2015 have either been classified as assets held for sale or written off. 27. Payables Current Trade payables 79,575 11,863 GST payable(a) 8,492 6,957 Accrued expenses 340,548 952,560 Accrued salaries and related costs 178,570 510,379 Parental leave payable (9) 769 Total 607,176 1,482,528 (a) GST payable reflects both normal GST payments to ATO and recoverable amounts from customers. See also note 2 (o) 'Payables' and Note 36 'Financial Instruments'. 2015 2014 $ $ 28. Provisions Current Employee Benefits Provision Annual Leave(a) 752,603 867,536 Long Service Leave(b) 2,361,021 2,907,905 Salary Deferment(c) 49,794 94,494 3,163,418 3,869,935
Other Provisions
Employment on-costs(d) 198,267 239,137 198,267 239,137 Total Current 3,361,685 4,109,072 Non-Current Employee Benefits provision Long Service Leave(b) 1,706,687 1,356,239 1,706,687 1,356,239 Other Provisions Employment on-costs(d) 109,038 85,794 109,038 85,794 Total Non-Current 1,815,725 1,442,033
(a) Annual leave liabilities have been classified as current as there is no unconditional right to defer settlement for at least 12 months after the reporting period. Assessments indicate that actual settlement of the liabilities will occur as follows: Within 12 months of the end of the reporting period 702,154 778,961 More than 12 months of the end of the reporting period 50,449 88,575 Total 752,603 867,536 Due to Award changes. Annual Leave loading which has been accrued since April 2011 is paid in the year of accrual.
Page 59 of 77

West Coast Institute | Annual Report 2015
(b) Long service leave liabilities have been classified as current where there is no unconditional right to defer settlement for at least 12 months after reporting date. Assessments indicate that actual settlement of the liabilities will occur as follows: Within 12 months of the end of the reporting period 1,347,824 739,043 More than 12 months of the end of the reporting period 2,719,884 3,525,101 Total 4,067,708 4,264,144
(c) Deferred salary scheme liabilities have been classified as current where there is no unconditional right to defer settlement for at least 12 months after the end of the reporting period. Actual settlement of the liabilities is expected to occur as follows: Within 12 months of the end of the reporting period 15,342 75,035 More than 12 months of the end of the reporting period 34,452 19,459 Total 49,794 94,494 (d) The settlement of annual and long service leave liabilities gives rise to the payment of employment on-costs including payroll tax and workers compensation insurance. The provision is the present value of expected future payments. The associated expense is included at note 9 'Other expenses'. Movements in other provisions Movements in each class of provisions during the financial year, other than employee benefits, are set out below. Employment on-cost provision Carrying amount at start of period 324,931 320,274 Additional provisions recognised 163,807 142,470 Payments/other sacrifices of economic benefits (181,432) (137,813) Carrying amount at end of period 307,306 324,931
2015 2014 $ $ 29. Other liabilities Income Received in advance(a) 187,802 102,817 Grants and advances(b) 767,494 1,305,644 Money / Deposits held in trust 438 36 Other - - Total 955,734 1,408,497 (a) Income received in advance comprises
Fee for service 79,755 51,798 Student fees and charges - 826 Prison enrolments 10,400 - Fee Help 67,647 50,193 Contribution from City of Joondalup to manage Sixty27 30,000 -
187,802 102,817 (b) Grants and advances include:
Unearned revenue from Delivery and Performance Agreement (see note 18) 761,774 1,299,924 457 Visa Income in advance 5,720 5,720
767,494 1,305,644
Page 60 of 77

West Coast Institute | Annual Report 2015
30. Equity
Equity represents the residual interest in the net assets of the Institute. The Government holds the equity interest in the net assets of the Institute on behalf of the community. The asset revaluation reserve represents the portion of equity resulting from the revaluation of non-current assets. Contributed Equity
Balance at start of period
55,116,140 53,269,085
Transfer of net assets from other agency Department of Education – Clarkson Campus Land 2,470,000 - DTWD – Joondalup Air Conditioning(b) - 1,847,055 2,470,000 1,847,055 Balance at end of period 57,586,140 55,116,140 Reserves Asset Revaluation Reserve Balance at start of period 38,155,720 37,285,477 Net revaluation increments/ (Decrements): Buildings 351,140 870,243 Balance at end of period 38,506,860 38,155,720 Accumulated surplus / (Deficit) Balance at start of period 26,123,538 27,749,404 Result of period (1,407,270) (1,625,866) Balance at end of period 24,716,268 26,123,538 Total Equity at end of period 120,809,268 119,395,398
(a) A transfer of asset from the Department of Education of $2,470,000 was made in 2015 for the value of the Clarkson Campus Land.
(b) A transfer of asset from DTWD of $1,847,055 was made in 2014 for the value of replacement air conditioning at the Joondalup campus
31. Notes to the Statement of Cash Flows Reconciliation of Cash Cash at the end of the financial year, as shown in the statement of cash flows is reconciled to the related items in the Statement of Financial position as follows: Cash and cash equivalents 346,364 3,154,383 Restricted Cash and Cash Equivalents 1,801,365 49,340 Cash Investments 14,862,873 15,492,263 17,010,602 18,695,986 Reconciliation of net cost of services to net cash flows provided by / (used in) operating activities Net cost of services (27,841,192) (28,887,072) Non-cash items Depreciation and amortisation expense 2,378,821 2,418,353 Doubtful debts expense 25,394 (20,439) Services received free of charge 1,049,111 828,745 Net (gain) / Loss on sale of property, plant and equipment (7,603) (23,770) Work in Progress adjustment 54,280 - (Increase) / decrease in assets: Current receivables (210,690) 449,215 Current inventories 1,550 27,098 Other current assets (190,864) (101,668) Increase / (Decrease) in liabilities: Current payables(a) (878,400) (804,845) Income received in advance 84,986 10,288 Current provisions (747,387) 74,550 Other current liabilities 401 (322) Non-current Provisions 373,692 (367,135) Other non-current liabilities: Net GST receipts / (payments)(b) (708,829) (797,222) Change in GST in receivables / payables(c) 675,335 773,082
Page 61 of 77

West Coast Institute | Annual Report 2015
Net cash provided by / (used in) operating activities 25,941,395 (26,421,142) (a) Note that the ATO receivable /payable in respect in respect of the sale/purchase of non-current assets are not included in
these items as they are not reconciling items. (b) This is the net GST paid / received, i.e. cash transactions (c) This reverses out the GST in receivables and payables. 2015 2014 $ $ 32. Commitments The commitments below are inclusive of GST where relevant Capital expenditure commitments Capital expenditure commitments, being contracted capital expenditure additional to the amounts reported in the financial statements, are payable as follows: Within 1 year 1,864,171 369,253 Total 1,864,171 369,253 The capital commitments include amounts for Plant and equipment 792,958 36,808 Buildings(a) 1,071,213 332,445 1,864,171 369,253
a) Capital Expenditure commitments for building improvements at the McLarty Campus. Lease commitments Commitments in relation to leases contracted for at the end of the reporting period but not recognised in the financial statements, are payable as follows (a) : Within 1 year 248,649 215,690 Later than 1 year and not later than 5 years 644,184 821,061 Total 892,833 1,036,751 Representing Non-cancellable operating leases 892,833 1,036,751 892,833 1,036,751 (a) The Institute has motor vehicle leases and property leases.
Other expenditure commitments contracted for at the end of the reporting period but not recognised as liabilities, are payable as follows: Within 1 year 258,587 1,561,801 Total 258,587 1,561,801 33. Contingent Liabilities and contingent assets No contingent liabilities or contingent assets exist as at 31 December 2015. 34. Events occurring after the reporting period There are no significant events occurring after the reporting period that materially impact the financial statements as at 31 December 2015.
Page 62 of 77

West Coast Institute | Annual Report 2015
35. Explanatory Statement Significant variations between estimates and actual results for expenses and income for 2015 and between the actual results for 2014 and 2015 are shown below. Significant variations are considered to be those greater than $500,000 or exceeding 10% of the estimated or preceding year’s figure. Statement of Comprehensive Income
Note Actual 2015
Original Budget
2015
Actual 2014
Variance between Estimate
and Actual
Variance between Actual
2015 and 2014
$000 $000 $000 $000 $000 COST OF SERVICES Expenses Employee Benefits Expense 1,A 28,612 28,932 28,000 (320) 613 Supplies and Services 2 8,477 9,833 8,419 (1,356) 58 Depreciation and amortisation expense 3 2,379 2,822 2,418 (443) (40) Cost of sales 4,B 109 131 156 (22) (48) Other expenses 5 2,308 2,977 2,481 (669) (173) Total cost of services 41,885 44,695 41,475 (2,810) 410 Income Revenue Fee for service 6 5,863 4,645 5,378 1,218 486 Student fees and charges 7 5,846 8,148 5,317 (2,302) 529 Ancillary trading 491 526 499 (35) (7) Sales 8,C 162 195 190 (33) (28) Commonwealth grants & contributions 9, 16 (16) Interest revenue 10,D 636 493 798 143 (161) Other revenue 11,E 1,037 298 383 739 654 Total revenue 14,036 14,321 12,564 (285) 1,472 Gains Gain on disposal of non-current assets 12,F 8 24 8 (16) Total gains 8 24 8 (16) Total income other than income from State Government
14,044 14,321 12,588 (277) 1,456
NET COST OF SERVICES (27,841) (30,374) (28,887) 2,533 1,046 INCOME FROM STATE GOVERNMENT Service appropriation 13,G 25,385 24,756 26,432 629 (1,047) Services received free of charge 14,H 1,049 809 829 240 220 Total income from State Government 26,434 25,565 27,261 869 (827) SURPLUS / (DEFICIT) FOR PERIOD (1,407) (4,809) (1,626) 3,402 219 OTHER COMPREHENSIVE INCOME Changes in asset revaluation surplus 15,I 351 2,918 870 (2,567) (519) Total other comprehensive income 351 2,918 870 (2,567) (519) TOTAL COMPREHENSIVE INCOME FOR THE PERIOD
(1,056) (1,891) (756) 835 (300)
Page 63 of 77

West Coast Institute | Annual Report 2015
35. Explanatory Statement continued
Statement of Financial Position Note Actual 2015
Original Budget
2015
Actual 2014
Variance between Estimate
and Actual
Variance between Actual
2015 and 2014
$000 $000 $000 $000 $000 ASSETS Current Assets Cash and cash equivalents 16,J 216 2,006 3,154 (1,790) (2,938) Restricted cash and cash equivalents 17,K 1,848 153 49 1,695 1,799 Inventories 18 37 52 39 (15) (2) Receivables L 763 700 559 63 204 Other current assets 19 15,396 11,813 15,834 3,583 (439) Total Current Assets 18,260 14,724 19,636 3,536 (1,376) Non-Current Assets Restricted cash and cash equivalents 20,M 84 84 84 Property, plant and equipment 21 109,198 114,954 108,162 (5,756) 1,036 Intangible assets 22,N 7 139 40 (132) (33) Total Non-Current Assets 109,289 115,093 108,202 (5,804) 1,087 TOTAL ASSETS 127,549 129,818 127,838 (2,268) (289) LIABILITIES Current Liabilities Payables 23,O 607 1,342 1,483 (735) (876) Provisions P 3,361 3,974 4,109 (613) (748) Other current liabilities 24,Q 956 1,408 956 (452) Total Current Liabilities 4,924 5,316 7,000 (392) (2,076) Non-Current Liabilities Provisions 25 1,816 1,826 1,442 (10) 374 Total Non-Current Liabilities 1,816 1,826 1,442 (10) 374 TOTAL LIABILITIES 6,740 7,142 8,442 (402) (1,702) NET ASSETS 120,809 122,676 119,396 (1,867) 1,413 Equity Contributed equity 57,586 57,116 55,116 470 2,470 Reserves 26 38,507 43,040 38,156 (4,533) 351 Accumulated surplus 24,716 22,520 26,124 2,099 (1,505) TOTAL EQUITY 120,809 122,676 119,396 (1,867) 1,413
Page 64 of 77

West Coast Institute | Annual Report 2015
35. Explanatory Statement continued
Statement of Cash Flows Note Actual
2015
Original Budget
2015
Actual 2014
Variance between Estimate
and Actual
Variance between Actual
2015 and 2014
$000 $000 $000 $000 $000 CASH FLOWS FROM STATE GOVERNMENT Service Appropriation R 24,864 24,756 27,311 108 (2,447) Net cash provided by State Government 24,864 24,756 27,311 108 (2,447) Utilised as follows: CASH FLOWS FROM OPERATING ACTIVITIES Payments Employee benefits (29,211) (28,986) (29,123) 225 88 Supplies and services 27 (8,033) (9,024) (7,624) (991) 409 GST payments on purchases S (863) (788) (953) 75 (90) Other payments 28 (2,391) (3,085) (2,604) (694) (212) Receipts Fee for service 29 5,784 4,633 5,856 1151 (72) Student fees and charges 30 5,507 8,123 5,321 (2,616) 185 Ancillary trading 493 526 498 (33) (5) Commonwealth grants and contributions 31,T 16 15 (16) (15) Interest received 32 759 546 707 213 52 GST receipts from sales 33 153 131 156 22 (3) GST receipts from taxation authority U 633 656 773 (23) (140) Other receipts 34,V 1,228 493 556 735 672 Net cash (used in) operating activities (25,941) (26,760) (26,421) (819) (480) CASH FLOWS FROM INVESTING ACTIVITIES Purchase of non-current physical assets 35,W (612) (3,311) (1,712) (2,699) (1,100) Proceeds from sale of non-current physical assets 36,X 4 16 (4) 12 Net cash (used in) investing activities (608) (3,311) (1,696) (2,703) (1,088) Net increase / (decrease) in cash and cash equivalents
(1,685) (5,316) (806) (3,630) 879
Cash and cash equivalents at the beginning of period
18,696 19,031 19,502 (335) (806)
CASH AND CASH EQUIVALENTS AT THE END OF PERIOD
17,011 13,715 18,696 (3,965) 73
Major Variance Narratives Variance between estimate and actual 1. Employee benefits expense was lower than estimates by $320k following a reduction of 27 FTE due to the
implementation of the public sector workforce renewal policy. 2. Supplies and Services expense was lower than estimates by $1.4 million (-16%) due to the timing difference
for the McLarty upgrade project.
3. Depreciation and amortisation expense was lower than estimates by $443k (-19%) also due to the timing difference for the capitalisation of the McLarty upgrade project.
4. Cost of Sales was lower than estimates by $22k (-20%) relating to reduction in bookshop sales due to a shift in demand to online resources.
Page 65 of 77

West Coast Institute | Annual Report 2015
5. Other expenses were lower than estimates by $666k (-29%) mainly due to an overall reduction in employee oncosts and in particular worker's compensation claims.
6. Fee for service revenue was $1.2 million (21%) higher than estimates due to an increase in international student numbers over the DTWD provided initial projection. There was also a slight increase in general FFS activity.
7. Student Fees and Charges were $2.3 million (-39%) lower than the initial DTWD enforcement projection mainly due to an overall reduction in SCH targets and RPL fee deregulation.
8. Bookshop sales were $33k (-20%) lower than estimate due to an increase in demand for online services. Cost of sales was also reduced in accordance to the sales demand decrease.
9. Commonwealth grants and contributions were $16k (-100%) lower than estimated due to the cessation of the Export Development grant.
10. Interest Revenue was $144k (23%) higher than estimates as implemented investment strategies secured higher interest rates than expected on long term deposits.
11. Other revenue was $739k (70%) higher than estimate due to a reimbursement from the DPA for the childcare fee waivers.
12. Gain on disposal of non-current assets was 8k (100%) higher than estimate due to the recycling of computer equipment.
13. Service appropriation was $629k (2%) higher than estimated due to the payment of $2.4 million in Voluntary Severances. This was offset by a reduction in SCH from the initial DTWD provided projection.
14. Services provided free of charge was $240k (23%) higher than estimated due to an increase in ICT services costs relating to the TechOne system upgrade.
15. Changes in asset revaluation surplus was $2.6 million (-731%) lower than estimated mainly due to a timing difference in asset capitalisation relating to the McLarty project. Another impacting factor was the reduction in building price index rate that applies to the reduction in value of the building revaluations.
16. Cash and cash equivalents was $1.8 million (-89%) lower than estimated due to the recognition of restricted cash for McLarty capital works commitments.
17. Restricted cash was $1.7 million (1,108%) higher than expected due to the disclosure of capital works commitments pertaining to the McLarty upgrade project.
18. Inventories were $15k (-39%) lower than estimated due to the reduction in bookshop purchases. 19. Other current assets were $3.6 million (23%) higher than estimate due to the reduction in overall deficit of
$3.3 million which resulted in an increase in cash investments. Accrued income also increased by $235k due to VET Fee Help loans pending the receival of funds from Department of Education.
20. Restricted cash was $84k higher than expected due to the 27th pay provision being classified as non-current 21. Property, plant and equipment were $5.8 million (-5%) lower than estimated due to timing difference for the
McLarty upgrade project capital transfer from DTWD . 22. Intangible assets were $132k (-1833%) lower than estimated due to the timing difference of the software
capitalisation for the asset investment plan. 23. Payables were $735k (-121%) lower than estimated due to a reduction in invoice accruals and accrued
expenditure. 24. Other current liabilities were $956k (100%) over estimated mainly due to the DPA refund assessment
accrual of $762k. 25. Non-current provisions were $265k (-17%) lower than estimated due to reduction in the long service leave
liabilities component of the voluntary severance payments. 26. Reserves were $4.5 million (-12%) below estimated due to a reduction in building revaluation indexation as
the index was based on the 2014 building price index. 27. Supplies and Services payments were lower than estimates by $1 million (12%) due to the timing difference
for the McLarty upgrade project. The cash offset to the statement of comprehensive income relates to the increase in Resources provided free of charge.
28. Other payments were lower than estimates by $694k (29%) mainly due to an overall reduction in employee oncosts and in particular worker's compensation claims.
29. Fee for service revenue was $1.2 million (20%) higher than estimates due to an increase in international student numbers over the DTWD provided initial projection. There was also a slight increase in general FFS activity.
30. Student Fees and Charges were $2.6 million (-48%) lower than the initial DTWD enforcement projection mainly due to an overall reduction in SCH targets. The VET Fee Help contribution of $238k also increased the variance once removed from the cashflow.
31. Commonwealth grants and contributions were $16k (-100%) lower than estimated due to the cessation of the Export Development grant.
Page 66 of 77

West Coast Institute | Annual Report 2015
32. Interest Received was $213k (28%) higher than estimates as implemented investment strategies secured higher interest rates than expected on long term deposits. $122k of the cashflow component relates to income received in advance.
33. GST receipts from sales were $33k (20%) higher than estimate due to the overall increase in FFS related activity.
34. Other receipts were $735k (60%) higher than estimate represented by the DPA refund assessment relative to the child care fee waiver reimbursement.
35. Purchase of non-current assets was $2.7 million (441%) lower than estimated due to the timing difference in the McLarty upgrade project.
36. Proceeds from sale of non-current assets were $4k (100%) higher than estimated due to the monies received from computer equipment recycling.
Variance between 2014 actual and 2015 actual A. Employee benefits expense increased by $613k (2%) due to $1.9 million of voluntary severance payouts.
The offset related to a reduction of 27 FTE due to the implementation of the public sector workforce renewal policy.
B. Cost of Sales decreased by $48k (-44%) relating to reduction in bookshop sales due to a shift in demand to online resources.
C. Sales decreased by $28k (-17%) lower than estimate due to an increase in demand for online services. Cost of sales was also reduced in accordance to the sales demand decrease.
D. Interest revenue decreased by $161k (-25%) due to the average interest rate received dropping from 3.68% to 2.95%.
E. Other revenue increased by $654k (63%) due to the DPA child care reimbursement of $737k. F. Gains on disposal of non-current assets decreased by $16k (-213%) due to the unique sale of a motor
vehicle in 2014. G. Service appropriation decreased by $1.047 million (-4%) due to an overall reduction in SCH of 6.88%. The
continual impact of the Future Skills entitlement model also includes a reduction in state appropriation for estimated student tuition fees. The tuition fees reduction for 2015 remains significantly higher than student fees received by West Coast Institute of Training. The refund assessment estimate of $735k is also accrued as a deduction to state appropriation.
H. Services provided free of charge was $220k (21%) higher than estimated due to an increase in ICT services costs relating to the TechOne system upgrade.
I. Changes in asset revaluation surplus decreased $519k (-148%) relative to the decrease in the building price indexation.
J. Cash and cash equivalents decreased by $2.9 million (-93%) due to the recognition of restricted cash for McLarty capital works commitments.
K. Restricted cash increased by $1.8 million higher than expected due to the disclosure of capital works commitments pertaining to the McLarty upgrade project.
L. Receivables increased by $204k (27%) due to an increase in accrued income for the VET Fee Help income of $237k.
M. Non current restricted cash increased by $84k due to the provision for the next 27th pay. N. Intangible Assets decreased by $32k (-451%) due to decrement of the depreciation for the period. O. Payables decreased by $875k due to a $332k (-144%) accrued salaries occurring in 2014. Other accrued
expenditure totalled $533k more in 2014 including a Facilities related accrual of $201k. P. Current Provisions decreased by $394k (-11%) as a result of the 27 FTE reduction in 2015 and voluntary
severance scheme payments. Q. Other current liabilities decreased by $452k (-48%) due to a reduction in the DPA refund assessment of
$538k. The estimated refund assessment was significantly higher in 2014 due to cut-off timings and a higher applied refund rate.
R. Service appropriation decreased by $2.4 million (-10%) due to an overall reduction in SCH of 6.88%. The cash component of the State appropriations discloses total amount received without the discount of the estimate refund assessment.
S. GST payment on purchases decreased by $90k (10%) due to an overall decrease of purchases of $691k between supplies and services and purchase of non-current assets.
T. Commonwealth Grant monies received in 2014 ($15K) was for a grant relating to 2013, which is no longer receivable.
U. GST receipts from taxation authority decreased by $140k (-18%) due to the relative decrease in GST payments on purchases.
Page 67 of 77

West Coast Institute | Annual Report 2015
V. Other receipts increased by $672k (55%) due to 2015 inclusion of the DPA refund assessment relative to the child care fee waiver reimbursement of $737k.
W. Purchase of non-current assets decreased by $1.1 million (180%) due to the McLarty upgrade capital investment and mainly relating to the reroofing project and air conditioning upgrades.
X. Proceeds from non-current assets decreased $12k (-298%) due to the unique motor vehicle sale occurring in 2014.
36. Financial Instruments (a) Financial risk management objectives and policies Financial instruments held by the Institute are cash and cash equivalents, cash investments, restricted cash and cash equivalents, receivables and payables. The Institute has limited exposure to financial risks. The Institute’s overall risk management program focus on managing the risks identified below:
Credit Risk Credit risk arises when there is the possibility of the Institute’s receivables defaulting on their contractual obligations resulting in financial loss to the Institute. The maximum exposure to credit risk at the end of the reporting period in relation to each class of recognised financial assets is the gross carrying amount of those assets inclusive of any allowance for impairment as shown in the table at Note 36(c) “Financial Instruments Disclosures’ and Note 20 ‘Receivables’. Credit risk associated with the Institute’s financial assets is minimal because the Institute trades only with recognised, creditworthy third parties. The Institute has policies and procedures in place to ensure that sales of products and services are made to customers with an appropriate credit history. In addition, receivables balances are monitored regularly to ensure that the Institute’s debts are collected in a timely manner. At the end of the reporting period there were no significant concentrations of credit risk.
Liquidity Risk The Institute is exposed to liquidity risk through its trading in the normal course of business. Liquidity risk arises if the Institute is unable to meet its financial obligations as they fall due. The Institute has appropriate procedures to manage cash flows including drawdowns of appropriations by monitoring forecast cash flows to ensure that sufficient funds are available to meet its commitments.
Market Risk Market risk is the risk that changes in market prices such as foreign exchange rates and interest rates will affect the Institute’s income or the value of its holdings of financial instruments. The Institute does not trade in foreign currency and is not materially exposed to other price risks (for example, equity securities or commodity prices changes). Other than as detailed in the Interest rate sensitivity analysis table at Note 36(c), the Institute is not exposed to interest rate risk because the Institute has no borrowings.
(b) Categories of Financial Instrument
2015 2014 $ $ The carrying amounts of each of the following categories of financial assets and financial liabilities at the end of the reporting period are as follows: Financial Assets Cash and Cash Equivalents 215,796 3,154,383 Restricted Cash and Cash Equivalents 1,931,933 49,340 Receivables(a) 615,941 407,578 Cash Investments 14,862,873 15,492,263 Financial Liabilities Payables 598,684 1,475,571 Other Liabilities(b) 761,774 1,299,924 (a) The amount of loans and receivables excludes GST recoverable from the ATO (b) Only includes the Delivery and Performance Agreement refund
(c) Financial instrument disclosure Credit risk The following table discloses the Institute’s maximum exposure to credit risk and the ageing analysis of financial assets. The Institute’s maximum exposure to credit risk at the end of the reporting period is the carrying amount of financial assets as shown below. The table discloses the ageing of financial assets that are past due but not impaired and impaired financial assets. The table is based on information provided to senior management of the Institute. The Institute does not hold any collateral as security or other credit enhancements relating to the financial assets it holds.
Page 68 of 77

West Coast Institute | Annual Report 2015
The Institute does not hold any financial assets that had to have their terms renegotiated that would have otherwise resulted in them being past due or impaired.
Ageing analysis of financial assets
Carrying Amount
Not past due and not impaired
Up to 1 month
1-3 months
3 months- 1 year 1-5 Years
More than 5 years
Impaired Financial Assets
$ $ $ $ $ $ $ $ Financial Assets
2015
Cash and cash equivalents(a) 15,078,669 15,078,669 - - - - - - Restricted cash and cash equivalents 1,931,933 1,931,933 - - - - - -
Receivables (b) 615,941 518,927 69,875 25,932 52,338 7,020 179 (58,330)
17,626,543 17,529,529 69,875 25,932 52,338 7,020 179 (58,330) 2014 Cash and cash equivalents(a) 18,646,645 18,646,645 -
-
-
- -
-
Restricted cash and cash equivalents
49,340 49,340 - -
-
-
- -
Receivables (b) 407,578 370,287 34,004 3,437 28,516 2,979 1,291
(32,936)
19,103,563 19,066,272 34,004 3,437 28,516 2,979 1,291
(32,936)
(a) Includes the cash investment amount. (b) The amount of receivables excludes the GST receivables from the ATO (statutory receivable).
Liquidity risk and interest rate exposure The following table details the Institute’s interest rate exposure and the contractual maturity analysis for financial assets and financial liabilities. The maturity analysis section includes interest and principal cash flows. The interest rate exposure section analyses only the carrying amounts of each item.
Interest rate exposure and maturity analysis of financial assets and financial liabilities Interest rate exposure Maturity dates
Weighted Average Effective
Interest Rate
Carrying Amount
Fixed Interest
Rate
Variable Interest
Rate
Non-Interest Bearing
Nominal Amount
Up to 1 month
1-3 months 3 months-1 year
1-5 Years
More than 5 years
% $ $ $ $ $ $ $ $ $ $ 2015 Financial Assets Cash and cash equivalent(a)
2.90% 15,078,669 210,696 14,862,873 5,100 15,078,669 215,796 7,814,462 7,048,411 - -
Restricted cash and cash equivalent
1.80% 1,931,933 1,877,166 54,767 - 1,931,933 1,877,166 - 54,767 - -
Receivables (b) 615,941 - - 615,941 615,941 615,941 - - - - 17,626,543 2,087,862 14,917,640 621,041 17,626,543 2,708,903 7,814,462 7,103,178 - -
Financial Liabilities
Payables 598,684 - - 598,684 598,684 598,684 - - - -
Other Liabilities(c) 761,774 - - 761,774 761,774 - - 761,774 - - 1,360,458 - - 1,360,458 1,360,458 598,684 - 761,774 - -
(a) Includes the cash investments amount. (b) The amount of receivables excludes the GST receivables from the ATO (statutory receivable). (c) Only includes Delivery and Performance Agreement refund
Page 69 of 77

West Coast Institute | Annual Report 2015
Interest rate exposure Maturity dates Weighted Average Effective
Interest Rate
Carrying Amount
Fixed Interest
Rate
Variable Interest
Rate
Non-Interest Bearing
Nominal Amount
Up to 1 month
1-3 months 3 months-1 year
1-5 Years
More than 5 years
% $ $ $ $ $ $ $ $ $ $ 2014 Financial Assets Cash and cash equivalent(a)
3.46% 18,646,645 2,648,882 15,992,263 5,500 18,646,645 5,491,069 8,118,031 5,037,545 - -
Restricted cash and cash equivalent
3.92% 49,340 - 49,340 - 49,340 - 13,451 35,889 - -
Receivables (b) 407,578 - - 407,578 407,578 407,578 - - - - 19,103,563 2,648,882 16,041,603 413,078 19,103,563 5,898,647 8,131,482 5,073,434 - -
Financial Liabilities
Payables
1,475,571 - - 1,475,571 1,475,571 1,475,571 - - - -
Other Liabilities(c) 1,299,924 - - 1,299,924 1,299,924 - - 1,299,924 - - 2,775,495 - - 2,775,495 2,775,495 1,475,571 - 1,299,924 - -
(a) Includes the cash investments amount. (b) The amount of payables excludes the GST payable to the ATO (statutory payable) (c) Only includes Delivery and Performance Agreement refund
The amounts disclosed are the contractual undiscounted cash flows of each class of financial liabilities
Interest rate sensitivity analysis
The following table represents a summary of the interest rate sensitivity of the Institute’s financial assets and liabilities at the balance sheet date on the surplus for the period and equity for a 1% change in interest rates. It is assumed that the change in interest rates is held constant throughout the reporting period.
- 100 Basis Points + 100 Basis Points
Carrying amount Surplus Equity Surplus Equity 2015 $ $ $ $ $ Financial Assets
Cash Assets(a) 15,073,569 (150,736) (150,736) 150,736 150,736
Restricted Cash and cash equivalent 1,931,933 (19,319) (19,319) 19,319 19,319
- 100 Basis Points
+ 100 Basis Points
Carrying amount Surplus Equity Surplus Equity 2014 $ $ $ $ $ Financial Assets
Cash Assets(a) 18,641,145 (186,411) (186,411) 186,411 186,411
Restricted Cash and cash equivalent 49,340 (493) (493) 493 493 (a) Includes the cash investment amount
Fair Values
All financial assets and liabilities recognised in the Statement of Financial Position, whether they are carried at cost or fair value, are recognised at amounts that represent a reasonable approximation of fair values unless otherwise stated in the applicable notes.
Page 70 of 77

West Coast Institute | Annual Report 2015
2015 2014 37. Remuneration of Members of the Accountable Authority and Senior Officers Remuneration of members of the Accountable Authority The number of members of the accountable authority whose total fees, salaries, superannuation and other benefits for the financial year, fall within the following bands are:
$ $0 - $ 10,000 11 10 $10,001 - $ 20,000 2 1
$210,001 - $220,000 1 - $220,001 - $230,000 - 1
$ $ Base remuneration and superannuation 256,885 243,324 Annual leave and long service leave accruals 823 163 Other benefits 8,128 7,549 The total remuneration of the members of the accountable authority: 265,836 251,036
The superannuation included here represents the superannuation expense incurred by the Institute in respect of members of the Institute. No members of the Accountable Authority are members of the Pension Scheme.
Remuneration of Senior Officers The number of Senior Officers other than senior officers reported as members of the Accountable Authority, whose total fees, salaries, superannuation, non-monetary benefits and other benefits receivable for the financial year, fall within the following bands are:
$ $40,001 - $ 50,000(a) 1 -
$80,001 - $90,000(b) 1 - $90,001 - $100,000 - 1
$100,001 - $110,000(c) 1 1 $130,001 - $140,000(d) 3 2 $140,001 - $150,000 - 1
$150,001 - $160,000(e) 1 3 $160,001 - $170,000 2 -
$170,001 - $180,000(f) 1 - $190,001 - $200,000 - 1
$ $
Base remuneration and superannuation 1,381,920 1,263,046 Annual leave and long service leave accruals (82,643) 5,487 Other benefits 14,829 13,034 The total remuneration of senior officers is: 1,314,106 1,281,567 (a) Relates to Executive Director leaving part way through the year in 2015 (b) Relates to new Director in 2015. (c) Relates to General Manager on secondment in both 2014 and 2015. (d) Includes leave paid out of $9,743 (e) Includes leave paid out of $10,668 (f) Includes leave paid out of $9,068 The superannuation included here represents the superannuation expense incurred by the Institute in respect of senior officers other than senior officers reported as members of the Accountable Authority. No Senior Officers are members of the Pension Scheme.
Page 71 of 77

West Coast Institute | Annual Report 2015
2015 2014 $ $ 38. Remuneration of auditor Remuneration to the Auditor General in respect to the audit for the current financial year is as follows: Auditing the accounts, financial statements and performance indicators.
101,000 100,000
39. Related and Affiliated Bodies The Institute has no related or affiliated bodies as at the end of the reporting period. 40. Supplementary Financial Information
Write-Offs Public property written-off by the Governing Council during the financial year 49,856 48,575 Bad debts 18,939 24,830 Total 68,795 73,405 Loses Through Theft, Defaults And Other Causes Losses of public and other moneys and public and other property through theft or default - - Amount recovered (500) (4,350) Total (500) (4,350) Gifts of Public Property No gifts of public property were provided to the Institute in the years to 31 December 2015 and 2014.
41. Schedule of Income and Expenditure by Service The Institute provides only one service, Vocational Education and Training Delivery, as defined by Treasurer’s Instruction 1101 (9).
Page 72 of 77

West Coast Institute | Annual Report 2015
Appendix I Section 40 Estimates – 2015 Statement of Comprehensive Income 2015 for the 12 Months to 31 December 2015 $ COST OF SERVICES Expenses from ordinary activities Employee Expenses 28,931,701 Depreciation and amortisation expense 2,821,847 Supplies and services 9,833,323 Cost of Sales 130,981 Grants and subsidies 4 Other expenses from ordinary activities 2,976,896 Total Cost of Services 44,694,752 Income Revenue Fee for service 4,645,205 Student fees and charges 8,148,282 Sales 194,622 Ancillary trading 525,979 Commonwealth grants and contributions 15,835 Interest revenue 492,750 Other revenue 298,304 Total Revenue 14,320,977 NET COST OF SERVICES (30,373,775) INCOME FROM STATE GOVERNMENT State funds 24,755,725 Resources received free of charge 809,125 Total revenues from State Government 25,564,850 SURPLUS (DEFICIT) FOR THE PERIOD (4,808,925) OTHER COMPREHENSIVE INCOME Changes in asset revaluation reserve 2,917,690 Gains / (Losses) recognised directly in equity -
TOTAL COMPREHENSIVE INCOME FOR THE PERIOD (1,891,235)
Page 73 of 77

West Coast Institute | Annual Report 2015
Section 40 Estimates – 2015
Balance Sheet
2015 as at 31 December 2015 $ Current Assets Cash and cash equivalents 2,005,500 Restricted cash and cash equivalents 46,477 Inventories 52,050 Receivables 700,063 Other assets 11,813,152 Total Current Assets 14,617,242 Non-Current Assets Restricted cash and cash equivalents 106,889 Property, plant and equipment 114,954,333 Intangible assets 139,122 Total Non-Current Assets 115,200,344 Total Assets 129,817,586 Current Liabilities Payables 1,239,853 Provisions 3,973,376 Other liabilities 102,466 Total Current Liabilities 5,315,695 Non-Current Liabilities Provisions 1,825,594 Total Non-Current Liabilities 1,825,594 Total Liabilities 7,141,289 NET ASSETS 122,676,297 Equity Contributed Equity 57,116,140 Asset revaluation reserve 43,040,259 Accumulated surplus 22,519,898 TOTAL EQUITY 122,676,297
Page 74 of 77

West Coast Institute | Annual Report 2015
Section 40 Estimates - 2015
Changes in Equity Statement
2015
As at 31 December 2015 $ Balance of equity at start of financial year 122,567,533 Contributed equity Balance at start of financial year 55,116,140 Capital Contribution 2,000,000 Balance at end of financial year 57,116,140 Reserves Asset revaluation reserve Balance at start of financial year 40,122,569 Gains / (losses) from asset revaluation 2,917,690 Balance at end of financial year 43,040,259 Accumulated surplus (retained earnings) Balance at start of financial year 27,328,823 Surplus / (deficit) for the financial year (4,808,925) Balance at end of financial year 22,519,898 Balance of equity at end of financial year 122,676,297
Page 75 of 77

West Coast Institute | Annual Report 2015
Section 40 Estimates – 2015
Cash Flow Statement
2015 for the 12 Months to 31 December 2015 $ CASH FLOWS FROM STATE GOVERNMENT State funds Recurrent 24,755,725 Net cash provided by State Government 24,755,725 Utilised as follows: CASHFLOWS FROM OPERATING ACTIVITIES Payments Employee benefits (28,986,096) Supplies and services (9,024,198) Grants and subsidies (4) GST payments on purchases (788,000) Other payments (3,085,404) Receipts Fee for service 4,633,199 Student fees and charges 8,123,282 Ancillary trading 525,979 Commonwealth grants and contributions 15,835 Interest received 545,858 GST receipts on sales 130,925 GST receipts from taxation authority 655,537 Other receipts 492,927 Net cash used in operating activities (26,760,160) CASH FLOWS FROM INVESTING ACTIVITIES Purchase of non-current physical assets (3,311,079) Net cash used in investing activities (3,311,079) Net increase/(decrease) in cash held (5,315,514)
Cash and cash equivalents at the beginning of the financial year 19,031,005
Cash and cash equivalents at the end of the financial year 13,715,491
Page 76 of 77

West Coast Institute | Annual Report 2015
Contact West Coast Institute 35 Kendrew Crescent Joondalup WA 6027 Telephone: +61 8 9233 1049 Fax: +61 8 9233 1010 Email: [email protected] Web: www.wcit.wa.edu.au
Page 77 of 77