west coast trade report
TRANSCRIPT

West Coast Trade Report
70 Washington Street, Suite 305, Oakland, CA 94607510-987-5000 [email protected]
Well, it looked good for a couple of days at least. On April 10, the Port of Long Beach posted container trade numbers that painted a decidedly upbeat picture, with inbound trade up 7.3% (+18,290 TEUs), while outbound moves jumped 18.3% (+21,984 TEUs). Alas, three days later, the neighboring Port of Los Angeles reported numbers so dreadful as to suggest that U-boats had spent
the month torpedoing LA-bound ships off Angel’s Gate. The port’s inbound container volume stumbled by 29.2% (-109,089 TEUs) from a year earlier, while outbound trade was down 14.6% (-28,065 TEUs). That brought the total San Pedro Bay numbers to -14.6% on the inbound side (-90,799 TEUs) and -1.9% (-6,016 TEUs) on the outbound. Also less than buoyant were the March numbers from the Port of
Los Angeles 383,090 298,975 805,922 714,398
Long Beach 342,247 249,759 666,903 548,749
Oakland 73,666 64,106 148,802 144,547
NWSA 114,218 102,697 211,020 230,934
Boston 12,283 9,821 23,011 21,428
NYNJ 274,638 262,875 583,641 523,600
Philadelphia* 23,610 20,327 47,329 44,976
Wlmington DE* 15,114 15,350 32,090 31,588
Maryland 40,195 33,653 83,380 73,955
Virginia 100,368 96,921 204,518 198,223
South Carolina 70,397 73,855 148,566 156,953
Georgia 158,890 148,374 328,648 302,737
Jaxport 25,044 23,838 50,771 48,848
Port Everglades 31,315 31,474 62,393 62,456
Miami 30,132 32,361 64,571 67,045
New Orleans 8,910 7,236 17,599 17,421
Houston 84,799 73,389 174,242 157,978
Vancouver 135,844 126,759 274,821 255,898
Prince Rupert 42,533 29,789 88,904 70,777
Source Individual Ports*Does not distinguish loaded from empty containers.

West Coast Trade Report
April 2018 Page 2
Oakland, which indicated a slight dip in both directions of container trade. Inbound TEUs were down 1,595 TEUs (- 1.9%) from a year ago, while 445 fewer outbound TEUs (-0.7%) were shipped. Rounding out a decidedly off month for USWC ports, the Northwest Seaport Alliance reported a 12.9% fall-off in inbound TEUs (-15,492) and a 7.5% drop in outbound TEUs (-7,498). Adding up the West Coast numbers, 107,586 fewer TEUs entered USWC ports this
13,920 TEUs or 2.8%. As much as the USWC ports might like to blame the timing of the Asian New Year for their lackluster trades, British Columbia’s ports fared much differently. Up at the Port of Prince Rupert, inbound TEUs
totaled 11.9% higher (+4,119 TEUs) than a year earlier,
At Vancouver, imports were up 16.1% (+19,501 TEUs), while exports slipped by 4.0% (-1,036 TEUs). Meanwhile, back East, late winter snow storms notwithstanding, the March numbers released so far look uniformly solid. At
Sox, imports were up 46.8% (+3,677 TEUs) in March, while exports edged ahead by 6.6% (+402 TEUs). Container
(+13,458 TEUs) inbound and 6.8% (+6,264 TEUs) outbound. Charleston handled 9.1% (+7,346 TEUs) more inbound trade than a year earlier and 4.7% (+3,290 TEUs) more
Continued
Los Angeles 157,591 155,358 307,626 317,778
Long Beach 130,916 119,811 251,419 238,045
Oakland 73,905 72,581 148,788 145,909
NWSA 76,088 71,243 143,660 148,313
Boston 7,221 6,177 14,142 15,277
NYNJ 116,702 105,638 229,595 216,596
Philadelphia* 21,749 21,905 44,181 47,408
Wilmington DE* 5,594 7,002 11,322 13,602
Maryland 19,211 22,516 37,874 39,878
Virginia 82,102 85,827 158,398 175,594
South Carolina 69,063 66,296 128,808 133,164
Georgia 120,734 119,090 228,233 236,480
Jaxport 38,806 31,135 80,064 61,135
Port Everglades 35,985 34,776 70,387 67,221
Miami 30,316 29,339 62,809 60,508
New Orleans 20,939 22,247 41,170 44,315
Houston 85,606 88,553 156,752 176,956
Vancouver 80,766 94,027 156,894 179,491
Prince Rupert 14,261 12,692 28,744 23,986
Source Individual Ports*Does not distinguish loaded from empty containers.

West Coast Trade Report
April 2018 Page 3
2018 YTD
2017 YTD Source: Individual Ports
Continued
Los Angeles
Long Beach
NYNJ
Georgia
NWSA
Vancouver
Virginia
Manzanillo
Oakland
Houston
South Carolina
Jaxport
Lazaro Cardenas
Port Everglades
Miami
Maryland
Prince Rupert
Philadelphia
New Orleans
Boston
Wilmington DE
500,000 1,000,000 1,500,000
outbound. Savannah’s inbound container trade was up
increased by 11.0% (+13,170 TEUs).
For U.S. West
May 2017 as the Northwest Seaport Alliance posted an impressive 11.2% (+11,521 TEUs) bump over February of last year. The Ports of Long Beach and Los Angeles astonished everyone with a combined 32.2% year-over-year jump in inbound TEUs over last February. That translated into handling 176,603 more inbound TEUs than the two ports had processed a year earlier. Meanwhile, the Port of Oakland reported a solid 14.9% increase in inbound trade (+9,560 TEUs). Taken together, the Big 5 USWC container ports recorded a remarkable 25.1% (+197,684 TEUs) surge in import containers over February 2017.
The USWC experience in February contrasted sharply with the eleven Atlantic Coast ports we monitor. But unlike in recent months, it was the West that bested the East. Snowstorms and frigid temperatures up and down the Eastern Seaboard no doubt had a lot to with dampening ship movements and port operations on that side of the country as did the timing of the Asian New
in January was up 4.5% (+11,763 TEUs) in February, but three major East Coast gateways (Charleston, Everglades, and Miami) saw imports decline year-over-year.
On the export TEU side, USWC ports’ February numbers were positive but much less impressive. To be sure,
was up 4.8% (+13,338 TEUs) from last February. Oakland reported a relatively meek 1.8% (+1,324 TEUs) gain, while the Seattle/Tacoma alliance posted a 6.8% (+4,845 TEUs)
ports handled 19,507 more export TEUs (+ 4.7%) than in February 2017.
Here again, the USWC ports topped their East Coast rivals, albeit with a substantial boost from the weather. Collectively, the eleven ports we survey grew their export trades by 3.4% (+17,782 TEUs). As for the Gulf Coast Ports of New Orleans and Houston, February was

West Coast Trade Report
April 2018 Page 4
disappointing, with container exports down a combined 3.8% (-4,255 TEUs) from a year earlier.
The adjacent employs U.S. Commerce Department’s data on the declared weight and value of containerized shipments arriving and departing at U.S. mainland ports in February to determine the trade shares held by USWC ports. Overall, containerized imports at USWC ports in February was 12.4% higher by weight and 20.5% by value over the same month a year earlier.
on the next page provide a breakdown by major USWC port region: Los Angeles/Long Beach, Oakland, and the Northwest Seaport Alliance Ports of Seattle and Tacoma. Exhibit 5 looks at USWC ports’ shares of worldwide U.S. mainland container trade, while Exhibit 6 spotlights U.S.-East Asian container trade.
Tonnage-wise, China is by far the leading destination of USWC containerized exports with a 30.5% share in February. In next place was Japan with an 11.6% share, followed by South Korea (10.2%), Taiwan (9.4%), and Vietnam (6.6%).
China continued to overwhelmingly dominate containerized import tonnage entering USWC ports with a 56.9% share in February, up from 52.5% a year earlier. Trailing far behind in second place was Japan (4.9%); Vietnam (4.5%); Taiwan (4.3%); and South Korea (3.8%).
The Northwest Seaport Alliance Ports of
+11.2% on the inbound side and 6.8% on the outbound. However, Seattle continues to carry Tacoma in this
Association reveal widely divergent experiences at the
TEUs) jump in inbound containers over February 2017 and a 21.7% (+6,187 TEUs) increase in outbound trade. But at
from a year earlier, while inbound trade was off 10.9% (-6,819 TEUs).
U.S. foreign trade statistics reveal a similar dichotomy in terms of the declared weight of foreign shipments moving through the two ports. Seattle’s containerized imports were up 38.6% over February 2017, while its containerized
Continued
Feb 2018 Jan 2018 Feb 2017
By Weight 39.9% 41.0% 37.4%
By Value 49.0% 49.1% 46.7%
By Weight 35.3% 32.9% 39.4%
By Value 33.2% 32.3% 35.0%
By Weight 58.8% 58.0% 56.5%
By Value 68.5% 67.1% 65.8%
By Weight 56.20% 53.30% 59.20%
By Value 64.90% 62.00% 66.60%
Source: U.S. Commerce Department.
Photos courtesy of the Port of Hueneme

West Coast Trade Report
April 2018 Page 5
export tonnage rose 26.9%. Tacoma, meanwhile, handled 16.0% less import tonnage than it had a year earlier and
began a pattern of year-over-year declines in both imports and exports last May following a rejiggering of shipping alliances.
China’s effective ban on HS 470790 scrap is obviously going to restrain export growth at USWC ports this year. Last year, USWC ports shipped
Organization, was some pretty nasty scrap paper and cardboard. (Think bales of recycled pizza boxes with a slice or two of pizza still inside...after a long ocean voyage…
arriving on a hot, humid Chinese summer day.) So, earlier this year, Beijing formally upped the standards of import quality to a level nearly every scrap paper exporter in the U.S. and Europe argued was unattainable. Not surprisingly, China imported just 1,939 metric tons in February.
Why is this worth mentioning? Exports to China of HS 470790 containerized tonnage from USWC ports, which had amounted to 97,093 metric tons in February 2017, plummeted to just 1,939 metric tons this February, a drop of 98%. A year ago, HS 470790 accounted for as much as 8.7% of total containerized shipments to China. That trade now represents about 0.2% of total USWC container export tonnage to China.
Continued
Feb 2018 Jan 2018 Feb 2017
LA/LB 46.6% 46.3% 43.0%
Oakland 4.1% 4.2% 4.5%
NWSA 8.0% 7.0% 8.6%
LA/LB 54.3% 54.1% 51.0%
Oakland 3.7% 3.8% 3.9%
NWSA 10.3% 8.8% 10.5%
LA/LB 36.00% 33.60% 38.00%
Oakland 7.90% 8.00% 8.20%
NWSA 12.30% 11.50% 12.90%
LA/LB 45.3% 43.4% 46.2%
Oakland 10.4% 10.5% 11.1%
NWSA 13.1% 12.1% 14.1%
Source: U.S. Commerce Department.
Feb 2018 Jan 2018 Feb 2017
LA/LB 29.9% 31.4% 27.0%
Oakland 3.8% 3.6% 3.7%
NWSA 5.3% 5.0% 5.4%
LA/LB 38.1% 39.1% 35.6%
Oakland 3.3% 3.3% 3.4%
NWSA 7.40% 6.40% 7.30%
LA/LB 21.2% 19.7% 23.8%
Oaklamd 5.5% 5.5% 6.1%
NWSA 7.6% 7.3% 8.6%
LA/LB 22.1% 21.3% 23.5%
Oakland 6.3% 6.5% 6.3%
NWSA 4.5% 4.4% 4.9%
Source: U.S. Commerce Department.

West Coast Trade Report
April 2018 Page 6
Developments have been exceptionally fast in coming in the trade imbroglio between the United States and China.
sometimes shark-jumping reports warning of how much we all have to fear if things escalate into a full-on trade war.
What springs to mind is Herman Wouk’s couplet in The Caine Mutiny: “When in danger or in doubt, run in circles, scream and shout.”
Still, as next to impossible as it has become to provide timely commentary on the day’s all-important tariff tribulations in a newsletter that’s published just once a month, here’s what we know.
Any trade dispute involving China obviously creates problems for U.S. West Coast ports. Last year, USWC ports handled 63.5% ($247.59 billion) of the total U.S.-China maritime trade valued at $390.08 billion. Of that, 48.8% went through the Ports of Los Angeles and Long Beach alone. Including the 8.2% share that transited the NWSA Ports of Seattle and Tacoma and the 3.9% portion that the Port of Oakland handled, 60.9%
USWC ports last year. Smaller USWC ports like Longview and Kalama, Washington handled 2.6% of all U.S.-China maritime trade.
On the import side, 55.3% of the 68,094,005 metric tons of Chinese goods that entered U.S. ports last year came through USWC ports. As for exports, those same ports handled 25.9% of the 104,602,580 metric tons of exports that were shipped to China in 2017 from U.S. ports.
All of the major USWC ports do a sizable share of their business with China. Last year, the Ports of Los Angeles and Long Beach handled $386.04 billion worth of two-way trade, 46.9% of which involved China as either the destination or origin. Oakland was rather less dependent on its China trade, with the People’s Republic accounting for just 31.5% of its $48.34 billion in two-way trade last year. At the Northwest Seaport Alliance Ports of Seattle and Tacoma, 41.8% of last year’s $76.51 billion in maritime trade was conducted with China. Even a smaller,
niche ports like Longview does over 40% of its business with the PRC.
For the record, we are not in a trade war...yet. Apart from the initial volleys of higher tariffs aimed at curtailing imports of aluminum and steel into the U.S. and China’s retaliatory tariffs that targeted a cornucopia of U.S. fruits, nuts, and wines (along with pork, steel pipes, and aluminum scrap), subsequent exchanges between the two nations have been rhetorical exercises aimed at establishing bargaining agendas, while unnerving the people who actually trade goods internationally.
As for the impact of the new tariffs that have been imposed, there is currently only anecdotal information to go by, and that is seldom reliable. A local television station airing a story highlighting the woes of a local exporter too often goes viral, leading many viewers to conclude that entire American industries rather than
enough to permit analysts to gauge just how much trade is being affected will not be available until June 6 when the Commerce Department releases trade data for April.
There is, though, ample cause for concern about what those numbers will reveal about the higher tariffs now in place.
On March 1, acting under Section 232 of the Trade Expansion Act of 1962, the President announced the imposition of a 25% tariff on steel and a 10% tariff on aluminum imports that “threaten to impair the national security.“ Although the tariffs were originally intended to be applied universally, the administration soon moved to exempt several allied countries. However, China (along with Japan) was not among the countries shielded from the higher import levies. Those tariffs took effect on March 23.
Last year, USWC ports handled 27.6% of the 529.2 metric tons of iron and steel the U.S. imported from China and 51.6% of the 946.4 metric tons of imported Chinese aluminum.

West Coast Trade Report
April 2018 Page 7
by announcing a new 15% tariff to be levied against U.S. fruits, nuts, wines, and some steel pipes, along with a 25% tariff on pork and aluminum waste and scrap. Those levies took effect on April 2.
The Port of Oakland last year handled 42.3% of the nation’s 140,598 metric tons of edible fruits and nuts exports to China. Another 31.8% went through San Pedro Bay, while the NWSA accounted for 17.3%. Not surprisingly, Oakland, with its proximity to Northern California’s wine producing regions, shipped nearly 93% of U.S. wine exports to China last year.
It is worth noting, though, that for all the attention being devoted to the plight of wine, fruits and nut exporters, it’s the 25% tariff on aluminum waste and scrap that will likely have a greater impact on USWC port operations. Why? Because, at 388,602 metric tons last year, aluminum waste and scrap shipments to China from USWC ports easily outweighed the 109,471 metric tons of exports of fruits and nuts to the PRC or the 21,267 metric tons of wine.
So how are these new Chinese tariffs likely to affect business at USWC ports? The answer will be determined not by trade theory so much as by how individual Chinese importers respond. Imposing a higher tariff does not necessary close a market to imported goods. Although a higher tariff on, say, California wines going into China will certainly increase the cost to the importer, a lot depends on what then happens on the ground. In the case of wine, it seems highly unlikely that a 15% increase in import duties will automatically cause a Chinese importer of high-quality California wines to walk away from years invested in building a presence for those wines in China, especially if the tariff is viewed as a temporary inconvenience that might soon be negotiated away.
In the case of the higher tariff Beijing has slapped on pork imports from the U.S., three-quarters of that trade is actually controlled by the Chinese multinational that
hotdogs along with Armour and John Morrell bacon. We’ll see whether certain “accommodations” will be made to
it is still the case that U.S. pork shipments to China have been increasingly routed through USWC ports in recent years, with the share growing from 22.8% in 2015 to 39.0% in 2016 to 46.1% last year.
The U.S. Trade Representative is expected to announce any day now the details of the next tranche of higher tariffs on imports from Chinese. Up to now, most consumer items like cell phones, apparel, footwear, and furniture have been excluded from higher levies. However, to meet the target of imposing an additional $100 billion in tariffs on Chinese goods, that will certainly have to change. Again, it will be some time before such proposed tariffs would be employed, if they ever are.
Those increased tariffs would be imposed on consumer goods that typically arrive in containers. Those new tariffs
in dollar terms, handled 68.2% of the $302.54 billion in containerized imports from China last year. Just by themselves, the Ports of Los Angeles and Long Beach accounted for 55.3% of those imports. By declared weight, 59.2% of the 61,253 million metric tons of containerized goods that arrived from China at U.S. ports last year went through USWC ports, with the San Pedro Bay ports alone holding a 47.3% share of the trade.
Actions that would erode trade volumes would have a wide range of immediate consequences from reduced port revenue to lay-off notices throughout the complex logistical systems that support the ports. These impacts would be particularly large in Southern California, given the disproportionate share of the China trade that moves through San Pedro Bay. But further rounds of tariffs could prove even more debilitating for smaller ports like Washington State’s Port of Kalama.
Speculation has it that Beijing could ultimately seek to impede exports of U.S. soybeans or Boeing aircraft in the next round of higher tariffs. Such a development could have a particularly damaging impact on Washington State, not so much because Boeing has major operations there but because the state’s ports play a key role in transporting soybeans to China. At Kalama, for example, soybean shipments to China accounted for one-third of its entire export volume in 2017.
Continued

West Coast Trade Report
April 2018 Page 8
A brewing trade dispute between the world’s two largest economies comes at a particularly inopportune time for USWC ports planning on investing billions of dollars to upgrade facilities to meet the growing competitive challenge posed by rivals on the East and Gulf Coast ports and in British Columbia but also increasingly stringent air quality standards being set by state and local governments. Ports derive their revenue largely from the volumes of containers or cargos crossing their docks. A major trade dispute that could easily curtail the volume of goods
helpful.
Still, it bears stressing, threats of new tariffs are not tariffs. They are bargaining chips that negotiators will have to address in the coming months. At the same time, there is growing pressure within the U.S. to roll back or rescind the higher tariffs on steel imports and to think long and hard about the virtues of using tariffs on goods to resolve issues that are more and more coming to involve intellectual property.
For the time being, at least, Beijing’s warning that it might impose a 25% tariff on imports of U.S. soybeans is merely
of Kalama probably won’t have to hold bake sales to supplement its maritime revenue.
I know one economist who insists that, as a lad, he had predicted Bill Mazeroski would hit Ralph Terry’s second
Field for the walk-off homerun that gave the Pirates a seventh game victory in the 1960 World Series. I know this because he reminds me of his (alleged) precocious prognostication every year at World Series time.
His may be an extreme case, but it’s not unusual. Economic forecasters are notorious for shamelessly advertising the ones they got right. (And, if they were nearly alone among their peers in doing so, you’ll never
hear the end of it...as Paul Krugman incessantly reminds
As for the forecasts they blew, most authors of aberrant predictions pray to Lethe, the Greek goddess of forgetfulness, in hopes that no one will recall the times their educated guesswork went seriously awry.
Of course, one sure way of abetting the public’s amnesia is to avoid going around reminding everyone of how very far off your predictions have been. That’s why we should be impressed by the forthrightness shown by Drewry’s senior quantitative economist Mario Moreno at last month’s “Pulse of the Port” confab down at the Port of Long Beach. Before presenting his estimates of U.S.-Asia container trade volumes in 2018, Mr. Moreno took pains to remind his audience of just how poorly he did with the forecast he presented at the same conference a year earlier.
For example, he noted that U.S. container imports from Asia grew by 3.5% in 2017, or just about half of the 6.9% growth he had expected. Similarly, he conceded that the 0.8% decline in U.S. containerized export volumes to Asia in 2017 was much lower than the 1.3% increase he foresaw in that trade.
The self-confessed margins of error that characterized Mr. Moreno’s 2017 trade forecasts were roughly consistent with his 2016 forecasts. Standing before last year’s “Pulse of the Port” audience, he noted that the actual 6.0% increase in U.S. container exports to Asia in 2016 differed substantially from the 0.8% decline he had anticipated. He likewise conceded that the 4.1% growth in container imports from Asia in 2016 was rather less than the 5.5% increase he had predicted.
As for 2018, Mr. Moreno thinks that, in the absence of a major trade war with China, U.S. containerized imports from Asia should increase by 6.8%, while U.S. exports to Asia should grow by 4.9%.
Jock’s comments are his own and do not necessarily represent the views of PMSA.
Continued
West Coast Trade Report
April 2018 Page 9
For almost a decade, the logistics industry has faced the threat of “indirect source rules” or ISRs. Indirect source rules are a clever way of saying that facilities should be re-sponsible for emissions from sources they do not control. That is why it is referred to as “indirect”. So, under the ISR logic, a warehouse in the Inland Empire would be responsi-ble for the trucks picking up and dropping off freight – this would be similar to a grocery store telling its customers what kind of car they could use on a shopping trip. For the moment, put aside the absurdity of making someone responsible for something they do not control – I will come back to that.
I want to start off with the interminable process that indus-try has faced. This process, through all its twists and turns,
has the power to regulate mobile sources in California and,
Authority to regulate mobile sources has been vested in the Air Resources Board (CARB) since California began con-trolling emissions for the simple reason that mobile sourc-es move throughout the State (not to mention the country) and vehicle operators could never comply with a patchwork of different regulations from county to county. CARB has often implemented this authority through two straightfor-
which CARB has ensured that each new generation of ve-hicles is cleaner than the last. Through the second, CARB often accelerates the impact of new engine standards by issuing in-use standards, basically requirements that vehicles be retired before the end of their useful life forcing the adoption of newer, cleaner equipment. Through these requirements, new vehicles are more than 90% cleaner than older vehicles…and are getting cleaner still.
Local air pollution control districts were granted authority over stationary sources for the simple reason that, as the name implies, these sources do not move and cannot be subject to multiple jurisdictions. Local air pollution con-trol districts have always coveted CARB’s mobile source
authority. Indirect source rules are a means through which local districts can wield mobile source authority. To date, no indirect source rules have been initiated by a local air pollution control district on freight facilities.
The current battle over indirect source rules arguably begins with the South Coast Air Quality Management District’s (SCAQMD) 2017 Air Quality Management Plan. In that plan, SCAQMD once again put indirect source rules on the table. After years of development, the approval of the 2017 plan in March of last year accelerated the discussion of indirect source rules. A month later, CARB also took up the issue of indirect source rules – despite the fact it has direct regulatory authority to set emissions standards for engines. A year later, CARB staff concluded that its au-thority is better exercised through establishing new engine standards and in-use standards.
However, during Board discussion and public discussion of the topic, it was revealed that community activists are unhappy with the local land-use decisions made by their local elected representatives and they seek tools from CARB to block or overturn local land use decisions. Appar-ently, the CARB Board is sympathetic to wading into local land-use decisions. As a recent Los Angeles Times article concluded:
“Responding to residents urging rules at a meeting last month, [CARB Chair] Nichols said the proliferation of warehouses has ‘not gone unnoticed. It’s a really serious problem,’ and the Air Resources Board was watching the South Coast district very closely and ‘hoping that they will do the right thing.’
“‘And if some reason they don’t,’ Nichols said, ‘then we will have to take action.’”
This past March, SCAQMD heard public testimony on staff’s proposal to initiate a regulatory process for freight facility indirect source rules (or as SCAQMD calls them “facility-based measures”). Following public testimony, the Board postponed the item since not all Board members

West Coast Trade Report
April 2018 Page 10
were present. In April, with more Board members absent, the Board again voted to postpone consideration. In May, if
know where the SCAQMD stands on indirect source rules – a phenomenally bad public policy that, if implemented, would have dire consequences for the logistics industry, the ports and consumers throughout the United States.
Why dire consequences?
Unlike the straightforward regulatory approach taken by California for decades, indirect source rules call on freight facilities, like marine terminals, to be responsible for emis-sions from mobile sources like trucks – sources they do not control. Indirect source rules have no requirement that equipment manufacturers build compliant trucks, unlike new engines standards. Indirect source rules have no
new, cleaner equipment, unlike in-use standards. Instead,
owners don’t purchase those vehicles. The only other op-tion would be to shut down facilities when they reach their emission threshold. Imagine how that would play out in a global trade environment?
Which raises the question, how is indirectly regulating something more effective than doing so directly? How are indirect source rules a better strategy to clean up the air than new engine standards and new in-use standards? Or are indirect source rules simply a power grab by regulators attempting to exert control over a vibrant part of Califor-nia’s economy?
Continued
Contact Laura Germany for details at: [email protected] or 510-987-5000.
Photos courtesy of the Port of Hueneme

West Coast Trade Report
April 2018 Page 11
PMSA Copyright © 2018It is prohibited by law to forward this publication to any other person or persons. This material may not be re-published, broadcast, rewritten or distributed without written permission from PMSA.
Follow PMSA on Twitter @PMSAShip and Facebook.
3.5
3.0
2.5
2.0
1.5
1.0
0.5
0.0
DAYS
Mar Apr May June July Aug Sep Oct Nov Dec Jan Feb Mar 2017 2017 2017 2017 2017 2017 2017 2017 2017 2017 2017 2017 2018
1,600,000
1,400,000
1,200,000
1,000,000
800,000
600,000
400,000
200,000
0
Rolling 12 months
Weighted Average Dwell Time in Days San Pedro Bay Container Throughput in TEUs (Ports)
TEUs
Mar Apr May June Jul Aug Sep Oct Nov Dec Jan Feb Mar 2017 2016 2017 2017 2017 2017 2017 2017 2017 2017 2017 2017 2017
10%
8%
6%
4%
2%
0

INVITES YOU TO PARTICIPATE:
Unquestionably, 2017 was an exciting year for new zero and near-zero emission product announcements; from drayage trucks, yard tractors, and other cargo handling equipment. The forthcoming year will be no different with several new product announcements already made in early 2018.
Join PMSA for a two-day event that includes access to relevant panels and
hydrogen and natural gas technologies, and networking opportunities.
$150 for PMSA members | $185 for non-members
The Ultra-Clean Cargo Handling Equipment SummitThursday, May 3 | 9:00am – 12:30pm
Join PMSA for this three part workshop that will cover: Part I: The Policy Push for Ultra Clean Equipment & Vehicles Part II: Dueling Technologies for Cleaner Cargo-Handling Equipment Part III: Challenges of Near-Zero and Zero Emission Infrastructure at Ports,
Rail Yards and Logistic Warehouses
Director Environmental Management Division
Director of Environmental Planning
Regional Sales Manager-West
Regional Sales Manager, Western Region
Senior Account Manager
Program Manager

WA State Board of Pilotage Commissioners
Industry Update: May 17, 2018 Meeting
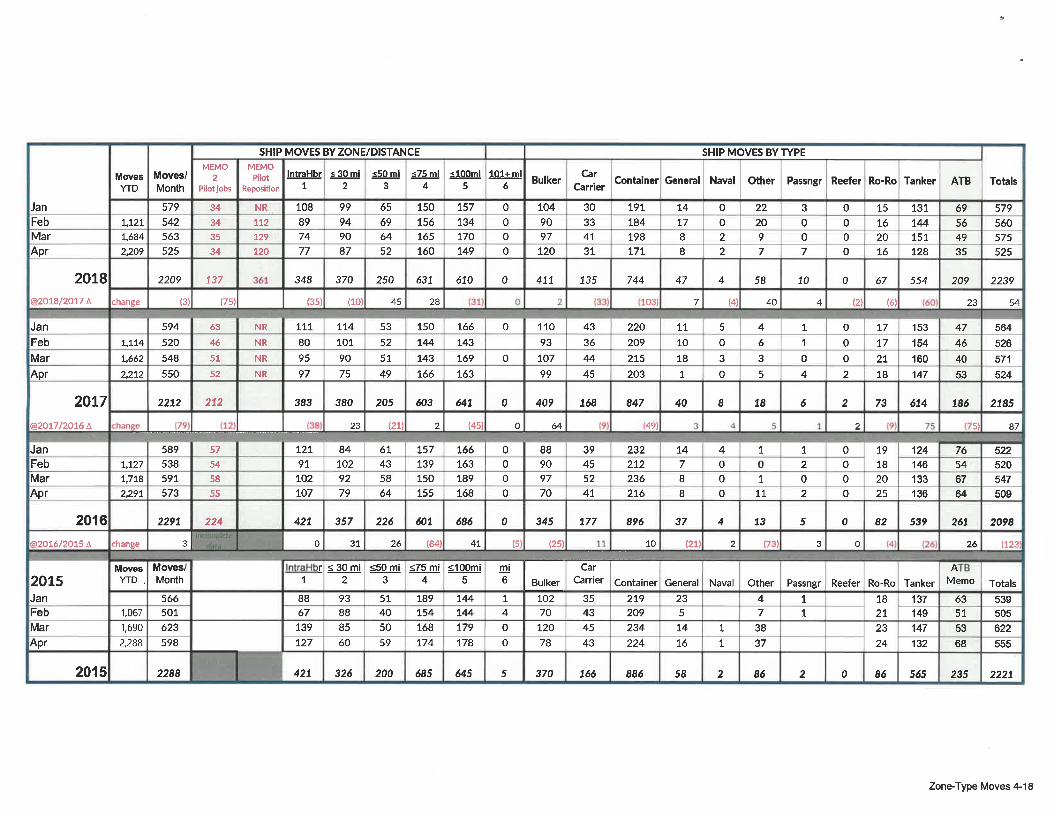
Vessel Non-Tank Arrivals Fall YTD Non-tank (cargo) arrivals down 13 YTD
� Bulkers up 2
� Containers even
� RO/RO down 7
� Car Carriers down 11
� General down 2
� “Others” up 5
Tankers/ATB’s increased 40 YTD
� Partially due to comparison to a very low February in 2017
� Recall the downward trend over past two decades
� ATB’s represent more than 10 percent of assignments
Grays Harbor up 2 YTD
Vessel Traffic Assessments Transboundary Forum(s) Discussions Continue…
� Ecology conducting a study per the recent legislation
� Harbor Safety Committee & PACMAR (Canada) meeting May 30th
in Vancouver
� U.S. & Canada continue to meet on Response & Vessel Traffic Managment
� Orca Protection (ECHO Program, lateral displacement on outbound lane in
SJDF, Changes in Haro… will explain more verbally)
� Governor Inslee Task Force meets on May 24th
� Canada Oceans Protection Plan continues to roll out
Seattle Head Tax: Businesses
scratching their heads over policy,
costs and “what’s next” questions.
PMSA, ILWU, BNSF and many others
submitted letters of concern urging
the council and mayor not to proceed
(terminals would supposedly be
caught up in this increasing terminal
costs). Referendum effort has been
initiated.

Long Beach Cargo Volumes Ahead of Record Pace Maritime Logistics Professional
The 2.5 million twenty-foot equivalent units moved by the Port of Long Beach in the first four months of 2018 is more
than 17 percent above last year’s record pace. In April, Long Beach dockworkers handled 618,438 twenty-foot
equivalent units (TEUs), a 10.8 percent increase above the same month last year.
Import containers grew 8.4 percent to 312,376 TEUs compared to last April. The number of exports moved through
Long Beach jumped 22 percent to 141,799 TEUs, and empty containers sent overseas to be filled with goods totaled
164,264 TEUs, up 7 percent.
New Generation of Diesel Power Delivers Cargo and Cleaner Air to America’s Ports Latest-generation Diesel Technologies Deliver More than 80 Percent Emission Reductions Globe Newswire
The newest generation of diesel technologies offer innovative and sustainable options that help America’s ports
achieve near-zero emissions, today. “America’s sea and river ports underpin roughly 26 percent of the U.S. economy,
generating $4.6 trillion in economic activity, and providing jobs for 23 million workers. Moving this trade requires
many diesel-powered trucks, trains, ships, cargo handling equipment, barges and marine workboats,” said Allen
Schaeffer, executive director of the Diesel Technology Forum. “It’s important that we do so in the most economic,
environmentally friendly way possible. By using new-technology diesel engines and ultra-low-sulfur diesel fuel, port
administrators and equipment operators can be sure to deliver fuel efficiency, power, performance and reliability,
along with significant emission reductions for the communities near our nation’s ports.”Starting in 2015, new diesel
engines used in large equipment were required to meet Tier 4 emissions standards which, relative to previous
generations of technology, reduces emissions of nitrogen oxides (NOx) and fine particle emissions (PM) between 88
and 95 percent.
Port of Oakland cargo volume up 2.9 percent from a year ago April was the Port's best month ever for imports in its 91-year history
Oakland, Calif. – May 14, 2018: The Port of Oakland’s total cargo volume is up 2.9 percent over the same period a
year ago. The Port today reported that terminals handled 791,371 TEUs between January to April 2018. A TEU is the
equivalent of one container that is 20 feet long. During the same period in 2017, the volume was 768,789 TEUs. Total
volume includes loaded and empty containers. April 2018 was the Port’s best month ever for imports in its 90-year
history. The volume for loaded imports was 75,369 TEUs. The previous record was in April 2006 at 75,243 loaded
imports.
Prince Rupert is solution to West Coast market-access issues By Bud Smith, The Province
A headline in a recent issue of The Financial Post raised the alarm: Fears grow, Canada missing the boat on expanding
vital West Coast ports. The story went on to highlight concerns about constraints on growth and Canada’s ability to
capitalize on future opportunities and transport goods in and out of the West Coast, especially given the additional
billions in trade volumes expected following ratification of the Comprehensive and Progressive Trans-Pacific
Partnership (CPTPP). The solution to Canada’s current West Coast market-access issues is the Port of Prince Rupert.
Japan Catches Up With Shipping Consolidation MOL, K-Line and NYK Line pump $3 billion into Ocean Network Express, which is now world’s sixth-largest container operator
By Costas Paris and Chieko Tsuneoka, Wall Street Journal
TOKYO—Japan has caught up with a wave of consolidation sweeping the shipping industry, with its three biggest
carriers merging their container operations to compete with bigger rivals in Asia and Europe. Mitsui O.S.K. Lines
(MOL), Kawasaki Kisen Kaisha Ltd. 9107 1.20%▲ , (K-Line) and Nippon Yusen Kabushiki Kaisha NPNYY -0.23%▲ (NYK
Line) pumped $3 billion into the merged company called Ocean Network Express (ONE) that kicked off operations last
month as the world’s sixth largest container operator, with a combined fleet of 230 vessels.

Maersk to Cut Services as It Battles Shipping Glut The container operator’s first-quarter loss widened amid falling freight rates and rising trade risks and fuel costs By Costas Paris and Ian Walker Updated May 17, 2018 10:16 a.m. ET A.P. Moller-Maersk AMKBY -8.21%▲ A/S said it would cut back on capacity to combat falling freight rates and rising fuel costs, after the Danish shipping giant reported a weak first quarter that sent its shares down about 8%. The world’s biggest container operator said its underlying loss widened to $239 million from a loss of $139 million a year earlier, with Chief Executive Soren Skou blaming rampant overcapacity as the main culprit and warning that a trade war between the U.S. and China would dash any hopes of a recovery in the shipping industry after a long down cycle. “In the short term we will be closing down some services,” Mr. Skou said in an interview. “Overcapacity is the biggest defect.” Maersk shares were down 7.9% to 9,350 Danish kroner (about $1,480) on the Copenhagen Stock Exchange. Maersk reported a net profit of $2.75 billion, compared with a profit of $245 million in the same period last year, but the gain came from the sale of two units, Maersk Oil and Maersk Tankers. Mr. Skou said higher fuel prices had added $70 to the cost of shipping a container from Asia to Europe and across the Pacific. Maersk currently moves more than 4 million containers, or 19% of global capacity. Freight rates between Asia and Europe hover around $780 per box, about half the $1,500 break-even level. Maersk reiterated previous guidance that it expects 2018 underlying profit to be above the 2017 figure of $356 million, but Mr. Skou said that depends on growing geopolitical risks. “A trade war between the U.S. and China would be very, very bad,” he said, adding that new U.S. sanctions on Iran are “a driver” for rising oil prices. “Costs are rising overall and becoming inflationary. That’s no what we are used to,” Mr. Skou said. He said Maersk leases or charters around 400 ships from a total of 750 in operation and that a number of them would be returned to their owners.

Maersk bought German competitor Hamburg Süd for $4 billion last year, which expanded its capacity by around 30%, while cargo volumes have grown by 24%. Mr. Skou said Maersk would stop moving cargo to and from Iran, fearing repercussions from Washington. “No shipping line that operates globally will be able to do business in Iran if the sanctions come to full force the way they intend to,” he said. Container ships move the vast majority of manufactured goods and Maersk’s performance is seen as a barometer of the health of global trade.

April 2018
Improving Waterfront Access
The maintenance of our nation’s waterways, including the Grays Harbor Navigation Channel and its aids to navigation, is critical to ensuring US grown and manufactured goods reach their markets throughout the globe. On April 20th, at the U.S. House Subcommittee on Water Resources roundtable discussion in Coos Bay, Oregon, Port of Grays Harbor Executive Director Gary Nelson addressed the importance of maintaining our nation’s waterways and how a unified industry agreement for full-use of the Harbor Maintenance Tax revenues could help achieve this. “At the Port of Grays Harbor, we depend on the maintenance of our
federal navigation channel to ensure our customer’s products, which are grown and manufactured in the U.S. Midwest and Intermountain Region, can safely and efficiently reach their markets throughout the Pacific Rim,” stated Mr. Nelson. “Our customers recognize the strategic advantage of our Port and have invested millions of dollars in their facilities to take advantage of our location and proximity to Pacific Rim markets.” The Port of Grays Harbor ranks 37th in the nation for export cargo volumes. The U.S. Army Corps of Engineers conducts annual maintenance of the Grays Harbor navigation channel to support this nationally significant trade infrastructure.
Partnerships for a Stronger Economy Gary Nelson participates in
Congressional waterways roundtable
28th Street Landing & Boat Launch to close for improvements
Long awaited improvements at the popular 28th Street Landing and Boat Launch will kick-off next week, closing the facility from May 1, 2018 through mid-September, 2018. The project will include demolition of the existing boat ramp, construction of a new, wider ramp, a permanent restroom, a second boarding float, improved lighting, and paving and striping of the parking lot. In-water work will take place after the fish window opens in mid-July. “We are excited to see this important waterfront access improvement project get underway and are confident it will be completed in time for the beginning of fall fishing season for the community to enjoy,” shared Port Commissioner Stan Pinnick. Local contractor Rognlin’s, Inc. was awarded the contract in February and will begin work on May 1st. The project was awarded grant funding through the Recreation Conservation Office Boating Facilities Program.
Port of Grays Harbor Executive Director Gary Nelson (second from right) addresses the importance of maintaining our nation’s waterways at the U.S. House Subcommittee on Water Resources roundtable discussion in Coos Bay, OR.

Port Leadership
Earlier this month the Port welcomed Mike Folkers to the senior management team as the new Director of Finance and Administration. Mr. Folkers brings a solid background of effectively leading municipal finance departments throughout Grays Harbor County over the past two decades. He holds an MBA from Washington State University and a BA in Aeronautics and Astronautics Engineering from the University of Washington. Mike will replace Mary Nelson when she retires this June after 23 years with the Port.
Calendar April 27-29 GH Shorebird Festival April 30 Siem Plato @ T4 May 3 Gemini Leader @ T4 May 5 New Legacy @ T2 May 7 PGH Commission Meeting, PGH Offices @ 9am Imperial Fortune @ T2 May 8 Metis Leader @ T4 May 11 CSAV Rio Grande @ T4 May 17 Sunny Hope @ T2 May 21 Hojin @ T4 May 24 Satsop Walking Tour, SBP @ 3pm Siem Socrates @ T4
Around the Docks is a publication of the
Port of Grays Harbor On Washington’s Pacific Coast
It is available online at PortofGraysHarbor.com
To join our mailing list contact Kayla Dunlap at [email protected]
PGH welcomes new Director of Finance and Administration
23rd Annual GH Shorebird Festival this weekend
Recreation & Tourism
Each spring hundreds of thousands of shorebirds stop to rest and feed in the Grays Harbor estuary, some coming from as far south as Argentina. And for the 23rd year in a row, the Grays Harbor Shorebird Festival will offer a weekend full of shorebird viewing and education for the whole family. The Grays Harbor National Wildlife Refuge, adjacent to and accessible from the Port of Grays Harbor’s Bowerman Airport, is a prime viewing location to see these spectacular migrating birds. For more information on this year’s Shorebird Festival events, visit www.shorebirdfestival.com
With nearly 400 employees reporting to work daily at the Satsop Business Park, Grays Harbor Transit has announced it will begin shuttle service to the Park from the Elma Transit Center beginning May 7th. “As businesses continue to locate and expand at the Park, we are so pleased Grays Harbor Transit is able to offer this important transportation option so that residents throughout Grays Harbor County may consider employment options here,” noted Satsop Business Park Business Development Manager Alissa Shay. The service fare will be $1 each way and transfers are free. Grays Harbor Transit offers hundreds of routes throughout Grays Harbor County. For more information and the complete shuttle schedule, visit www.ghtransit.com
GH Transit to service Satsop Business Park beginning May 7th
Tenant Growth
Pictured above is the 2018 Best of Show from the grade school shorebird poster contest entitled "I'm youth I'm joy, I'm a little bird that has broken out of its egg" by Ezri Carroll, Grade 5, St. Mary School
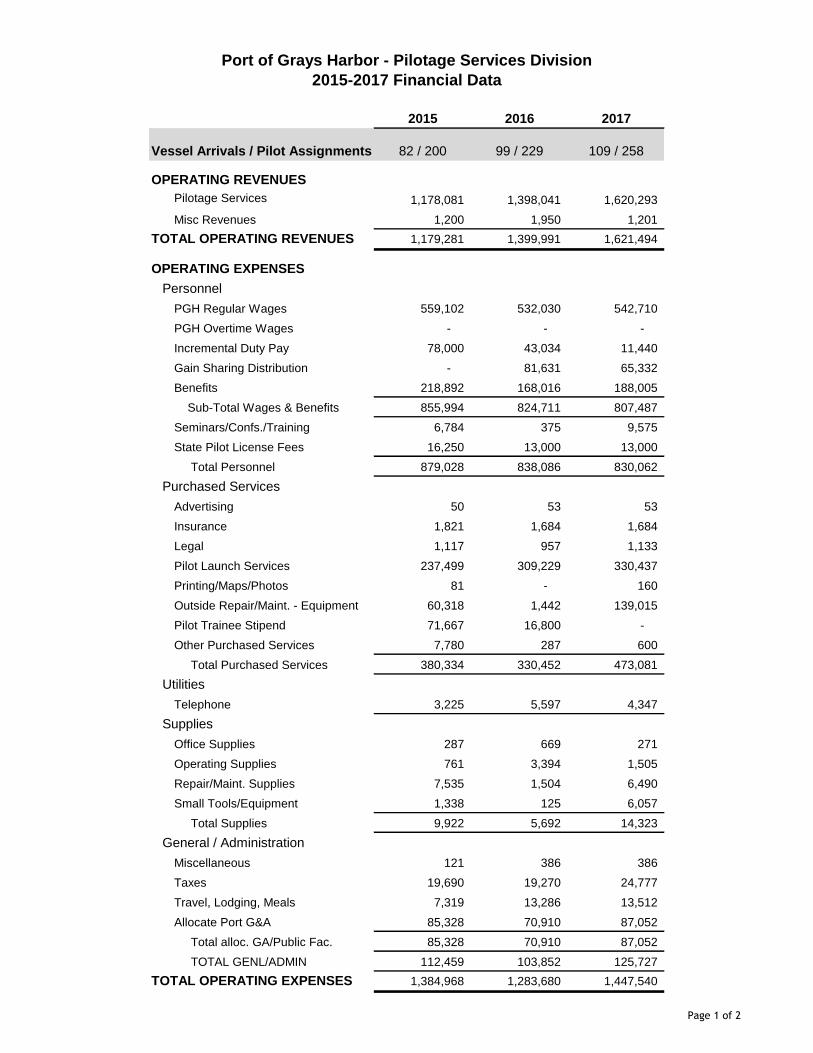
Port of Grays Harbor - Pilotage Services Division
2015-2017 Financial Data
2015 2016 2017
Vessel Arrivals / Pilot Assignments 82 / 200 99 / 229 109 / 258
OPERATING REVENUES
Pilotage Services 1,178,081 1,398,041 1,620,293
Misc Revenues 1,200 1,950 1,201
TOTAL OPERATING REVENUES 1,179,281 1,399,991 1,621,494
OPERATING EXPENSES
Personnel
PGH Regular Wages 559,102 532,030 542,710
PGH Overtime Wages - - -
Incremental Duty Pay 78,000 43,034 11,440
Gain Sharing Distribution - 81,631 65,332
Benefits 218,892 168,016 188,005
Sub-Total Wages & Benefits 855,994 824,711 807,487
Seminars/Confs./Training 6,784 375 9,575
State Pilot License Fees 16,250 13,000 13,000
Total Personnel 879,028 838,086 830,062
Purchased Services
Advertising 50 53 53
Insurance 1,821 1,684 1,684
Legal 1,117 957 1,133
Pilot Launch Services 237,499 309,229 330,437
Printing/Maps/Photos 81 - 160
Outside Repair/Maint. - Equipment 60,318 1,442 139,015
Pilot Trainee Stipend 71,667 16,800 -
Other Purchased Services 7,780 287 600
Total Purchased Services 380,334 330,452 473,081
Utilities
Telephone 3,225 5,597 4,347
Supplies
Office Supplies 287 669 271
Operating Supplies 761 3,394 1,505
Repair/Maint. Supplies 7,535 1,504 6,490
Small Tools/Equipment 1,338 125 6,057
Total Supplies 9,922 5,692 14,323
General / Administration
Miscellaneous 121 386 386
Taxes 19,690 19,270 24,777
Travel, Lodging, Meals 7,319 13,286 13,512
Allocate Port G&A 85,328 70,910 87,052
Total alloc. GA/Public Fac. 85,328 70,910 87,052
TOTAL GENL/ADMIN 112,459 103,852 125,727
TOTAL OPERATING EXPENSES 1,384,968 1,283,680 1,447,540
Page 1 of 2

Port of Grays Harbor - Pilotage Services Division
2015-2017 Financial Data
2015 2016 2017
Vessel Arrivals / Pilot Assignments 82 / 200 99 / 229 109 / 258
(205,687) 116,311 173,954
Direct Depreciation (17,033) (18,009) (20,156)
Allocated Depreciation (2,524) (2,408) (2,028)
TOTAL DEPRECIATION EXPENSE (19,557) (20,417) (22,184)
(225,244) 95,893 151,770
PASS THROUGH CHARGES
Pension Charges (Paid to PS
Pilots for payments to GH
retirees of the GH Pilot Assoc.)
80,600 106,027 136,224
Travel Allowance (Paid to pilot on
a per job basis)22,545 22,260 27,300
OPERATING INCOME (LOSS)
AFTER DEPRECIATION
OPERATING INCOME (LOSS)
BEFORE DEPRECIATION
Page 2 of 2
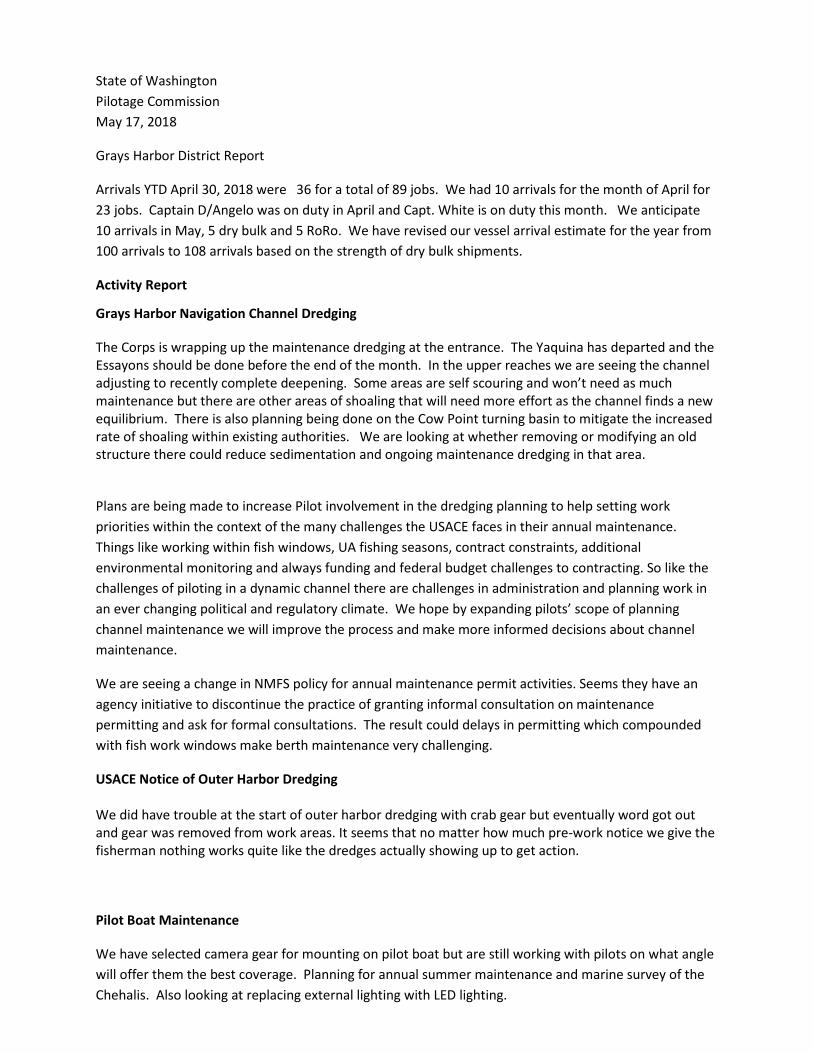
State of Washington Pilotage Commission May 17, 2018
Grays Harbor District Report
Arrivals YTD April 30, 2018 were 36 for a total of 89 jobs. We had 10 arrivals for the month of April for 23 jobs. Captain D/Angelo was on duty in April and Capt. White is on duty this month. We anticipate 10 arrivals in May, 5 dry bulk and 5 RoRo. We have revised our vessel arrival estimate for the year from 100 arrivals to 108 arrivals based on the strength of dry bulk shipments.
Activity Report
Grays Harbor Navigation Channel Dredging
The Corps is wrapping up the maintenance dredging at the entrance. The Yaquina has departed and the Essayons should be done before the end of the month. In the upper reaches we are seeing the channel adjusting to recently complete deepening. Some areas are self scouring and won’t need as much maintenance but there are other areas of shoaling that will need more effort as the channel finds a new equilibrium. There is also planning being done on the Cow Point turning basin to mitigate the increased rate of shoaling within existing authorities. We are looking at whether removing or modifying an old structure there could reduce sedimentation and ongoing maintenance dredging in that area.
Plans are being made to increase Pilot involvement in the dredging planning to help setting work priorities within the context of the many challenges the USACE faces in their annual maintenance. Things like working within fish windows, UA fishing seasons, contract constraints, additional environmental monitoring and always funding and federal budget challenges to contracting. So like the challenges of piloting in a dynamic channel there are challenges in administration and planning work in an ever changing political and regulatory climate. We hope by expanding pilots’ scope of planning channel maintenance we will improve the process and make more informed decisions about channel maintenance.
We are seeing a change in NMFS policy for annual maintenance permit activities. Seems they have an agency initiative to discontinue the practice of granting informal consultation on maintenance permitting and ask for formal consultations. The result could delays in permitting which compounded with fish work windows make berth maintenance very challenging.
USACE Notice of Outer Harbor Dredging We did have trouble at the start of outer harbor dredging with crab gear but eventually word got out and gear was removed from work areas. It seems that no matter how much pre-work notice we give the fisherman nothing works quite like the dredges actually showing up to get action.
Pilot Boat Maintenance
We have selected camera gear for mounting on pilot boat but are still working with pilots on what angle will offer them the best coverage. Planning for annual summer maintenance and marine survey of the Chehalis. Also looking at replacing external lighting with LED lighting.

Business Development
We continue to work on export potash facility. It seems like it is taking forever for customer select a preferred Port. Guess we should solace in being one their final sites. In any case it sounds like by this time next year they will make a preferred site selection.
Planning continues on a new OCC pulpmill in Hoquiam on former mill site. Could mean a couple of project cargo calls with equipment and with any luck some outbound break bulk of pulp.
We have seen slight increase in interest for rail served waterfront. This is typical when bulk markets heat up and shippers have access issues they begin looking at alternatives. The problem is they are looking for quick cheap fixes that typically don’t exist for waterfront facilities.
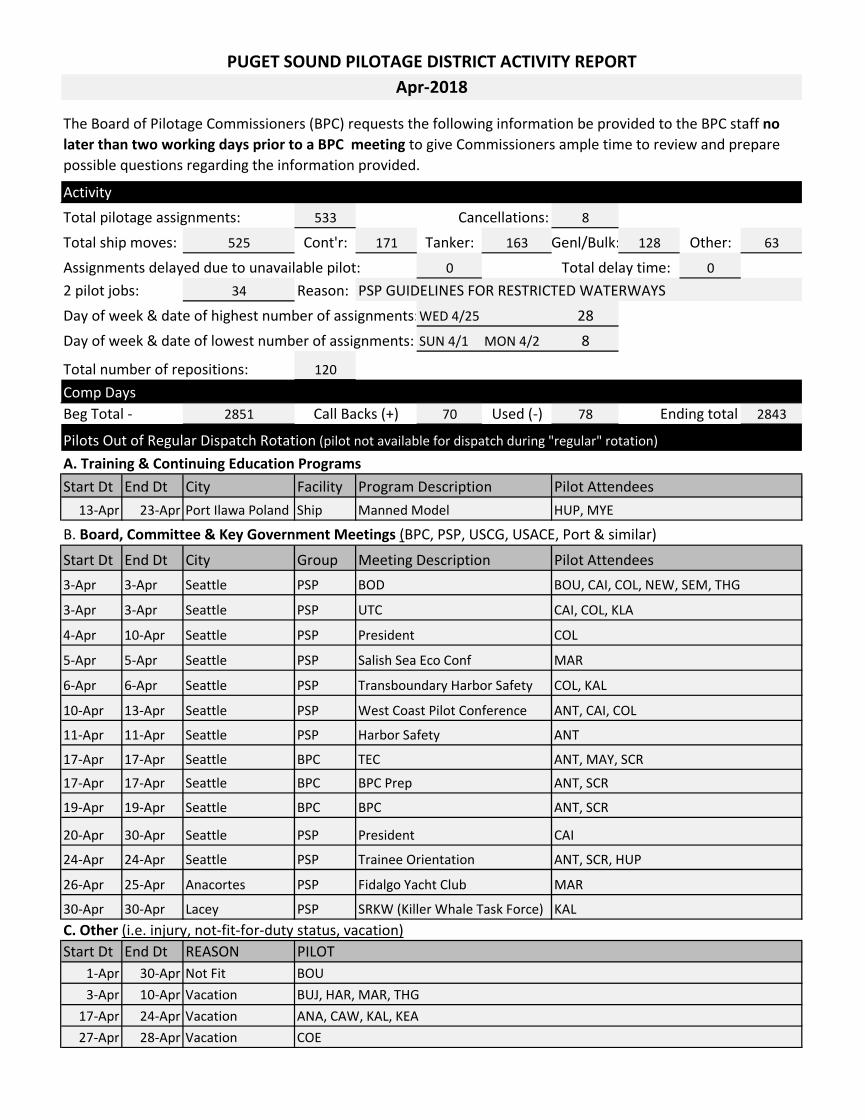
Activity 533 8
525 Cont'r: 171 Tanker: 163 Genl/Bulk: 128 Other: 63
0 02 pilot jobs: 34 Reason:Day of week & date of highest number of assignments:WED 4/25 28Day of week & date of lowest number of assignments: SUN 4/1 MON 4/2 8
120
Comp DaysBeg Total - 2851 70 Used (-) 78 2843
Start Dt End Dt City Facility13-Apr 23-Apr Port Ilawa Poland Ship Manned Model HUP, MYE
B. Board, Committee & Key Government Meetings (BPC, PSP, USCG, USACE, Port & similar)
Start Dt End Dt City Group Meeting Description3-Apr 3-Apr Seattle PSP
3-Apr 3-Apr Seattle PSP
4-Apr 10-Apr Seattle PSP President COL
5-Apr 5-Apr Seattle PSP Salish Sea Eco Conf MAR
6-Apr 6-Apr Seattle PSP Transboundary Harbor Safety COL, KAL
10-Apr 13-Apr Seattle PSP
11-Apr 11-Apr Seattle PSP
17-Apr 17-Apr Seattle BPC TEC ANT, MAY, SCR
17-Apr 17-Apr Seattle BPC BPC Prep ANT, SCR
19-Apr 19-Apr Seattle BPC BPC ANT, SCR
20-Apr 30-Apr Seattle PSP President CAI
24-Apr 24-Apr Seattle PSP Trainee Orientation ANT, SCR, HUP
26-Apr 25-Apr Anacortes PSP Fidalgo Yacht Club MAR
30-Apr 30-Apr Lacey PSP SRKW (Killer Whale Task Force) KAL
Start Dt End Dt REASON1-Apr 30-Apr Not Fit BOU3-Apr 10-Apr Vacation
17-Apr 24-Apr Vacation27-Apr 28-Apr Vacation
UTC CAI, COL, KLA
West Coast Pilot Conference ANT, CAI, COL
Harbor Safety ANT
C. Other (i.e. injury, not-fit-for-duty status, vacation)PILOT
BUJ, HAR, MAR, THGANA, CAW, KAL, KEACOE
BOD BOU, CAI, COL, NEW, SEM, THG
Call Backs (+) Ending total
Pilots Out of Regular Dispatch Rotation (pilot not available for dispatch during "regular" rotation)
A. Training & Continuing Education ProgramsProgram Description Pilot Attendees
Pilot Attendees
Assignments delayed due to unavailable pilot: Total delay time:PSP GUIDELINES FOR RESTRICTED WATERWAYS
Total number of repositions:
Total ship moves:
PUGET SOUND PILOTAGE DISTRICT ACTIVITY REPORTApr-2018
The Board of Pilotage Commissioners (BPC) requests the following information be provided to the BPC staff no later than two working days prior to a BPC meeting to give Commissioners ample time to review and prepare possible questions regarding the information provided.
Total pilotage assignments: Cancellations:

Puget Sound Pilots - Income & Expense Line Item Comparision of Audited Financials
% Δ2017/2016
1/1/2017+0%
1/1/2016+0%
20151/1/15 Rev Neutral
7/1/15 ~+ 2%
1/1/2014+0%
@ 1/1/2013
+3%
1/1/12+0%
no Tariff change(18 mo tariff)
12/31/2017 12/31/2016 12/31/2015 12/31/2014 12/31/2013 12/31/2012 12/31/2011Number of Pilots 1.0% 52.4 51.9 53.2 54.2 53.1 51.9 52.6
Number of assignments -5.4% 7250 7662 7788 7616 7819 7769 7619%Δ -1.6% 2.3% -2.6% 0.6% 2.0% 3.8%
Revenue Per Assignment 1.5% 4,369 4,304 4,068 4,128 4,038 3,941 3,903 %Δ 5.8% -1.5% 2.2% 2.5% 1.0% 2.0%
Puget Sound Tariff Revenue -4.0% 31,675,135$ 32,980,938$ 31,680,997$ 31,439,243$ 31,573,640$ 30,617,682$ 29,738,725$ Grays Harbor pension tariff paid to PSP 30.2% 137,004 105,247 80,600 100,274 87,360 49,020 41,920 Tariff Transportation Revenue -6.2% 1,029,520 1,097,109 1,119,406 1,083,551 1,136,816 991,743 955,188
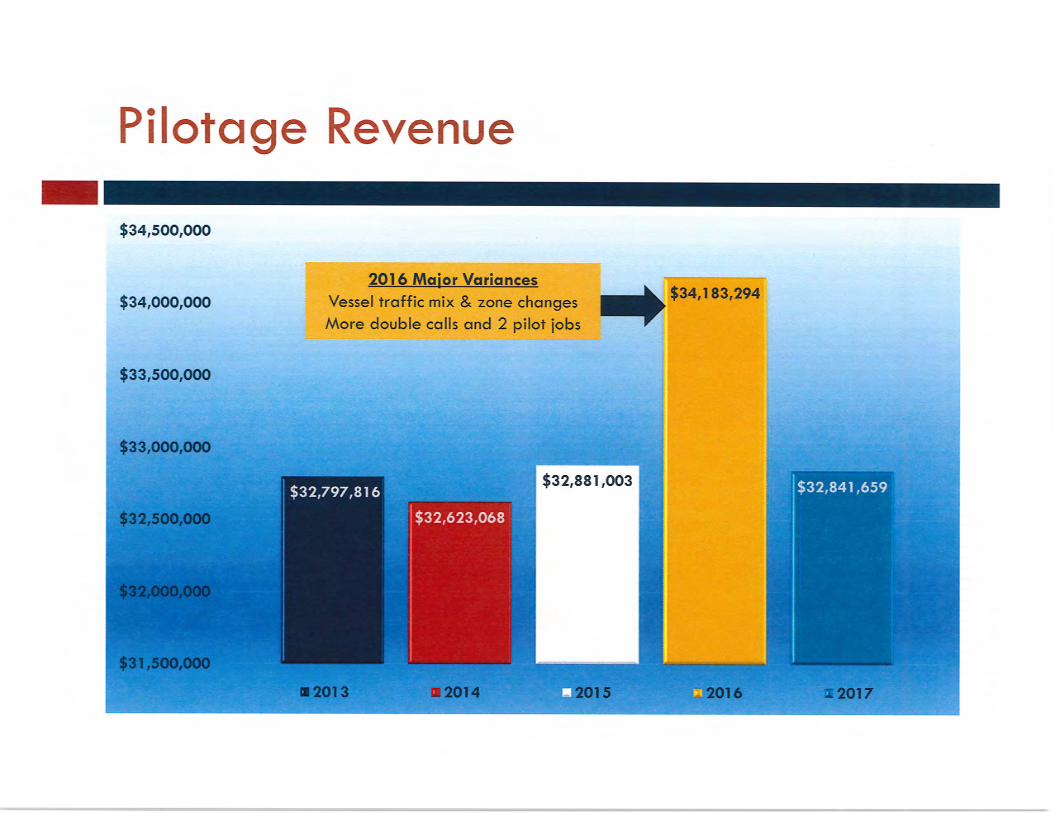
Pilotage Revenue-Total -3.9% 32,841,659$ 34,183,294$ 32,881,003$ 32,623,068$ 32,797,816$ 31,658,445$ 30,735,833$
Per Pilot share of Pilotage Revenue -4.8% 626,291 658,201 #DIV/0! #DIV/0! #DIV/0! #DIV/0! #DIV/0!
Total Charge for Operating Expenses 1.5% 12,292,655$ 12,116,494$ 12,055,872$ 11,799,524$ 11,152,645$ 10,648,130$ 10,799,204$ % change 0.5% 2.2% 5.8% 4.7% -1.4% 23.8%
Per Pilot Share of OperatingExpenses 0.5% 234,421$ 233,324$ 226,614$ 217,570$ 209,898$ #DIV/0! #DIV/0!% change 3.0% 4.2% 3.7% #DIV/0! #DIV/0! 30.4%
Tariff Revenue less Operating Expenses -6.9% 20,549,004$ 22,066,800$ 20,825,131$ 20,823,544$ 21,645,174$ 21,010,315$ 19,936,629$ % change 6.0% 0.0% -3.8% 3.0% 5.4% -1.8%
APPROX per Pilot Share Revenue less Operating Exp -7.8% 391,857$ 424,934$ 391,450$ 384,198$ 407,630$ 404,823$ 379,168$
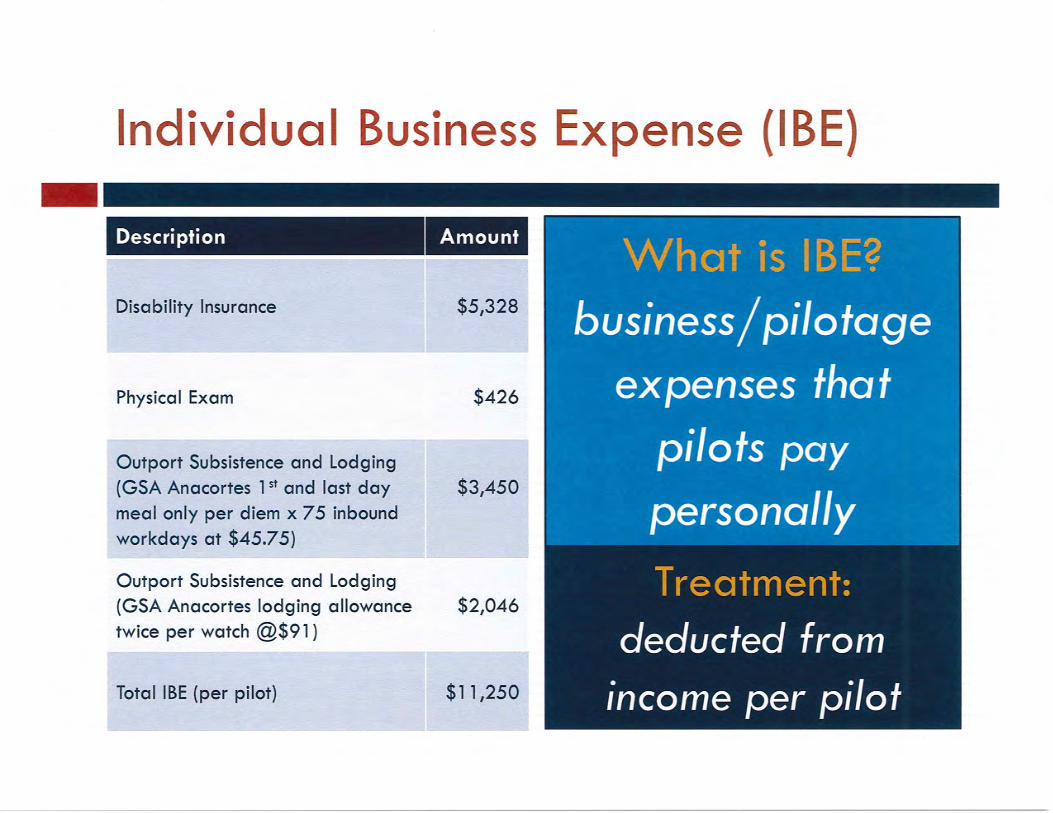
Other deductions from Tariff Revenue Transportation Paid Directly to Pilots -6.2% 1,029,520$ 1,097,109$ 1,119,406$ 1,083,551$ 1,136,816$ 991,743$ 955,188$ Individual Business Expense Allowance paid to Pilots 13.8% 589,932 518,306 530,881 547,415 534,070 646,939 651,548
Total Charge for Other Expenses 0.2% 1,619,452$ 1,615,415$ 1,650,287$ 1,630,966$ 1,670,886$ 1,638,682$ 1,606,736$ % change -2.1% 1.2% -2.4% 2.0% 2.0%
Revenue Less Operating Expenses & Direct Pays to Pilots 18,929,552$ 20,451,385$ 19,174,844$ 19,192,578$ 19,974,288$ 19,371,633$ 18,329,893$
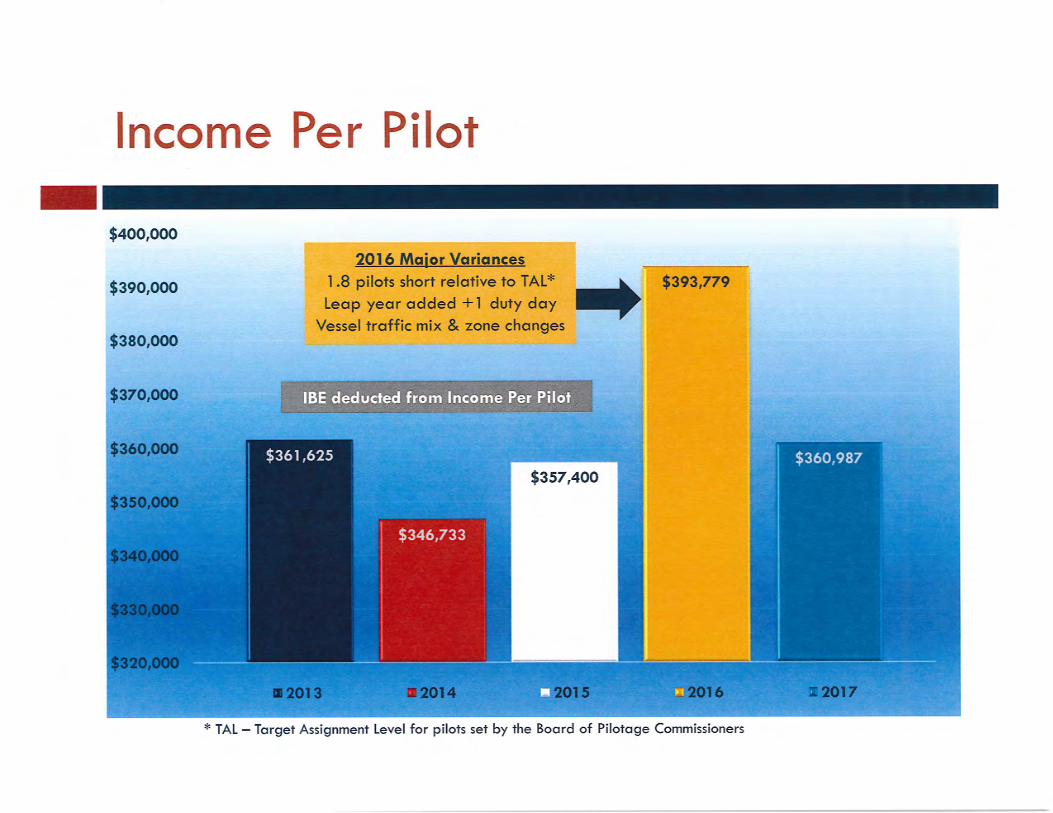
Annual Earnings per Pilot (per audited stmt) -8.3% 360,975$ 393,826$ 360,429$ 354,107$ 376,164$ 373,249$ 348,610$ 9.3% 1.8% -5.9% 0.8% 7.1% 14.2%
3-year Average 371,744$ 369,454$ 363,567$ 367,840$ 366,007$ 342,394$ 322,376$
THE BPC makes no representations regarding the correctness of the data on these pages or the validity and/or relevance of how the data are
presented. The Board staff has attempted to present the data in a format that provides a mechanism for analysis in a manner requested by some
Board members.

Puget Sound Pilots - Income & Expense Line Item Comparision of Audited Financials
% Δ2017/2016
1/1/2017+0%
1/1/2016+0%
20151/1/15 Rev Neutral
7/1/15 ~+ 2%
1/1/2014+0%
@ 1/1/2013
+3%
1/1/12+0%
no Tariff change(18 mo tariff)
12/31/2017 12/31/2016 12/31/2015 12/31/2014 12/31/2013 12/31/2012 12/31/2011Number of Pilots 1.0% 52.4 51.9 53.2 54.2 53.1 51.9 52.6
Number of assignments -5.4% 7250 7662 7788 7616 7819 7769 7619%Δ -1.6% 2.3% -2.6% 0.6% 2.0% 3.8%
Revenue Per Assignment 1.5% 4,369 4,304 4,068 4,128 4,038 3,941 3,903 %Δ 5.8% -1.5% 2.2% 2.5% 1.0% 2.0%
Puget Sound Tariff Revenue -4.0% 31,675,135$ 32,980,938$ 31,680,997$ 31,439,243$ 31,573,640$ 30,617,682$ 29,738,725$ Grays Harbor pension tariff paid to PSP 30.2% 137,004 105,247 80,600 100,274 87,360 49,020 41,920 Tariff Transportation Revenue -6.2% 1,029,520 1,097,109 1,119,406 1,083,551 1,136,816 991,743 955,188
Pilotage Revenue-Total -3.9% 32,841,659$ 34,183,294$ 32,881,003$ 32,623,068$ 32,797,816$ 31,658,445$ 30,735,833$
Per Pilot share of Pilotage Revenue -4.8% 626,291 658,201 618,064 601,902 617,661 609,989 584,554 SEATTLE - expensesAttorney fees 27.5% 95,458$ 74,855$ 51,605$ 96,244$ 11,578$ 28,043$ 8,396$ Commission - SILA 150,000 Comp day expense - see Notes on f/s 163,120 407,238 760,596 603,785 290,385
adjust to match 2016 & 2017 (163,120) (407,238) (760,596) (603,785) (290,385) Computer maintenance or system 12.0% 181,189 161,841 329,568 278,310 203,166 209,101 203,750 Computer programming 242.1% 139,579 40,804 4,862 4,466 3,541 7,041 5,531 Conferences -44.1% 40,284 72,024 34,347 76,749 24,063 3,561 2,946 Consulting services 129.0% 84,790 37,029 284,359 91,942 155,342 96,568 149,231 CPA fees 2.5% 78,028 76,104 56,665 63,512 67,249 72,656 76,440 Depreciation -6.2% 355,567 379,135 320,884 308,493 87,706 151,056 233,620 Drug testing -13.4% 3,398 3,922 6,737 5,381 7,007 6,770 5,434 Dues 1.9% 165,910 162,884 169,583 154,715 150,739 143,150 138,425 Employee benefits 0.2% 191,127 190,681 295,484 341,201 333,115 279,626 243,396 Employee salaries 1.5% 842,741 830,582 851,238 702,636 693,674 746,246 750,043 Equipment leases 22.1% 4,877 3,993 2,915 1,596 1,565 1,077 1,496 Gifts -55.4% 3,228 7,239 13,127 - Grays Harbor retirees, Gross - Note 6 -8.1% 100,861 109,739 109,739 109,739 109,739 109,739 109,739
Memo: Grays Hbr payment to pension: see above 30.2% (137,004) (105,247) (80,600) (100,274) (87,360) (49,020) (41,920)
Memo: Grays Harbor pension expense to PSP, Net -904.6% (36,143) 4,492 29,139 9,465 22,379 60,719 67,819 Insurance -0.8% 182,141 183,676 197,078 223,602 220,120 205,032 194,355 Interest -35.9% 13,763 21,462 17,660 23,266 7,277 8,702 21,381 License fees - see Notes on f/s 1.9% 344,500 338,000 344,500 357,500 357,500 351,000 346,138 Lobbyist 25.4% 67,336 53,717 112,294 106,099 121,007 113,478 109,159 Medical insurance - pilots - see Notes on f/s -4.1% 1,453,478 1,515,117 1,604,390 1,625,825 1,529,975 1,547,037 1,455,769 Office maint/repair 90.0% 10,171 5,353 6,042 7,634 9,700 7,136 8,633 Office supplies -6.8% 30,162 32,379 31,432 43,994 38,459 34,824 41,388 Pilot training -23.1% 233,351 303,640 164,232 370,187 419,487 296,007 220,644 Political contributions 2,200 Printing/pubs -30.0% 19,045 27,217 5,532 24,615 25,108 23,086 33,258 Rent/parking 2.9% 121,206 117,845 113,957 110,502 107,692 104,566 145,097 Retirement -PSD see Notes on f/s -0.8% 4,172,153 4,206,583 3,885,653 3,288,449 3,044,158 2,695,219 2,610,203 Former Director retirement 0.0% 69,502 69,502 5,792 - Taxes on payroll -3.8% 53,757 55,883 61,007 50,737 50,751 51,398 51,968 Taxes, other (Personal Property) -62.2% 2,224 5,889 9,662 1,081 1,169 1,060 1,500 Taxes on revenue -4.7% 536,464 562,762 536,666 536,164 575,613 604,765 586,721 Travel/Entertainment/Promotion 21.6% 121,041 99,532 171,926 144,285 165,956 187,145 146,462 Telephone/communications -9.8% 35,935 39,833 39,956 40,235 44,942 42,314 41,713 Uncollectable AR 53,581 2,296 11,000
Total SEATTLE total expenses 1.7% 9,956,847$ 9,789,222$ 9,838,892$ 9,189,159$ 8,567,398$ 8,127,403$ 7,945,036$ PORT ANGELES STATION - expensesDepreciation -4.1% 46,615$ 48,609$ 52,397$ 55,036$ 54,552$ 54,069$ 86,767$ Education -100.0% 405 Food 23.2% 104,390 84,766 93,855 85,609 92,548 95,184 85,270 Insurance -0.7% 36,583 36,857 38,580 58,450 14,347 20,303 14,664 Lodging - P.A. 219 - 161 12,001 Maint/repair 655.7% 217,227 28,747 34,460 48,760 35,878 41,122 96,027 Rent, tideland lease 7.7% 4,310 4,001 3,679 3,562 3,685 3,893 3,681 Reposition pilots 10.2% 242,870 220,376 229,830 245,478 246,945 244,011 242,870 Supplies -24.2% 19,447 25,657 18,994 25,915 23,682 26,288 27,878 Taxes on property -2.0% 12,241 12,488 13,668 13,527 13,191 12,619 11,581 Telephone/communications 59.2% 21,624 13,581 12,847 12,958 10,945 9,549 8,462 Training 405 Utilities 7.2% 24,807 23,141 22,771 22,672 20,275 20,279 19,113
PA Station total expenses 46.4% 730,114$ 498,628$ 521,300$ 572,372$ 516,048$ 527,680$ 615,787$ PILOT BOATS - expensesDepreciation 0.0% 28 28 28 28 28 28 285,834 Employee benefits -0.9% 233,318 235,524 237,200 233,357 219,482 213,048 203,067 Employee salaries 6.7% 802,534 751,901 750,119 773,729 800,699 802,040 795,317 Fuel-Juan de Fuca 6.0% 136,721 129,025 128,517 166,737 219,873 222,781 209,130 Fuel-Puget Sound 60.6% 164,639 102,487 135,906 250,022 205,993 245,321 222,646 Insurance -2.2% 91,064 93,080 104,574 98,317 115,380 86,232 128,222 Operation-Juan de Fuca -16.4% 49,693 59,447 115,482 374,751 133,265 220,285 69,844 Operation-Puget Sound -84.4% 61,569 394,394 160,031 76,235 306,756 134,084 241,516 Taxes on payroll 6.1% 62,299 58,714 59,512 60,428 62,674 63,179 64,666 Taxes on property - -5.3% 3,829 4,044 4,311 4,389 5,046 5,725 6,162
PILOT BOATS total expenses -12.2% 1,605,694$ 1,828,644$ 1,695,680$ 2,037,993$ 2,069,196$ 1,993,047$ 2,238,381$
Total Charge for Operating Expenses 1.5% 12,292,655$ 12,116,494$ 12,055,872$ 11,799,524$ 11,152,645$ 10,648,130$ 10,799,204$ % change 0.5% 2.2% 5.8% 4.7% -1.4% 23.8%
Per Pilot Share of OperatingExpenses 0.5% 234,421$ 233,324$ 226,614$ 217,570$ 209,898$ 205,166$ 205,386$ % change 3.0% 4.2% 3.7% 2.3% -0.1% 30.4%
Tariff Revenue less Operating Expenses -6.9% 20,549,004$ 22,066,800$ 20,825,131$ 20,823,544$ 21,645,174$ 21,010,315$ 19,936,629$ % change 6.0% 0.0% -3.8% 3.0% 5.4% -1.8%
APPROX per Pilot Share Revenue less Operating Exp -7.8% 391,857$ 424,934$ 391,450$ 384,198$ 407,630$ 404,823$ 379,168$
Other deductions from Tariff Revenue Transportation Paid Directly to Pilots -6.2% 1,029,520$ 1,097,109$ 1,119,406$ 1,083,551$ 1,136,816$ 991,743$ 955,188$ Individual Business Expense Allowance paid to Pilots 13.8% 589,932 518,306 530,881 547,415 534,070 646,939 651,548
Total Charge for Other Expenses 0.2% 1,619,452$ 1,615,415$ 1,650,287$ 1,630,966$ 1,670,886$ 1,638,682$ 1,606,736$ % change -2.1% 1.2% -2.4% 2.0% 2.0%
Revenue Less Operating Expenses & Direct Pays to Pilots 18,929,552$ 20,451,385$ 19,174,844$ 19,192,578$ 19,974,288$ 19,371,633$ 18,329,893$
Annual Earnings per Pilot (per audited stmt) -8.3% 360,975$ 393,826$ 360,429$ 354,107$ 376,164$ 373,249$ 348,610$ 9.3% 1.8% -5.9% 0.8% 7.1% 14.2%
3-year Average 371,744$ 369,454$ 363,567$ 367,840$ 366,007$ 342,394$ 322,376$
THE BPC makes no representations regarding the correctness of the data on these pages or the validity and/or relevance of how the data are
presented. The Board staff has attempted to present the data in a format that provides a mechanism for analysis in a manner requested by some
Board members.

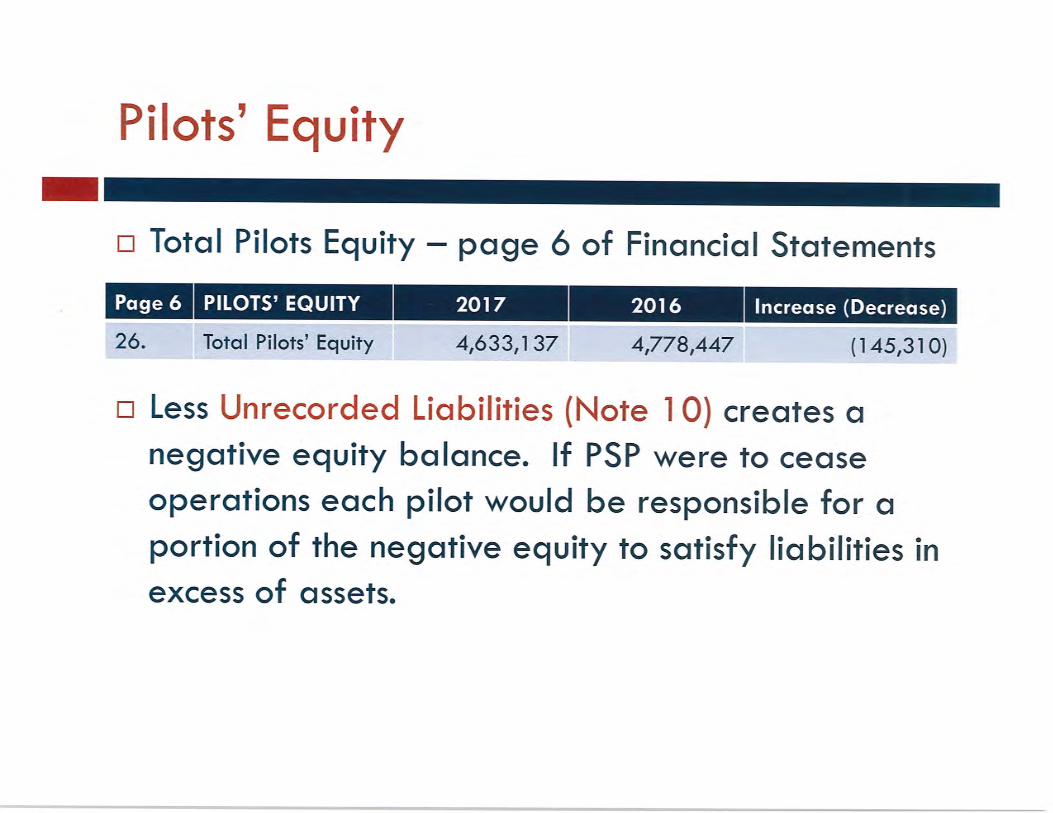
PUGET SOUND PILOTS 2017 2016 2015 2014 2013 2012 2011 2010 2009
Unrecorded Liabilities -info from Audited Financial Statement NotesComp day value --- approx 5,583,894$ 6,206,368$ 4,985,068$ 4,850,700$ 5,406,896$ 5,845,008$ 5,889,408$ 5,425,434$ 5,875,584$ Pilot vacation --- approx 935,990$ 1,018,326$ 926,526$ 950,950$ 973,955$ 951,096$ 898,923$ 843,930$ 868,227$ Buy-out 3,083,739$ 3,340,809$ 3,785,415$ 2,755,276$ 2,877,162$ 2,397,602$ 2,287,956$ 3,037,845$ 1,638,999$ PSP Retirement 4.2M x ?yrs 4.2M x ?yrs 3.9M x ?yrs 3.3M x ?yrs 3.0M x ?yrs 2.7M x ?yrs 2.6M x ?yrs 2.3M x ?yrs 2.0M x ?yrsFormer Ex Director Retirement 69,500 x ?yrs 69,500 x ?yrs 69,500 x ?yrs NR NR NR NR NR NR
NR = not reported


Selected Comparatives Summary
January February March April
Apr to prev Apr 4 mo to date
compared to previous
year
$2,371,509 $2,279,245 $2,357,526 $2,197,452 -5.1% $9,205,732 -0.6%
$3,939 $4,099 $4,044 $4,123 0.6% $4,049 -0.7%# of licensed pilots w/o Pres 50 50 50 50 50
Average Assgn/pilot on rotation 12.30 11.35 11.90 10.88 11.613 + 1 2 + 1 5 + 1 8 + 1602 556 583 533 -5.7% 2274 0.2%-4 27 13 -32 68.4% 4
Moves 579 542 563 525 -4.5% 2209 -0.1%-15 22 15 -25 8.7% -323 14 20 8 -46.7% 65 12.1%
$1,364,136 $1,306,390 $1,350,510 $1,278,904 -2.0% $5,299,940 0.4%$2,356 $2,410 $2,399 $2,436 2.7% $2,399
Gross Tonnage Moved 27,962,363 26,106,585 27,303,886 25,704,844 -7.6% $107,077,678 -5.9%
January February March April
Apr to prev Apr 4 mo to date
compared to previous
year
$2,488,326 $2,183,031 $2,273,861 $2,315,825 -1.5% $9,261,043 -2.3%
$4,106 $4,127 $3,989 $4,099 1.9% $4,080 0.7%
# of licensed pilots w/o Pres 51 51 51 51
Average Assgn/pilot on rotation 11.88 10.37 11.18 11.08 11.13
2 + 1 5 + 1 3 + 1 5 + 1
606 529 570 565 -3.3% 2270 -3.1%
1 -18 -37 -19 -73
Moves 594 520 548 550 -4.0% 2212 -3.4%5 -18 -43 -23 -79
12 9 22 15 36.4% 58 11.5%
$1,456,699 $1,256,480 $1,261,965 $1,305,187 -1.3% $5,280,331 -0.2%$2,452 $2,416 $2,303 $2,373 2.8% $9,545 3.2%
Gross Tonnage Moved 31,303,842 27,225,601 27,446,553 27,831,924 -2.9% $113,807,920 -1.7%
January February March AprilApr to
prev Apr 4 mo to dateto previous
year
$2,443,846 $2,269,624 $2,419,887 $2,350,195 9.2% $9,483,552 8.4%
$4,039 $4,149 $3,987 $4,024 15.9% $4,050.00 8.7%
# of licensed pilots w/o Pres 51 51 50 51
Average Assgn/pilot 12.26 10.73 12.14 11.45 11.64
6 + 1 8 + 1 3 + 1 7 + 1
605 547 607 584 -5.8% 2343 -0.4%
28 30 -32 -36 -10
Moves 589 538 591 573 -4.2% 2291 0.1%Moves change 23 37 -32 -25 -0.5% 3 6.4%
Cancellations 16 9 16 11 52
$1,329,440 $1,296,111 $1,345,308 $1,322,435 23.1% $5,293,294 12.9%$2,257 $2,409 $2,276 $2,308 28.4% $9,250 12.3%
Gross Tonnage Moved 29,609,106 27,830,304 29,667,076 28,676,198 9.9% 115,782,684 7.8%
PSP 2015 January February March April 4 mo to date
$2,202,588 $2,024,841 $2,365,096 $2,153,086 -12.6% $8,745,611 -9.7%$3,817 $3,917 $3,701 $3,473 -11.2% $3,727 -4.7%
# of licensed pilots w/o Pres 53 53 52 52Average Assgn/pilot 10.89 9.75 12.29 11.92 11.21
7 9 4 2 22577 517 639 620 -1.6% 2353 -4.9%-62 -66 16 -10 -122
Moves 566 501 623 598 -3.7% 2288 -6.3%Moves change -65 -71 6 -23 -153
Cancellations 11 16 16 22 650
$1,216,397 $1,132,850 $1,263,220 $1,074,585 -25.6% $4,687,052 -16.7%$2,149 $2,261 $2,028 $1,797 -22.7% $8,235 -10.6%
Gross Tonnage Moved 27,588,264 24,671,828 29,034,609 26,097,422 -14.9% 107,392,123 -12.0%
Assignment change
Moves changeCancellations
Tonnage RevenueTonnage Revenue per Move
PSP 2018Tariff Revenue-Trans
RPA-Revenue per Assign
# pilots with < 6 jobs (+1=Pres)Assignments
Assignment change
PSP 2017Tariff Revenue-Trans
RPA-Revenue per Assign
# pilots with < 6 jobs (+1=Pres)Assignments
Tonnage Revenue per Move
Moves changeCancellations
Tonnage RevenueTonnage Revenue per Move
PSP 2016Tariff Revenue-Trans
RPA-Revenue per Assign
# pilots with < 6 jobs(+1=Pres)Assignments
Assignment change
Tonnage Revenue
Tariff Revenue-TransRPA-Revenue per Assign
# pilots with < 6 jobs(+1=Pres)Assignments
Assignment change
Tonnage RevenueTonnage Revenue per Move


Strait of Juan de Fuca andPuget Sound Area
Vessel Traffic Safety Report
Sara Thompson

Marine & Rail Oil Transportation Study (2014)
Puget Sound Vessel Traffic Study Update
(2015)Salish Sea Workshop
(2016)Vessel
Traffic Safety Report
-Transboundary Forum-Tug Escorts (manning)-ERTV
E2SSB 6269

Report Goal
Provide legislators and other decision makers the information needed to make informed, sound decisions on specific vessel safety measures:
1. Tug Escorts (tankers, ATB, towed vessels)2. Emergency Response System for
Haro/Boundary/Rosario3. Etc.
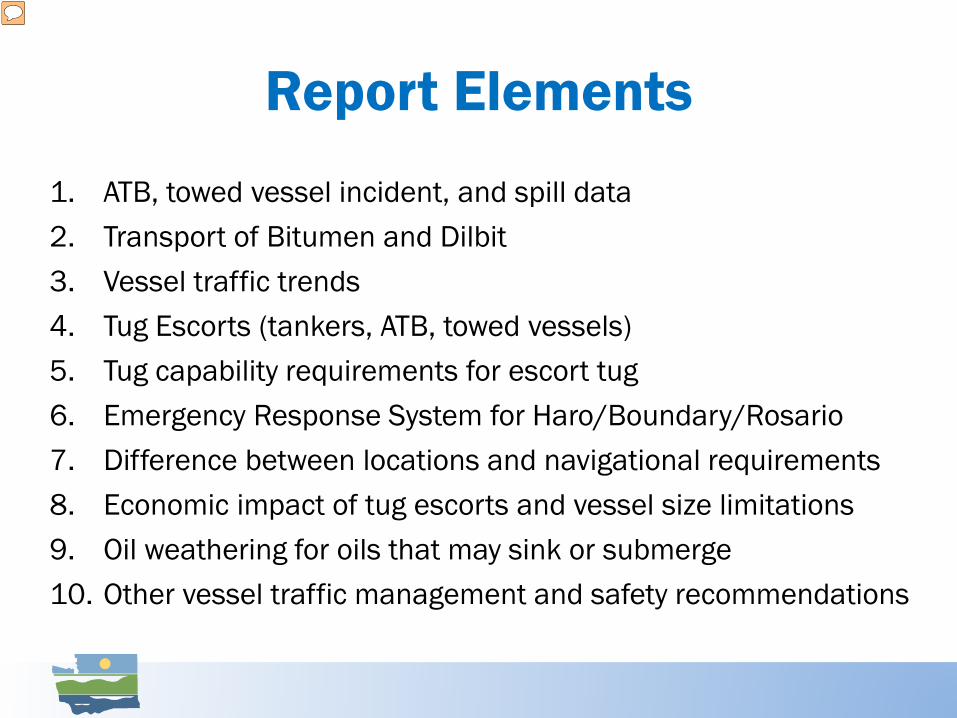
Report Elements1. ATB, towed vessel incident, and spill data 2. Transport of Bitumen and Dilbit3. Vessel traffic trends4. Tug Escorts (tankers, ATB, towed vessels)5. Tug capability requirements for escort tug6. Emergency Response System for Haro/Boundary/Rosario7. Difference between locations and navigational requirements8. Economic impact of tug escorts and vessel size limitations9. Oil weathering for oils that may sink or submerge 10. Other vessel traffic management and safety recommendations
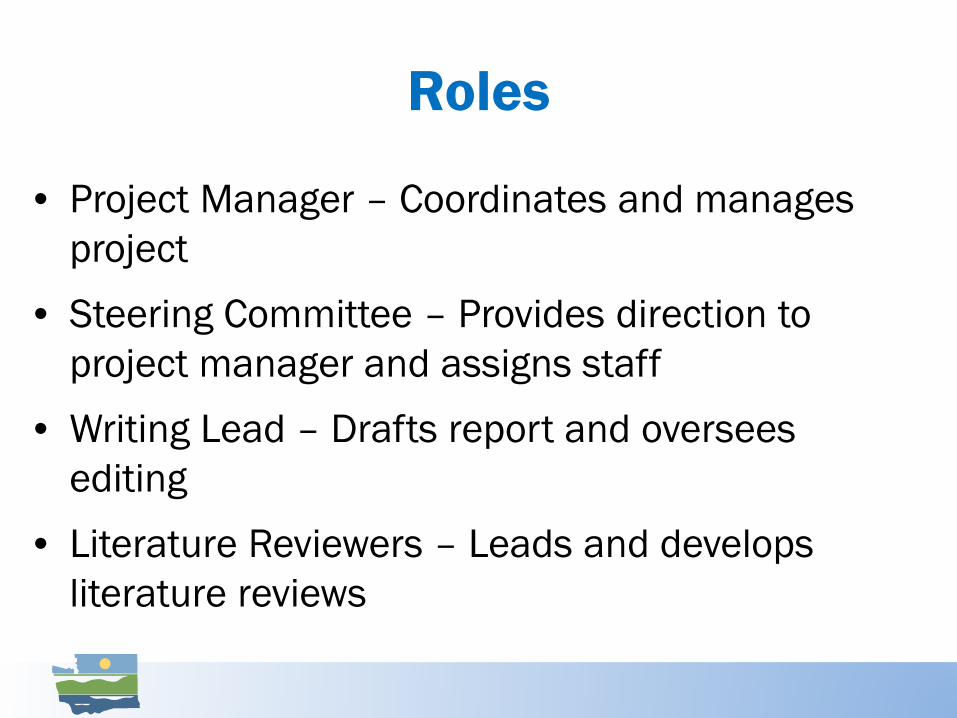
Roles
• Project Manager – Coordinates and manages project
• Steering Committee – Provides direction to project manager and assigns staff
• Writing Lead – Drafts report and oversees editing
• Literature Reviewers – Leads and develops literature reviews

Draft Report
Lit Review: Incident & Spill Data
Lit Review: Dilbit Transport
Lit Review: Vessel Traffic Trends
Stakeholder input on
information
Stakeholder input on draft
Input from Puget Sound Partnership & Pilotage Commission
Source: Suncor
Source: Jane Cogan

Current and Existing Information
Work developed preferably no earlier than 2005, from sources that are relevant and widely acknowledged as credible and reliable in their respective field. Examples of such information, includes but is not limited to:
• Peer reviewed studies• Published government studies• Laws and regulations• Reports that are commonly cited or used by
academia and high level decision makers

Tribal and Stakeholder Involvement
• Webinar presentation (May 16th)• Provide studies and reports (May 25th)• Provide comments on draft report (August)• Invite Ecology to present at meetings

Tribal and Stakeholder Groups• United States Coast Guard• Maritime experts (including covered vessels)• Onshore and offshore facilities• Environmental organizations• Tribes• Commercial and noncommercial fishers• Recreational resource users• Provincial experts• Representatives of the Salish Sea Shared Waters Forum
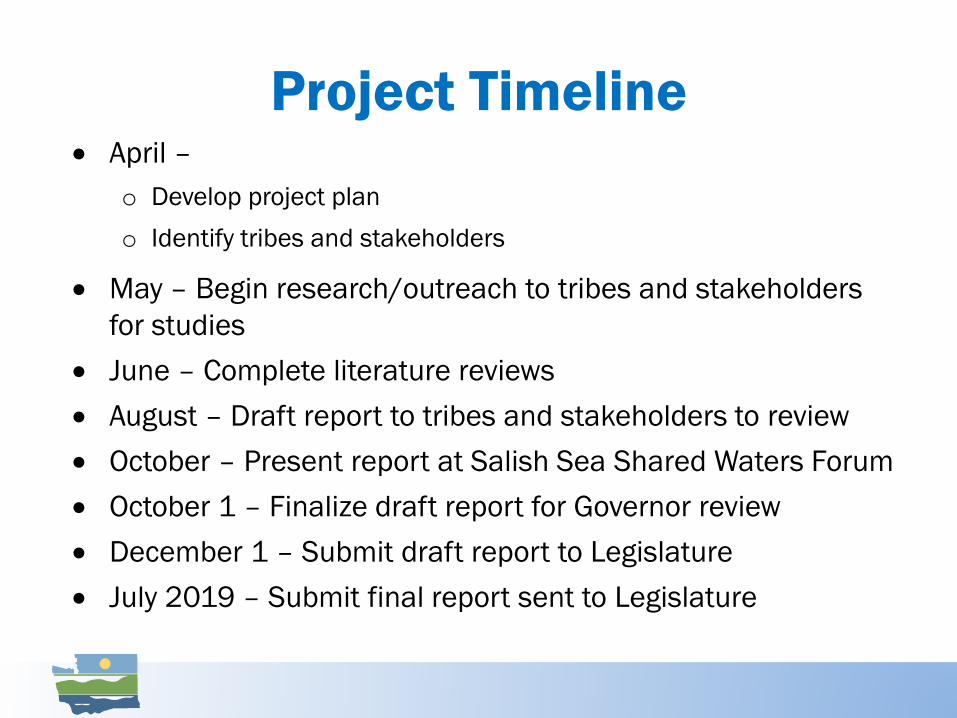
Project Timeline• April –
o Develop project plano Identify tribes and stakeholders
• May – Begin research/outreach to tribes and stakeholders for studies
• June – Complete literature reviews• August – Draft report to tribes and stakeholders to review• October – Present report at Salish Sea Shared Waters Forum• October 1 – Finalize draft report for Governor review • December 1 – Submit draft report to Legislature• July 2019 – Submit final report sent to Legislature

Questions and Discussion