west virginia statewide forest resource assessment · 2019-07-19 · west virginia statewide forest...
TRANSCRIPT

West Virginia Statewide Forest Resource Assessment 2010
182 Issues, Sub-Issues, and Priority Area Identification – Issue 3: Sustainability of Forest Resources
Plevich, Mike. 2010. West Virginia Army National Guard. Personal communications regarding the management practices and acreages of forested areas within Camp Dawson provided to Barb Breshock, January 2010. Rauch, Steve. 2009. West Virginia Division of Natural Resources (WVDNR), Wildlife Section. Personal communications regarding Wildlife Management Area acreage breakdowns to Barb Breshock, winter 2009. Sandeno, Cindy. 2009. Ecologist, Monongahela National Forest, Potomac Highlands Cooperative Weed and Pest Management Area map, fall 2009 Sheliah, Harlin. 2009. US Army Corps of Engineers (USACE), Real Estate Division, Pittsburgh, PA section. Personal communications regarding information on the breakdown of land use categories by acreage for US Army Corps of Engineers projects in WV. Fall 2009 Smith, W. Brad, P.D. Miles, C.H. Perry, S.A and Pugh, Scott A., 2009. Forest Resources of the United States, 2007. Gen. Tech. Rep. WO-78. Washington, DC: USDA Forest Service, Washington Office. 336 p. Sturm, Ken. 2009. US Fish & Wildlife Service (USFWS). Canaan Valley NWR. Personal communications regarding information on NWR management practices, acreage breakdowns, provided December, 2009. Talo-West, Helena. 2009. US Army Corps of Engineers (USACE), Real Estate Division. Pittsburgh, PA section. Phone and emails regarding information on the breakdown of land use categories by acreage for US Army Corps of Engineers projects in WV University of Wisconson. n.d. SILVIS lab: wildland urban interface maps, statistics and data. University of Wisconsin, Madison, WI. http://silvis.forest.wisc.edu/Library/WUILibrary.asp. Accessed cc July 2009. USDA NRCS. n.d. Natural resources geospatial data gateway. US Department of Agriculture, Natural Resource Conservation Service. Washington, DC: http://datagateway.nrcs.usda.gov/GatewayHome.html.
Accessed cc July 2009.
USDA Forest Service. n.d. Forest Inventory and Analysis (FIA) data online. USDA Forest Service, Forest Inventory and Analysis Program, Washington, DC:. http://fiatools.fs.fed.us
. Accessed cc July 2009.
USDA Forest Service. 2008. Forest Resources of the United States,2007. WO-GTR-78. Washington, DC. Available at http://fia.fs.fed.us/program-features/rpa/default.asp USDA FS – FIA. n.d. USDA Forest Service. Forest Inventory and Analysis (FIA), National Woodland Owner Survey. Washington, DC. Available at http://fiatools.fs.fed.us/NWOS/tablemaker.jsp USDA FS – FIA. n.d. FIA data online. U.S. Department of Agriculture, Forest Service, Forest Inventory and Analysis Program. Washington, DC: http://fiatools.fs.fed.us
. Accessed July 2009.
Wheatley, Beth. 2009. The Nature Conservancy’s Ecoregional Portfolio Spatial Dataset. The Nature Conservancy. Widmann, Richard H., C.R. Dye, and G.W. Cook. 2007. Forests of the Mountain State. Resource. Bull. NRS-17. USDA Forest Service, Northern Research Station, Newtown Square, PA. 28 p

West Virginia Statewide Forest Resource Assessment 2010
Issues, Sub-Issues, and Priority Area Identification – Issue 3: Sustainability of Forest Resources 183
Widmann, Richard H. and G.W. Cook. 2008. West Virginia’s Forest Resources, 2006. Res. Note. NRS-23. USDA Forest Service, Northern Research Station, Newtown Square, PA. 4 p.
Widmann, Richard H. 2004. The Mountain State's Forests--trends in the resource. NE-INF-152-04. USDA Forest Service, Northeastern Research Station. 4 p. Widmann, Richard H. 2009. West Virginia Society of American Foresters Summer Meeting, Powerpoint presentation, August 27th-28th, 2009 Blackwater Falls State Park, Davis, WV WVDEP. 2009. Mining Permit Boundaries “perbd.shp” (updated daily). Technical Applications and Geographic Information Systems (TAGIS), WV Dept. of Environmental Protection. Accessed September 2009 and available at http://gis.wvdep.org/data/omr.html. WVDNR. 2007. Wildlife Management Areas – A Guide to their facilities, fish and wildlife. WV Dept. of Natural Resources, Wildlife Resources Section. WVDOF GIS, 2009 a. Tree Farm Acres by County. WVDOF GIS, 2009 b. Managed Timber Account Acres Burned by County 1987-2009. WVDOF GIS, 2009 c. Forest Stewardship Plan acreages 1999-2009. WVDOF GIS, 2009 d. Forest Stewardship Plan acreages 1991-2009. WVDOF GIS, 2009 e. Public lands shapefile “WV_Public_Lands_Steward.shp”. WVDOF GIS, 2009 f. Non-Industrial Private Forest land. WVDOF GIS, 2009 g. Current Tax Parcel Data. WVDOF GIS, 2009 h. Harvest Acres by County 2006-2009. WVDOF GIS, 2009 i. Harvest Jobs by County 2006-2009. WVDOF GIS, 2009 j. Public lands shapefile “WV_Public_Lands_Steward.shp”. Created Dec. 2009. WVDOF GIS, 2009 k. Wildfire Acres Burned by County 1987-2009. WVDOF GIS, 2009 l. Number of Fires by County 1987-2009. WVDOF GIS, 2009 m. State Forest Boundaries. WVDOF, 2009. Timber licenses 1994-2009. WV GIS Technical Center, 2009 a. “minesMountaintopRemoval_WVGES_199810_utm83.shp”, downloaded September, 2009 available at http://wvgis.wvu.edu//data/data.php. WV GIS Technical Center, 2009 b. “mining_fills-southern_wv.shp”, downloaded September, 2009 available at http://wvgis.wvu.edu//data/data.php WV GIS Technical Center, 2009 c. “minesAbandonedLandsPolygon_WVDEP_1996_utm27.shp”, downloaded September, 2009 available at http://wvgis.wvu.edu//data/data.php

West Virginia Statewide Forest Resource Assessment 2010
184 Issues, Sub-Issues, and Priority Area Identification – Issue 4: Water Quality
Photos courtesy of Steve Shaluta, WV Department of Commerce, and Jeremy McGill, WVDOF.
West Virginia Statewide Forest Resource Assessment 2010
Issues, Sub-Issues, and Priority Area Identification – Issue 4: Water Quality 185
Issue 4:
West Virginia is a headwater state for both the Chesapeake Bay and the Ohio River drainage systems, with several rivers having their sources within the mountains. The combination of rugged topography, fragile soils, and high annual rainfall poses a very real threat to water quality far outside West Virginia’s borders. Fortunately, the state has an abundance of forests that filter and clean water. The people of West Virginia and surrounding states rely on this clean water for recreation, drinking water, transportation, and irrigation. Fish and wildlife can be negatively impacted by land use practices that impair water quality. It is important that proper forest management practices are used, especially in critical forest riparian areas, to minimize effects on water quality and sedimentation that could occur from utilization of forest resources. In a recent study by the USFS (Barnes, et al “Forests, Water and People” (FWAP) 2009), it was indicated that West Virginia has remarkable potential to produce clean water when considering such factors as land use, soil erodibility, road density, and population density.
Water Quality
The authors of the FWAP study provided GIS data summarized by 8 and 12 digit hydrologic unit codes (HUC) known as HUC-8, fourth-level (cataloging unit) and HUC-12, sixth level (sub-watershed) classifications respectively. A HUC is a U.S. Geological Survey hierarchical system based on surface hydrologic features classified into hydrologic unit codes. Summarized data from the FWAP study included a composite score for the ability for each HUC to produce clean water known as the “ability to produce clean water” (APCW). The APCW score is based on a sub-watershed’s potential for producing clean water, with higher composite scores indicating an increased ability for producing clean water. Much of the state scores high, using this system, which translates into a high ability to produce clean water (Map 4.1). This is due to the high percentage of forested acreage within the state and the forest’s ability to produce clean, fresh water. Because this composite score represents a large amount of data, it plays an important part in the prioritization methodology.
Sub-Issue 1: Sedimentation of Streams West Virginia’s waterways are threatened by sediment, which is the leading pollutant within the state’s waterways. Unlike many chemical pollutants, it is widespread across the state. With any cut bank hydrological system (Figure 4.1), some sedimentation is natural and unavoidable, but it is important that activities near waterways be planned properly to minimize additional sediment movement into stream waters.
The primary cause of human-associated sedimentation to streams is development. Poor construction and maintenance of roads and the clearing of land for development are major contributors. This seems to be more of a problem in certain areas of the state, as development trends tend to be higher in specific regions. Housing and urban development, for instance, tend to be more of a factor along the Ohio and Kanawha River corridors, the I-79 Corridor from Morgantown to Clarksburg, the northern panhandle, and in the eastern panhandle region of the state. Map 4.2 illustrates areas with high numbers of structures per acre. Dark blue areas indicate structures densities exceeding 0.25 structures per acre.

West Virginia Statewide Forest Resource Assessment 2010
186 Issues, Sub-Issues, and Priority Area Identification – Issue 4: Water Quality
Map 4.1: Ratings of West Virginia’s ability to produce clean water based on the APCW score and the reclassification values assigned by WVDOF (Barnes et.al, 2009). Figure 4.1: Image of typical cut bank stream hydrology (unknown source).

West Virginia Statewide Forest Resource Assessment 2010
Issues, Sub-Issues, and Priority Area Identification – Issue 4: Water Quality 187
Map 4.2: Density of man-made structures by HUC-12 sub-watershed in West Virginia. (WVDOF GIS, 2009 with data provided by WV GIS Technical Center 2009 b).
Areas where structures exceed 1 per every 4 acres (blue areas in Map 4.2) have been removed as important areas in developing priorities for this section, as they cannot be addressed by traditional forestry methods. See Issue 6: Sustainability of Urban Forests for information about urban water quality priority areas.

West Virginia Statewide Forest Resource Assessment 2010
188 Issues, Sub-Issues, and Priority Area Identification – Issue 4: Water Quality
Oil and gas well exploration and construction, and the associated roads and land clearing, also take a huge toll, especially with new drilling technologies that require as many as 5 acres of forested land to be cleared for each well location (Figure 4.2). A recent boom in energy prices has led to a spike in exploration and drilling across the state over the last 5 years. When utilizing horizontal drilling technology, these wells can use upwards of 3 to 4 million gallons of water for the hydro-fracturing process. This poses not only a resource quantity problem, during the dry times of the year, but also a water disposal problem. Around 50-80 percent of the water is recovered after the fracturing procedure and it is laced with chlorides and other chemicals used in the procedure. As a result, it is unsafe for reintroduction into streams. It can be treated, re-injected, or applied on land in limited amounts to avoid contamination of waterways (Soeder, 2009).
Figure 4.2: Well site in West Virginia used to extract natural gas from the Marcellus Shale formation (Photo courtesy of www.wvsoro.org).

West Virginia Statewide Forest Resource Assessment 2010
Issues, Sub-Issues, and Priority Area Identification – Issue 4: Water Quality 189
Figure 4.3: Extent of the Marcellus shale region (Soeder, 2009).
West Virginia Statewide Forest Resource Assessment 2010
190 Issues, Sub-Issues, and Priority Area Identification – Issue 4: Water Quality
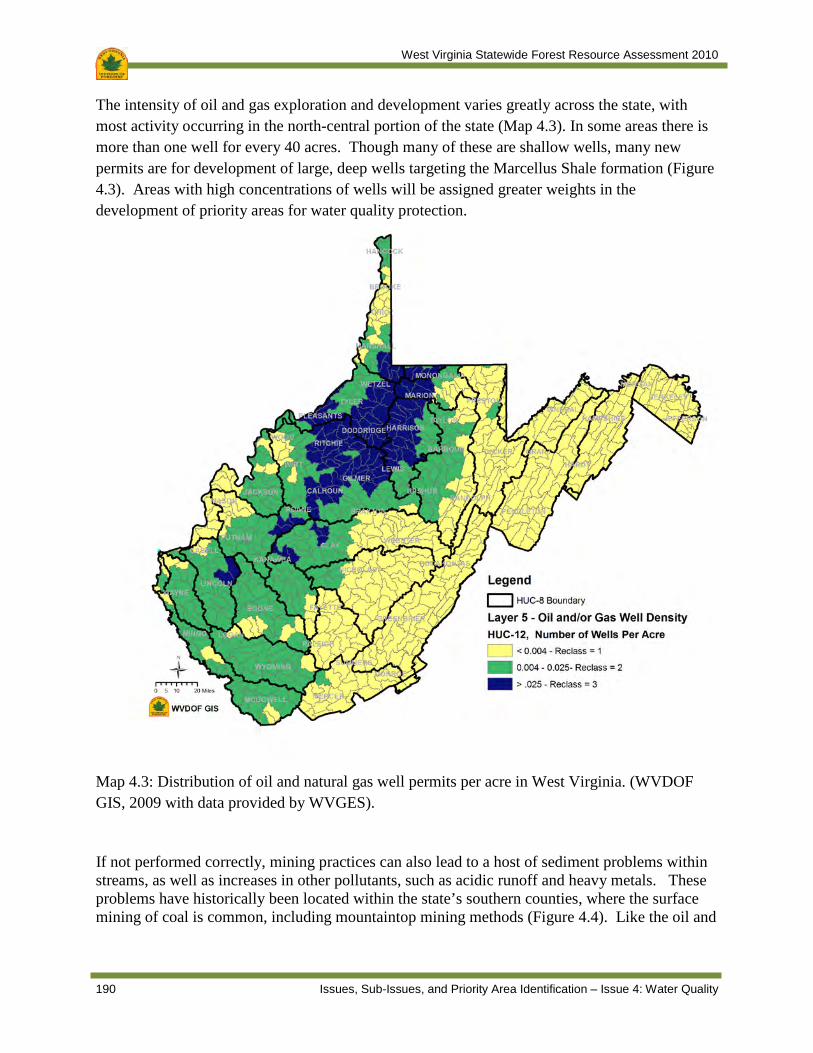
The intensity of oil and gas exploration and development varies greatly across the state, with most activity occurring in the north-central portion of the state (Map 4.3). In some areas there is more than one well for every 40 acres. Though many of these are shallow wells, many new permits are for development of large, deep wells targeting the Marcellus Shale formation (Figure 4.3). Areas with high concentrations of wells will be assigned greater weights in the development of priority areas for water quality protection.
Map 4.3: Distribution of oil and natural gas well permits per acre in West Virginia. (WVDOF GIS, 2009 with data provided by WVGES).
If not performed correctly, mining practices can also lead to a host of sediment problems within streams, as well as increases in other pollutants, such as acidic runoff and heavy metals. These problems have historically been located within the state’s southern counties, where the surface mining of coal is common, including mountaintop mining methods (Figure 4.4). Like the oil and

West Virginia Statewide Forest Resource Assessment 2010
Issues, Sub-Issues, and Priority Area Identification – Issue 4: Water Quality 191
gas industry, the coal industry has recently gone through a period of expansion as a result of increased energy costs. The loss of forest land through expanded surface mining is a concern.
Figure 4.4: Mountaintop coal surface mining site (Photo courtesy JW Randolph).
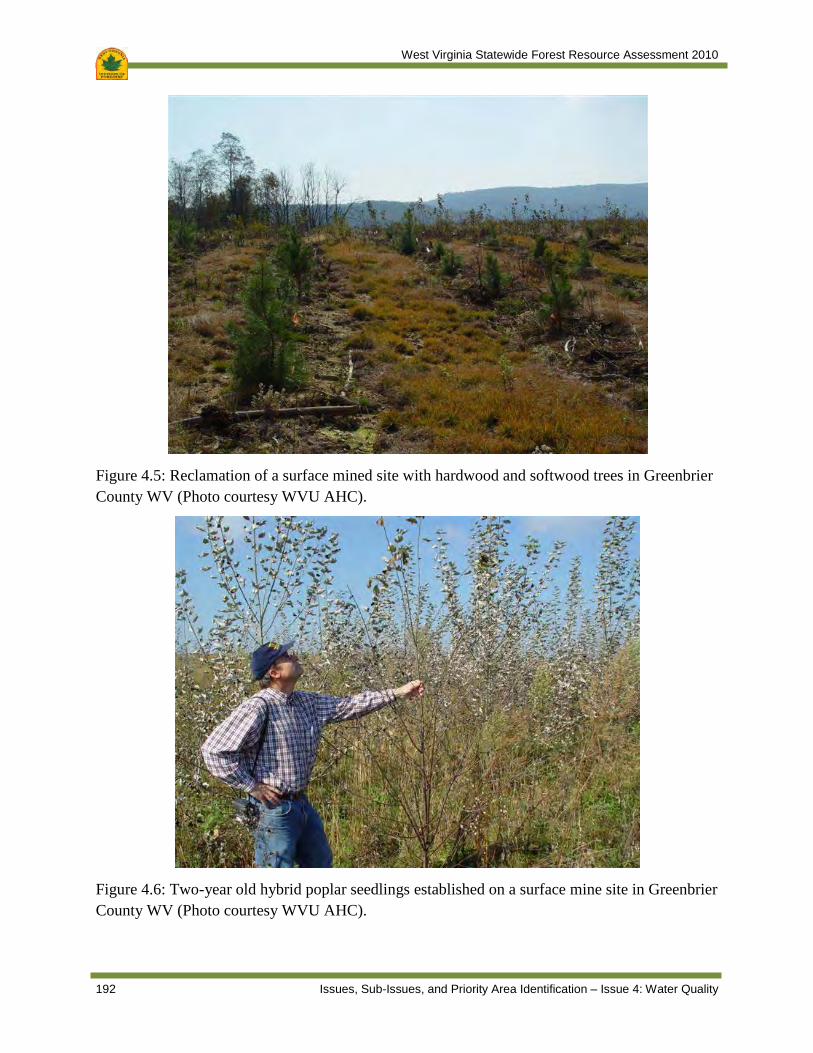
In some areas of the state, mining permits and valley fill permits associated with large-scale mining cover more than 20 percent of the total acreage of a sub-watershed. This is a controversial issue garnering national attention at the moment and the future of this type of mining is uncertain. Regardless, there are still many acres that have already been altered through surface mining. Due to reclamation requirements of state law, which allow many areas to be reseeded to grass, replanting trees on post mining sites has not always been the preferred option. Also, in the past the topsoil from many mining sites was either removed or severely compacted. However, ripping of the soil and other recently developed planting techniques have increased tree seedling survival rates (Burger et al 2005). Therefore, there has been a recent trend toward reforestation of these sites (Figures 4.5 and 4.6).
West Virginia Statewide Forest Resource Assessment 2010
192 Issues, Sub-Issues, and Priority Area Identification – Issue 4: Water Quality
Figure 4.5: Reclamation of a surface mined site with hardwood and softwood trees in Greenbrier County WV (Photo courtesy WVU AHC).
Figure 4.6: Two-year old hybrid poplar seedlings established on a surface mine site in Greenbrier County WV (Photo courtesy WVU AHC).

West Virginia Statewide Forest Resource Assessment 2010
Issues, Sub-Issues, and Priority Area Identification – Issue 4: Water Quality 193
Sub-watersheds with more than 20 percent of the total surface area under mining and or valley fill permits were not counted in the priority area analysis for protection. This is because of the existing and potential high percentage loss of forested land in these areas (Map 4.4).
Map 4.4: Areas of West Virginia impacted by surface mining and mine fill activities. (WVDOF GIS, 2009 with data provided by the WVDEP and WV GIS Technical Center 2009 c).

West Virginia Statewide Forest Resource Assessment 2010
194 Issues, Sub-Issues, and Priority Area Identification – Issue 4: Water Quality
Figure 4.7: Mechanical harvesting operation in a hardwood forest in Preston County, West Virginia. (Shawn Grushecky, WVU, AHC).
Silvicultural operations on forest land, particularly road construction during timber harvesting, can also contribute to sediment loading within the state’s waterways (Figure 4.7). Though West Virginia has state regulations that exceed the demands of the federal Clean Water Act, it is still important to remain vigilant. Unlike many of the other issues contributing to sedimentation, forestry operations are statewide, occurring in every county.
West Virginia Statewide Forest Resource Assessment 2010
Issues, Sub-Issues, and Priority Area Identification – Issue 4: Water Quality 195
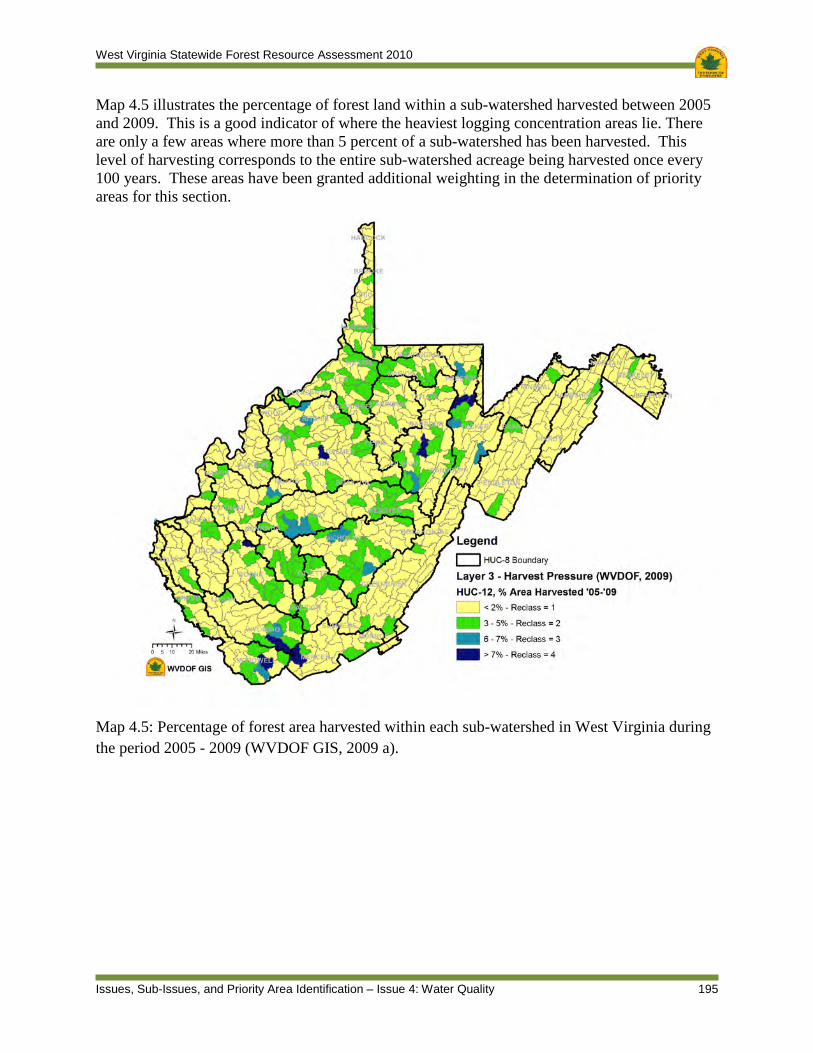
Map 4.5 illustrates the percentage of forest land within a sub-watershed harvested between 2005 and 2009. This is a good indicator of where the heaviest logging concentration areas lie. There are only a few areas where more than 5 percent of a sub-watershed has been harvested. This level of harvesting corresponds to the entire sub-watershed acreage being harvested once every 100 years. These areas have been granted additional weighting in the determination of priority areas for this section.
Map 4.5: Percentage of forest area harvested within each sub-watershed in West Virginia during the period 2005 - 2009 (WVDOF GIS, 2009 a).

West Virginia Statewide Forest Resource Assessment 2010
196 Issues, Sub-Issues, and Priority Area Identification – Issue 4: Water Quality
Sub-Issue 2: Protection of Riparian Areas
Riparian areas, or streamside management areas, are the critical interface between forest land and the waterways of the state (Figure 4.8). They filter out sediment from runoff and the vegetation within these areas holds the stream bank in place during high water events. Although all forested land is important to clean water, these areas are critical to the long-term protection of waterways.
Figure 4.8: Tree planting along a riparian buffer area (unknown source).
In West Virginia, many riparian areas are threatened by agriculture, as farmers keep them cleared for additional crop production or grazing. Many farmers let their animals have access to the stream channel itself for watering purposes, which causes a host of other issues, including bacterial contamination, increased biological oxygen demand, and sedimentation. Even though there are cost share and incentive programs in place to eliminate this practice, their effectiveness depends on attaining the interest and cooperation of private landowners.
Development also negatively impacts riparian areas within the state. These critical buffers are often infringed upon as land is graded flat for construction or cleared for lawns in housing developments, adding stress to the buffers and diminishing their protective capabilities. More significantly, riparian areas are sometimes removed entirely as segments of streams are channelized underneath parking lots or fill.

West Virginia Statewide Forest Resource Assessment 2010
Issues, Sub-Issues, and Priority Area Identification – Issue 4: Water Quality 197
Sub-Issue 3: Impaired Watersheds All sub-watersheds within the state are not equal, nor are they all impaired. There is often little that can be done forestry-wise to improve impaired sub-watersheds. The WVDEP is the primary agency in charge of classifying 303(d) impaired streams and the development of Total Maximum Daily Load (TMDL) limits. This data is constantly being updated to form a comprehensive picture of stream degradation. This information is vital to efforts to mitigate degradation, or at least protect streams from further degradation (Map 4.6).
Map 4.6: Number of miles of biologically and/or iron impaired streams in each sub-watershed in West Virginia. (WVDOF GIS, 2009 with data provided by WVDEP).
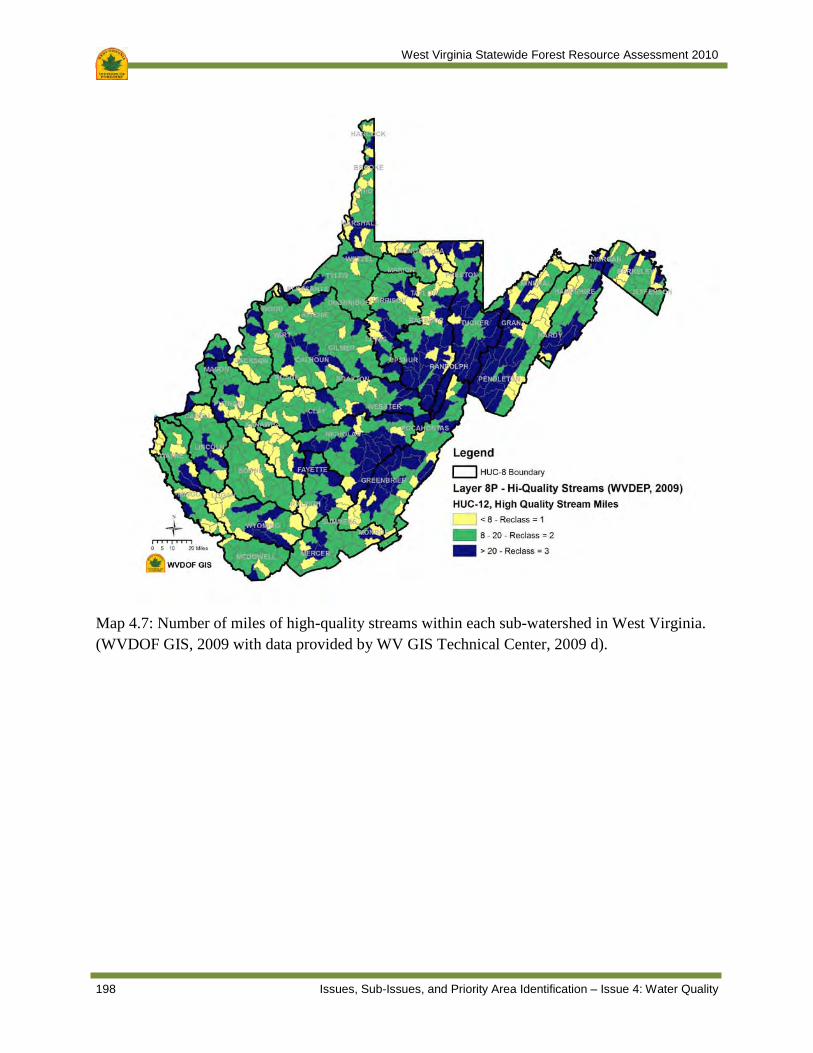
It is important to keep in mind that these problems did not develop overnight and they will not be solved overnight. A number of areas of the state have significant high-quality streams (Map 4.7). Preventing non-impaired streams from being impaired and preventing further degradation of currently impaired streams are important steps in the effort to improve the overall water quality. Even within the same sub-watersheds, it is quite common to have both impaired and high quality streams (compare Map 4.6 to Map 4.7).
West Virginia Statewide Forest Resource Assessment 2010
198 Issues, Sub-Issues, and Priority Area Identification – Issue 4: Water Quality
Map 4.7: Number of miles of high-quality streams within each sub-watershed in West Virginia. (WVDOF GIS, 2009 with data provided by WV GIS Technical Center, 2009 d).

West Virginia Statewide Forest Resource Assessment 2010
Issues, Sub-Issues, and Priority Area Identification – Issue 4: Water Quality 199
Sub-Issue 4: Protection of Public Drinking Water
Many of the state’s sub-watersheds are sources of public drinking water. It has been estimated that several of the state’s sub-watersheds are among the most important in the country, based on the percentage of the population which depend on surface water sources for drinking water (Barnes et al 2009). The majority of municipal water supplies, and a large portion of our rural supplies, are taken from surface water springs and streams. In some areas of the state, there are more than nine public water intakes within a single sub-watershed (Map 4.8).
The best way to supply clean water to this populace is by keeping as much of the sub-watershed in forest as possible and taking extra care to protect these sub-watersheds. Protection of water quality is a public health issue.
Map 4.8: Number of public water intakes per sub-watershed in West Virginia. (WVDOF GIS, 2009 with data provided by WVDHHR).

West Virginia Statewide Forest Resource Assessment 2010
200 Issues, Sub-Issues, and Priority Area Identification – Issue 4: Water Quality
Sub-Issue 5: Chesapeake Bay Watershed
Although the Chesapeake Bay is only one of three major watershed basins that have their headwaters within the state, it is probably the most conspicuous. Its protection and improvement are the goals of several federal and cooperative state projects. Although the issues within the Chesapeake Bay drainage are technically no different than any of the other issues addressed in this section, it has been targeted as an area of special concern. As one of the headwater states, with all or parts of nine counties within the Bay watershed, West Virginia has made special effort to encourage protection, education and public support among its citizens (Map 4.9). It is currently the only watershed in the state that has a Division of Forestry employee specifically assigned to focus on water quality efforts specifically within the watershed.
Map 4.9: Priority HUC-12 sub-watersheds within the Chesapeake Bay watershed in West Virginia based on the combination of restoration and protection priority areas from maps 4.10 and 4.11 (WVDOF GIS, 2009).

West Virginia Statewide Forest Resource Assessment 2010
Issues, Sub-Issues, and Priority Area Identification – Issue 4: Water Quality 201
The biggest obstacle to success in the Potomac River drainage is development pressure and public buy-in. Many WVDOF programs rely almost exclusively on public interest and involvement. In short, people and landowners have to sign up. However, this is some of the most valuable land in the state. It is often more economically attractive to keep the land in agriculture or to develop it, rather than to put the land into a riparian protection project or easement. This is an area that truly needs to be addressed and for which there is no easy solution. See Issue 1: Competing Land Uses, Forest Legacy Area 2 for more information.
High priority areas were identified using criteria outlined below. These areas possess conditions that indicate possible water quality issues that may be addressed with restoration and protection of sub-watersheds by traditional forestry practices and management.
Issue 4:
As the WVDOF looks toward developing strategies to address these issues, the need to identify cumulative areas of concern above and beyond the specific focal areas illustrated earlier becomes obvious. Although it would be advantageous to focus on the entire state, resources do not allow for such a widespread approach.
Priority Areas
Data used in prioritization:
• Forests, Water and People (Barnes et al 2009. Composite score derived by their methodology).
• Structural density (Structures per acre)
• Oil/Gas well density (Well permits/acre)
• Surface mine and valley fill permits. (Percentage of sub-watershed)
• Public Water Intakes (Number per sub-watershed)
• 303d Impaired Streams (Stream miles per sub-watershed)
• High Quality Streams (Stream miles per sub-watershed)
• Public Land (Percentage of sub-watershed in public land)
• Timber Harvesting Pressure* (Percentage of sub-watershed reported as harvested 2005-2009)
*This is point data not available by polygon, so these acreages may not be exactly correct for each sub-watershed, but they do indicate the general area in which timber was harvested.

West Virginia Statewide Forest Resource Assessment 2010
202 Issues, Sub-Issues, and Priority Area Identification – Issue 4: Water Quality
Restoration
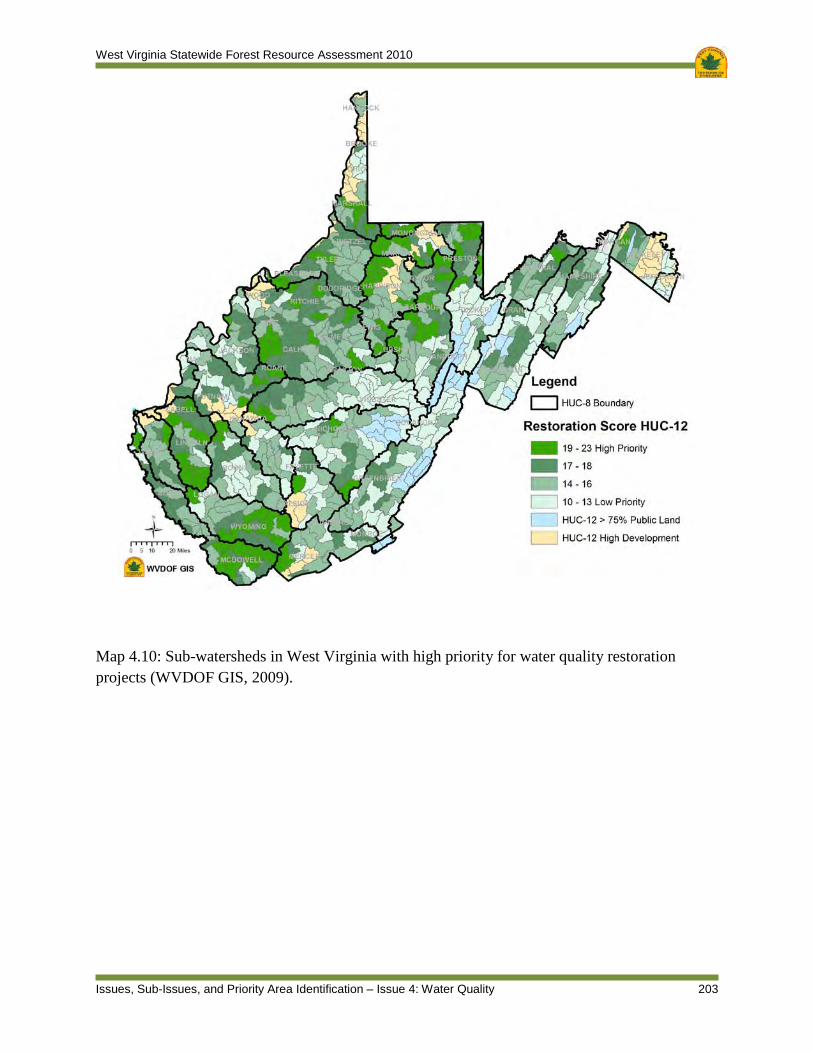
By analyzing the available data and prioritizing by importance (Table 4.1), priority areas were developed where efforts would best be spent on restoration projects such as riparian plantings, stream bank restoration, conversion of land to forest, or implementation of forestry Best Management Practices to reduce sedimentation from disturbance (Map 4.10).
Table 4.1: Criteria used to prioritize sub-watersheds for water quality restoration projects in West Virginia.
Restoration Input Layer Weighting and Prioritization by HUC-12 Sub-Watershed
Data Layer Sub-Watershed Reclassification Values
Unit of Measure 0 1 2 3 4 5 6
Impaired Streams <11 11-34 > 34 Stream Miles
Public Land >75* 51-75 26-50 <25 Percent Public Land
Surface and Fill Mining >20 5-20 <5 Percent of HUC-12
FWP APCW score 10-13 21-23 19-20
17-18 FWP APCW Comp. Score 14-16
Oil and Gas well density <0.004 ~ <0.025 Wells per Acre
Public Water Intakes <4 4-9 >9 Intakes per
HUC-12
Harvest Pressure <3 3-5 6-7 >7 Percent of HUC-12
Structural Density >0.25* <=0.25 Structures per Acre
* HUC-12s with a calculated structure density >0.25 structures/acre (urban sub-watersheds) and more than 75 percent public land area were scored, but excluded as priority areas.
West Virginia Statewide Forest Resource Assessment 2010
Issues, Sub-Issues, and Priority Area Identification – Issue 4: Water Quality 203
Map 4.10: Sub-watersheds in West Virginia with high priority for water quality restoration projects (WVDOF GIS, 2009).

West Virginia Statewide Forest Resource Assessment 2010
204 Issues, Sub-Issues, and Priority Area Identification – Issue 4: Water Quality
Protection
Some areas are in need of protection efforts such as enforcement focus, land acquisition for easements and public management, tax incentives to preserve forest land, focus on sustainable forest management, and forest health protection programs. Protection often requires entirely different strategies than restoration, but it is just as important for long-term management of forests. A sub-watershed that is a high priority for restoration, due to the presence of impaired streams, may also be a high priority for protection, due to the presence of high-quality streams in different locations of the same sub-watershed.
Table 4.2 outlines the criteria used to prioritize areas for water quality protection efforts. These areas are presented in Map 4.11.
Table 4.2: Criteria used to prioritize sub-watersheds for water quality protection efforts in West Virginia.
Protection Input Layer Weighting and Prioritization by HUC-12 Sub-Watershed
Data Layer Sub-watershed Reclassification Values
Unit of Measure 0 1 2 3 4 5 6
High Quality Streams <8 8-20 >20 Stream Miles
Public Land >75* 51-75 26-50 <25 Percent Public Land
Surface and Fill Mining >20 5-20 <5 Percent of HUC-12
FWP Ability to Produce Clean Water Score 10-13 21-23
19-20 17-18 APCW
Composite Score 14-16
Oil and Gas Well Density <0.004 ~ <0.025 Wells per Acre
Public Water Intakes <4 4-9 >9 Intakes per HUC-12
Harvest Pressure <3 3-5 6-7 >7 Percent of HUC-12
Structural Density >0.25* <=0.25 Structures per Acre
* HUC-12s with a calculated structure density >0.25 structures/acre (urban sub-watersheds) and more than 75 percent public land area were scored, but excluded as priority areas.

West Virginia Statewide Forest Resource Assessment 2010
Issues, Sub-Issues, and Priority Area Identification – Issue 4: Water Quality 205
Map 4.11: Sub-watersheds in West Virginia with high priority for water quality protection efforts (WVDOF GIS, 2009).

West Virginia Statewide Forest Resource Assessment 2010
206 Issues, Sub-Issues, and Priority Area Identification – Issue 4: Water Quality
Ideally, some areas will take a dual-pronged approach in which both restoration and protection issues are present in the same sub-watershed. In these cases a map was developed to indicate areas in need of both activities (Map 4.12). Restoration and protection scores were combined and then ranked to derive a single priority area where both protection and restoration activities would benefit the health of the sub-watershed.
Map 4.12: Sub-watersheds in West Virginia with high priority for both water quality restoration and protection efforts (WVDOF GIS, 2009).
High-development areas (urban sub-watersheds) and sub-watersheds with more than 75 percent public land were excluded as priority areas. This was done because these areas require different strategies and encounter different issues compared to other sub-watersheds.
There are 115 sub-watersheds identified as being priority areas for water quality restoration or protection from the damaging potential of the issues mentioned in this section. Development, oil and gas exploration, mining, farming, and timber harvesting are all important activities in the state, but they also present potential water quality problems if planned poorly or if there is a failure in implementation.

West Virginia Statewide Forest Resource Assessment 2010
Issues, Sub-Issues, and Priority Area Identification – Issue 4: Water Quality 207
Bibliography
Barnes, M.C., A.H. Todd, R.W. Whitney, and P.K. Barten. 2009. “Forests, Water and People: Drinking water supply and forest lands in the Northeast and Midwest United States”. USDA Forest Service.
Barnes, M.C., A.H. Todd, R.W. Whitney, and P.K. Barten. 2009. “wvapcw” 30 meter grid from “Forests, Water and People: Drinking water supply and forest lands in the Northeast and Midwest United States”. NA-FR-01-08. USDA Forest Service.
Bocan, John. 2009. “WVOG_Wells_20091113Q” shapefile. West Virginia Geological and Ecomomic Survey (WVGES).
Burger, J.A., D. Graves, P. Angel, V. Davis, and C. Zipper. 2005. “The Forestry Reclamation Approach”. The Appalachian Regional Reforestation Initiative.
Evans, Larry. 2009. Technical Applications and Geographic Information Systems (TAGIS) WV Dept. of Environmental Protection (WVDEP), Mining Permit Boundaries (updated daily) “perbd” accessed September 2009 and available at http://gis.wvdep.org/data/omr.html. Feng, Jonathan, Ph.D. 2006. “WV Public Water Sources (01-30-06)” database. Source Water Assessment Program, West Virginia Department of Health and Human Resources (WVDHHR) Bureau for Public Health, Office of Environmental Health Services, Environmental Engineering Division.
Montali, Dave. 2009. “WV2008_Impaired_by_pollutant_draft_20090520.shp” shapefile. WV Department of Environmental Protection (WVDEP).
Soeder, D.J. and W.M. Kappel. 2009. “Water Resources and Natural Gas Production from the Marcellus Shale”. U.S. Geological Survey Fact Sheet 2009–3032, 6 p.
WVDOF GIS, 2009. Issue 5: Water Quality and Quantity, Priority Area Analysis. WVDOF GIS, 2009 a. Harvest locations 2005-2009.
WV GIS Technical Center, 2009 a. “1wvWbdHu12_NRCS_2009_utm83.shp”, downloaded September, 2009 available at http://wvgis.wvu.edu//data/data.php
WV GIS Technical Center 2009 b. “structurePointsNorth_SAMB_2003_utm83.shp” and “structurePointsSouth_SAMB_2003_utm83.shp” downloaded June, 2009 available at http://wvgis.wvu.edu//data/data.php.
WV GIS Technical Center, 2009 c. “mining_fills-southern_wv.shp”, downloaded September, 2009 available at http://wvgis.wvu.edu//data/data.php WV GIS Technical Center, 2009 d.“wv_nhd_hq_merge_utm83.shp”, downloaded September, 2009 available at http://wvgis.wvu.edu//data/data.php

West Virginia Statewide Forest Resource Assessment 2010
208 Issues, Sub-Issues, and Priority Area Identification – Issue 5: Wildfire Management
Fire photos on the preceding page courtesy of Rodger Ozburn and Ben Webster, WVDOF; and Ron Snow and Steve Shaluta, WV Department of Commerce.

West Virginia Statewide Forest Resource Assessment 2010
Issues, Sub-Issues, and Priority Area Identification – Issue 5: Wildfire Management 209
Issue 5:
The West Virginia Division of Forestry’s (WVDOF) top priority has always been to protect the state's forests from the damage caused by wildfires. In 1908, more than 1.7 million acres of forest land were destroyed by wildfire. Because of this devastation, the West Virginia Reform Law of 1909 was enacted to protect the state's most abundant renewable resource, the forest. Today, the WVDOF is responsible for the protection of nearly 12 million acres of state and privately-owned forest land. There continues to be an unacceptable amount of fire activity in the southwestern counties of the state. There is also now an increased threat to life and property statewide in developed areas adjacent to or encompassed by forests. This is often referred to as the wildland-urban interface (WUI). The WVDOF has divided the Fire Program into three sections: prevention, preparedness and suppression. Prevention deals with educating the public in efforts to prevent fire ignitions. Preparedness includes the training and preparation of firefighters, as well as the acquisition and maintenance of appropriate equipment. Suppression is the physical act of fighting fires once they start, proceeding through containment, control, and extinguishment.
Wildfire Management, Resource Protection and Public Safety
Nine sub-issues will be addressed in this section:
1. Prevention, preparedness and suppression
2. Southern coalfields predictive burn areas (14 “Hot” counties)
3. Mine breaks
4. Identify existing/new wildland urban interface (WUI) areas
5. Location of volunteer fire department coverage in forested areas
6. Forest wildfire fuels / fire potential
7. Lack of public understanding of prescribed fire and WVDOF participation in the “Fire Learning Network”
8. Silvicultural benefits of prescribed fire
9. Property values in the wildland-urban interface

West Virginia Statewide Forest Resource Assessment 2010
210 Issues, Sub-Issues, and Priority Area Identification – Issue 5: Wildfire Management
Sub-Issue 1: Prevention, Preparedness and Suppression
The Division of Forestry's Wildland Fire Program is divided into three primary areas of concentration: prevention, preparedness, and suppression.
PREVENTION
Fire Prevention includes all activities which reduce the number and size of wildfires that occur in the state. Fire Prevention is often said to be the most important element of wildfire control. Over 98 percent of all wildfires in West Virginia are caused by careless or intentional acts of people and their activities (Figure 5.1). Since these fires are caused by humans, they can be prevented. Wildfire is an ever-present danger. To be effective, fire prevention must be practiced constantly. The employees of the Division of Forestry continually work to develop, within their assigned areas, effective prevention programs to prevent wildfires.
Over half of the acreage burned each year is caused by intentional acts alone (Figure 5.2). This is due to the fact that many of the incendiary fires occur in remote areas of the southern coalfields when conditions are favorable for wildfires.
Figure 5.1: Causes of wildland fires in West Virginia from the period 1999 – 2009 (WVDOF, 2009).
Equipment Use15%Rail Road
1%
Children3%
Miscellaneous6%
Lightning1%
Campfire2%
Smoker3%
Incendiary34%Debris Burning
35%

West Virginia Statewide Forest Resource Assessment 2010
Issues, Sub-Issues, and Priority Area Identification – Issue 5: Wildfire Management 211
Figure 5.2: Percentage of acres burned by wildland fires in West Virginia from various causes, for the period 1999-2009 (WVDOF, 2009).
West Virginia Division of Forestry and the Public
The Division of Forestry educates the citizens of West Virginia about the dangers and damages caused by wildfires. It is a constant goal of the WVDOF Foresters and Rangers to contact the public and make them aware of wildfires and the damage they cause throughout the state.
The Division of Forestry's primary ally in the fight against wildland fires is Smokey Bear, the national symbol for wildfire prevention. Smokey Bear, accompanied by forestry employees, appears at schools, fairs, festivals, and other events to remind residents that "Only You Can Prevent Forest Wildfires"; a message that is still true today, more than 65 years after its inception. In a typical year, WVDOF employees share Smokey's message with:
• 345 elementary schools
• 39 camps
• 265 media contacts
• 231 wildfire exhibits
• 173 group programs
Incendiary58%
Lightning1%
Campfire1%
Miscellaneous21%
Smoker1%
Debris Burning12%
Equipment Use4%Rail Road
1%
Children1%

West Virginia Statewide Forest Resource Assessment 2010
212 Issues, Sub-Issues, and Priority Area Identification – Issue 5: Wildfire Management
Another tool in the Division of Forestry's arsenal is the Firewise West Virginia program, an extension of the national Firewise Communities initiative. This program creates safe access and defensible space for homes adjacent to woodlands. The primary goals of Firewise West Virginia are to educate the public on measures to minimize property damage from wildfires and to help communities develop wildland fire mitigation plans, hazard reduction projects, and protection improvements. Firewise West Virginia is active in a ten-county area, known as the Potomac Highlands. This area, which has a high risk of wildland/urban interface fires, includes Berkeley, Grant, Hampshire, Hardy, Jefferson, Mineral, Morgan, Pendleton, Pocahontas and Tucker counties. Firewise West Virginia has proven to be successful and will continue to grow throughout West Virginia.
PREPAREDNESS
Preparedness (pre-suppression) activities consist of work and training done in advance of wildfire occurrence to ensure timely, effective and safe suppression actions. Monitoring of weather conditions is an important component of wildfire preparedness.
West Virginia has an established network of 16 Remote Automated Weather Stations (RAWS), which monitor and transmit the current fire weather conditions from across the state (Map 5.1). Thirteen of these stations are owned, monitored and maintained by the West Virginia Division of Forestry.
Weather monitoring at the federal and state level is used to forecast wildfire danger and to predict potential wildland fire activity. These predictions assist in wildland fire mobilization efforts throughout the state and country.
Biennial Fire School
All new Division of Forestry employees are required to participate in a biennial Wildland Fire Suppression training school conducted by the WVDOF. This training session gives new employees a basic knowledge of wildfire suppression tactics and a basic understanding of what needs to be done during all wildland fire suppression activities.
As a result of this and other training opportunities, West Virginia's wildfire suppression personnel are qualified to assist in national wildfire emergencies.

West Virginia Statewide Forest Resource Assessment 2010
Issues, Sub-Issues, and Priority Area Identification – Issue 5: Wildfire Management 213
Weather Stations
Map 5.1: Locations of Remote Automated Weather Stations (RAWS) in West Virginia (WVDOF GIS, 2009 a).
Annual Fire Academy - Middle-Atlantic Interstate Forest Fire Protection Compact
The states of Delaware, Maryland, New Jersey, Ohio, Pennsylvania, Virginia and West Virginia (The Mid-Atlantic Compact), in cooperation with West Virginia University, have developed a wildland fire training academy. The Inaugural Mid-Atlantic Wildfire Academy took place at West Virginia University in June of 2007. As part of its training schedule, the WVDOF had the privilege to send some of its employees to the training academy both as students and instructors. Over the three years since the development of this training academy, an average of 166 wildland fire students from surrounding states and fire departments have attended the academy each year. The course list for the academy contains National Wildfire Coordination Group courses and places an emphasis on Western Fire mobilization requirements.

West Virginia Statewide Forest Resource Assessment 2010
214 Issues, Sub-Issues, and Priority Area Identification – Issue 5: Wildfire Management
Volunteer Fire Department Training & Equipment
The WVDOF relies heavily on the assistance of volunteer fire departments (VFD's), local fire wardens (LFW's), the National Guard, prison inmates and other volunteers to aid in wildfire suppression activities (Figure 5.3). Cooperators must be trained in safe, proper, and efficient wildland fire suppression techniques. On average, WVDOF trains 50 volunteer fire departments and a total of 1,100 volunteer firefighters annually. These volunteer firefighters are taught National Wildfire Coordination Group (NWCG) certified courses. Each firefighter that successfully completes the course is issued a full set of personal protective equipment (PPE). This includes Nomex pants and shirt, a pair of leather gloves, and a wildland firefighter’s hard hat. For every 5 department members that successfully complete the course, the department is issued either a leaf blower or chainsaw, for use in fire suppression efforts.
With this nationally recognized training, firefighters are qualified to participate in national wildland fire suppression emergencies.
Figure 5.3: Percentage of wildland fires in West Virginia that utilized a volunteer fire department (VFD) to assist with fire suppression activities for the period 1999-2009 (WVDOF, 2009).
VFD NOT Used26%
VFD Used74%

West Virginia Statewide Forest Resource Assessment 2010
Issues, Sub-Issues, and Priority Area Identification – Issue 5: Wildfire Management 215
Communications
The WVDOF operates and maintains 19 Federal Communications Commission (FCC) licensed radio repeater locations and 6 FCC licensed radio control stations (Map 5.2). This two-way radio system has been in operation for many years and continues to be extremely reliable. The system currently operates on an analog frequency system which is becoming outdated. The system is in the process of being updated to digital/narrowband capabilities to comply with the requirements of the FCC.
This radio system enables state emergency personnel to communicate with each other and allows WVDOF employees to communicate with Compact and Federal partners from the Monongahela, George Washington, Jefferson, and Wayne National Forests, and the New River Gorge National Park.
Map 5.2: Locations and coverage area of West Virginia Division of Forestry radio repeater and control stations.

West Virginia Statewide Forest Resource Assessment 2010
216 Issues, Sub-Issues, and Priority Area Identification – Issue 5: Wildfire Management
Reporting
The USDA Forest Service requires that they be informed of daily fire activity and be given a yearly report that includes various fire data. In order to provide this data, the WVDOF utilizes an electronic fire reporting system to record and document all wildfires that occur on state-owned and private property within West Virginia. Maintenance and upkeep of these records allows the WVDOF to provide up-to-date and accurate data for all agencies involved.
SUPPRESSION
Fire suppression is the detection and confinement of wildfires, utilizing all available resources, technology, and manpower available to the division. This includes the utilization of an aerial detection system plus the development and maintenance of all suppression equipment and resources in the local community structure.
The WVDOF utilizes several aerial detection aircraft throughout the state. These aircraft are provided by contract vendors which are located in each of the three WVDOF regions. These aircraft are given pre-established flight routes to observe wildland fire activity in the higher occurrence areas.
The WVDOF also utilizes a contracted rotary wing suppression aircraft (helicopter), which is located centrally in the higher fire occurrence area. The helicopter serves as an invaluable resource to assist suppression efforts on the ground. The helicopter is able slow the spread of fire and allows fire crews to establish control lines. The use of the helicopter reduces the number of acres burned and limits damage to the state's forest resource. When needed, the helicopter has the ability to protect structures or firefighters, should they become trapped or their safety become compromised due to unpredicted wildfire activity.
The primary tools used by employees of the WVDOF to suppress wildfires are fire rakes, leaf blowers, and Type VI engines (when they can be used safely and effectively). Most wildfires in the state are surface fires burning leaves and woody debris. Suppression involves the removal of this material down to mineral soil, often digging into the duff layer of the forest floor. These tools are effective on most fires, but there are occasions where heavier mechanical equipment must be used. In these circumstances, employees use bulldozers that are contracted through local vendors. This larger equipment allows control lines to be established in heavier fuels such as logging and storm debris. Without the use of mechanical equipment in these situations, control lines would have to be relocated to areas where hand tools could be utilized. This can result in an increase in acres burned and damage to the forest resource.
Investigations
The Division’s Forestry Investigative Unit is primarily charged with the investigation of all violations of the West Virginia State forestry fire laws as stipulated within West Virginia State Code §20-3. In addition, they also have authority to enforce violations of West Virginia State Code §19B (The Logging Sediment Control Act of 1992). The investigation of fire law

West Virginia Statewide Forest Resource Assessment 2010
Issues, Sub-Issues, and Priority Area Identification – Issue 5: Wildfire Management 217
violations ranges from simple debris burning violations to felony prosecutions for setting fire on the lands of another owner (arson), the only felony violation within the fire laws of the state.
This unit currently consists of three uniformed investigators and one administrative supervisor. Two of the Forestry Investigators are also K-9 officers utilizing bloodhounds for tracking wildland fire arson suspects, as well as assisting city, county, and other state agencies with locating missing children, lost hunters, hikers, criminal suspects, and escapees.
The Investigative Unit works primarily within the state of West Virginia, but they have traveled throughout the nation to assist in wildland fire arson investigations and to assist in the teaching and training of outside agency investigators. Due to the outstanding efforts of these investigators, the West Virginia Division of Forestry is a nationally recognized leader in the investigation and prosecution of wildland arsonists.
Wildland Fire Trends
Due to continual efforts in wildfire prevention and investigation, the number of fires has been gradually decreasing in the higher incidence counties – those with more than 20,000 acres burned in the last 10 years (Figures 5.4 through 5.8). Due to efforts of the investigations unit, the number of arson fires has also been decreasing.
Figure 5.4: Number of wildfires during each fall and spring fire season from 1999 to 2009 in Boone County, West Virginia (WVDOF, 2009).
02468
101214161820
Fall
1999
Sprin
g 20
00
Fall
2000
Sprin
g 20
01
Fall
2001
Sprin
g 20
02
Fall
2002
Sprin
g 20
03
Fall
2003
Sprin
g 20
04Fa
ll 20
04Sp
ring
2005
Fall
2005
Sprin
g 20
06
Fall
2006
Sprin
g 20
07
Fall
2007
Sprin
g 20
08
Fall
2008
Sprin
g 20
09
Season & Fiscal Year
# of
Fire
s IncendiaryDebris Burning
Miscellaneous

West Virginia Statewide Forest Resource Assessment 2010
218 Issues, Sub-Issues, and Priority Area Identification – Issue 5: Wildfire Management
Figure 5.5: Number of wildfires during each fall and spring fire season from 1999 to 2009 in Kanawha County, West Virginia (WVDOF, 2009).
Figure 5.6: Number of wildfires during each fall and spring fire season from 1999 to 2009 in Logan County, West Virginia (WVDOF, 2009).
05
101520253035404550
Fall
1999
Sprin
g 20
00
Fall
2000
Sprin
g 20
01
Fall
2001
Sprin
g 20
02
Fall
2002
Sprin
g 20
03
Fall
2003
Sprin
g 20
04Fa
ll 20
04Sp
ring
2005
Fall
2005
Sprin
g 20
06
Fall
2006
Sprin
g 20
07
Fall
2007
Sprin
g 20
08
Fall
2008
Sprin
g 20
09
Season & Fiscal Year
# of
Fire
s IncendiaryDebris Burning
Miscellaneous
0
5
10
15
20
25
30
Fall
1999
Sprin
g 20
00
Fall
2000
Sprin
g 20
01
Fall
2001
Sprin
g 20
02
Fall
2002
Sprin
g 20
03
Fall
2003
Sprin
g 20
04Fa
ll 20
04Sp
ring
2005
Fall
2005
Sprin
g 20
06
Fall
2006
Sprin
g 20
07
Fall
2007
Sprin
g 20
08
Fall
2008
Sprin
g 20
09
Season & Fiscal Year
# of
Fire
s IncendiaryDebris Burning
Miscellaneous

West Virginia Statewide Forest Resource Assessment 2010
Issues, Sub-Issues, and Priority Area Identification – Issue 5: Wildfire Management 219
Figure 5.7: Number of wildfires during each fall and spring fire season from 1999 to 2009 in McDowell County, West Virginia (WVDOF, 2009).
Figure 5.8: Number of wildfires during each fall and spring fire season from 1999 to 2009 in Mingo County, West Virginia (WVDOF, 2009).
0
5
10
15
20
25Fa
ll 199
9Sp
ring
2000
Fall 2
000
Sprin
g 20
01
Fall 2
001
Sprin
g 20
02
Fall 2
002
Sprin
g 20
03
Fall 2
003
Sprin
g 20
04Fa
ll 200
4Sp
ring
2005
Fall 2
005
Sprin
g 20
06
Fall 2
006
Sprin
g 20
07
Fall 2
007
Sprin
g 20
08
Fall 2
008
Sprin
g 20
09
Season & Fiscal Year
# of
Fire
s IncendiaryDebris Burning
Miscellaneous
05
101520253035404550
Fall 1
999
Sprin
g 20
00
Fall 2
000
Sprin
g 20
01
Fall 2
001
Sprin
g 20
02
Fall 2
002
Sprin
g 20
03
Fall 2
003
Sprin
g 20
04Fa
ll 200
4Sp
ring
2005
Fall 2
005
Sprin
g 20
06
Fall 2
006
Sprin
g 20
07
Fall 2
007
Sprin
g 20
08
Fall 2
008
Sprin
g 20
09
Season & Fiscal Year
# of
Fire
s IncendiaryDebris Burning
Miscellaneous

West Virginia Statewide Forest Resource Assessment 2010
220 Issues, Sub-Issues, and Priority Area Identification – Issue 5: Wildfire Management
During times of extreme fire activity, resources are requested from cooperating agencies. There are many locations throughout the state that provide much needed services (Map 5.3). In addition to training its own personnel and volunteer fire fighters, WVDOF works with the West Virginia Department of Corrections to train low-threat inmates as fire fighters. The Division also maintains a working relationship with the Army National Guard to train them as fire fighters, to staff command posts, and to transport other fire fighters and equipment. As part of its aerial suppression program, the Division has designated airports throughout the state which can provide aviation fuel and hanger services, should additional aircraft be brought in from other locations.
Map 5.3: Locations of extended fire support resources available to the West Virginia Division of Forestry. (WVDOF GIS, 2009. Data provided by the WVU GIS Tech Center, 2009).

West Virginia Statewide Forest Resource Assessment 2010
Issues, Sub-Issues, and Priority Area Identification – Issue 5: Wildfire Management 221
Statutory Fire Seasons (Restricted Burning Periods)
In efforts to protect the state's forests from wildfire, it is illegal to conduct any outdoor burning between 7 a.m. and 4 p.m. during the following statutory fire seasons:
Spring Forest Fire Season - March 1 through May 31
Fall Forest Fire Season - October 1 through December 31
Ninety-eight percent of the wildfires in West Virginia are caused by human activities in the forest environment and the statutory fire season is designed to reduce the number of wildfires from such causes.
Sub-Issue 2: Southern Coal Fields "Predictive Burn Area" (14 Hot Counties)
There continues to be an unacceptable amount of fire activity in the southwestern counties of the state (Map 5.4). This area is often referred to as the “14 hot counties of the southern coalfields”.
Map 5.4: The 14 “hot”counties in southwestern West Virginia with the highest incidence of wildland fire occurance (WVDOF GIS, 2009 b).

West Virginia Statewide Forest Resource Assessment 2010
222 Issues, Sub-Issues, and Priority Area Identification – Issue 5: Wildfire Management
Wildfires occur in every county within the state. However, the largest percentage of forest land consumed by wildfire has traditionally been in the southern counties. The 14 southern counties with the highest occurrences of wildfire account for more than half of the wildfires in the state and 95 percent of the acreage burned (Table 5.1). These are referred to as the "Hot Counties" due to the high occurrence of fire in this area. In addition to having some of the steepest and most rugged terrain in the state, these counties often have the driest weather conditions in the state during fire season.
Table 5.1: The number of wildfires and acreage burned from 2000 through 2009 in the 14 counties with high wildfire occurrence in southern West Virginia (WVDOF, 2009).
Fiscal Years 2000 - 2009 (inclusive)
County # of
Fires % of Fires Statewide
# of Acres Burned
% of Acres Burned Statewide
Boone 373 4 50,348 17 Cabell 314 3 562 Clay 192 2 5,104 2 Fayette 270 3 12,783 4 Kanawha 658 7 20,716 7 Lincoln 448 5 17,281 6 Logan 431 4 27,981 9 McDowell 438 4 29,537 10 Mercer 486 5 4,102 1 Mingo 529 5 54,124 18 Nicholas 153 2 3,497 1 Raleigh 441 4 17,482 6 Wayne 589 6 19,204 7 Wyoming 337 3 18,454 7
57% of Fires Statewide 95% of Acres Burned Statewide Remaining 41 Counties in the State
4,317 Fires 16,453 Acres Burned 43% of Fires Statewide 5% of Acres Burned Statewide

West Virginia Statewide Forest Resource Assessment 2010
Issues, Sub-Issues, and Priority Area Identification – Issue 5: Wildfire Management 223
An increasing number of fires and acreage burned are occurring in the Eastern Panhandle of the state (Map 5.5). This increase in activity is a relatively new phenomenon caused by a dramatic increase in population in this area. In addition, the construction of new homes within the wildland-urban interface is becoming common in this area, increasing the danger posed by wildfires.
Map 5.5: Wildfire occurrence in West Virgina counties from 1999 – 2009 (WVDOF GIS, 2009 c).

West Virginia Statewide Forest Resource Assessment 2010
224 Issues, Sub-Issues, and Priority Area Identification – Issue 5: Wildfire Management
Although the frequency of wildfires is increasing in the Eastern Panhandle, the average acreage burned is relatively small, compared to the 14 “hot” counties in the southern coalfields (Map 5.6).
Map 5.6: Acres burned by wildfires in West Virginia counties from 1999 – 2009 (WVDOF GIS, 2009 d).

West Virginia Statewide Forest Resource Assessment 2010
Issues, Sub-Issues, and Priority Area Identification – Issue 5: Wildfire Management 225
Not only does the southern area of the state have the highest fire occurrence and acreage burned each year, but there are several specific areas that burn repeatedly. Map 5.7 shows areas where ignitions occur within 1/2 mile of each other on a regular basis. These same areas experience the largest percentage of fires caused by debris burning and incendiary action.
Map 5.7: Areas in West Virginia with repeated wildfire incidences occurring within a single ½ mile radius from 1999-2009 (WVDOF GIS, 2009 e).

West Virginia Statewide Forest Resource Assessment 2010
226 Issues, Sub-Issues, and Priority Area Identification – Issue 5: Wildfire Management
Sub-Issue 3: Mine Breaks
Mining activity & location in relation to areas of increased fire activity
Within the state of West Virginia, there are thousands of acres that have previously been mined or are currently being mined for coal. The coal mining process is done by various methods, including underground mining. This method involves removing coal seams from beneath the earth’s surface. The removal of this material leaves an empty space and at the completion of the mining activity, the earth will settle and crack. This "settling" of the earth's surface may leave exposed cracks in the forest floor which may expose residual coal seams, referred to as “mine breaks”. If these coal seams are exposed to an ignition source and ignite, they cannot be easily extinguished and will spread underground. Once this occurs, the seams will burn until the coal is consumed, which can take many years. If seams burn to the surface, they can and frequently do start wildfires.
A "treated" mine break refers to a mine break that has been located and has had substantial wildfire control lines established. These control lines are put in place by bulldozers in an effort to reduce the amount of acres burned by these mine breaks, should they rise to the surface and ignite a wildfire. Most mine breaks in the state have not yet been treated (Map 5.8).
Map 5.8: Location of treated and untreated mine breaks in West Virginia. (WVDOF GIS 2009, data provided by the WVDEP).

West Virginia Statewide Forest Resource Assessment 2010
Issues, Sub-Issues, and Priority Area Identification – Issue 5: Wildfire Management 227
Rural locations of mine breaks
The vast majority of mine breaks occur in the southern coalfield counties (Map 5.9). Control efforts are difficult due to the remote location of many mines and the depth and length of the mines. Due to the rural locations of these fires, they often go undetected until the fires have been burning for some time. In addition, their occurrence in undeveloped areas with rugged terrain makes control efforts difficult. Although mine breaks are not a primary cause of wildfire incidence within the state, their rural locations, a lack of timely detection, and difficulty with suppression efforts, often lead to a larger number of acres burned.
Map 5.9: Locations of treated and untreated mine breaks in the southern coal fields of West Virginia. (WVDOF GIS, 2009 data provided by the WVDEP).
New and old breaks
In an effort to control the impacts of mine break fires and decrease the acres burned by these fires, a project was initiated to locate known mine breaks which burn frequently and establish control lines around them. This project has proven to be a success for known mine breaks.
West Virginia Statewide Forest Resource Assessment 2010
228 Issues, Sub-Issues, and Priority Area Identification – Issue 5: Wildfire Management
Unfortunately, this project had limited funding and the number of known mine breaks treated is just a small percentage of those that are known. This does not take into account that mining activity in the state continues. New mine breaks are created on a regular basis, but are often not detected until after they are ignited.
Sub-Issue 4: Identify Existing/New Wildland-Urban Interface (WUI) Areas
Current 10-county area of attention (Potomac Highlands/Eastern Panhandle)
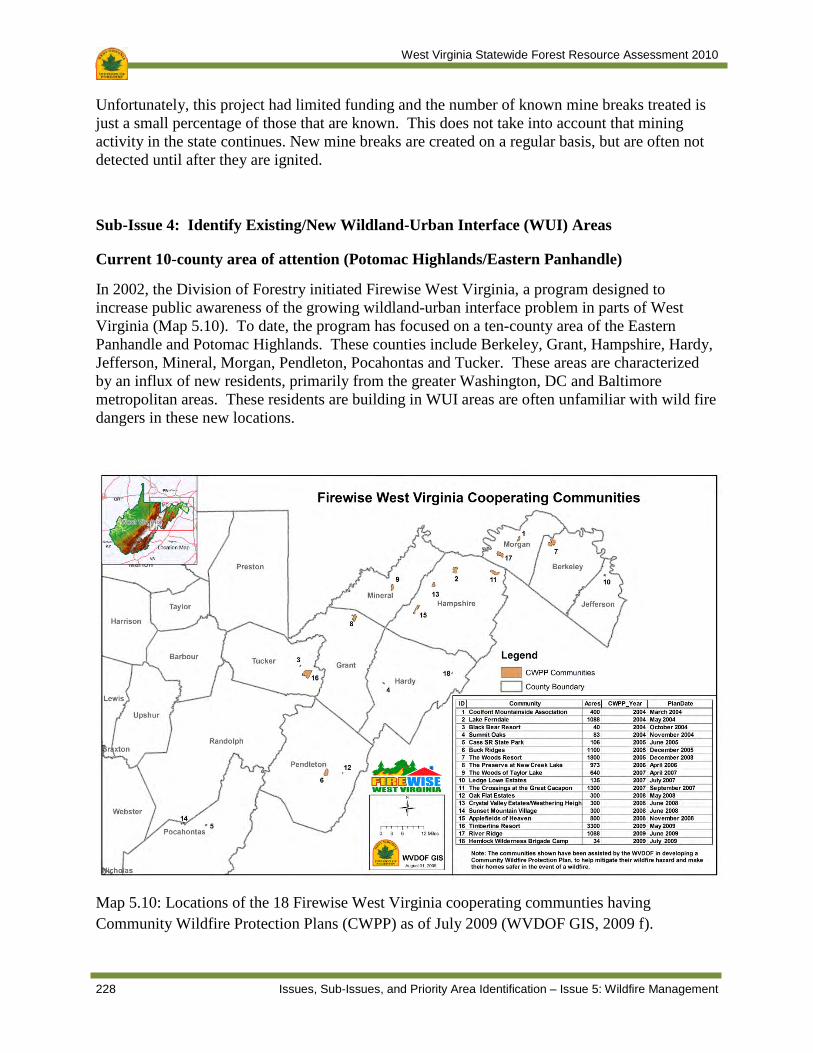
In 2002, the Division of Forestry initiated Firewise West Virginia, a program designed to increase public awareness of the growing wildland-urban interface problem in parts of West Virginia (Map 5.10). To date, the program has focused on a ten-county area of the Eastern Panhandle and Potomac Highlands. These counties include Berkeley, Grant, Hampshire, Hardy, Jefferson, Mineral, Morgan, Pendleton, Pocahontas and Tucker. These areas are characterized by an influx of new residents, primarily from the greater Washington, DC and Baltimore metropolitan areas. These residents are building in WUI areas are often unfamiliar with wild fire dangers in these new locations.
Map 5.10: Locations of the 18 Firewise West Virginia cooperating communties having Community Wildfire Protection Plans (CWPP) as of July 2009 (WVDOF GIS, 2009 f).

West Virginia Statewide Forest Resource Assessment 2010
Issues, Sub-Issues, and Priority Area Identification – Issue 5: Wildfire Management 229
Future areas of need
The Eastern Panhandle is not the only region of West Virginia that is experiencing growth and an increase in the number of homes built in the wildland-urban interface. There are enough areas of growth throughout the state that the WVDOF has considered expanding the Firewise program into the north-central counties in the immediate future, and possibly into other regions of the state as support for the program allows (Maps 5.11 and 5.12).
As mentioned above and illustrated by the two maps below, many population increases are occurring in wildland-urban interface areas, which normally provide less fire protection than urban areas. Due to this lack of fire protection, there will need to be more home owner and resident responsibility in safeguarding their properties.
Map 5.11: Regional wildland-urban inerface intensity in 2009 showing West Virginia wildfire risk compared to the other 19 Northeastern Area (NA) states (Chavez, 2009).

West Virginia Statewide Forest Resource Assessment 2010
230 Issues, Sub-Issues, and Priority Area Identification – Issue 5: Wildfire Management
Map 5.12: Wildland-urban inerface intensity in West Virginia, 2009 used as an input to identify priority areas for this issue (Chavez, 2009).
Increased population in rural areas
In recent years an increase in federal land ownership (national parks, forests, and wildlife refuges, etc.), has attracted many new residents into rural areas of West Virginia for the recreation opportunities and aesthetics. This has created many new wildland-urban interface situations. New home construction has increased dramatically in the eastern panhandle of the state, in the New River Gorge National Scenic River vicinity, along interstate corridors, in areas adjacent to public lands, and other similar areas. In addition, older developments have expanded and the vegetation planted when these communities were created has now grown to maturity, often increasing the fire danger.
Full time residency versus part-time vacation homes
Most of the newer communities being developed contain single-family homes that are intended for permanent residences. However, the state has many “resort” communities that are weekend getaways for residents from the metropolitan areas to the east and south. Regardless of residency status, the individual homeowner and the community as a whole need to become aware of wildfire hazard in the wildland-urban interface and be given the information and technical guidance needed to reduce their risk of property damage from wildland fires.

West Virginia Statewide Forest Resource Assessment 2010
Issues, Sub-Issues, and Priority Area Identification – Issue 5: Wildfire Management 231
Sub-Issue 5: Location of Volunteer Fire Department Coverage in Forested Areas
The West Virginia Division of Forestry is the primary agency in the state responsible for the protection of nearly 12 million acres of state and privately-owned forest land from wildfire. Within the state are approximately 445 volunteer, paid, or partially paid fire departments that respond to wildland fire calls and assist WVDOF with wildfire suppression. Volunteer fire departments (VFDs) are particularly important sources of wildfire suppression support, since they are typically located in more rural communities. However, much of the state’s forest land is located a considerable distance from any community and is beyond a 15-minute response/driving time from any volunteer fire department (Map 5.13).
In the counties of the state with the highest number of fire occurrences, there are significant deficiencies in fire department coverage and an extended response time. With the extended response times in these areas, fires are able to increase in size and severity.
Map 5.13: Locations of volunteer fire departments in West Virginia, with corresponding areas within a 15-minute drive time from each station; and wildland fire frequency, by county, from 1999 - 2009 (WVDOF GIS, 2009 c and WV GIS Technical Center, 2009 b).

West Virginia Statewide Forest Resource Assessment 2010
232 Issues, Sub-Issues, and Priority Area Identification – Issue 5: Wildfire Management
VFD Incident Response Times
Due to the nature of a volunteer fire department, response times can vary and are typically longer than response times from fire departments with full-time firefighters. Members of VFDs have regular employment to which they are committed. When a wildfire is detected and a call for assistance is made to the department, there may not be adequate members available or they may be delayed in responding.
Rural department lack of funds, equipment and training
Many rural VFDs rely solely on the availability of grants as the source of funds for operations. The availability of grant funds can be the limiting factor as to what services a department can offer. Funds from grants are also the source of money the departments use to purchase their emergency response equipment and fire suppression equipment. These funds are also used to pay for required training.
West Virginia Division of Forestry in conjunction with the Fire Department at the Martinsburg Air National Guard utilized Volunteer Fire Assistance funds to train and equip firefighters with personal protective equipment, making them available to support wildfire suppression in West Virginia or nationally. (Photo source: The Year in Forestry Fiscal Year 2006, USDA, Forest Service, Northeastern Area, State and Private Forestry, NA-IN-01-07).

West Virginia Statewide Forest Resource Assessment 2010
Issues, Sub-Issues, and Priority Area Identification – Issue 5: Wildfire Management 233
Sub-Issue 6: Wildfire Fuels / Fire Potential
The majority of the forest fires in West Virginia occur in the oak/hickory forest type, which covers the majority of the state, as illustrated by Map 5.14. This group includes several species of oaks, hickories, yellow-poplar, and other hardwoods. All of these species produce a very heavy leaf fall, which becomes fuel for wildland fires. The standing trees themselves do not normally burn during forest fires. However, when limbs or trees fall on the ground and dry out, these heavy fuels do often burn and smolder for many days. This can make wildfire suppression in this fuel type a very difficult and extended effort.
Also, with the high level of logging activity in the state due to its abundant timber resource, the potential exists for wildland fires to start and/or spread into areas of logging slash and debris. Fires in these areas are difficult to suppress, and often require the aid of mechanical equipment (chainsaws, bulldozers, fire plows, etc.) in order to bring them under control.
Map 5.14: US Forest Service Forest Inventory and Analysis forest groups of West Virginia (USDA FS - FIA, 2008).

West Virginia Statewide Forest Resource Assessment 2010
234 Issues, Sub-Issues, and Priority Area Identification – Issue 5: Wildfire Management
The LANDFIRE Scott and Burgan 40 Fire Fuel Model (Map 5.15) illustrates the relative distribution of fuel models in the 20 Northeast and Midwest states. These fuel models correlate to wildfire risk under a general set of conditions in which all areas of the study would experience wildfire activity. Most of West Virginia falls into the category of moderate risk for wildfires.
Map 5.15: Scott & Burgan 40 Fuel Model, Northeastern Area Wildfire Risk Assessment created 11/09 QMC St. Paul Field Office (Chavez, 2009).

West Virginia Statewide Forest Resource Assessment 2010
Issues, Sub-Issues, and Priority Area Identification – Issue 5: Wildfire Management 235
Aspect and Slope Considerations
Aspect
refers to the direction in which a slope is facing. Aspects of 135 - 315 degrees are South, Southwest and West facing slopes. Slopes included in this range are exposed to sunlight for a longer period of time which will preheat potential wildland fire fuels and allow for an accelerated drying process (Map 5.16).
Map 5.16: Aspects between 1350-3150, Northeastern Area Wildfire Risk Assessment created 11/09 QMC St. Paul Field Office (Chavez, 2009).

West Virginia Statewide Forest Resource Assessment 2010
236 Issues, Sub-Issues, and Priority Area Identification – Issue 5: Wildfire Management
Slope refers to the steepness or incline of terrain. Increased slopes (of greater than 20 percent) will allow for an increase in several factors which will affect fire behavior. An increase in slope will allow for preheating of wildland fire fuels. As a fire burns, the warm smoke and gases will rise along the slope above exposing potential fuels to warmer temperatures. An increase in slope will also result in increased flame heights which will affect the amount of preheating a potential fuel will receive. Slope is a direct factor in flame height and preheating, which in turn directly affects the rate of spread that will be experienced on a fire.
Map 5.17: Slope (> than 20 percent) Northeastern Area Wildfire Risk Assessment created 11/09 QMC St. Paul Field Office (Chavez, 2009).

West Virginia Statewide Forest Resource Assessment 2010
Issues, Sub-Issues, and Priority Area Identification – Issue 5: Wildfire Management 237
Maps 5.16 thru 5.19 illustrate the aspect, slope, and topography which occur in West Virginia. The aspects are very evenly distributed throughout the state as shown in Map 5.16. The majority of slopes in West Virginia’s high fire occurrence areas are 20 percent or greater as shown in Map 5.17. Combining slope and aspect in Maps 5.18 and 5.19, shows that West Virginia has considerable acreage with high or extreme wild fire risks.
Not only do aspect and slope have an effect on fire behavior, but slope has a direct affect on the type of initial attack efforts applied to a wildland fire (direct or indirect attack). The slopes of 20 percent or greater are experienced primarily in the southwest area of the state and often justify indirect attack techniques. These slopes are the natural mountain formations and cliffs, and often times are high walls created by mining operations. No matter what the cause, natural or manmade, slopes will affect the size and accessibility of a wildland fire. When wildfires occur in remote or steep areas, access is often difficult. In these circumstances, wildland fires will grow in size and intensity and will burn to containment lines that have been established at locations that are safely accessible by fire fighters.
Map 5.18: Topography Module areas in West Virginia of slope > than 20 percent and aspects between 1350-3150, Northeastern Area Wildfire Risk Assessment created 11/09 QMC St. Paul Field Office (Chavez, 2009).

West Virginia Statewide Forest Resource Assessment 2010
238 Issues, Sub-Issues, and Priority Area Identification – Issue 5: Wildfire Management
Map 5.19: Topography Map Northeastern Area Wildfire Risk Assessment created 11/09 QMC St. Paul Field Office (Chavez, 2009).

West Virginia Statewide Forest Resource Assessment 2010
Issues, Sub-Issues, and Priority Area Identification – Issue 5: Wildfire Management 239
Map 5.20 illustrates large patches of forested land that are 500 acres in size or greater and which are located 1/4 mile or more from an access road, as well as a location summary by county (Map 5.21). Wildland fires which occur on these lands require specific and extended wildland fire suppression tactics. Often times, there are no access roads into these remote areas. When there are roads, they are often narrow and impassable by standard sized fire engines with traditional equipment. This causes extended response times before fire fighters can reach the scene. Under the right burning conditions, the above factors create the potential for large fires which are difficult to control.
Map 5.20: Contiguous forest land greater than 500 acres located 1/4 mile from access road (WVDOF GIS, 2009 and Rieman et al , 2009 a & b).

West Virginia Statewide Forest Resource Assessment 2010
240 Issues, Sub-Issues, and Priority Area Identification – Issue 5: Wildfire Management
Map 5.21: Counties with 500+ acre parcels of forested property in remotes areas (WVDOF GIS, 2009 g).

West Virginia Statewide Forest Resource Assessment 2010
Issues, Sub-Issues, and Priority Area Identification – Issue 5: Wildfire Management 241
Sub-Issue 7: Lack of Public Understanding of Prescribed Fire and WVDOF participation in the "Fire Learning Network”
The Fire Learning Network (FLN) was launched in 2002 as a joint national effort among The Nature Conservancy (TNC), the USDA Forest Service, and the US Department of Interior. The national network is currently organized into eight regional networks, including the Appalachian network. The overall goal of the network is to implement ecologically based and culturally acceptable fuels reduction and fire restoration programs in order to restore natural landscapes that depend upon fire in order to sustain native plants and animals.
The Appalachian region is characterized by rolling and mountainous terrain blanketed in hardwood and mixed-pine hardwood forests, pine-oak-heath shrublands and woodlands, small-patch grasslands, hillside prairies and cedar glades, and is home to numerous endemic species. The area contains both fire-adapted and fire-dependent species, with lightning-caused fires historically playing a role in establishing and maintaining the forest communities and species. This natural need for fire strongly suggests that ecological fire management should be a strategy in restoration efforts. Thus, the Appalachian Fire Learning Network engages multiple federal, state, and private land management organizations in a collaborative effort to implement ecological fire management.
Within this biologically diverse Appalachian region, the FLN seeks to:
• Collaborate with stakeholders to strengthen the scientific basis for landscape-scale fire management, and develop landscape-scale desired future conditions and fire management objectives for the Central, Southern and Western Appalachian Regions;
• Transfer knowledge and lessons learned throughout the FLN to facilitate ecological objective setting, effective stakeholder engagement, efficient compliance with regulatory requirements, and successful funding of ecological fire management projects;
• Identify critical barriers to the restoration of fire-adapted ecosystems, and develop strategies to overcome these barriers; and
• Achieve tangible and measurable progress in the restoration of fire-adapted ecosystems at demonstration sites throughout the FLN.

West Virginia Statewide Forest Resource Assessment 2010
242 Issues, Sub-Issues, and Priority Area Identification – Issue 5: Wildfire Management
The WVDOF intends to participate with TNC, The Monongahela National Forest, and the other organizations and agencies in a manner appropriate to fulfill its role in the Appalachian Fire Learning Network. Map 5.22 shows the regional FLN general locations across the country, including the Appalachian FLN shown in dark green along the Virginia / West Virginia border. Map 5.23 shows details of the West Virginia and Allegheny Highlands FLN.
Map 5.22: Locations of designated Fire Learning Network areas in the United States (Fisher, 2010).

West Virginia Statewide Forest Resource Assessment 2010
Issues, Sub-Issues, and Priority Area Identification – Issue 5: Wildfire Management 243
Map 5.23: Locations of Allegheny Highlands and West Virginia designated Fire Learning Network areas (Fisher, 2010).