western cape provincial profile - elsenburg · 1 western cape provincial profile: emphasis on...
TRANSCRIPT

WESTERN CAPE PROVINCIAL PROFILE
Report: WCPP2014
Date of compilation: August 2014
Compiled by the Agricultural Economic Services: Marketing and Agribusiness

Contents
WESTERN CAPE PROVINCIAL PROFILE: EMPHASIS ON AGRICULTURAL SECTOR ................ 1
POPULATION DEMOGRAPHICS ............................................................................................................ 2
PROVINCIAL EMPLOYMENT AND UNEMPLOYMENT STATUS ............................................................ 2
EDUCATION LEVELS OF AGRICULTURAL SECTOR .............................................................................. 4
PROVINCIAL CONTRIBUTION TO THE NATIONAL ECONOMY .......................................................... 4
MAIN AGRICULTURAL ACTIVITIES IN WESTERN CAPE ........................................................................ 5
PROVINCIAL TRADE STATISTICS ............................................................................................................. 5
Provincial exports .................................................................................................................................. 5
Provincial imports .................................................................................................................................. 7
Provincial total trade balance ........................................................................................................... 9
INFRASTRUCTURE ..................................................................................................................................... 9
Ports 9
National roads ..................................................................................................................................... 10
Airport .................................................................................................................................................... 10
CONCLUSION ........................................................................................................................................ 10
REFERENCES ........................................................................................................................................... 11

1
WESTERN CAPE PROVINCIAL PROFILE: EMPHASIS ON AGRICULTURAL SECTOR
The Western Cape’s agricultural sector is unique from other provinces in South Africa, mostly
in terms of physical resource differences. The winter rainfall region of the Winelands and the
year-round rainfall of the Southern Cape enable a variety of crop mix and production
potential. The Provinces’ agricultural sector is known for its production stability and supported
by well-developed infrastructure for input supply and output processing. It is well-known that
agriculture plays a significant role in the Western Cape economy with a total value-addition
to the economy of R14.7 billion in 2011, and about 23% of the national agricultural value-
addition (Vink & Tregurtha, 2001).
This report will seek to highlight the Western Cape provincial profile with the emphasis on the
agricultural sector and how it fits into the greater economy. The Western Cape Province is
the 4th largest province in South Africa in terms of its land area which amounts to 12,938,600
hectares. The area consist of 11,560,609 hectares (89.3%) of farm land, 2,454,788 hectares
(19%) potentially arable land, 9,105,821 hectares (70.4%) grazing, 730,731 hectares (5.6%)
nature conservation, 198,938 hectares (1.5%) forestry and 448,322 (3.5%) other (DAFF, 2014;
Stats SA, 2012).
There are five district municipalities in the Western Cape namely; Cape Winelands, Central
Karoo, Eden, Overberg and the West Coast as well as Cape Metropole (City of Cape Town),
which is the only metropole situated in the Province, refer to figure 1.
Figure 1: Western Cape Municipalities. Source: WC DoA, 2014.

2
POPULATION DEMOGRAPHICS
The latest population total for the Western Cape by Statistics South Africa (Stats SA)
amounted to 6,082,849 people in 2014, with a working population of 4,149,922 individuals
(68% aged between 15 and 64 years). Table 1 below gives the population numbers of each
age group.
The age demographic categories for the Western Cape population are as follows:
AGE CATEGORY PERCENTAGE
0-14 years of age 26.03%
15-34 years of age 33.93%,
35-64 years of age 34.29%
65 years and older 5.74%
Table 1: Age demographic of the provincial population. Source: Stats SA, 2014b.
In terms of racial breakdown the
majority of individuals in the Western
Cape are Coloured (3,174,269),
followed by Black (1,796,247), White
(1,071,087) and Indian (41,246).
Figure 2: Western Cape population by race. Source: Stats SA, 2014b.
PROVINCIAL EMPLOYMENT AND UNEMPLOYMENT STATUS
The working population increased by 91,000 people y/y in the first quarter of 2014, which is
2.2% higher than the same period in the previous year. The total number of people employed
in the Western Cape amounted to 2,237,000 (7% or 146,000 increase y/y) in the first quarter of
2014 and the total unemployed people for the same period amounted to 593,000 (5.5%
decrease y/y). The 1unemployment rate in the first quarter of 2014 is at 20.9%, which is a 2.2%
decrease y/y, with an 2expanded unemployment rate of 22.8%. The total 3 labour force
participation rate is 68.10%, which is an increase of 1.2 % y/y (Stats SA, 2014d).
1 Unemployment rate: proportion of working force which is unemployed and are still looking for a job.
2 Expanded unemployment rate: proportion of unemployed persons including discouraged job-seekers
and non-economically active people. 3 Labour force participation rate: portion of working-age population that is either employed or
unemployed.
African
Black
29%
Coloured
52%
Indian/Asian
1%
White
18%
Western Cape population race profile

3
Figure 3: Western Cape employment by sector. Source: Stats SA, 2014d.
The Western Cape agricultural sector achieved a much higher absorption rate if compared
to the national average of 7.2% for the agricultural sector as indicated by Stats SA. The
Western Cape employed 23% of the total national agricultural workforce, which is the largest
in relation to other provinces. This could be a direct result of the labour intensive agricultural
industries such as the horticultural industry in the Western Cape for permanent as well as
seasonal labour.
Figure 4, below provides an
illustration of the national and
provincial absorption by the
agricultural sector; the share
of the Western Cape could
be a direct result of
seasonality’s of the
respective commodities
produced in the Western
Cape.
Figure 4: National and provincial agricultural employment absorption for Quarter 1:2008 to Quarter 1 of
2014. Source: Stats SA, 2008-13 & 2014d.
2008 2009 2010 2011 2012 2013
Community and social services 324752 351050 366197 377484 384613 394448
Finance and business 245769 260058 252046 273675 288182 315339
Trade 389753 401819 383482 399128 386785 416357
Construction 177429 172427 142010 128876 138101 142251
Manufacturing 318320 290376 272793 290762 285018 278540
Agriculture 142876 132615 144823 106997 120292 135624
0%
10%
20%
30%
40%
50%
60%
70%
80%
90%
100%
Percentage
per
Industry
Employment by sector within the Western Cape
NATIONAL VS WESTERN CAPE AGRICULTURAL SECTOR EMPLOYMENT

4
Other 1%
Completed tertiary
19%
Completed grade 12
22%
Completed between
grade 1 and 10
53%
No schooling 5%
Education levels of Western Cape agricultural
sector
EDUCATION LEVELS OF AGRICULTURAL SECTOR
As per figure 5, a total of 5% of
the agricultural working
population did not complete
their primary education (Grade
1-12), followed by 22% whom
have completed up to grade
12, 19% completed their
tertiary education and 1% of
the agricultural population is
unaccounted for in 2012.
Figure 5: Education levels of Western Cape agricultural sector. Source: Stats SA, 2012.
PROVINCIAL CONTRIBUTION TO THE NATIONAL ECONOMY
The total economy of the Western Cape, measured by the Gross Domestic Product (GDP)
contribution towards the total national economy was 14.4% in 1997, 14.5% in 2007 and 14.2%
in 2012. Figure 5 shows a relatively stable contribution of the total provincial economy
towards the total national economy over the 15 year period (1997 till 2012).
Figure 6: Provincial GDP contribution towards national GDP - 1997, 2007 and 2012. Source: Stats SA,
2013a.
On the other hand, the provincial contribution of the agricultural sector towards the national
Agriculture, Forestry and Fisheries industries’ GDP amounted to 2.4% in 2013, with a GDP value
of R 72,431 million. The main contribution stems from the activities such as agro value-adding
industries in the Kwa-Zulu Natal province (26.4%) and primary agricultural production (22.6%)
in the Western Cape.

5
MAIN AGRICULTURAL ACTIVITIES IN WESTERN CAPE
Figure 7: Agricultural activity in the Western Cape according to the percentage of commercial farming
units and hectares per grouping. Source: DAFF, 2014.
The total agricultural production is categorised in different activity groupings as indicated in
figure 7, which entails:
Field crop production (gross value of production of R51, 783 billion);
Horticulture (gross value of production of R 46,481 billion);
Animal production (gross value of production of R 84,610 billion), and;
Forestry and mixed farming.
4PROVINCIAL TRADE STATISTICS
Provincial exports
The total exported value for the Western Cape amounted to R 74,873 billion for the annual
period ending March 2013 (Quantec, 2014). Table 2 shows the top 10 export 5HS commodity
categories for the province in terms of the highest exported value.
HS Code
Category
HS description of category (2 digit)
WC Exported
Value (Rand) in
2012 (Largest –Smallest)
WC Percentage
of total exports in
terms of value
WC Percentage
growth in export
value (2012-2013)
HS06-14 Vegetable products, including
fruit 21,292,274,969 28% 40.84%
HS16-24 Prepared foodstuffs; beverages,
spirits & vinegar; tobacco &
manufactured tobacco
substitutes 15,652,818,053 21% 19.91%
HS25-27 Mineral products 10,578,092,042 14% 6.17%
4 Data is provided at the 2-digit code level according to the Harmonised System (HS).
5 Harmonised Commodity Description and Coding System: Internationally recognised system of names
and numbers to classify traded commodities.

6
HS84-85 Machinery & mechanical
appliances; electrical
equipment; parts thereof;
sound recorders an
reproducers, television image &
sound recorders & reproducers,
& parts & accessories of such
articles 5,689,728,941 8% 6.35%
HS86-89 Vehicles, aircraft, vessels &
associated transport equipment 5,192,092,604 7% 37%
HS01-05 Live animals, animal products 3,948,331,067 5% 19.06%
HS28-38 Products of the chemical or
allied industries 3,340,875,071 4% 21.85%
HS90-92 Optical, photographic,
cinematographic, measuring,
checking, precision, medical or
surgical instruments &
apparatus; clocks & watches;
musical instruments; parts &
accessories thereof 2,153,111,621 3% -36.12%
HS41-43 Raw hides & skins, leather, fur-
skins & articles thereof; saddlery
& harness; travel goods,
handbags & similar containers;
articles of animal gut (other
than silkworm gut) 1,270,855,861 2% 331.48%
HS72-83 Base metals & articles of base
metal 1,198,235,748 2% 6.37%
Table 2: Provincial top 10 exports by value. Source: Quantec, 2014.
The major agricultural products exported are highlighted per HS 2-digit level category, consist
of;
The live animal and animal products (HS code 01-05) exports consist of 0.1% live
animals, 0.8% meat and edible meat offal, 19.5% fish, crustaceans, molluscs, aquatic
invertebrates and 0.4% products from animal origin.
The vegetable products (HS code 06-14) exports consist mainly of edible fruit, nuts,
peel of citrus and melon which are 84% of the HS. In this category, the main export
products are citrus fruit (fresh and dried) at 36.8%, pome fruit (apples, pears and
quinces) at 31.2%, grape (fresh and dried) at 22.5% and stone fruit (apricots, cherries,
plum, apricots and nectarines) at 5.7% according to the total export value. From 2012
to 2013 there has been a 613% growth in the value of exported nuts.
Prepared foodstuffs; beverages, spirits & vinegar; tobacco & manufactured tobacco
substitutes (HS code 16-24) exports mainly consist of meat, fish and seafood
preparations (3.6%), vegetable, fruit and nut food preparations (16.6%), beverages,
spirits and vinegar (53.2%) accompanied by a 35.9% growth y/y between 2012 and
2013 and tobacco ad manufactured tobacco substitutes (7.4%).

7
Figure 8: Top 10 agricultural products exported in 2013 from the Western Cape Province. Source:
Quantec, 2014.
Provincial imports
The total imported value for the Western Cape amounted to R 186,572 billion for the annual
period ending March 2013. Table 3, shows the top 10 import HS commodity categories for the
province in terms of the highest imported value.
HS code
categories
HS description of category (2 digit)
Imported Value
(Rand) in 2012 (Largest –Smallest)
WC Percentage of
total exports in
terms of value
WC Percentage
growth in export
value (2012-2013)
HS25-27 Mineral products 100,909,871,132 54% 17%
HS84-85 Machinery & mechanical
appliances; electrical equipment;
parts thereof; sound recorders an
reproducers, television image &
sound recorders & reproducers, &
parts & accessories of such articles
21,316,144,962 11% 68%
HS16-24 Prepared foodstuffs; beverages,
spirits & vinegar; tobacco &
manufactured tobacco substitutes
10,348,565,391 6% 10%
HS50-63 Textiles & textile articles 9,880,902,442 5% 18%
HS28-38 Products of the chemical or allied
industries
8,278,291,463 4% -9%
HS72-83 Base metals & articles of base
metal
5,279,629,676 3% 54%
HS39-40 Plastics & articles thereof; rubber &
articles thereof
5,049,261,077 3% 25%
HS64-67 Footwear, headgear, umbrellas, sun
umbrellas, walking-sticks, seat-sticks,
whips, riding-crops & parts thereof;
prepared feathers & articles made
therewith; artificial flowers; articles
of human hair
3,577,456,191 2% 2%
96 Miscellaneous manufactured
articles
3,552,318,534 2% 18%
HS06-14 Vegetable products
(including fruit)
3,078,347,839 2% 5%
Table 3: Provincial top 10 imports in terms of value. Source: Quantec, 2014.
8
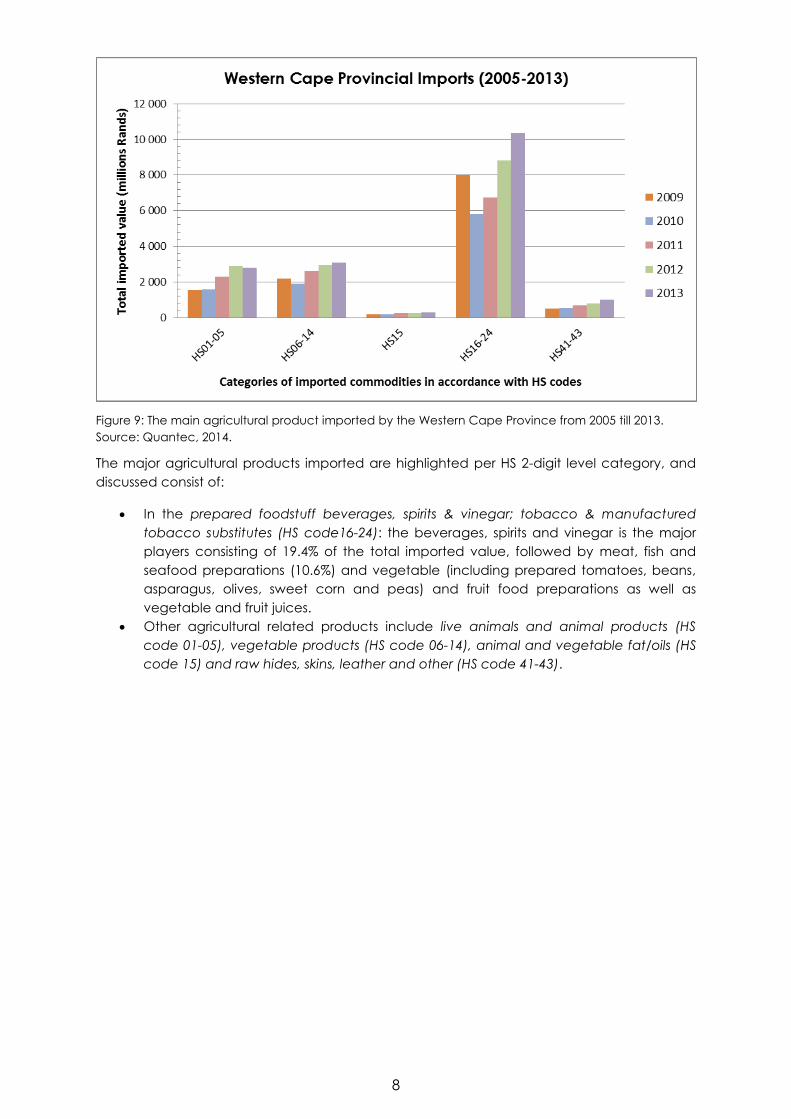
Figure 9: The main agricultural product imported by the Western Cape Province from 2005 till 2013.
Source: Quantec, 2014.
The major agricultural products imported are highlighted per HS 2-digit level category, and
discussed consist of:
In the prepared foodstuff beverages, spirits & vinegar; tobacco & manufactured
tobacco substitutes (HS code16-24): the beverages, spirits and vinegar is the major
players consisting of 19.4% of the total imported value, followed by meat, fish and
seafood preparations (10.6%) and vegetable (including prepared tomatoes, beans,
asparagus, olives, sweet corn and peas) and fruit food preparations as well as
vegetable and fruit juices.
Other agricultural related products include live animals and animal products (HS
code 01-05), vegetable products (HS code 06-14), animal and vegetable fat/oils (HS
code 15) and raw hides, skins, leather and other (HS code 41-43).
9
Provincial total trade balance
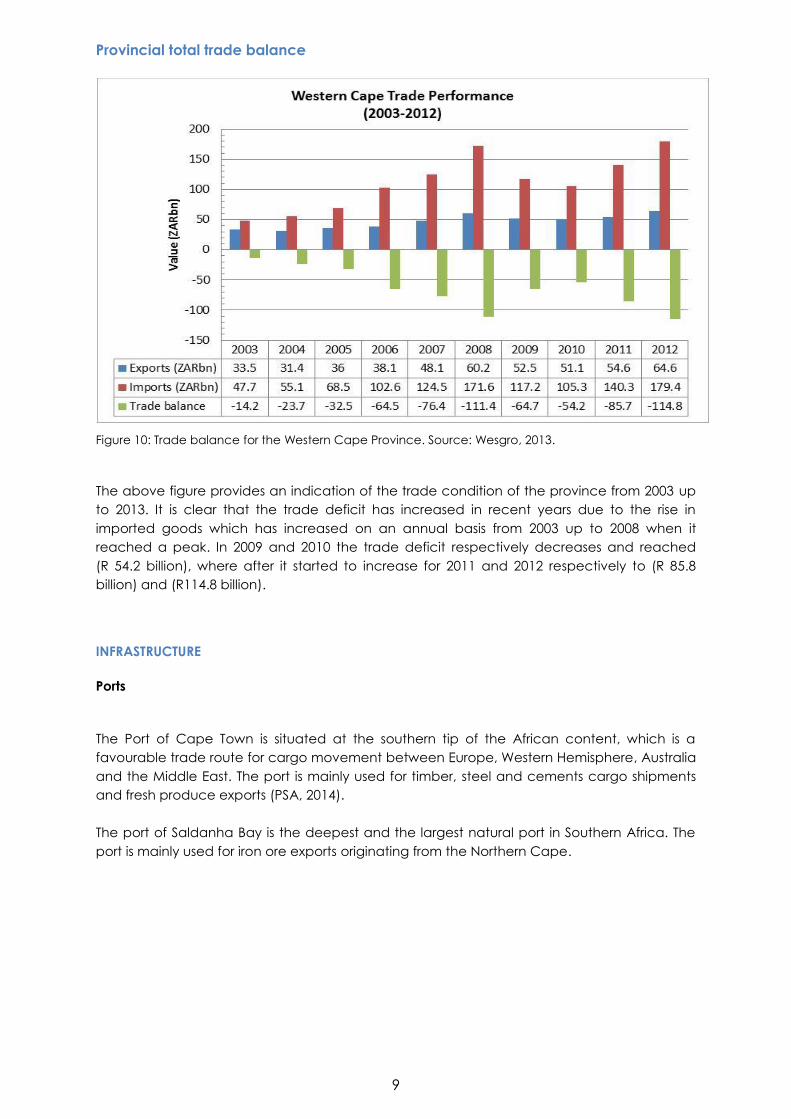
Figure 10: Trade balance for the Western Cape Province. Source: Wesgro, 2013.
The above figure provides an indication of the trade condition of the province from 2003 up
to 2013. It is clear that the trade deficit has increased in recent years due to the rise in
imported goods which has increased on an annual basis from 2003 up to 2008 when it
reached a peak. In 2009 and 2010 the trade deficit respectively decreases and reached
(R 54.2 billion), where after it started to increase for 2011 and 2012 respectively to (R 85.8
billion) and (R114.8 billion).
INFRASTRUCTURE
Ports
The Port of Cape Town is situated at the southern tip of the African content, which is a
favourable trade route for cargo movement between Europe, Western Hemisphere, Australia
and the Middle East. The port is mainly used for timber, steel and cements cargo shipments
and fresh produce exports (PSA, 2014).
The port of Saldanha Bay is the deepest and the largest natural port in Southern Africa. The
port is mainly used for iron ore exports originating from the Northern Cape.

10
National roads
Figure 11: Indication of national roads connection from the Western Cape Province. Source: SA-
venues.com, 2014.
The main national roads that interlink with the Western Cape are the N1 which tied-in from
Cape Town via Bloemfontein up till Gauteng. The N2 runs from Cape Town via the coastal
towns of East London, Durban and Kwa-Zulu Natal which intersects at Gauteng. The N12
evolve at George (the garden route) via Kimberley to Gauteng. The N7 connects Cape
Town with Namibia via the Northern Cape towns such as Springbok and Vanrhynsdorp.
Airport
Cape Town International airport is South Africa’s second largest international airport,
equipped with an upgraded cargo division (ACSA, 2013).
CONCLUSION
The Western Cape agricultural sector plays a vital role in the economic activity of the
collective economic growth of South Africa. Not only does the sector absorb and create
much needed employment, but it also ensures that South Africa maintains its food security
status in that agricultural food production is maintained in most agricultural categories to
ensure that South African citizens have the necessary food basket items to have a long and
healthy prosperous life.
The province is an important trade destination, as it is favourably located to act as a trade
platform for developed and developing markets of high-value commodities, which results in
favourable foreign direct investment into our shores.

11
The Western Cape is the pillar of various agro-commodities, which stems from fruit, wine,
meat, grain, vegetables and much more – thus we could almost reiterate that we almost
produce the whole food basket.
REFERENCES
ACSA (2013). Latest news: 29 October 2013. Available from http://www.acsa.co.za. Airports
Company of South Africa.
DAFF (2013). Agricultural Statistical Abstract (2013). Available from www.daff.gov.za.
Department of Agriculture, Forestry & Fisheries.
DAFF (2014). Agricultural Statistical Abstract (2014). Available from www.daff.gov.za.
Department of Agriculture, Forestry & Fisheries.
N.Vink & N. Tregurtha (2007). Agriculture and Mariculture First Paper: structure, Performance
and Future Prospects – an overview. Available from www.westerncapegovernment.gov.za .
PSA (2014). Cape Town Harbour information. Available from http://www.ports.co.za/cape-
town.php. Port South Africa.
Quantec (2014). Regional International Trade Data by Province: Western Cape Annual (2012-
2013). Available from www.quantec.co.za. Quantec Easy Data.
SA Venues (2014). SA national roads infrastructure. Available from www.sa-
venues.com/Home/SAMaps.
Stats SA (2007). Census of Commercial Agricultural, 2007: Financial and production statistics
(2007). Available from www.statssa.gov.za. Statistics South Africa.
Stats SA (2011). Agricultural Household Census (2011). Available from www.statssa.gov.za .
Statistics South Africa.
Stats SA (2012). South African Statistics, 2012. Available from www.statssa.gov.za . Statistics
South Africa.
Stats SA (2013a). Statistics SA GDP report (2013). Available from www.statssa.gov.za. Statistics
South Africa.
Stats SA (2013b). Statistics SA Quarterly Labour Force Survey (2013). Available from
www.statssa.gov.za. Statistics South Africa.
Stats SA (2014a). Statistics SA GDP report (2014). Available from www.statssa.gov.za. Statistics
South Africa.
Stats SA (2014b). Statistics SA Mid-year population estimates, 2013. Available from
www.statssa.gov.za. Statistics South Africa.
Stats SA (2014c). Statistics SA Quarterly Labour Force Survey (2008-2013). Available from
www.statssa.gov.za. Statistics South Africa.
Stats SA (2014d). Statistics SA Quarterly Labour Force Survey: Quarter 2 (2014). Available from
www.statssa.gov.za. Statistics South Africa.
WC DoA (2014). Geographical Information System: Map Search (2014). Available from
www.elsenburg.com/gis. Western Cape Department of Agriculture: Research and
Development Technology Services, Elsenburg.
Wesgro (2012). Western Cape Trade (2012). Available from www.wesgro.co.za . Western
Cape Investment and Trade and Promotion Agency.
12
Acknowledgement of contributions made by:
Carine van Zyl, Jacques Murdoch & Louw Pienaar
For more information contact:
The Western Cape Department of Agriculture
Programme: Agricultural Economic Services
Division: Marketing and Agribusiness
Tel: 021 808 5189 or alternatively 021 808 5193
Fax: 021 808 5210
E-mail: [email protected]
DISCLAIMER:
This document and its contents have been compiled by the Department of Agriculture,
Western Cape. The views expressed in this document are those of the Department of
Agriculture with regard to vegetable market information in the province, unless otherwise
stated. Anyone who uses this information does so at his/her own risk. The Department of
Agriculture or the author(s) therefore accepts no liability for losses incurred resulting from the
use of this information.