western red cedar shakes and shingles · western red cedar shakes a.nd shingles ieport to the...
TRANSCRIPT

WESTERN RED CEDAR SHAKES A.ND SHINGLES
ieport to the President on nvestigation No. TA-203-18, Jnder Section 203 of the rrade Act of i 974
JSITC PUBLICATION 2131
JCTOBER 1988
nited States International Trade Commission • Washington, DC 20436
'.~ ..

UNITED STATES INTERNATIONAL TRADE COMMISSION
COMMISSIONERS
Anne E. Brunsdale, Acting Chairman Alfred E. Eckes
Seeley G. Lodwick Susan Liebeler David B. Rohr Ronald A. Cass
Staff assigned:
Bruce Cates, Investigator Elizabeth Haines, Investigator
Tom Westcot, Commodity-Industry Analyst Catherine Beyer, Economist
Chand Mehta, Accountant
Judith Czako, Attorney Robert Carpenter, Supervisory Investigator
Address all communications to Kenneth R. Mason, Secretary to the Commission
United States International Trade Commission 'Vashington, DC 20436

C 0 N T E N T S
Summary of advice to the President--------------.------------------------Views of Acting Chairman Anne E. Brunsdale, Commissioner Ronald A Cass,
and Commissioner Susan W. Liebeler-----------~------------·------------
Views of Commissioner Eckes, Commissioner Lodwick, and Commissioner RohrAdditional views of Commissioner Eckes----------------------------------Additional views of Commissioner Rohr----------------------------------~Information obtained in the investigation:
Introduction---------------------------------------------------------Previous Commission investigation-----------------------------------The products:
Description and uses--------------------------------------------Production processes--------------------------------------------U.S. tariff treatment---------------~----------------------------
Nature and extent of current import relief--------------------------The domestic industry:
U.S. producers----------------------~---------------------------
U.S. importers---------------------------------------------------The U.S. market and channels of distribution:
Apparent U.S. consumption---------------------------------------Channels of distribution------------------------------.-----------
Condition of the U.S .. industry--------------------------------------U.S. productiqn-------------------------------------------------Capacity and capacity utilization---------------------~----------U.S. exports-----------------------~-----------------------------
U.S. producers' inventories---~-------------------------~-------U.S. employment-----------..:.-------------------------------------Financial experience of U.S. producers---------------------------
Financial condition and rate of return of U.S. producers----Capital expenditures---------------------~------------------Research and development expenses----------------------------
Efforts b_y U.S. producers to adjust to import· competition- - - - - - - - - - - -Canadian shipments of shakes and shingles---------------------------U.S. imports and market penetration:
U.S. imports------------------------------~----------------------
Market penetration-----------------------------------------------Prices----------------.----------------------------------------------
Price trends-----------------------------------------------------Factors affecting the shake an~ shingle market:
Stumpage prices----------------------------------------------Log prices---------------------------------------------------The supply of western red cedar-----------------------------Housing construction-----------------------------------------
Exchange rates---------------------------------------------------Probable economic effect of terminating import relief:
Major foreign suppliers of shakes and shingles to the United States- - - - -- - - - --- - - -- --- -·- - - - - - - --- - - --- - - - - --- - - - - - - -
Economic analysis of the probable economic effect of terminating or extending import relief-----------~------------------------
Supply and demand conditions-------------------~------------Reduction of the tariff from 35 percent to 20 percent-------Termination of import relief-----------------------~---------
Considerations under section 202(c) of the Trade Act of 1974-----
Page 1
5 33 43 45
A-1 A-1
A-2 A-4 A-4 A-5
A-5 A-6
A-6 A-8 A-9
A-10 A-10 A-11 A-11 A-11 A-14 A-16 A-18 A-18 A-18 A-21
A-22 A-22 A-24 A-25
A-26 A-27. A-30 A-31 A-32
A-34
A~34
A-35 A-37 A-38 A-39

Appendix A.
Appendix B. Appendix C. Appendix D.
ii
Contents
Presidential proclamation 5498, May 26, 1986, Presidential memorandum, and request from the United States Trade Representative-------------------------------------- A-47
The Commission's Federal Register notice-------------------- A-53 List of witnesses------------------------------------------- A-57 Semiannual trade data--------------------------------------- A-61
Tables
1. Western red cedar shakes and shingles: U.S. production, exports of domestic merchandise, imports for consumption, and apparent consumption, 1985-87, January-June 1987, and January-June 1988---- A-7
2. Wood shakes and shingles: U.S. exports of domestic merchandise, by principal ~arkets, 1985-87, January-June 1987, and January-June 1988------------------------------------------------- A-12
3. Western red cedar shakes and shingles: U.S. production and related wor.kers, hours worked, and wages and total compensation paid, 1985-87, January-June 1987, and January-June 1988----------------- A-14
4. Income-and-loss experience of U.S. producers on their operations producing western red cedar shakes and shingles, accounting years 1985~87, and interim periods ended Mar. 31, 1987, and Mar. 31, 1988----------------------------------------------------- A-15
5. Selected financial information of U.S. producers on their operations producing western red cedar shakes and shingles, accounting years 1985-87, and interim periods ended Mar. 31, 1987, and Mar. 31, 1988----------------------------------------------------- A-17
6. Wood shakes and shingles: U.S. imports for consumption, from Canada and all other sources, by types of wood, 1985-87, January-June 1987, and January-June 1988--------------~~---------- A-23
7. Western red cedar shakes and shingles: Shares of U.S. consumption supplied by U.S. production and·u.s. imports, 1985-87, January-June 1987, and January-June 1988-------------------------- A-24
8. Published prices of western red. cedar shakes and shingles sold in the United States, net f.o.b. mill, by quarters, January 1985-June 1988--------------------------------------------------------- A-26
9. Average prices of cedar stumpage sold by the U.S. Forest Service, by quarters, January 1985-June 1988------------------------------- A-28
10. Composite U.S. prices for western red cedar shakes and shingies and prices of western red cedar logs sold in British Columbia, by quarters, January 1985-June 1988---------------------------------- A-30
11. U.S. prices of western red cedar shakes and shingles and new one-unit housing started in the western region of the United States, by quarters, January 1985-June 1988---------------- A-32
12. U.S.-Canadian exchange rates: Nominal exchange rates of the Canadian dollar in U.S. dollars,_real exchange-rate equivalents, and producer price indicators in the United States and Canada, indexed by quarters, January 1985-June 1988----------------------- A-33

iii
Contents
Tables--Continued
13. Estimated effects of reducing the 35 percent tariff on red cedar shakes and shingles to 20 percent--------------------------- A-37
14. Estimated effects of terminating the 35 percent tariff on red cedar shakes and shingles------------------------------------- A-38
15. Adjustment assistance paid to workers in the shake and shingle industry, 1979-85------------------------------------------------- A-39
16. Estimated effects on consumers of reducing the 35 percent tariff on red cedar shakes and shingles to 20 percent----------------------- A-41
17. Estimated effects on consumers of removing the 35 percent tariff on red cedar shakes and shingles------------------------------------- A-42
18. Canadian retaliatory tariffs---------------------------------------- A-43 19. Number of firms and workers engaged in production of western red
cedar shakes and shingles, i980-87-------------------------------- A-45
D-1. Western red· cedar shakes and shingles: Semiannual U.S. production, exports of domestic merchandise, imports for consumption, and apparent consumpt.ion, January 1985-June 1988- - - - - - - - - - - - - - - - - - - - - - A-62
Note.--Information that would reveal confidential operations of individual concerns may not be published and therefore has been deleted from this report. Such deletions are indicated by asterisks.


UNITED STATES INTERNATIONAL TRADE COMMISSION October 6, 1988
REPORT TO THE PRESIDENT ON INVESTIGATION NO. TA-203-18
WESTERN RED CEDAR SHAKES AND SHINGLES
In accordance with sec~ion 203(i)(2) of the Trade Act of 1974 (19 U.S.C.
2253(i)(2)), the United States International Trade Commission herein reports
the results of an investigation concerning western red cedar shakes and
shingles.
Summary of advice of the Commission
Acting Chairman Brunsdale, Commissioner Liebeler; and Commissioner Cass
advise the President that import relief has had some favorable impact on the
•economic condition of the domestic western red cedar shake and shingle
industry. However, the underlying competitive position of the domestic
industry has not improved over the period of import relief. The primary
beneficiaries of the relief have been the producers of red cedar logs used in
the production of shakes and shingles. While the domestic industry would
suffer some injury from the elimination of the tariff as opposed to its
reduction to 20 percent, consumers of housing and those U.S. industries whose
exports were subject to retaliation from Canada would benefit. There is no
reason to believe that the continuation of import relief would result in
adjustments that will enhance the competitiveness of the domestic industry.
· Commissioner Eckes advises the President that termination of the import
relief program presently in effect with respect to shakes and shingles of
western red cedar would have an adverse effect on the industry producing
shakes and shingles of western red cedar.

2
Commissioner Lodwick advises the President that the termination of relief
would have the following economic effects on the U.S. western red cedar shake
and shingle industry: 1) a decrease in U.S. western red cedar shake and
shingle production, productive capacity, and capacity utilization; 2) a loss
of market share, employment, and a decline in total wages paid; and 3) a drop
in ~ales, net income, and prices received. U.S. western red cedar shake and
shingle producers have made or planned to make the following efforts to adjust
to import competition: 1) built new mills and relocated production
facilities, 2) upgraded production equipment, 3) planned to build shake and
shingle treatment plants to increase product value, and 4) helped fund
research efforts to develop treated shake and shingle products from other.
types of wood in an effort to cope with the declining supply of red cedar.
Commissioner Rohr advises the President to continue his program of import
relief to the domestic western red cedar shake and shingle industry. The U.S.
industry has made reasonable progress toward adjusting to import competition
since the import relief was granted 28 months ~go. The probable effect of
terminating relief at this time would be very detrimental to the domestic
industry. The program of gradual reduction in the tariff as set forth by the
President will allow the industry to make a smoother adjustment to import
competition. He also suggests that the U.S. Trade Representative request the.
Commission to annually review the progress the industry is making under the
reduced tariff.
Background
The Commission instituted this investigation effective July l, 1988,
following receipt of a request from the United States Trade Representative,
that the Commission institute an investigation in order that it might advise

3
the President of its judgment as to the probable economic effect on the
domestic western red cedar shake and shingle industry of the termination of
the import relief provided to the industry by Presidential Proclamation 5498.
Public notice of the investigation and hearing was given by posting copies of
the notice at the office of the Secretary, U.S. International Trade
C9mmission, Washington, DC, and by publishing the notice in the Federal
Register of July 20, 1988 (53 F.R. 27410). A public hearing was held in
connection with this investigation on August 16, 1988, in Washington, DC. All
interested persons were afforded an opportunity to be present, to present
evid~nce, and to be heard.


5
REPORT TO THE PRESIDENT
concerning
WESTERN RED CEDAR SHAKES AND SHINGLES
USITC Inv. No. TA-203-18
Views of
ACTING .CHAIRMAN ANNE E; BRUNSDALE; COMMISSIONER RONALD A. CASS, ,AND COMM~SSIONER SUSAN W. LIEBELER
The Commission has been asked by the United States Trade
Representative (USTR) to advise the President of the probable
economic effects of termination on December 7, 1988, of
import relief to the domestic western red cedar shake and
shingle industry.1/ Import relief in the form of a 35
percent ad valorem duty on imports of red cedar wood shakes
and shingles has been provided for the past two years.l/
Under the terms of that grant of relief, if relief ·is not
terminated on December 7 the duty on red cedar shakes and
·shingles will decline to 20 percent ad valorem on that date
and to·8 percent.two years thereafter. All relief would
terminate on June 7, 1991., and the duty rate will rev~rt to
1/ See Letter from the United States Trade Representative to Chairman Alfred Eckes dated June 29, 1988, reprinted at A-51 of Report.
ll Relief was granted to the United States western red cedar shakes and shingles industry pursuant to Section 202(b) (1) (1~ u.s.c. § 2252(b) (1)) on May 23, 1986. Memorandum from the President to the Unit~d States Trade Representative of May .23, 1986, r~printed at 51 Fed. Reg. 19157 (1986), Report at A-50.
6
zero. Our examination of the probable-economic effects of
termination of import relief ··as of December· 7, 1988, must
compare the effects of the.20.percent tariff (and subsequent
8 percent tariff),·. not the· 35 percent duty that has been in
effect, with the abserice·of any dtlty.
our evaluation of the effects of terminating relief is
governed by Section.203(i) (4) of the.Trade Act of 1974.J../
That section asks the Commission to consider a number of
sp.ecific factors in advising the President.,1./ These factors
can be organized in four groups: first,. the effects of
terminating or extending import relief on the domestic
industry that benefits from import re·lief, and particularly
the degree to which such relief facilitates adjustment by the
industry to new market conditions;2/ se~ond, the effects -0n
the communities and·other industries that are most closely
associated with the industry seeking or receiving relief ;Q/
third, the effects on American consumers;.1/.and fourth, the
effects· on more general, national and international economic
interests and on industries that are affected· indirectly by
the decision ·to· continue or terminate relief.a/ The third
J../ 19 u.s.c . §. 2253 (i) (2).
.1./ These factors are listed in 19 u.s.c. 2252 ( c) .
2/ ·19 u.s .c·. § 2252 (c) ·(1)-(3.).
Q/ 19 u.s.c. § 2252 (c) (7), ( 9) .
]_/ 19 u.s.c. § 2252(c) (4).
a1 19 u.s.c. § 2252 (c)(5),(6).

7
consideration, effects on American consumers, unambiguously
supports termination of the import relief in the instant
investigation, while factors in the other three groups yi~ld
less clear direction.
Following are the conclusions, detailed more fully
below,· concerning the effect$ of terminating or continuing
import relief according to the Presidential Proclamation of
May 23, 1986.
Domestic industry: Terminating .the relief will have
~n adverse effect on the U.S. western red cedar shake
and shingle industry, but continuing the relief will not
significantly advance adjustment by that industry. Very
little has been done by the industry over the past two
years and very little can be done to adjust to imports
without a·change in the availability of old-growth red
cedar logs, the underlying physical input-to red cedar
shakes and shingles.
The domestic industry producing red cedar shakes
and shingles has received only a small part of the
benefits of the import relief program. These benefits
have been captured principally by timber owners and,
perhaps less so, the producers of the red cedar logs
used in the manufacture of shakes and shingles~
According to Petitioner's data, 80 percent of the price
increase in shakes and shingles experienced since
tariffs were imposed has been reflected in higher log
8
prices. We believe th~~ any decrease in shake and
shingle prices resulting from the termination of
prot~ction would be passed through to log producers and
timber owners to a similar extent. Thus, the shake and
shingle industry that was judged by the Commission to
have been seriously injured by increased imports, has
not been the primary beneficiary of import relief and
will not be the primary loser if relief is t~rminated.
Associated· industries and communities: _ The. production
of red cedar shak~s and shingles is lar~ely concentrated
in two states, Washington and Oregon, but the industry
is relatively small, in terms of total employment,
profits, gross earnings, and scale of individual plants.
Consequently, the adverse effect on the industry is not
-likely to have any substantial adverse impact on the
communities in th9se states in which shake and shingle
production now occurs. Further, the adverse effects on
the domestic red c~dar shake and shingle industry should
not have any secondary adverse effects on other United
States industries and, indeed, may have beneficial
effects on r~lated industries.
Consumers: American consumers undeniably would
benefit from: the termination of import relief•.
Imposition of a duty on imported red cedar shakes and
shingles has resulted in increased costs for home buyers
and homeqwners who purchase these products.

9
General economic interests: Elimination of the tariff
also should promote our overall national and
international economic interests. If our imposition of
dutie;; on red· cedar shake and shingle imports had no -
effects on the behavior of other national governments,
this conclusion probably would not hold, as the duties
earn revenues for the Unit.ed States government that are
significant in relation t6 the other effects ~onsidered
here. The Canadian government, howeve~. has imposed
retaliatory duties on a large number of U.S. exports.
While we have no di~ect estimate of the effects of these
duties at this time, they clearly impose costs on
unre1ated American businesses. Given the manner in
which such retaliatory duties are assessed, there is
reason to believe that such duties largely offset any
positive effects of import relief in this instance.
There also ~s reason to believe that termination of
import relief may facilitate cooperative implementation
of the u.s:-canada Free Trade Area Agreement, even
though this relationship can only be a subject for
speculation.

10
I; Effects on .U. S:: Re.a Cedar. Sh~ke. and Shingle Jndustry
A. Market Considerations ..
Appreciation of the effects on the domestic red ~ . . . '
cedar. shake and shingle industry of continuing or terminating ' . . ,.
import relief plainly requires an.understanding of the nature
of the industry, the market for _its products •. and_the import
competition it would ~ace i.n the absenc~ of such r~lief. Red
ceda,r shakes and _shingles ar~ _used .. fqr ~oofing or stding,
principally in relatively expensive resi,dential housing.14/
The particular.properties that.give these products their
value for such uses -- their ~eathering, insectTresistance,
aesthetic, and nail~holding c~aracteristics ~~ primarily
derive from the wood from which they are.made,: old-growth red
cedar . .12/ Such cedar is .from trees apprqximately 200 or more
years old. Red cedar f_rom younger trees does not . duplicate
th~ advantageous characteristics of old-growth red cedar, and
to date no other wood has been found tha~. duplicates these
properties, eithe~ in its natural condition or as treated by
practicable chemical (or other) processes . .l.Q./
ill Report of the Commission (the "Report") at A-8, A-36.
12/ Wesley Rickard, Inc., "Update: The Western Red Cedar Timber Resource in the United States as it Relates to United States Production of Shakes and Shingles," (Preliminary), July 1988 ("Wesley Rickard"), at 2.
ill Tr. at 9, 14; Wesley Rickard at 2.
11
Several implications follow. For one, the supply of red
cedar shakes and shingles is closely tied to the availability
of the wood. As the inventory of old-growth cedar has been
depleted, much more so in the United States than in western
Canada, the availability of the wood has been increasingly
influenced by factors affecting the logging of more plentiful
and commercially important trees among which remaining old-
growth red cedar trees are interspersed . .11./ Second, the
consumer demand for cedar shakes and shingles is relatively
unaffected by price. Certainly, .substitute products -
asphalt-shir_igle roofs, ceramic tile roofs, slate roofs, or
other. wood siding,. for examples -- are ava·ilable, but the
characteristics of these substitutes are only generally
congruent with those of red cedar shakes and shingles.
Moreover, the fact that shakes and shingles represent a
relatively small part of the "package" in which they often
are purchased (a house), also reduces the.degree of consumer
price sensitivity.J...a/ Finally, as a "natural" product that
requires primarily splitting or sawing but little else and
that is.produced from a raw product supply that is quite
limited relative to many other woods, the scale of prod~ction
l]_/ Wesley Rickard at 8, 17.
1..a/ USITC Office of Economics, "Final Discussion of .Elasticities for Wood Shakes and Shingles, In~~ No. TA-203-18", Memo No. EC-L-329 (September 27, 1988) ("Elasticities Memo").

12
tends to be small and the capital investment necessary to
enter .the industry small . .12./
The cost of production 6f red cedar shakes ~nd·shingles
appears to be affected by three critical factors: the price
(and certainty of supply) of old-growth red cedar logs, the
efficiency of the sawing and splitting equipment, and the
skill and cost of the workforce. It appears that the
equipment suited to red cedar shake and shingle produ.ction
also is suited to production of oth~r wood productsr making
entry into and exit from this i~dustry less costly than would
otherwise be the case. As for the third factdr, ~he
workforce for red cedar shake and shingle production does not
appear to be highly specialized. Labor for this production,
hence, generally is both hired and laid off relatively
quickly as· the level of production varies.
B. Ta~iff Effects on Domestic Industry
The effects of the tariff, and of terminating the
tariff, on the U.S. red cedar shake and shingle industry
follow from the market characteristics described above:
Critically, the primary effect of a tariff is to increase the
price of red cedar shakes and shingles sold in the United
States and not to increase domestic production of shakes and
shingles. Due to the limited supply of cedar logs, the
volume of production is relatively unresponsive to the
19/ Report at A-4.

13
.tariff .. Higher shake and shingle prices lead to higher cedar
log prices as producers bid against each other for the
essential raw material. For this reason, log producers and
timber owners capture most of the benefits stemming from the
. tariff ..
The starting point is the tariff's effect on the foreign
producers of shakes and shingles. Plainly, the imposition of
a tariff raises the prices charged for imported (Canadian)
shakes and shingles. For several reasons, however, this
price increase does not dramatically affect the quantity of
shakes and shingles imported.
First, the change in price should not sign~ficantly
affect foreign production of shakes and shingles. The
foreign producers will experience a decrease in the net price
paid to them, as the increase in price to consumers comes
from a tax and not a change in demand for the product. This
effective decrease in shake and shingle returns will not
cause a significant reduction in production of shakes and
shingles. Other things equal, the decrease reduces the price
the foreign producers will pay for the inputs to production,
principally red cedar logs, but this will not significantly
decrease the availability of .those logs. Because red cedar
grows intermixed with other species and old-growth red cedar
in particular is only harvested as a by-product of a harvest
of an entire mixed stand of tim}Jer,2.Q./ the harvest of red
20/ Elasticities memo at 4 ..
i4 . .
· .. ·cedar treei.= and the prodiiction 6f ied cedar logs, in both
Canada and··the United-"'States ar~ "not ·very. r.esponsive t~
·.changes· in . the pric"es. that can be obtained for the red cedar
-logs'. . Within a very wide range of prices I the number of red
cedar logs is· only very slightly affected by log prices.
· Al though red cedar logs· have· uses other than production . .
of shakes ·.and shingles, the· decrease in net revenues derived
·from·sales 6f shakes and shitigies may ieduce the prices of
cedar logs.· However, this will not substantially shift uses ' . . .
' . . . . .
of· the logs unless the demand for the other end products is
more sensitive to changes in price than is demand for shakes
and shingles. There is no evidence of that in this
investigation. Nearly the' same amount of old-growth red
cedar should be available for c"a~adian shake and shingle
production with .or without a 20 percent or even 35 percent
tariff.· While there will be some decrease in Canadian
p~oducticin of shakes and shingles, th~ ielaiively small
c:;hange in price and availability of the most important input
to ~uch production will limit the magnitude of. that change.
The division ~f Canadian red cedar shake and shingle . . .
~reduction between th~ United siaie~ ~nd ot~er markets also
is·unlikely to be substantially affected by the tariff . ..
·The United States constituted by far the largest market for '
Canadian red cedar shakes and shingles, accounting for over
80 percent of total Canadian shipments during the period of

15
our investigation.2..1/ While there will be some change in
t.his, the relative unresponsiveness of cons.lliner demand for
these products (in the United States and Canada alike)
restricts the amount of the change.
For the same reasons, altho~gh production of red cedar
shakes and shingles in the United States has_ increased
somewhat since the tariff took effect, it is not clear just
how much of that increase can be attributed to the tariff.
Since the tariff was imposed, prodµction has increased rather
dramatically, reversing a long term decline. Although by
1985 red cedar shake an9 shingle production had f~llen well
below its pre-1980 levels,22/ 1988 production levels were
apout 35 p~~cent higher than 1985 levels.2.]./ Likewise,
employment in the U.S. industry has grown by· over 20 percent
between 1985 and 1987.24/ Hours worked grew by over 40
percent.25/· These are favorable developments for the
industry, probably attributable ·primarily to the grant of
import relief, but some evidence suggests that the increase
in production and employment also'may have been .partly.
attributable to an unrelated increase in the U.S. red cedar
harvest.
2..1/'Elasticities memo at 5.
22/ Wesley Rickard at 16.
23/ Report at A-10.
24/ Report a~ A-11.
25/ Report at A-13.
16 ·.·'
c. Industry Adjustment
The ·~elief·grahted by the President to the w~stern red
cedpr· shake ~nd ·shin~le. industry in 1986 was· intended to
reduce the .burden of adjustment costs on. the parties most
directly a~fected by them. In keeping with the statutory
purpose ''.to facilitate .the orderly adjustment to new ' '
competitive conditions by the industry, 11 26/ the duty imposed
on.red c~dar shak~s and shingles was intended "to enable the
domestic produ.cer~ of' red cedar shakes and shingles to adjust
t:o .tompeti tic;n during· the relief period. 11 27 / In this
proceed~ng, th~ st~tute and USTR's request instruct the·
commission to. take into account 11 the progress and specific
efforts.made.by· the industry concerned to adjust to import
competition."2.a/
There_ is little evidence that continuation of the duty
is u~eful to industry adjustment. One datum is the
e~peri.ence of the industry with adjustment assistance.22./
Prior. ~o ~he' tariff~ ~hen the domestic industry was clearly
in d~clin~; som~ 2.066 ·employees applied for certification
2 6 / 19 u . s . c ~ § 2 2 5 3 ,( a) . ' . . .
27 I M.e.morandum from the President to the United States Trade Representative 'dated May 23, 1986, reprinted at 51 Fed. Reg. 191°57 '(19~6)'.'
201 19 u~s.c.· § 22s3Ci) C4)_. . .
29/ Section 202(c) (1) directs that consideration be given to "information and advice from ·the Secretary of ·Labor on the eit~nt to whith.wo~kers in.the industry have applied for, are ieceiving, or ~re likely.to receive adjustment assistance under. ·chapter 2. or benefits from other manpower programs."

17
for adjustment assistance between 1979 and 1985, and 1,024
were certified . ..lQ./ Since the imposition of the tariff, use of
worker adjustment assistance has declined dramatically.
Between June 30, 1985 and February 6, 1988, 162 workers
applied for certification, and all were certified . .11/ The
experience with adjustment assistance for firms has been
similar.12./ Between 1980 and 1985, 30 of 31 red cedar shake
and-shingle firms that petitioned the Commerce Department for
adjustment assistance were certified; since 1985 not a single
firm has been certified.11./
The industry has experienced greater profitability of
late, partly as a result of import relief, and has·used that
prbf itability to invest in equipment that expands capacity
and arguably increases efficiency. Production capa~itY of
U.S. mills has grown by nearly 13 percent between 1985 and
·1987 . .11_/ This is one consequence of a sharp increase_ in
capital expenditures in the industry since the tariff was
imposed. In 1985, capital expenditures by companies in the
..lQ./ Report at A-39.
l.11 Report at A~39.
12.I 19 u.s.c. 2252(c) (2) directs that consideration be given to "information and advice from the Secretary of Commerce on the extent to which firms in the industry have applied for, are receiving, or are likely to receive adjustment assistance under chapters 3 and 4." ,
11.I Report at A-39-40. No firms ever received any direct financial assistance, and financial assistance was discontinued effective April 7, 1986.
34/ Report at A-15.

18
industry report.:i,.ng to the Conunission were $295,000; by 1987,
those companies' investment had more than q·uadrupled, to
$1,430,000. The most conunon "adjustment"·made by producers
was the purchase of additional saws,· including automatic
saws.; some mills have also purchQsed new shingle machines.
Plans for adjustment ·should the relief be extended
reveal an inclination to engage in more purchases of new
equ·ipment, such as automatic saws, splitters, feeders, and
shingle machines. ]2/. Two large shake and shing·le producers
ieported that they would build treatmerit plants shotild th~
relief. be continued.36/ Most of the industry' members
responding to inquiries from the Conunission, however,
indicated that they did not plan further changes.
·Moreover. it is far from clear that -the capacity-
expanding. investments in fact advance the industry's
competitiveness in .any sense. One basis for concern is the
apparent absence of any productivity gains iri this ·industry
over the period of protection. Whether measurad by aggregate
production and employment data, questionnaire data, or
petitioner's data, productivity remained fairly constant
between 1985 and 1988. For example, based on petitioner's
data, productivity was 1.lS thousand Squar~~ per worker in
th~ second half of 1987 and 1;18 thousand in the first half
of 1988. These are virtually unchanged from productivity of
.12/ Report at A-41 . •
J..6./ Id.
19
1.15 thousand squares per worker in the first half of 19?6, . .
immediately prior to the grant of import relief .J.1/ Measured
by questionnaire responses, productivity fell from 1.2
squares per hour in 1985 to 1.1 squares per hour in 1986 and
then rose to 1.2 squares per hour in 1987 . .1.8./
Whatever the effect of the changes made by the domestic
industry over the past few years, further import relief is
unlikely to. facilitate positive adjustment to the long~term
competitive conditions faced by the indus~ry~ While there
may be, as the domestic industry contends,1.2_/ some ability to
alter supplies of red cedar logs fro~ year to year, the
critical factor in the future of this industry is.the rapidly
diminishing quantity of red cedar of suffic~ent age.to be
usable in this industry. One estimate by a respected timber . . ,
products co~sulting fir~ indicates that.the total inventory
in the United States of red cedar has declined by about one-
third since 198040/ ·and that current total supplies will. last
about sixteen more years at the harvest levels of ;980-1985.
Since the t~riff was imposed, production has increase~ .. and
red cedar stands may be depleted even more q~ickly . .4J./.
TI/ See Petitioner's Prehearing Brief at 17 (Table 1) for production data and at 19 (Table 3) for employment data .
.1.8./ See Report at A-14 (Table 3)·.
39/ Petitioner's Post-Hearing Brief at 3.
40/ Wesley Rickard at 7.
ill Id. at 10.

. ·.· .. 20
·.Furthermore:, ·that timber is ever more -dif.ficult. to reach and·
_harvests are ever·l•ss productive. Old growth red cedar
. comprised about.: io percent of total timber harvested in
western.Washington state between 1965 and 1979; since 1980, . . .
. only about· 4· percent of timbe_r has been red cedar of the
requisite age.and_grade.42/ . .
·:Canadian supplies,:_ by.contrast, are much more abundant.
At current harvest.levels, Canadian red cedar timber supplies
. a;re_ es_timat~d to last at least another century. This
disparity is man.ifepted in log t)rices, which since the·
imposition.6f a ban.on the export of logs by the Canadian ....
government have been different each side of the border. The·
domestic industry 9dmit~ there has been a "great disparity"
in red.cedar .log.prices between the two countries.!.J./ This
disparity,_ which presumably would lessen or disappear if
cross,.....border. log• trade were permitted, is evidence of . . . - . . .' ,' .. : .. current Canadian comparative advantage, and of the long run
.posit.ion of. the domestic industry.
oB~iou~l~ the United States can do little to alter the . '
suppl_y. of two-hundred-year-old red cedar timber in the
··west.er~ United States .. At most it can help participants in
~he ind~stry·adjuS~ to the inevitable reduction in the size
ot the indusity and to :identify possible substitute products
42/.Id. at 12~.Red cedar grow·s intermixed with other species, and is only_ harve.sted as a mixed stand of timber is cut.
ill· Pe·t;.i ~ioners' Post-Hearing Brief and· Response to Questions by Commissioners in-Support of Continuing Relief, at 4.

21
for the industry to produce. Yet there is little reason to
believe the tariff protection provided has done that or will
do that.
The domestic industry is pursuing research and
development into techniques for making shake~ and shingles
from other types of wood. The most serious efforts are being
undertaken jointly by the USDA Forest Service and private
indus~ry~ repre~ented by the Northwest Independent Forest
Manufacturers (NIFM). According to testimony at the hearing,
the joint venture is testing the suitability of other woods
for-use as shakes and shingles to replace red cedar44/ and is
hopeful of having a product available for commercial use
sometime after _1991.45/ The parties dispute the
effectiveness of these research projects.46/ 47;·
44/ see Report at A-20 .
.12/ Transcript at 15. Mr. Koeppen of the USDA stated that getting the chemicals registered legally on the market would take longer.
46/ Petitioners are optimistic that they will be able to market treated whitewood shakes and shingles in commercial quantities within two years. -See Petitioners Posthearing Brief at 5. Petitioners claim that the research has been very encouraging, that whitewood species have performed well in laboratory experiments, and that whitewoods will work with the necessary preservatives. Respondents argue forcefully that the whitewoods being tested are not durable enough to put on a roof. See Respondents Posthearing Brief at 7. They note that these woods have problems with splitting and. checking, problems that have not been overcome . .IQ. at 8.
!D...I It should also be remembered that both government and industry research and development projects are typically subject to significant time overruns, (see Marshall and Meckling, "Predictability of the costs, Time, and Success of Development," in The Rate and Direction of Inventive Activity

22
. It is clear ~hat. this rese9,rch eff.Qrt ,. whatever its
prospect for success, is not a response to ·Canadian imports.
Instead, it is needed because of the declining inventory of
U.S. red cedar. o~e ~stimate is that, at current rates of
consumption, the U.S. supply of ted cedar would be exhausted
within ten years .. To date, N~FM pledged $250,000 to this
pro~ect, of which.$166,000 has already _been paid.4_8/ We do
not believe the continuation.of this r~~earch is tied to the
continuation of the tar~f f because the research is central to
the ,industry's ability.to survive the dep~et~on of red cedar
in the:coming years.
II. Effects on Communities and Associated Industries
Although the production of red cedar shakes .and shingles
is largely concentrated in two states, there is little reason
to expect termination of the tariff to have much adverse
.effect on the·economies of those.states. The industryis a
small one. Relative to the economies of the states, total
empl,oyment, profits, and gross earni:r1gs are all quite small .
. .
(1962); M .. Pec.k and F.M. Sch~rer, The Weapons Acquisition Process (1962); E~ Mansfield et.al., .Research and Innovation in the-Modern Corporation, .(1971) Ch. 5), that there are signifi~ant riqks.of.both technical_~l)d commercial failure for R&D projects. (see E. Mansfield eL al-., The Production and 'Application .of New Industrial Technology, .(1977) Ch. 2) I
and that government _efforts .to. develop new ~ommercial products have not been generally successful (see Alexander, "The Right Remedy for R&D Lag,'~ Fortune, ,Janu_ary 25, 1982, p. 60-69.)'. . . .. ' .. --
48/ Tr. at 17 (Statement of Mr. Kuehne.); ~. .

23
Even within the small communities in . whic,~ shake and shingle
mills are located, the impacts are likely to be small. These - . . ..
mills typically are far from the largest employees in their
re spec ti ve localities, and the s.kills and equipment used in
producing red cedar shakes and shingles can be.transferred to
other wood products iri these wood-abundant regions .. - .
Further, the elimination.of the tariff should have
beneficial effects on some related industries. The tariff has
been at least in part responsible for the ~ecent increases in
red cedar log prices, which have worked a h~rdship o~ other
industries producing red cedar products. Indeed, those
industries have suffered because they have·not had the tariff
protection available to the shake and shingle industry. In
addition, the domestic industry itself admits the tariff has
contributed to an increase.of hundreds of dollars in the
price of houses that use such roofing; elimination of the
tariff should be beneficial to industries wh;Lch produce
complementary building materials. The only related industry
on .which there will be adverse effects of eli~inating the
·duty is the cedar log industry. As explained above, however,
this is not in fact a separate industry but, rather, is part
of the more general commercial logging industry'. In
comparison with the returns from its overall operations,
losses from elimination of the duty on red cedar shakes and
shingles should be trivial.

24
·III. Effects on Consumers
It is clear that constim~rs benefit from elimination of
the tariff. The tariff cause~ the price of red· cedar shakes
and sl)ingles to rise: indeed, it has in.creased by
approxim(lteiy 50 percent since the imposition of the.tariff.
. Some consumers who prefer red cedar shakes and shingles to . . .
other r6ofing~r siding materi~l~ ·will pur6hase other
materials when the price of cedar sh'akes and shingles rises·.
Other consumer~ Will continue to purch~se· the shakes and
sh.ingles, but at. a p;i.gher price. The Commission staff
estimates that redyeing the tariff to 20 percent from j5· . .
·percent wi)..l pr.educ;~ annual benefits· for consumers· 'of between
$6.~5 .million and $12.79 milli6n from lower prices ~nd
increased quantities of shakes and shingles.49/ Elimination
of the 35 pei~ent duty would produce estimated annual
benefit~ of between $17.14 million and $32.74 million.2Q./ A
decisi6n to eliminate the duty rather than to cotitinue the
duty at 20 percent, thus, would benefit American:consumers by
at least .. $10.49 million and as much as $19.95 million
annually. ' '
IV. U.S. General Economic Interests
Calculation of effects on the general economic interests
of· the United States in this investigation yields far from
clear r.esults. Pl<:iinly, the gairis to the consumers from
49/ Table .. 13 at page A-37.
2Q./Report Table 14 at A-38.

25
tariff elimination appear to exceed those to producers from
continuation of import relief. Estimates by Commission staff
suggest that when the duty rate is reduced to 20 percent,
consumers will, gain between $6 .. 65 million and $12. 79 million
annually, because removing the tariff allows domestic
consumers to buy the good at lower prices and will make it
possible for them to buy more of the product than they would . . ·.
choose to buy at the tariff-inclusive price. Producers of
shakes and shingles will surrender revenues of between $1.5
million and $4.9 million annually when the tariff is reduced,
because they will receive lower prices for their products and
will choose to produce less at those lower prices.· The··
Commission staff estimates the net gain to consumers from
elimination of the duty on shakes and shingles is between
$17.14 mil:).ion and $32.74 million annually, while revenue
losses to domesti~ shake and shingle producers ~ange between
$4.58 million and $13.31 million annually.
The over~ll effect is complicated, however, because the
United States government gains tariff revenue from extension
of import relief in an amount sufficiently large that, when
added to the effects on producers, the total exceeds the
costs O'f import relief _to consumers. Under the supply and
demand conditions for red cedar shakes ~nd shingles,
foreigners effectively pay pa~t of the tariff revenue because
the net price they receive is reduced .. When the effects of
reducing the tariff on foieign prices an~ thus on tariff

26
revenue are accounted for, _the.calculations by.Commission . I . _' • .
staff suggest a net w~lfare loss of between $25.25 million
and $30.53 million annually from~limin~ting the tariff fully
instead of ~llowing its scheduled reduction to 20 percent to
go forward as planned . .21/
That calculation, however, does not take important
fac:tor.s into account. First, .it do~s not account for any
costs associated with the imposition and.collection of the
duties. second, and more important, it does not account for
the effects of the duty ori our trading relationship with
Canada and related effects on other. U.S. industries.-52/ ·-
The record seems clear that the imposition of tariff.
protection for the domestic red cedar.shake and shingle
industry provoked at least two reactions from the Canadian
government. First, the Canadians imposed even more severe
restrictions on the export of red cedar-logs than had
previously been in place. Second, the Canadians imposed
tariffs on imports of a variety of other U. S". ·products .21_/
21/ Report at A-'37-38; see also USITC Memo EC-L-335 (October 3, 1988).
_52/ 19 U.S:C. 2252(c) (5) and 2252(c) (.6) direct that consideration be given to "the effect of import relief on the international economic interests of th~ United States;" and "the.impact on u.s.· industries and firms as a consequence of any possible modtf ication of duties or other import · restrictions ·which may ·result from international obligations with respect to compensatioi:i." · ..
2.ll The items covered by Canadian retaliatory tariffs in~lude: certain books, ·catalogs of publications issued by non-Canadian publishers, printed music; computer parts, certain semi-conductor devices, tea bags, diesel motor rail

27
These retaliatory tariffs were imposed on June 2, 1986,
assertedly in accordance with the General Agreement on.Tariff
and Trade (GATT) rules, which permit a nation to impose
tariffs in retaliation for tariffs imposed against it under
certain circumstances.54/ Since these Canadian tariffs were
explicitly imposed in retaliation for the U.S. shakes and
shingles duty, 25./ and since (whatever their present ·status
under the GATT) they would be in violation of the GATT once
the U.S. duty were removed, there is a strong chance these
duties would be removed in reaction to removal of the U.S.
shake and shingle duty. The benefits to the U.S. economy
from removal c of those b·arriers should be included in our
cars and parts, oatmeal and rolled oats, certain trees, cider, asphalt paving oil, and ozone generators. Report at A-43.
54/ Under Article XIX of the GATT, member countries adversely affected by U.S. import relief are entitled to claim equivalent compensation for the U.S. action. Compensation is generally in the form of duty reductions on other products that the affected countries export to the United States. If consultations do not produce agreement as to the form and· level of compensation, or if the traded articles are not bound by GATT accords, a trading partner may ietaliate by imposing restrictions against products that it selects. Red cedar shakes and-shingles are not bound by GATT accords, and the U.S. refused compensation to Canada when it imposed the shake and shingle duty.
25./ In a communique released by the Canadtan Department of Finance, the Canadian Minister of Finance stated "As is customary under international practice, we have approached the U.S. _government as to whether it was prepared to remove the restriction, or to offer compensation to redress the imbalance in conditions of trade caused by the U.S. action. The U.S. administration made it clear that it is not prepared to remove the measure, to compensate Canada, or to take other measures to ensure that Canadian shakes and shingles manufact~rers maintain reasonable access to the U.S. market."

28
calculat~on of the· potential benefits of removing· the U.S ..
tariff on red"cedq.r shakes and shingles ..
Moreover, prior.to the imposition of the tariff, the
Canadian government limited the ex.port- of red cedar ·logs, but
export was not entirely forbidden. Logs which were deemed to
be ''surplus," that is to say, lo~s not desired at prevailing
prices by Canadian red cedar products manufacturers, could be
exported from Canada. After the U.S. tariff on shakes and
shingles· was imposed, the Canadian government imposed an
absoiute ban. on. tl)e. export of red cedar logs,· which has
increased the dispa~ity in log prices between the U.S. and
Canada..2.Q./ and has contributed to the substantial increases in
U.S. log prices since the tariff.
The evidence is mixed as to whether termination of the
U;S. tariff would result in a return to the status quo ante
in this regard. Tl}e domestic industry ·contends that on at
least two occasions the Government of Canada has suggested to
the U.S. govern~ent that they negoti~te reduction or
eliminatio~ of the shake and ~hingle duty. On both occasions,
the U.S. government agreed to eliminate the duty·only if
bilateral ·fre~ trade in logs were restored; on both· occasions
the. ·canadian government allegedly refused :TI/· For their part,
56/ See Post-Hearing·Brief and Response to Questions by Commissioners in Support of Continuing Relief from Imports of Red Cedar Shakes and Shingles, at 4.
TI/ Petitioner's Pre-Hearing Brief in Support of Continuing Relief from Imports of Red Cedar Shakes and Shingles ("Domestic Pre-Hearing Br."), at 4.

29
the Canadian interests appearing before the Corrunission have
hinted at the reciprpcal removal of the export ban but have
given no commitments. The Canadian red cedar shake and
shingle industry has indicated that, if they were approached
by the Canadian government with a proposal for the removal of
the export ban they would "probably" assent if the U.S.
tariff had been removed.28./ As to whether the Canadian
gcivernment would make such a proposal, the Canadian parties
have been equally non-corrunittal.~/ The importance.of
transport costs..6.Q/ raises a question as to whether, even
assuming the export ban were removed, there would be much
benefit to the U.S. ·Shake and shingle industry, since it'is
likely that logs would be processed close to their point of
5...8./ The Co-Chairman of the (Canadian) Fraser Valley Independent Shake and Shingle Producers Assn. stated in testimony before the Corrunission: "I would respectfully suggest that I don't think the Canadian industry would petition the Canadian government, but·r.would suggest that perhaps in the spirit.of free trade, ... that in fact if the Canadian government was to approach the Canadian industry with some sort cif a proposal, that you would probably find acceptance within the ·canadian industry." Hearing transcript at 141-42.
~/ Prehearing Brief of Fraser Valley Independent Shake and Shingle Producers Assn. at 40: "[A]lthough we do not speak for the Canadian government, it is not unreasonable to assume that the removal of the· tariff under these circlimstances might encourage the Canadian government to reconsider the export ban it imposed on western -red cedar logs going from Canada into the United States."
60/ Most processing now takes place close to the point.of harvest; that is why the industry is largely concentrated in the Pacific Northwest. There is no reason to assume that will change in the future.

30
ha~vest rather than beiri~ transported across the border to be
processed in U.S. mills.
If the ban on the export of Canadian red cedar logs were
removed, it is likely that U.S. industries besides the shake
and shingle industry would benefit. A number of other· red
·cedar products are produced by other industries; these
include lumber, veneer, plywood, poles, posts, and pi·lings.
The export ban (arguably· a consequence of the U.S. shake and
shingle duty)· has clearly forced u~ the U.S. price .of red -
cedar logs.Ql/ If that is the case, then the U.S. duty has
had.indirect adverse consequences for these industries. No
empirical measurement of these effects is available to us at
this time.
Conclusion
The overwhelming evidence is that the increased tariff
on shakes and shingles has not been effective in ipcreasing
the competitive position of the domestiG industry. The
primary economic ef f~ct of the tariff has been to transfer
wealth from American consumers to the producers of red cedar
logs and, to a lesser extent, shake and shingle prod~cers.
Ql/ The evidence on this point is mixed. While there is a striking temporal coincidence between the imposition of the U.S. duty and Canadian export ban and a dramatic run-up in red cedar prices, there is also evidence that log prices have increased on both sides of the border. See Report at A-26, A-28, A-29, and·A-30. That can only be acc6unted for by increases in the demand for r~d c~dar logs on both sides of the border. An increase in housing starts is one possible explanation for that increase in demand. The supply inelasticity noted in the staff elasticities memo is consistent with this hypothesis.

31
This was not, of course, the purpose of temporary protection
under Section 201.
There is no prospect that continuation of an increased
tariff level would do anything to promote the competitive
position of the domestic wood shake and shingle industry.
Whatever efforts the industry could make to reduce its costs
could already have been made. Eliminating the tariff
completely rather than reducing it to 20% would not hamper
industry efforts to reduce costs or increase productivity.


33
VIEWS OF COMMISSIONER ECKES, COMMISSIONER LODWICK, AND COMMISSIONER ROHR
The Commission.instituted this investigation under section 203(i)(2) of
the Trade Act of 1974 after receiving a request from the United States Trade
Respresentative (USTR). In his request, the USTR asked the Commission to
advise the President of the probable economic effect.on the domestic industry
of the termination of the import relief after 30 months; or on December 7,
1988, and to include in its advice a review of the progress and specific
efforts being made by the domestic producers of western red cedar shakes and !/
shingles to adjust to import competition. The relief is provided
pursuant to Presidential Proclamation 5498 of June 6, 1986, which provided for
the imposition of a rate of duty of 35 percent ad valorem on imports of
western red cedar shakes and shingles during the period June 7, 1986 through
December 6, 1988, with scheduled reductions to 20 percent ad valorem during
the period December 7, 1988 through December 6, 1990, 8 percent ad valorem
during the period December 7, 1990 through June 6, 1991, and, unless relief is
extended beyond June 6, 1991, the rate df duty will revert to "free."
The import relief was imposed by the President following the Commission's
determination, in investigation number TA-201-56, Wood Shakes and Shingles,
USITC Pub. 1826 (March 1986). In the section 201 investigation, the
Commission determined that increased imports of wood shakes and shingles were
a substantial cause of serious injury to the domestic industry producing wood
shakes and shingles. In providing our advice to the President in this
investigation, we have considered the current condition of the domestic
!/ Report at A-51.

34
industry, reviewed.its progress and efforts to adjust to import competition,
and considered the probable economic effect of terminating the relief. ~_/
Current condition of the domestic industry
As the Commission has observed in the past, "[t]he Commission's
assessment of the condition of the industry establishes the framework for the . . .
analysis of the impact of removal of relief and is integral to an objective '}/
evaluation of industry adjustment." . ·, .
In our determination in the section 201 investigation, we concluded that
increased imports of wood shakes and shingles were a substantial cause of
serious injury to the domestic industry. Since the imposition of the import
relief program, the condition of the industry producing western red ce.dar ~/ . .
shakes and shingles has improved. Relief has been effective in improving
the condition of the industry, but there are still signs of weakness·, as.
performance indicators for the most recent period show downturns.
'!:_/ Section 203(i)(4) requires the Commission, in advising the President under section 203(i)(2), to "take into account all economic factor~ which it considers relevant, including the considerations set forth in section 202(c) .... " With respect to those factors not specifically mentioned in these Views, we incorporate the discussion of the factors contained in the Commission's Report at pages A-34-A-45.
~/ Stainless Steel and Alloy Tool Steel, Inv. No. TA-203-16, US+TC Pub. 1975 (May 1987) at 6.
~/ The Commission's original investigation and determination covered all ·wood shakes and shingles, however, the President provided relief only with
respect to western red cedar shake and shingle imports. Therefore, in this investigation, we have considered only the probable economic effects of termination of the import relief on producers of western red cedar shakes and shingles, and the efforts of such producers to adjust to import competition.

3.5
Production of western red cedar shakes and shing~~s increased from 1985 11
through 198~, from 1. 6 million squares to 2. 2 million squares.
Production declined slightly in the interim pe~iod January-June 1988, when
compared to the 1987 interim period, from 1.1 million squares to 1. OS million ~/
squares. Domestic capacity increased from 1985 to 1987, an~ remained
virtually unchanged in the interim period of 1988 ~s .compared with.the interim ZI
period 1987. Capacity utilization alsb.lncreased from 1985 to.1986, and
.remained steady in 1987, before declining in the interim period 1988. !/"
Employment, total wages, and.average hourly wages per worker all increased . .?,/
from 1985 through 1987. Domestic producers sustained an aggregate·. net
loss equivalent to 2.4 per~ent of net sales in 1985, but in 1986 _and 1987,
U.S. producers experienced their most profitable years .since 1980,. reporting. . . . -
pre-tax net income equivalent to 9.5 percent.of net sales in 1986, and 8.8
percent of net sales in 1987. This profitable condition continued in the
first quarter of 1988, when net income equivalent to 8. 2_ percent of net sales
was reported, as compared wi~h net income equivalent to 6.-0 percent of net
5/. Report at A-7. A "square" is the usual commercial unit-of meas~J:'ement ;f shakes and shingles, and represents the .quantity requ~red to cover ~00 square .feet of surface area. Report at A-2.
§.I Report at A-7.
ZI Report at A-10.
!/ Id. ~
2.1 Report at A-13.

'
.36
w sales ... during· th~< first· qu~rter of 1987. The n~ber:'of' firms reporting
.. . . · .. ll/, losses declined from 1985 to 1987 as well. · "
Imports of'west~rn red ~eda~ shakes and shingles increased from· 198S to
'1986, from 4~0 million.squares to ·4.i miliion'squar~s: bef~re dr·~P,ping off in
1987 ·to 3.3 million squares. This decline continued' in interim 1988; with
imports failing to 1. 51 million .squares 'as compared with L 52. million squares 12/
in int~~im.1987'~ ,-. . ' . . ~ . '.
u.s: producers' share of apparent:·u.s. consumptiOn
increased fro~·~~.3 '~e~~~~t~in 1985't~ 39:8 percent in 1987, befoi~ declining
siightiy in i.nteri~ 1988 as ·compared with i.nteri~ .1987, · to 40. 2 percent from·
4L 5' percent·. _ l3(. ....
Prices of w~stern red cedar shakes and' sh:i.~gles incr~~sed · du~i.ng ·the
~~eii.e.f period. Prices' for #l,. 1/2 x 24~ we~te'rn red -~edar shakes, which. -
a~count" for app"roxlmately 70 percent of the. western red' c~dar shakes sold in
the 'united' States, increased as· perc'ent between' ,f,irst quarter 1985 and: second
. . . . 14( ' ' .. . . . \ . quarter 1988. · Prices for the other three product categories . . . . . . ' 15/
iii..;;.estigated. showed s1mi'larly substant:L11 increases~-.-..
Efforts of U.S. producers to adjust to import competition
U.S. producers of western red cedar shakes and shingles have made
reasonable progress in adjusting to import competition since import ·relief was
... . ' •• ,. ;,t
·' ...
'· . ( ·:.1 • ; .. ;
10/ Report at A-14-A-15.
!!/ Id.
!Y Report at A-23.
w Report at A-24.
"14/ Report at A-24, A~25.
15/ Report at A-25-A-26.

37
granted 28 months ago. Efforts to adjust include investment in automatic
shake saws. The new automatic saws at U.S. mills inc.rease productivity and
can be operated by an unskilled worker in place of a skilled sawyer at lower 16/
wages and lower insurance costs. The cost of a new automatic saw is
roughly equal to the annual salary of a trained sawyer, approximately 17/
$16,000. By investing in auto~atic saws, the industry alleviated the
probl~ms caused by the shortage of trained sawyers. Many sawyers left the
industry due to uncertainty of employment in the period prior to the 18/
imposition of relief.
The industry also invested in new shingle machines. Shingle machines
allow producers to utilize a lower grade of western red cedar. This
, ... adju.Stme~t by. ·the· ind~st~y~ was an aPProprfcite response to increased·
competition for higher grade logs. In recent years, lumber mills and foreign
pur'chasers have demanded an ever greater share of available high quality. 19/
western red cedar logs.
The industryhas made efforts to use more efficiently the.supply of
western red cedar which is the primary input to shake and· shingle production.
Several mills invested in hydraulic shake splitters. The .new shake splitters
atU.S mills enable the producers to·split thinner shakes, thus increasing the
yield from each log. U.S. mills have also invested in new log decks; which
16/ ·Report at A-19.
17/ Report at A-14 and A~l9.
18/ Report at A-19.
19/ Report at A-19.

38
allow producers to use both logs and salvage bolts. The increased flexibility . "\·· ,. '
allows the producers to make better use of ·the avaiiable .supply of western red
cec;iar. Some. mills have aiso invested i~ wood _chippers to produce a marketable
by~product from their wood waste. Other firms also plan to invest in wood 20/
treatment plants, to increase the value'added to their products.
·Capital expenditures by the domestic western red cedar shake and shingle
producers that provided data to the Commission totaled $1,430,000 in 1987, the
first full year of impoit relief.
'
In 1985, the last full year before import 21/
relief, these firms' capital expenditures totaled only $295,000. This
five-fold increase in capital investment shows the industry is taking
aqvantage of the relief period to improve its competitiveness and adjust to
import competition.
The industry has also engaged in a variety of research and development
actfvities. Efforts by individual produc.ers include research and development
on panelizing shakes. A shake panel would allow producers to make greater use
of narrow .width shakes. Increased use of narrow width shakes would improve
utilization of lpwer quality western red cedar and white woods, as treatment 22/
of these alternative species is de~eloped. Research and development
expenditures by individual producers increa.sed fr.om only $1,-000 in 19B5 to ".·
$51,000in1987, showing a dramatic increase in industry efforts during the
relief period. The industry has collectively funded research into the
20/ Report at A-19-A-20.
21/ Report at A-18.
'!J:.I Pre-hearing Brief of Northwest Independent Forest Manufacturers at 9.

39
development· of preservative-treated and fire-resistant hemlock and western 23/
white wood shakes and shingle_s. The research and development of such
alternative species may yield new raw material supplies to the industry over
the.long run.
All of these efforts by the industry show that it has made reasonable
\
progress to adjust to import competition. The U.S. western red cedar·shake
and shingle producers have taken advantage of the relief granted to take
prudent measures to adjust: 24/ 25/
Probable Economic Effect of Termination of Import Relief
The import relief provided by the President, along with other market
factors, has increased the prices of western red cedar shakes and shingles,
thus making it possible for the domestic industry to take measures to adjust
to import competition and improve its condit_ion. If ·rei"ief were terminated as
of December 7, 1988, there is no reason to believe that imports would not
rapidly increase to their pre-relief levels. After the imposition of the
import relief, imports decreased markedly. U.S. production responded
vigorously and swiftly to rising U.S. red cedar shake and shingle 26/ I
prices. The Canadian industry, which is two to three t~mes lar&er than
the U.S. industry and is similar in structure, would be able to increase
exports to the United States rapidly in response to higher export prices
23/ Report at A-20.
.See "Additional Views of Commissioner Eckes."
·2s1 See Additional Views of Commissioner Rohr.
26/ Report at A-7, A-30.

40
received by Canadian mills if the relief were terminated. The resulting
oversupply would drive U.S. prices down and lead to a decline in U.S. market
share -- marginal U.S. producers would drop out of the industry and production
would fall.
Any dec~ines in prices for western red cedar shakes and shingles would
result in a price-cost squeeze on the domestic industry. Red cedar logs are
the primary co.st component in western red cedar shake and single production,
accounting for about 50 percent of net sales during 1985-1987.
the period of import relief, western red cedar log prices rose 28/
ll/ During
significantly. While it is likely that log prices would eventually
adjust downward if relief were terminated, such adjustment is likely to lag
behind the ant:i.c:ipated sharp decline in.shake and shingle prices. The
industry's increased capacity and productivity, combined with the likely surge
in imports in response to termination of relief, would rapidly force down the
price of red cedar shakes and shingles.
Moreover,. other market factors, such as strong cyclical demand for shakes
and shingles, appreciation of the Canadian dollar against the U.S. dollar, and
·a loggers' strike .in Canada have also led to higher prices in the U.S. market
and corresponding improvements in the condition of the domestic industry
during the relief period. However, these factors are, by their nature,
temporary. If relief were terminated, and any of these other factors were to
reverse, the combined effect on the domestic industry could be devastating.
27/ Report at A-27, n.2.
28/ Report at A-26-A-29.

41
Terminating the relief at this time would diminish if not eliminate the
benefits of import relief, and would lead to a decrease in U.S. production,
loss of market share and employment, and declining sales and income. Declines
in U.S. production would result in the least profitable (or the marginal)
firms leaving the industry and/or surviving mills cutting back on their less
profitable operations, thereby reducing their capacity utilization or their
productive capacity. This would reduce the demand for mill labor and result
in lower levels of employment and total wages paid. With the level of import
relief scheduled to be reduced to 20 percent on December 7, 1988, some of
these effects will be felt in the U.S. red cedar shake and shingle industry,
but the effect of termination of the import relief would be much more
pronounced.
Market conditions do not warrant a departure from the President's program 29/
of import relief. That program of staged reductions in the additional
tariff will allow the industry to make a smoother adjustment to import
competition. We therefore advise the President to continue his program of
import relief.
29/ Commissioner Lodwick advises the President that the termination of import relief would have adverse effects on the domestic western red cedar shakes and shingles industry.


43
Additional Views of Commissioner Eckes
Those who review the Commission's Report in this
investigation will observe that this key document includes
the results of staff calculations concerning the probable
economic effect of terminating import relief. [See Report
at A-34, "Economic analysis of the probable economic
effect of terminating or extending import relief."] This
is not the first section 203 report to contain such
estimates, which ~re based on the use of a static economic
model.· Similar estimates appear· in appendices to the most
recent section 203 reports on stainless steel and alloy
tool steel and heavyweight motorcycles. !/
Regular observers know. that I seldom place heavy
reliance on economic models and theoretical calculations.
In joint views in the stainless steel section 203
investigation, I cautioned that:
(a]nalysis (of the impact :of termination of ' • I relief] must be thoroughly grounded in actual
performance indicators (~. production, profits, employment, import and·price trends, etc.) and not in hypothetical outcomes derived from static assumptions. The appropriate use of econometric models is to supplement this analysis, aiding as a tool of estimation, but not of actual determination. ~/
1/ Stainless Steel and Alloy Tool Steel, Inv.·No. TA-203-16, USITC Pub. 1975 (May 1987); and Heavyweight Motorcycles, Inv. No. TA-203-17, USITC Pub. 1988 (June 1987) . ~/ stainless Steel and Alloy Tool Steel at 10.

44.
In my viewi those who rely heavily on such
calculations in decision-making.must be prepared to accept
the consequences of. mathema.tical and programming errors.
The present investigation is a classic example. After the
staff report was.submitted to the Commission and approved
at the Commission meeting on September 29, 1988, the
Director of Economics circulated a memorandum al~rting
· members of the Commission to programming errors which
produced. results different from those originally derived.~/
~ Memorandum EC-L-335, October 3, 1988.

45
ADDITIONAL VIEWS OF C~ISSIONER ROHR
The C011Tiission's Office of Econanics deserves credit for
having discovered a programning error in estimating the net
welfare effects of the tariff. This estimate was one of the many
estimates the Office of Econanics provided to the Carmission
_during this investigation. The Office of Econanics notified the
C011Tiission of the error sufficiently in advance of the due date
of our advice. See Memorandum EC-L-355, October?. 1988.
These corrections to the estimates show that eliminating· the ..
tariff would result in a significant danestic total net welfare
loss. This result is noteworthy in that estimates of the effects
of eliminating tariffs almost always show total net welfare
gains.
For most products, import supply is highly responsive to
changes in U.S. prices for the imported product. The U.S. market
is usually but one of several markets to which exports fran other
countries can be easily diverted. ·Foreign production can usually
be readily increased in response to an increase _in U.S. prices
for the imported product. For these reasons, in models that are
used to generate these estimates, import supply is usually
assumed to be highly responsive to changes_ in the U.S. import
price. Price responsive import supply leads to·estiinates of
total ne~ welfare gains upon elimination or reductions in
tariffs.

46
In the present case, however, the supply of imported western
red cedar shakes and shingles is relatively unresi)onsive to
changes in U.S. prices for these products. This is because the
U.S. market consumes the vast majority of shakes and shingles
worldwide, and there.are no other significant markets fran which
to divert exports. Furthennore, the limited supply of western
red cedar logs limits the supply responsiveness of Canadian shake
and shingle_ producers. Therefore, most of the tariff is absorbed
by Canadian.producers. Based on the unresponsive import supply,
the estimates show that eliminating the tariff would cause a
total danestic net welfare loss.
The Office of Econanics calculations support continuing the
program of a gradual reduction in import relief, which I have
recarrnended to the President in the joint views with Cannissioner
Eckes and Carrnissioner Lodwick. I also suggest that the U.S.
Trade Representative request the Carmission to annually review
the progress the .industry is making under the reduced tariff.

A-1
INFORMATION OBTAINED IN THE INVESTIGATION
Introduction
Following receipt of a request filed on July 1, 1988, by the United States Trade Representative·under authority delegated by section 4(a) of Executive Order 11846, the Commission instituted investigation No. TA-203-18 under section 203(i)(2) of the Trade Act cf 1974 for the purpose of gathering information in order that it might advise the President of its judgment as to the probable economic effect on the domestic industry of the termination of import relief presently in effect, pursuant to Presidential Proclamation 5498, with respect to shakes and shingles of western red cedar. !/ The import relief presently in effect will terminate on June 6, 1991, unless extended, modified, or terminated by the President at an earlier date.
This relief was proclaimed following an investigation completed by the Coinmission on March 25, 1986 (investigation No. TA-201-56) ~/under section 201 of the Trade Act of 1974. In that investigation, the Commissio.n determined 11 that wood shakes and _shingles, provided for in item 200. 85 of the Tariff Schedules of the United States (TSUS), are being imported into the United States in ,.such increased .quantities as to be a substantial cause of · serious injury to the domestic industry producing articles like or dir~ctly competitive with the imported articles. ~/
Notice of the current investigation and of a public hearing to be held in con~ection therewith was given by posting copies of the notice in the.Office of the Secretary, U.S. International Trade Commission, Washington, DC, and by publishing the notice in the Federal Register of July 20, 1988 (53 F.R. 27410). 11 The Commission hearing.was held in Washington, DC, on August 16, 1988. §j The Commissfon reported its advice_ to the President on October 6, 1988.
Previous Commission Investigation
On October 7, 1982, a petition was filed with the Commission and the Department of.Commerce by counsel on behalf of the United States Coalition for Fair Canadian Lumber Imports, a group of 8 trade associations and more than 350 domestic producers of softwood lumber products, alleging that imports of
!/ A copy of Presidential Proclamation No. 5498; a May 26, 1986, memorandum from the P~esident to the United States Trade Representative requesting the advice of the Commission; and the request from the United States Trade Representative are presented in app. A. ~/Wood Shakes and Shingles: Report to the President on Investigation No. TA-201-56 Under Section 201 of the Trade Act of 1974, USITC Publication 1826, March 1986. 11 Vice Chairman Liebeler and Commissioner Brunsdale dissenting. ~/ The Commission's investigation and determination covered all wood shakes and shingles; however, the President provided relief only with respect to western red cedar shakes and shingles. · 11 A copy of the Commission's Federal Register notice is presented in app. B. ~/ A list of witnesses who appeared at the Commission hearing is presented in app. C.

A-2
softwood shakes and shingles from Canada were being subsidized by the Government of Can~da within the meaning of section 702 of the act (19 U.S.C. § 1671). Accordingly, effective October 7, 1982, the Commission instituted a preliminary countervailing duty investigation (No. 701-TA-198) under section 703(a) of the act (19 U.S.C. § 167l(a)) to determine whether there was a reasonable indication that an industry in the United States was materially injured, or was threatened with material injury, or the establishment of an industry in the United States was materially retarded, by reason of imports of such merchandise from Canada. As a result of that investigation, the Commission determined that there was_a reasonable indication that an industry in the United States was materially injured by reason of imports from Canada of the softwood shakes and shingles which were alleged to be subsidized by the Government of Canada.
However, on May 31, 1983, the Department of Commerce determined that no benefits that constitute subsidies within the meaning of the countervailing duty. law were being provided to manufacturers, producers, or exporters in Canada of softwood shakes and shingles. The total estimated net subsidy for each product was found by Commerce to be de minimis; therefore, the final subsidy determination was negative and the investigation was terminated.
The Products
Description and uses
The products covered in this investigation are shakes and shingles of western red cedar. These articles are thin, rectangular pieces of wood that have been split (shakes) or sawed (shingles) from a block or bolt !/ of wood. Shakes and shingles are used in similar applications--primarily as a covering for the roof or side of a building. Shakes and shingles generally are laid in rows that overlap so that only a portion of each shake or shingle is exposed to weathering. Shakes and shingles are normally used interchangeably, although shakes are generally thicker than shingles and tend to be used more on roofs, where thickness is .an advantage in the weathering process.
The usual commercial unit of measurement of shakes and shingles is a "square," the quantity required to cover 100 square feet· of surface area. A square of shakes or shingles usually consists of between three and five bundles, depending on the size of the shake or shingle and the number of inches exposed to the weather. Because the exposed portion of a shake or shingle generally is greater on the sides of a building than on the roof, the number of shakes or shingles making up a wall square will usually be somewhat fewer than the number needed for a roof square.
Between 85 and 95 percent of the shakes and shingles produced in the. United States are manufactured from western red cedar (Thuja plicata). The remainder are produced mainly from such species as northern white cedar (Thuja occidentalis) and redwood (Sequoia sempervirens), with other species being used less frequently. Shakes and shingles are produced from these woods because they display such desirable qualities as vertical grain (for ease in splitting), a low coefficient of expansion, high strength, relative freedom
!/ A short, cylindrical section of a log.
A-3
from checking !/ and warping, light weight, good nail-holding qualities, and resistance to rot and insect damage.
In the trade, red cedar shakes and shingles are generally graded according to quality and size specifications, which are established 'by organizations with inspection services such as the Red Cedar Shingle & Handsplit Shake Bureau of Bellevue, WA. The Bureau is a marketing and inspection organization to which many U.S. and Canadian producers of red cedar shakes and shingles belong. There are five major grading bureaus that account for virtually all of the reported production of western red cedar shakes and shingles. ~/
Nearly all wood shakes and shingles are manufactured in random widths and are packed in bundles. Ten percent of the shingles in any shipment of a specified size category may be 1 inch over or under the specified length. There are generally four grades of shingles .. The best quality, or No. 1, shingles represent the premium grade manufactured in each length. These shingles are all vertical-grained, knot-free, and are the preferred type for roofing. When used on a roof, the life of these shingles can generally be expected to be between 20 and 35 years, depending on the pitch of the roof and climate. When used as siding, these shingles will most likely outlast the useful life of the structure to which they are attached.
Second quality (No. 2) shingles may have some flat grain wood but must be clear of knots for three-quarters of the length as measured from the butt. No. 3 shingles are basically those that do not meet No. 1 or No. 2 standards, but are still usable. They must be clear of knots at least 6 inches from the butt. The fourth grade, which is known as undercoursing, is manufactured in 16-inc? and 18-inch lengths and is used primarily as ·an underlayment for higher grade shingles.
In addition to these specifications, a small percentage of shingles are remanufactured into grooved sidewall sh~kes, or rebutted and rejointed shingles. Grooved sidewall shakes or shingles have been machined to have striated faces and parallel edges. Rebutted and rejointed shingles have been trimmed so that the edges are parallel and at a right angle to the butt.
Shakes certified by an inspection bureau are all 100 percent free of knots and vertical grained, eliminating the grade requirements used for shingles. There are three basic types of shakes--handsplit and resawn, tapersplit, and straight split--all of which are manufactured in various lengths. Handsplit and resawn shakes ~ccount for about 90 percent of total U.S. shake production.
Most of the shingles produced in the Eastern United States are manufactured from northern white cedar, for which there is no widely accepted inspection or marketing association similar to the Red Cedar Shingle & Handsplit Shake Bureau. Few, if any; shakes are produced from 'eastern species. Each mill is basically on its own to develop and-maintain its markets for shingles. In addition, mills must maintain their own quality
!/ Splitting lengthwise. ~/ A small but undetermined quantity of shakes and shingles are ungraded and not reported to the grading bureaus. Such products are usually used locally.

A-4
control. !/ Generally, these eastern shingles are graded on the basis of their being free of knots.
Production processes
Shingles are sawn from a block or·bolt of wood that is obtained by sawing a log into smaller sections of the desired length. Bolts may be either split or sawn into blocks, which are then placed on a carriage for sawing into shingles. Although there are different types of carriages and saws, the actual method of producing shingles varies little between machines and has changed only slightly since the early 1900's.
Shakes are generally produced from blocks of wood that have been mechanically split from bolts. Blocks are then split into boards. Resawn shakes are produced from boards that are run diagonally through a handsaw to produce two tapered shakes with one smooth face from each board. Straight-split shakes are produced by splitting blocks of wood into shakes of equal thickness from butt to tip. Tapersplit shakes are similar to straight-split, except the block is turned end over end with each split to achieve the tape~ed edge. Over 90 percent of the shakes produced in the United States ana ·canada are ·:resawn. '!:_/ .
U.S. t•riff treatment
The ·subject shakes and shingles enter the United States free of duty under TSUS item 200.85. The duty-free status was provided for in the Tariff Act of 1930, 11 and for shakes and shingles other than western red cedar has been bound since January l, 1948, as the result of a concession granted by the United States under the General Agreement on Tariffs and Trade. Western red cedar shakes and shingles were not bound.·~/ These articles are provided for in subheading 4418.5000 of the Harmonized Tariff Schedule of the United States, with a column 1 general duty-free rate.
!/ The State of Maine maintains grading rules for northern white cedar shingles under the Maine Commercial Standard; however, compliance with the grading rules is optional. According to officials with the Maine Forest Service, there are no Maine shingle mills registered to sell shingles under the Maine Commercial Standard. '!:.! Based on data published by the Red Cedar Shingle & Handsplit Shake Bureau. 1f Based on a trade agreement with Canada in 1936, the United States reserved the right to impose semiannually an absolute quota on red cedar shingles equal to 25 percent of the combined domestic shipments and imports during the preceding 6-month period. Such quotas were imposed. In a 1939 agreement with Canada, the United States reserved the right to impose a duty not exceeding 25 cents a square on red cedar shingles entered in any calendar year after 1938 in excess of a _quantity of not less than 30 percent of the annual average, for the preceding 3 years, of the combined total of domestic shipments and imports. Such duties were imposed until January 1948, when the unconditional duty-free status under the Tariff Act of 1930 was restored. ~/Most U.S. exports of wood shakes and shingles are to Canada, which also has duty-free status for imports.

A-5
Nature and Extent of Current Import_ Relief
On June 6, 1986, the President of the United States, by Proclamation 5498, imposed a temporary duty increase on U.S. imports of shakes and shingles of ·western red cedar. !/ The imposition of the duty increase followed an affirmative finding by the Commission in investigation No. TA-201-56. The Presidential Proclamation_ provided additional duties on wood shakes and shingles of western red cedar· of 35 percent ad valorem for th.e period June 7, 1986, through December 6, 1988, inclusive; 20 percent ad valorem for the period December 7, 1988, through December 6, 1990, inclusive; and 8 percent ad valorem for the period December 7, 1990, through June 6, 1991., inclusive, as set forth in items 924.30, 924.31, and 924.32, respectively, of the Appendix to the TSUS.
~he Domestic Industry
U.S. producers
Production of shakes and shingles is concentrated in the Pacific Northwest, especially in the State of Yashington. In 1987, the Red Cedar Shingle & Handspiit Shake Bureau reported that of its 146 member U.S. mills producing red cedar shakes and shingles, 93 were located in Yashington, 36 in Oregon, 15 in Idaho, 1 in Montana, and 1 in Alaska. Bureau member mills also reportedly manufacture shakes and shingles from other species of wood such as sitka spruce, larch, Douglas-fir; and incense cedar.
The Bureau's 146 member U.S. mills accounted for about 60 percent of U.S. western red cedar shake and s~ingle production in 1987. Red cedar shake and shingle producers are largely capable of producing both shakes and shingles. In 1987, according to information supplied by the. bureau, 49 percent of all U.S. mills produced wood shingles (8 percent produced only shingles) and 92 percent produced wood shakes (51 percent produced only shakes); 41 percent produced both products. ·
During 1985-87, the total number of firms producing western red cedar shakes and shingles declined in both Yashington and Oregon. '!:_/ . The t.otal for the two States fell by 8 percent, from 224 firms in 1985 to 207 firms in 1986,
!/ A copy of the proclamation is presented in app. A. ~/About 95 percent of the U.S. production of red cedar shakes and shingles occurs in Yashington and Oregon (transcript of the hearing (transcript), p. 20).

A-6
and then increased by 2 percent to 212 firms in 1987, as shown in the following tabulation, compiled from data of the States' employment service offices: !/
Year Washington
1985........ 187 1986........ 173 1987 ........ 180
U.S. importers
Oregon
37 34 32
·'total
224 207 212
As with U.S.-produced shakes and shingles, .most imported shakes and shingles are sold to wholesalers, although a small percentage of imports are purchased directly by retailers, builders, and roofers.· T~e wholesaler usually mixes the imported and U.S.-produced products together for sale, as quality differences are generally not a factor. Most wholesalers also handle
·a wide variety of other construction materials.
The U.S. Market and Channels of Distribution
Apparent U.S. consumption
U.S. consumption of western red cedar shakes and shingles increased by 10.6 percent, from 5.6 million squares in 1985 to 6.2 million squares in 1986, then declined.by 11.7 percent to 5.4 million squares in 1987 (table 1). Consumption continued downward in January-June 1988, dropping an additional 3.0 percent to 2.5 million squares from 2.6 million squares in January-June 1987.
During this investigation, parties in support of continued relief have · contended that data comparisons should be made for the 18-morith periods prior to (January 1985-June 1986) and following (July 1986-December 1987) imposition of the temporary duty increase. Certain comparisons are presented on this basis in the following tabulation (in thousands of squares): '!:_I
!/ At the hearing, parties in support of continued relief (American Certified Shake & Shingle Bureau, Blue Label Inspection & Grading Bureau, Inc., Northwest Independent Forest Manufacturers, and Skagit Valley Red Cedar Shake Association) submitted a list of 242 firms that allegedly support the continuation of relief (transcript, p. 166 and exhibit 3). Parties opposed to continued relief contend that 82 of .these are companies that no longer manufacture shakes and shingles, are listed twice under different names, or are known to oppose continued relief (Posthearing brief on behalf of the Fraser Valley Independent Shake & Shingle Producers Association (Fraser Valley posthearing brief), p. 1). ~/ Semiannual trade data for the period January 1985-June 1988 are presented in app. D.

A-7
18-month period--January 1985- July 1986-
Item June 1986 December 1987
Percentage change following imposition of the duty
Production ............ . Exports ................ . Imports ............... . Consumption ........... . Ratio (percent) to
consumption: Imports ............. . Production .......... .
'fable 1
2,492 102
6,382 8, 772
72.8 27.2
3,508 88
4,970 8,390
59.2 40.8
+40.8 -13.7 -22.1 - 4.4
-18.7 +50.0
Western red cedar shakes and shingles: U.S. production, exports of domestic merchandise, imports for consumption, and apparent consumption, 1985-87, January-June 1987, and'January-June 1988
Period
1985 ......... . 1986 ......... . 1987 ......... . January-June--
1987 ....... . 1988 ....... .
1985 ......... . 1986 .. i •••••••
1987 ......... . January-June--
Production 1/
1,643 2,130 2,226
·y 1,102 1,050
62,638 98,964
119,883
1987 ........ ~/ 59,354 1988 ........ ~/ 69,562
Exports Imports Apparent consumption
Quantity (1,000 squares)
68 3,994 5,569 60 4,088 6,158 62 3, 271 5,435
24 l, 521 - 2,599 37 1,507 2,520
Value (1,000 dollars) 3/
3,060 156,879 216,457 2,505 175,685 272,144 2,437 163,010 280,456
1,068 72,882 131,168 1,030 88,997 157,529
Share of consumption supplied by-Imports .Production
71. 7 28.3 66.4 33.6 60.2 39.8
58.5 41. 5 59.8 40.2
72.5 27.5 64.6 35.4 58.1 41. 9
55.6 44.4 56.5 43.5
1/ Estimated from data supplied by shake and shingle inspection bureaus and official statistics of the U.S. Department of Commerce. ~/Estimated by Commission staff. 11 Import values include the temporary duties imposed by the Presidential proclamation that became effective in June 1986.
Source: Compiled from official statistics of the U.S. Department of Commerce, except as noted.

A-8
Historically, consumption of shakes and shingles has been associated with the level of housing starts in the United States. Industry officials estimated during the 201 investigation that as much as 75 percent of U.S. consumption of shakes and shingles is used in new-home construction in years of normal housing activity. However, consumption of wood shakes and shingles has not kept pace with the general increase in housing construction during the 20th century. In the early 1900's annual consumption of shingles often exceeded 10 million squares. !/ The long-term downward trend in U.S. consumption is due primarily to competition from other products--such as fiberglass and asphalt shingles, aluminum and plywood siding, tiles, and so forth ~/--and to the limited availability of suitable old-growth cedar logs. 11
Virtually all the shakes and shingles consumed in the United States are used on the roofs or sides of buildings (particularly in residential applications) and, as mentioned previously, in years of near-average housing starts about 75 percent of U.S. consumption of shakes and shingles is on new structures, with re-roofing or re-siding accounting for the remainder. Because of this relationship with the residential home market, demand for shakes and shingles is highly dependent on housing construction and related factors, especially interest rates. The following tabulation presents apparent U.S. consumption of western red cedar shakes and shingles and U.S. single-family housing starts during 1985-87, January-June 1987, and January-June 1988:
Period
1985 .............. . 1986 .............. . 1987 .............. . January-June--
1987 ............ . 1988 ............ .
Channels of distribution
U.S. consumption (1,000 squares)
5,569 6,158 5,435
2,599 2,520
Single-family housing starts (l,000 units)
1,072 1,179 1,146
587 545
Consumption per housing start (squares/unit)
5.2 5.2 4.7
4.4 4.6
Wood shake and shingle producers generally sell and distribute their products through wholesalers. However, some' producers have developed direct contacts with builders or roofers, thus eliminating the middleman. If the contact happens to be a particularly aggressive builder or roofer, it will often give a producer a competitive edge during periods of slow housing starts. However, the bad-debt risk tends to rise when such direct contac~s
!/Report to the U.S. Senate on Red-Cedar Shingles ... , U.S. Tariff Commission, Report No. 149, 1942. ~ Parties opposed to continued relief contend that elimination of the tariff will do much to arrest the shift by builders and home owners toward substitutes. They stated that the Canadian Government, with funding from both Canadian and U.S. sources, announced a $21 million program to combat the competition from non-wood products (Fraser Valley posthearing brief, p. 2). 1J See the section of this report entitled "The supply of western red cedar."

A-9
are utilized, and in past years some producers reported problems with some of their direct contacts who would pay cash for their first few orders, later ask for credit on a larger order, and subsequently go bankrupt.
Most wood shakes and shingles produced in the United States are delivered by truck. The typical trailer load is about 200 squares, with a net worth of between $8,000.and $13,000 wholesale. A typical trucking cost (from the Olympic Peninsula to the Los Angeles area) is between $1,000 and $1,500 per truckload, or about $5. 00 to $7. 50 per square ..
Wood shakes and shingles produced in the West destined for Eastern markets are shipped primarily by rail. The actual rail freight, not including transportation to and from the rail site, is about $10 per square. Nearly all Eastern-produced shingles are shipped by-truck.
Most' of the market promotion of shakes and shingles in the United. States and Canada is handled by the Red Cedar Shingle & Handsplit Shake Bureau, which maintains an inspection service that certifies the quality of each member mill's production. Other duties of the bureau include research and development, adver.tising, and market promotion. Although there are other grading and inspection associations in the West, the bureau is by far the lat;gest. Gr:ading ,s_tandards are highly similar among the associations.
, The greatest effect. the bureau and other associations have had on the
shake and shingle industry has probably been the standardization of grades. Before the uniform grading systems, U.S. producers often marketed shakes and shingles under their own mill grades. These mill grades were often of poor and irregular quality; some industry people state that such poor and erratic quality standards helped to open the U.S. roofing and siding markets to competitive products.
The primary competition for wood shakes and shingles is asphalt roofing shingles, which are used extensively throughout the country. Other products that compete with wood shakes and shingles include asbe~tos shingles, tile, metal roofing, aluminum and vinyl siding, other types of wood siding, and slate.
Condition of the U.S. Industry
The Commission received usable questionnaire responses from 73 producers of western red cedar shakes and shingles. Many of the 73 respondents have very small operations and could provide only partial data in response to the questionnaire. Respondents accounted for an average of 25.0 percent of U.S. production during 1985-87_, as estimated by the staff from data reported by shake and shingle inspection bureaus. !/ Of the 73 firms that provided
1/ Following receipt of the request from Ambassador Yeutter to advise the President of the probable effects of termination of the temporary duty, Acting Chairman Brunsdale informed the Ambassador by letter on July 14, 1988, that due to the nature of this industry, which consists of a large number of firms, many of them small, data collection would be extremely difficult in the time originally allotted. The Commission extended the deadline by 30 days but many firms were still unable to comply with the Commission's data request.

'· I
A-10.
questionnaire data, 61 were in favor of the continuation of relief, none were opposed, 8 took no position, and the remaining 4 did not respond to th~ question.
U.S. production
U.S. production of western red cedar shakes and shingles increased annually from 1.6 million squares in 1985 to 2.2 milllon squares in 1987, an increase of 35.5 percent. !/ Shakes accounted for about 70 percent of U.S. production during the period, as shown in the following tabuiation based on inspection bureau data (in thousands of squares):
U.S. production of--Period Shakes Shingles
1985 ................... l,175 1986 .................. 1,511 1987.................. l,605 January-June--
1987 ............... . 1988 ............... .
788 700
Capacity and capacity utilization
468 619 621
314 350
Total
1,643 2,130 2,226
l,102 1,050
Data on capacity and capacity utilization are not available for each of tqe many mills that produce shakes and shingles from western red cedar. Questionnaire data from the firms that reported both production and capacity are presented in the following tabulation:
Capacity Period Production Capacity i/ utilization 2L
------(1,000 squares)- - - - -- - (Percent)
1985 ............. 496 971 48.l 1986 ............. 650 1,067 59.l 1987 ............. 668 1;097 59.1 January-June--
1987 ........... 326 565 61.2 1988 .. · ......... 276 566 49.4
!/ Two firms supplied production data but were unable to supply data for capacity. ~/ Ratios are for firms that supplied data for both production and capacity.
!/U.S. production increased from 2.5 million squares during the 18-month period prior to imposition of the temporary duty to 3.5 million squares during the 18-month period following imposition of the duty, or by 40.8 percent.

A-11
As shown above, capacity of respondent mills increased by 13.0 percent, from 971,000 squares in 1985 to 1.1 million squares in 1987. Capacity
.utilization by the reporting mills increased from 48.1 percent in 1985 to 59.1 percent in 1986 and 1987, then dropped to 49.4 percent in January-June 1988.
U.S. exports
U.S. exports of western red cedar shakes and shingles declined by 11.8 percent, from 68,000 squares in 1985 to 60,0_00 square in 1986, then increased by 3.3 percent to 62,000 squares in 1987 (table 2). During January-June 1988, exports totaled 37,000 squares, 54.2 percent more than the quantity exported in January-June 1987. !/ Canada was the principal market for U.S. exports during the period. Other markets included the Bahamas, Jamaica, and the French Pacific Islands.
U.S. producers' inventories
During 1985-87, 21 of the producers that responded to the Commission's questionnaire held inventories of shakes and 14 producers held inventories of shingles. Yearend inventories of shakes declined by 12.1 percent from 10,677 squares in 1985 to 9,390 squares in 1987. Yearend inventories of shingles trended upward from 6,543 squares in 1985 to 11,666 squares in 1987, or by 78.4 percent, as shown in the following tabulation (in squares):
Period Shakes Shingles Total
As of Dec. 31-- •\ 1985 ................ 10,677 6,543 17,220 1986 ................. 8,396 12,647 21,043 1987 ................ 9,390 11, 666 21,056
As of June 30--1987 ................. 9,495 6,773 16,268 1988 ................ 6,810 7 ,114 13,924
U.S. employment
Employment data are available for the States of Washington and Oregon, which account for about 95 percent of U.S. production of red cedar shakes and shingles. The number of shake and shingle production workers employed in those States increased by 22.4 percent, from 1,557 in 1985 to 1,906 in 1987. Tota'l wages paid to those workers increased by 38. 2 percent, as average annual
!/U.S .. exports declined from 102,000 squares during the 18-month period prior to imposition of the temporary duty to 88,000 squares during the 18-month period following imposition of the duty, or by 13.7 percent.

A-12
Table 2 Wood shakes and shingles: U.S. exports of domestic merchandise, by principal markets, 1985-87, January-June 1987, and January-June 1988
January-June--Market 1985 1986 1987 1987 . 1988
Quantity (l,000 squares)
·Canada ................... 43 47 53 21 31 Bahamas .................. 5 5 3 1 1 Jamaica .................. 4 2 1 y 1 French Pacific Islands ... 3 1 y 0 0 All other ................ 13 4 3 1 3
Total ................ 68 60 62 24 37
Value (1,000 dollars)
Canada ................... 1,692. 1,804 2,024 935 805 Bahamas ........ : ......... 245 259 186 73 49 Jamaica ................. ~ 268 ll7 73 14 68 French Pacific Islands ... 174 93 17 All other ............... ; 681 232 136 46 107
Total ................ 3,060 2,505 2,437 1,068 1,030
Unit value (per square) 2/
Canada ...... ; ............ $39.01 $38.02 $37.84 $44.36 $26.04 Bahamas .................. 47.58 50.98 57.17 57.47 37.19 Jamaica .................. 73.78 56.46 72.57 56.89 55.92 French Pacific Islands ... 57.26 76.14 39.95 All other .... : ........... 54.29 52·. 98 39.35 45.63 33.58
Average.· ............. 45.18 41. 61 39.53 45.25 28.09
!/ Less than 500 squares. ~/ Unit values are calculated from unrounded figures.
Source: Compiled from official statistics of the U.S. Department of Commerce.

A-13
wages increased yearly from $14,030 per worker in 1985 to $15,843 per worker .in 1987, as shown in the following tabulation:!/~/ ·
Average annual wages Number of workers Total wages Eer worker
Year Wash. Oreg. Total Wash. Oreg. Total Wash. Oreg. ~ --- ------(1,000 dollars)--- ------(Dollars)------
1985 .. 1,262 295 1,557 18,629 3,215 21,844 14,761 10,899 14,030 1986 .. 1,425 277 1,702 22,343 3,477 25,820 15,679 12,553 15,170 1987 .. 1,588 318 1,906 26,026 4,172 30,197 16,389 13, 119 15,843
Employment data were obtained by questionnaire from about 30 U.S. shake and shingle producers that in 1987 accounted for 24.9 percent of the number of workers as reported by State employment services and shown in the above tabulation. The number of production workers employed at the reporting · establishments increased by 40.1 percent, from 339 in 1985 to 475 in 1987, then declined by 17.2 percent to 367 in January-June 1988 from 443 in Ja~uary-June 1987 (table 3). Hours worked by those employees increased by 43. 9 percent, from 410, o·oo hours in. 1985 to. 590, 000 hours in 1987, but declined by 24.8 percent in January-June 1988 from hours worked in January-June 1987. 11 Total wages paid by the responding firms increased by 52.3 percent from 1985 to 1987, then dropped by 24.1 percent in January-June 1988· from the corresponding 1987 period. Average hourly wages rose by 5.9 percent from $11.02 in 1985 to $11.67 in 1987. ~/ Total compensation increased by 46.0 percent from 1985 to 1987, and rose on an hourly basis from $12.25 to $12.45. Productivity was relatively constant during 1985-87 and then increased by 18.2 percent from January-June 1987 to January-June 1988.
!/ These data, provided by the States' employment service offices, are for SIG 2429, special 'produ~t sawmills, which may include some data applicable to the cooperage industry. ~/Employment increased by 25.8 percent from the 18-month period prior to the duty to the 18-month period following imposition of the duty (Hearing brief in support of continuing relief, p. 5). 11 According to industry sources, a shake production line, requiring two or three men, can produce about 30 to 35 squares per 8-hour shift; a shingle line, requiring two men, can produce about 20 to 35 squares per 8-hour shift (see USITC Publication 1826, March 1986, p. A-5). ~/ Some producers reported that, prior to imposition of the temporary duty, they had reduced employee wages and/or benefits to cut costs and_ continue operation (see, e.g., transcript, p. 54). Mr. Jones, owner of Jones Shake Mill, Marble Mount, WA, stated at the hearing that his firm in the last 2 years has given 6 percent raises, restored medical benefits, and instituted a bonus attendance plan for employees (transcript, p. 36). Other firms reported in que~tionnaire responses that, subsequent to the temporary duty, they restored wages and/or benefits that they had cut prior to the duty.

A-14
Table 3 Western red cedar shakes and shingles: U.S. production and related workers, hours worked, and wages and total compensation paid, 1985-87, January-June 1987, and January-June 1988
January-June--Item 1985 1986 1987 1987 1988
Number of workers ........... 339 440 475 443 367 Hours worked (thousands) .... 410 577 590 298 224 Wages paid (1,000 dollars) .. 4,612 6,506 7,026 3,388 2,573 Total compensation (1,000
dc;>llars) .................. 5,167 6,709 7 ,,542 3,518 2, 712 Average hourly wages ........ $11. 02 $11. 07 $11. 67 $11. 46 $11. 68 Average hourly total
compensation .............. $12.25 $11. 32 $12.45 .$11. 89 $12.32 Productivity (squaresjhour). 1. 2 1.1 1.2 1.1 1. 3
Source: Compiled from data submitted in respon~e to questionnaires of the U.S. International Trade Commission.
Financial experience of U.S. producers
Forty-four producers, accounting for 32 percent of estimated U.S. production of western red cedar shakes and shingles in 1.987, .!./ furnished usable financial information on their overall establishment and shake and shingle operations. Forty-two of the 44 firms produce mainly shakes and/or shingles in their establishments; hence, financial data only on shake and shingle operations are presented in this report.
Income-and-loss data are shown in table 4. One firm suspended its operation in 1985. Two firms started their shake and shingle operations in 1986 and four others opened in 1987. Aggregate net sales of red cedar shakes and shingles rose by 78 percent, from $28.1 million in 1985 to $49.9 million in 198?. During the interim periods ended March 31, net sales declined by 12 percent, from $7.1 million in 1987 to $6.2 million in 1988.
In 1985, the reporting firms sustained an aggregate net loss of $681,000, equivalent to 2.4 percent of sales. In 1986 and 1987, U.S. producers of red cedar shakes and shingles experienced their most profitable years since 1980. U.S. firms reported a pre-tax net income of $3.8 million, or 9.5 percent of net sales in 1986 and $4.4 million, or 8.8 percent of net sales in 1987. During the interim period ended March 31, 1988, net income before income taxes increased to $507,000, or 8.2 percent of net sales, compared with $422,000, or 6.0 percent of net sales, in the corresponding period of 1987 .
.!./ Coverage in this section of the report generally exceeds coverage in other sections that utilize questionnaire data because several companies that did not provide questionnaire data submitted financial statements and income tax forms that contained sufficient detail to be used in lieu of such data.

A-15
Table 4 Income-and-loss experience of U.S. producers !/ on their operations producing western red cedar shakes and shingles, accounting years 1985-87, and interim periods ended Mar. 31, 1987, and Mar. 31, 1988
Item
Net sales .............. . Other income or
(expense) 11 · ........ . Total sales and
other income ..... . Operating expenses:
Cost of wood and other materials .... .
Labor !±_/ .. ........... . Fuel and energy ...... . Interest expense ..... . Depreciation ......... . All other expenses ... .
Total operating ex-penses ............ .
Net income or (loss) before income taxes ...
Cost of wood and other materials ............ .
Labor .................. . Fuel and energy ........ . Interest expense ....... . Depreciation ........... . All other expenses ..... .
Total operating ex-penses ............. .
Other income or (ex-pense) .......... · ..... .
Net income or (loss) before income taxes .....
Net losses ............. . Data!/£/ ............. .
1985
28,068
318
28,386
15,580 6,468
562 540 668
5,249
29,067
(681)
55.5 23.0 2.0 1. 9 2.4
18.7
103.6
1.1
(2.4)
21 37
1986 1987
Interim period ended Mar. 31--2/ 1987 1988
Value (1,000 dollars)
39,527
385
39,912
19,386 8,390
664 462 739
6,504
36,145
3,767
49,931
500
50,431
26,133 10,759
795 435 944
6,956
46,022
4,409
7,059
(7)
7,052
3,417 1,491
123 88
141 1,370
6,630
422
Share of net sales (percent)
49.0 21. 2 1. 7 1. 2 1. 9
16.5
91. 4
1. 0
9.5
52.3 21. 5 1. 6 0.9 1. 9
13.9
92.2
1. 0
8.8
48.4 21.1
1. 7,
1.2 2.0
19.4
93.9
(0.1)
6.0
Number of firms reporting
13 40
6 44
4 18
6,180
4
6,184
2,986 1, 213
116 77
166 1, 119
5,677
507
48.3 19.6
1. 9 1. 2 2.7
18.1
91. 9
0.1
8.2
8 21
!/ One producer's operation was shut down in. 1985. T·wo and four producers commenced operations in 1986 and 1987, respectively. £/Three producers started their operations after Mar. 31, 1987. Data for one producer are for its entire fiscal year ended Mar. 31. 11 For some producers, this line item includes net income from chip sales, log sales, and hog fue.1. !±_! Labor includes officers' salaries for some of the companies ..
Source: Compiled from data submitted in response to questionnaires of the U.S. International Trade Commission.

A-16
Selected individual operating expenses are also presented in table 4. These data show that wood and other materials are the major cost item. Such costs declined from 55.5 percent of net sales in 1985 to 49.0 percent in 1986, but then increased to 52.3 percent in 1987. These costs remained steady at about 48.0 percent during both interim periods. The second major expense is labor, which includes officers' salaries for some firms. This cost, as a share of net sales, decreased from 23.0 percent in 1985 to 21.5 percent in 1987, and further declined to 19.6 percent in interim 1988. Officers' salaries may fluctuate during each year based on an individual firm's financial performance and an individual officer's tax status. Fuel and energy, interest expense, and depreciation are not significant expenses in relation to net sales. Such expenses each varied between a low of 0.9 percent and a high of 2.7 percent during the periods for which data were collected. All other operating expenses, which include repairs and maintenance, inspection fees, taxes and licenses, insurance, telephone, supplies· and postage, dues and subscriptions, accounting and legal, and other general and administrative expenses, fluctuated between 14 and 19 percent of net sales during 1985 to interim 1988. Other income or expense items, which include net income from chip sales, log sales, and .hog fuel for some producers, and other miscellaneous income or expenses like rental income, any gain or loss on disposal of fixed assets, interest or dividend income, and so forth, increased from $318,000 in 1985 to $500,000 in 1987.
The number of firms reporting net losses fell from 21 of 37 in 1985 to 6 of 44 in 1987. During the interim period ended March 31, 1988, the number of firms reporting net losses was 8 of 21, compared with 4 of 18 in the corresponding period of 1987.
* * * * * * *
Financial condition and rate of return of.U.S. producers.--Selected financial information for 39 of 44 U.S. producers that provided income-and-loss data in 1987 are presented in table 5. These 39 firms represented about 30 percent of U.S. production of cedar shakes and shingles in 1987.
Total assets of the responding firms increased by 38 percent, from $6.9 million in 1985. to $9. 5 million in 1987. During the interim period ended March 31, 1988, aggregate assets of reporting firms fell by 13 percent to $2.4 million from.$2.8 million in the corresponding period of 1987.
Total capital or stockholders' equity rose by more than fourfold, from $605,000 in 1985 to $3.3 million iri 1987. Aggregate capital of reporting firms increased by 150 percent, from $109,000 in the interim period ended March 31, 1987, to $272,000 in the corresponding period of 1988.

A-17
Table 5 Selected financial information of U.S. producers l/ on their operations producing western red cedar shakes and shingles, accounting years 1985-87, and interim periods ended Mar .. 31, 1987, and Mar. 31, 1988
Item
Net sales (1,000 dollars)~ .. ~ Net income or (loss)
before income taxes ( 1, 000 dollars) ........... .
Total assets "}_/ (1,000 dollars) ........... .
Total liabilities "}_/ (1,000 dollars) ........... .
Capital or stockholders' equity"}_/ (1,000 dollars) ..
Debt-to-equity ratio (times). .Ratio of net income or
(loss) before income taxes to--
Net sales (percent) ..... . Total assets (percent) .. . Capital or stockhold-
ers' equity (percent) .. Number of firms report- .
ing data l/ ~/ ............ .
1985
24,731
(1,167)
6,869
6,264
605 10.3
(4.7) (17.0)
(192.9)
32
1986
32,844
2,040
8,291
6,729
1,562 4.3
6.2 24.6
130.6
35
1987
40,954
2,507
9,469
6,129
3,340 1. 8
6.1 26.5
75.1
39
Interim period ended Mar. 31--2/ 1987 1988
6,471
284
2,796
2,687
109 24.7
4.4 10.2
260.6
15
5,233
152
2,428
2,156
272 7.9
2.9 6.3
55.9
18
l/ One producer's operation was shut down in 1985. Two and four producers commenced operations in 1986 and 1987, respectively. ~/Three producers started their operations after Mar. 31, 1987. Data for one producer are for its entire fiscal year ended Mar. 31. "}_/ These data are as of the end of the fiscal periods.
Source: Compiled from data submitted in response to questionnaires of the U.S. International Trade Commission.
The debt/equity ratio is computed to determine the debt-paying ability of an entity. Further,. this ratio helps to determine how well creditors are protected in case of insolvency of a company. The debt-to-equity ratio of the responding firms decreased from 10.3 in 1985 to 1.8 in 1987, and from 24.7 in interim 1987 to .7.9 in interim 1988.
Additional measures of profitability include return on total assets and return on capital or stockholders' equity. Return on total assets turned around from a negative.17.0 percent in 1985 to a positive 24.6 percent in 1?86. This ratio increased to a positive 26.5 percent in 1987. The ratio dropped to 6.3 percent in interim 1988 from 10.2 percent in interim 1987. Return on capital or stockholders' equity showed a similar trend, except in 1987 when capital increased significantly. Except for a slight increase in the return on total assets in 1987, both ratios· followed a trend similar to the trend for the ratio of net income or loss to net sales.
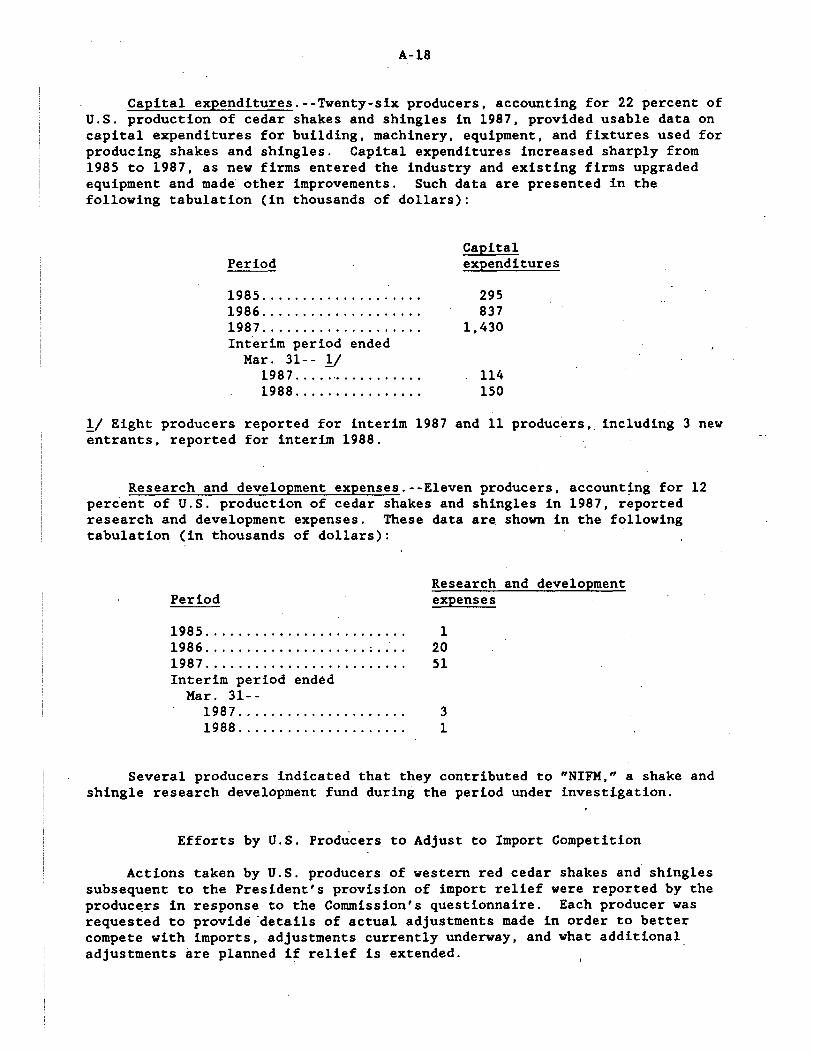
A-18
Capital expenditures.--Twenty-six producers, accounting for 22 percent of U.S. production of cedar shakes and shingles in 1987, provided usable data on capital expenditures for building, machinery, equipment, and fixtures used for producing shakes and shingles. Capital expenditures increased sharply from 1985 to 1987, as new firms entered the industry and existing firms upgraded equipment and made other improvements. Such data are presented in the following tabulation (in thousands of dollars):
Period
1985 ................... . 1986 ................... . 1987 ................... . Int.erim period ended
Mar. 31-- !/ 1987 ................ . 1988 ............... .
Capital expenditures
295 837
1,430
114 150
!/ Eight producers reported for interim 1987 and 11 producers, including 3 new entrants, reported for interim 1988.
Research and development expenses.--Eleven producers, accounting for 12 perc.ent of U.S. production of cedar shakes and shingles in 1987, reported research and development expenses. These data are shown in the following tabulation (in thousands of dollars):
Period
1985 ........................ . 1986 .................... ; .. · .. 1987 ........................ . Interim period ended
Mar. 31--1987 .................... . 1988 .................... .
Research and development expenses
l 20 51
3 l
Several producers indicated that they contributed to "NIFM," a shake and shingle research development fund during the period under investigation.
Efforts by U.S. Producers to Adjust to Import Competition
Actions taken by U.S. producers of western red cedar shakes and shingles subsequent to the President's provision of import relief were reported by the producers in response to the Commission's questionnaire. Each producer was requested to provide ·details of actual adjustments made in order to better compete with imports, adjustments currently underway, and what additional adjustments are planned if relief is extended.

A-19
Thirty-three of the 73 responding mills did not report making any adjustments subsequent to the implementation of import relief, nor did they report future plans for adjustments. Forty miils responded that adjustments have been made and/or are currently underway. Fourteen mills have plans for adjustments should relief be extended.
Adjustments made by the mills range from basic building maintenance and upgrading of equipment to the building of an·entirely new mill with all new equipment. !/ Seven producers built new mills and purchased new equipment, at costs ranging from $15,000 to $60,000. An additional two mills merely relocated in order to be closer to their wood supply and thereby reduce transportation costs. One mill relocated next to the cedar. lumbermill from which it purchases raw material. Another mill relocated to Alaska.
The most common adjustment made by producers was the purchase and installation of additional saws such as automatic (shake) saws, handsaws, flatsaws, tapersaws, and shingle machines. Automatic saws were favored by 17 mills buying one or more at prices ranging from $11,000 to $26,000. Another three mills plan to purchase an automatic saw should.relief be extended. Automatic saws can increase production and be operated by an unskilled operator in place of a skilled sawyer at lower wages and lower insurance costs. There presently is a shortage of trained sawyers, as many sawyers left the industry due to uncertainty of employment in the period prior to the imposition of relief.
Shingle machines were also popular, with five mills purchasing one or. more and another five mills planning to buy one should relief be extended. Prices for shingle machines range from $10,000 to $16,000. Shingle machines allow the producer to utilize a lower grade of log that is unsuitable for use in shake production. Whereas shingles can be easily manufactured from low quality logs or bolts, shake manufacture requires higher quality wood. In recent years, competition from lumbermills and foreign purchasers of logs has forced the mills to frequently buy wood of inferior quality. Thirteen mills bought a variety of saws such as handsaws, tapersaws, ridgesaws, flatsaws, or cut-off saws at a cost of $2,000 to $10,000 per saw. Producers feel these saws make their production more.efficient ~nd involve less waste of wood.
Seven $8,000 and each log. Log decks log decks the price
mills installed shake splitters. Splitters cost from $6,000 to are able to split thinner shakes, thus increasing the yield from Three mills plan to install a splitter should relief be extended.
were installed by eight mills at a cost of $8,000 to $40,000. The enable producers to use both logs and salvage bolts. ~/ Depending on of the raw material, the producers can switch back and forth between
!/ Parties opposed to continued relief contend that because of the declining red cedar resource, 'adjustment measures that involve new capital investment in facilities to ma~ufacture red cedar shakes and shingles are pointless. Such measures allegedly do nothing to adjust to the imminent depletion of the old-growth resource (Fraser Valley posthearing brief, p. 6). ~/ Parties in support of continued relief state that, as a result of the high price of shakes and shingles today, there is a much higher utili'zation of red cedar bolts that can be obtained from salvaging logging operations, which could not be economically justified under pretariff prices (Posthearing brief in support of continuing relief, pp. 2-3).

A-20
the two. Four mills upgraded their shingle machines by converting them to hydraulic controls. This results in fewer breakdowns, ·decreases maintenance costs, and reduces downtime. The process costs from $4,000 to $12,000.
Three mills built sawmills at costs from $8,000 to $45,000 to be able to saw logs that are too small for shake and shingle production and otherwise would be hauled away at a high cost. An additional mill has plans to build a sawmill should the relief be extended. Wood chippers, often referred to as "hogs," were installed by three producers. ·The wood chipper .allows the mill to produce a marketable by-product from its wood waste (hog fuel) that otherwise would be dumped or burned on site. The dramatic rise in the price of logs has resulted in many shake and shingle producers· making efforts to use all scraps of wood, even what was previously destined for the burner.
The most potentially far-reaching plans for adjustment should relief be extended are those of two large mills that hope to build treatment plants. Fire-retardant treatment cari add 50 percent to the consumer price of shakes and shingles. By treating their own shakes and shingles, the mills could lower the price to the end user and capture additional sales and profits.
A fundamental problem the shake and shingle industry faces is an increasingly-short supply of old.growth western red cedar logs. Because old growth cedar on private lands is nearly depleted, U.S. producers are largely dependent on public lands. The Northwest Independent Forest Manufacturers (NIFM) entered into an agreement with the U.S. Forest Service Forest Products Laboratory to jointly sponsor research into the development of preservatively treated and fire-resistant hemlock and western whitewood shakes and shingles. The research is being jointly funded by the industry and Federal Government. The U.S. Forest Service Lab in Madison, WI, is heading the research activities, with field testing areas in Louisiana, Texas, Oregon, and Idaho.
At the hearing, testimony given by Mr. Robert Koeppen on behalf of the U.S. Forest Service reported on the status of the ongoing research. Tests were begun in November 1986 using oilborne and waterborne preservative and fire-retardant treatments on shingles and tapersawn shakes made from hemlock and pacific fir. These whitewoods, particularly hemlock, are not as highly esteemed species as western red cedar and consequently are relatively underutilized. Oilborne treatments are preferred because they do not leech out of the wood, and because of their high flash point and a·bility to reduce splitting. Shingles were found to be unprofitable due to their excessive curling and splitting and therefore were dropped from further research. The thicker tapersawn shakes performed better, although not perfectly. Western red alder and pine were also tested and found to produce a satisfactory shake that is readily treated. Mr. Koeppen stated that the lab feels it has developed a patentable process of treatment for fire retardant and wood preservative and hopes to have a marketable product ready for commercial use sometime after 1991. !/
!/ Transcript, pp. 6-15.

~
A-21
Testimony at the hearing from parties opposed to continued relief disputed the utility of such research. Mr. James Arthurs, Co-Chairman of the Fraser Valley Independent Shake & Shingle Producers Association, after conducting his own tests, believes the structural integrity of these alternative species to be far inferior to that of red cedar. He alleged that the overwhelming majority of western hemlock and Pacific and Douglas fir logs do not split properly and, as a result, cannot be made into handsplit shakes. He further alleged that shakes and shingles produced from such species are highly susceptible to splitting, checking, decay, and rot after a short period of exposure on a roof. Hemlock and fir also weigh close to three times as much as cedar and their use would therefore increase the already high transportation and building costs. Mr. Arthurs contends that none of the available preservatives are chemically compatible with the fire-retardant treatments. Further, the Evironmental Protection Agency and American Wood Preservers Association have stringent testing and approval requirements that must be met before a new preservative can be marketed. During the hearing he stated several times his concerns about the nature of the research conducted by the u."s. Forest Service and the difficulty of marketing a new species to consumers accustomed to red cedar. !/
Canadian Shipments of Shakes and Shingles
Counsel for -the Fraser Valley Independent Shake & Shingle Producers Association provided shipment and export data to the Commission for red cedar shakes and shingles manufactured in Canada. ~/ The Canadian shake and shingle mills are all located in British Columbia. 3/ Total shipments of Canadian red cedar shakes and shingles 4eclined by 21.0 percent, from 4.8 million squares in 1985 to 3.8 million squares in 1987 and are projected to decline to 3.5 million squares in 1988, or by an additional 7.4 percent. 4/ Shipments in the Canadian home market declined from 578,000 squares in 1985-to 457,000 squares in 1987 and are projected to decline to 423,000 squares in 1988.
According to the Canadian data, total exports declined by 21.0 percent, from 4.2 million squares in 1985 to 3.3 million squares in 1987. ~ Exports are projected to decline to an estimated 3.1 million squares in 1988. Exports to the United States accounted for 94.2 percent of total exports in 1985, 99.5
!/ Ibid., pp. 113-122. ~/ Letter of Aug. 29, 1988. Counsel obtained data from Dr. Jock Dobie of Statistics Canada. Dr. Dobie used export shipments to estimate total shipments, assuming that exports accounted for 88 percent of total shipments in each period. Thus, trends for home-market and total shipments mirror the trend for total exports. 11 Transcript, p. 113. ~/ In the last 2 years, several large firms, including Classic Shake & Shingle (now reorganized as "Interfor"), Canadian Forest Products, Ltd.'s Huntington Merritt Division, and Stave Cedar Lake Mills, Inc. (formerly s~c. Forest Products, Ltd.), permanently closed shake and shingle mills that had an aggregate annual capacity of 700,000 squares (Fraser Valley prehearing brief, p. 24, and transcript, p. 126). ~/According to U.S. Department of Commerce statistics, U.S. imports of red cedar shakes and shingles declined by 18.1 percent from 1985 to 1987.

A-22
percent in 1986, and 97.7 percent in 1987, as shown in the following tabulation (in thousands of squares):
Item
Total shipments ............. . Home-market shipments ....... . Exports to--
United States ............. . All others ................ .
Total ..................... .
.!/ Projected.
1985
4,818 578
3,993 247
4,240
~/Estimated by Commission staff.
1986 1987
4,544 3,805 545 457
3,978 3,270 21 78 ---
3,999 3,348
U.S. Imports and Market Penetration
U.S. imports
1988 y
3,524 423
y 3,008 y 93
3,101
U.S. imports of western red cedar shakes and shingles, nearly all of which were from Canada, increased by 2.3 percent, from 4.0 million squares in 1985 to 4.1 million squares in 1986, then declined by 20.0 percent .to 3.3 million squares in 1987 (table 6). Imports continued to decline in January-June 1988, dropping 0.9 percent from the level of imports in January-June 1987. Y Shakes and shingles of western red cedar accounted for about 80 percent of the total imports of all wood shakes and shingles during 1985-87. The ratio of imports to U.S. production declined from 243.1 percent in 1985 to 191.9 percent in 1986 and to 146.9 percent in 1987. The ratio of imports to production increased from 138.0 percent in January-June 1987 to 143.5 percent in the corresponding period of 1988.
Imports of shakes and shingles of wood other than western red cedar followed a similar trend, increasing 21.2 percent from 1985 to 1986 ·and then declining by 20.2 percent from 1986 to 1987. Such imports continued to fall in January-June 1988, dropping 27.0 percent from the level of imports in January-June 1987.
Market penetration
Imports of western red cedar shakes and shingles supplied a large but decreasing share of the U.S. market during 1985-87. The share of the market supplied by imports declined from 71.7 percent in 1985 to 66.4 percent in 1986 and to 60.2 percent in 1987 (table 7). During January-June 1988, the market
y Imports declined_~rom 6.4 million squares during the 18-month period prior to imposition of the temporary duty to 5.0 million squares in the 18-month period following imposition of the duty, or by 22.1 percent.

A-23
Table 6 Wood shakes and shingles: U.S. imports for consumption, from Canada and all other sources, by types of wood, 1985-87, January-June 1987, and January-June 1988
January-June--Item 1985 1986 1987 1987 1988
guantity ~1.000 sguares) Western red cedar:
Canada ............... 3,993 4,086 3,270 i, 521 1,507 All other ............ 2 1 1 lL lL
Total .............. 3,9?4 4,088 3,271 1,521 1,507 Other:
Canada ................ 887 1,066 858 507 3"69 All other ............ lL 9 lL lL 1
Total .............. 887 1,075 858 507 370 Total:
Canada ............... 4,880 5,152 4,127 2,028 1,876 All other ............ 2 10 1 1 1
Total .. · ...... : .. : .. 4,882 5,162 4,129 2,028 1,877
Value (1,000 dollars~ 2L Western red cedar:
Canada .............. 156,816 175,632 162,961 72 ,856 88,981 All other ........... 62 53 49 26 16
Total ............. 156,879 175,685 163,010 72' 882 88,997 Other:
Canada .............. 22,544 25,897 22,508 11, 968 11, 533 All other ........... 19 57 30 19 40
Total; ............ 22,564 25,954 22,538 11, 987 ll,573 Total:
Canada .............. 179,361 201,529 185,469 84,824 100,514 All other ........... 82 110 79 45 56
Total ............. 179 ,442 201,639 185,548 84,869 100,570
Unit value ~Eer sguare~ Western red cedar:
Canada .............. $39.28 $42.98 $49.84 $47.90 $59.05 All other ........... 34.76 53.00 49.00 55.82 63.93
Average ........... 39.28 42.98 49.84 47.92 59.06 Other:
Canada ............... 25.42 24.30 26.24 23.61 31. 26 All other ........... 65.64 3L 6.32 94.09 3L 137.18 45.22
Average ........... 25.43 24.15 26.27 23.64 31. 29 Average:
Canada .............. 36.76 39.12 44.94 41.83 53.58 All other ........... 39.13 11.00 79.00 60.93 56.00
Average ........... 36.76 39.06 44.94 41.85 53.58 ;.
!/ Less than 500 squares. ~/ Landed duty-paid value. Values for western red cedar shakes and shingles include the temporary duties imposed by the Presidential proclamation that became effective in June 1986. 1/ These values reflect apparent reporting errors.
Source: Compiled from official statistics of the U.S. Department of Commerce.

A-24
Table 7 Western red cedar shakes and shingles: Shares of U.S. consumption supplied by U.S. production and U.S. imports, 1985-87, January-June 1987, and January-June 1988
Item
Share of consumption supplied by--
U.S. production ..... . U.S. imports ........ .
Total ............. .
Share of consumption supplied by- -
U. S.. product ion ..... . U.S. imports ........ .
Total .............. .
1985
28.3 71. 7
100.0
27.5 72.5
100.0
1986
33.6 66.4
100.0
35.4 64.6
100.0
1987
Percent of quantity
39.8 60.2
100.0
Percent of value
41. 9 58.1
100.0
January-June--1987 1988
41. 5 58.5
100.0
44.4 55.6
100.0
40.2 59.8
100.0
43.5 56.S
100.0
Source: Compiled from data supplied by shakes and shingles inspection bureaus and from official statistics of the U.S. Department of Commerce.
share supplied by imports increased to 59.8 percent, up from 58.5 percent in January-June 1987. !/
Prices
Wood shakes and shingles are generally sold on an f.o.b. mill basis: Prices are determined by negotiation between buyers and sellers and frequently change daily. Price data, compiled from information obtained from surveying firms in the industry, are published in the Random Lengths' Weekly Lumber Price Guide. These published prices are often used as a reference point in price negotiations between buyers and sellers of both domestic and Canadian western red cedar shakes and shingles. Some manufacturers reportedly sell strictly at the Random Lengths' price. ~/
!/ U.S. market share supplied by imports declined from 72.8 percent during the 18-month period prior to imposition of the temporary duty to 59.2 percent during the 18-month period following imposition of the duty, a decline of 18.7 percent. The market share supplied from U.S. production increased from 27.2 percent to 40.8 percent during those periods, an increase of 50.0 percent. £1 Random Lengths' data include a single.price for both U.S.-produced and Canadian shakes and shingles that are sold in the U.S. market. The Canadian prices included in the Random Lengths' data include the 35 percent ad valorem tariff.

A-25
Published prices for the period January 1985 to June 1988 for the two largest selling shakes and the two largest selling shingles are presented in table 8. These products,account for the majority of shakes and shingles sold in the United States: !/
Product 1: #l, 1/2" x 24" handsplit and resawn western red cedar shakes
Product 2: #l, 3/4" x 24" handsplit and resawn western red cedar shakes
Product 3: #l, (blue label), 5X (16-inch) western red cedar shingles
Product 4: #l, (blue label), Perfection (18-inch) western red cedar shingles
Product 1 accounts for approximately 70 percent of western red cedar shakes sold in the United States, and product 2 accounts for roughly 20 percent. Products 3 and 4 account for 25 and 41 percent, respectively, of the western red cedar shingles sold in the United States. ij
Price trends
The prices publisqed by Random Lengths are f.o.b. wholesale prices based on telephone surveys of numerous U'.S. and Canadian producers of wood shakes and shingles. The prices are for both domestic and Canadian wood shakes and shingles 11 that are sold in the.United States and are weighted by the volume sold. The prices for all four products fluctuated but increased overall during the period January 1985 to June 1988. ~/.Prices for product l, #l, 1/2" x 24" western red cedar shakes, increased 88 percent, from $37.00 per square in January-March 1985 to $69.50 in April-June 1988. Prices for product 2, #l, 3/4" x 24" western red cedar shakes, increased 83 percent, rising from $43.83 per square in January-March 1985 to $80.25 per square in April-June 1988.
!J Questionnaires with usable, purchase prices were received from only a few wholesalers, therefore no reliable purchase price series based on questionnaires can be presented. Prices submitted by wholesalers were consistent with Random Lengths' data. y Estimates of product share of total sales in the U.S. market are based on the Red Cedar Shingle & Handsplit Shake Bureau's production reports for 1985, 1986, and 1987. 11 Random Lengths does not publish separate price series for domestic and Canadian red cedar shakes and shingles. 4/ Random Lengths' price data for wood shakes and shingles are reported on a weekly basis. Quarterly prices were calculated by taking a simple average of the prices for the 3 months in each quarter.

A-26
Table 8 Published prices of western red cedar shakes and shingles sold in the United States, net f .o.b. mill, by quarters, January 1985-June 1988
(Per square) Yes tern Ye stern red cedar shakes 1/ red cedar shingles 2/
Period Product 1 Product 2 Product 3 Product 4
1985: Jan. -Mar .. · ...... $37.00 $43.83 $41.08 $43.17 Apr. -June ....... 36.67 43.50 44.25 48.50 July-Sept ....... 37.42 46.25 52.17 49.67 Oct-Dec ......... 38.67 47.83 49.33 42.92
1986: Jan.-Mar ........ 39·, 17 46.75 43.58 45.92 Apr.-June ....... 41. 75 51. 33 50.50 54.58 July-Sept ....... 47.42 59.25 49.33 58. 92. Oct-Dec ......... 60.'42 68.75 57.92 63.50
1987: Jan.-Mar ........ 54.17 64.00 54.08 59. 75 .. Apr. -June ....... 51. 50 61. 50 . 57 .42 62.50 July-Sept ....... 54.00 64.92 65.67 72.00 Oct-Dec ......... 55.25 69.58 . 67 .17 68.75
1988: Jan.-Mar ........ 60.92 71. 50 66.67 73.83 Apr.-June ....... 69.50 80.25 83.00 . 90. 75
Y Product Product 2: y Product Product 4:
1: #l, 1/2" x 24" handsplit and resawn western red cedar shakes. #l, 3/4" x 24" handsplit and resawa western red cedar shakes.
3: #l, (blue label), 5X (16-inch) western red cedar shingles. #l, (blue label), Perfection (18-inch) western red cedar shingles.
Source: Random Lengths' Lumber Price Guide.
The prices for the two western red cedar shingle products also had large overall increases during the period. Prices for product 3, #l, 5X (blue label) shingles, increased 102 percent during the period, rising from $41.08 per square in January-March 1985 to $83.00 per square in April-June 1988. In April-June 1988, prices for product 4, #l (blue label) Perfection (18-inch) shingles, were also more than double the level in January-March 1985; prices increased 110 percent from $43.17 per square to $90.75 per square during .the period.
Factors affecting the shake and shingle market
Stumpage prices.--U.S. production of shakes and shingles is conc~ntrated in the Pacific Northwest region of the United States, and a large portion of the red cedar logs used by U.S. shake and shingle producers comes from National Forests in this area. The prices paid for stumpage on public land are generally determined ,during open auctions, involving either oral or sealed

A-27
bids, with the sale being awarded to the highest bidder. These bid prices are available from the U.S. Forest.Service and from most public owners, by region and species. The stumpage purchased is usually sold under contracts lasting from 3 to 5 years in duration. The stumpage is not harvested immediately, rather under the contract it is usually harvested over a 3- to 5-year period. Due to the nat~re of these contracts, the prices bid are reflective of expected future market conditions. l/ Therefore, the stumpage prices are not representative of prices currently being paid for timber harvested even though they often serve as a point of reference.
Average stumpage prices published by the U.S. Forest Service for cedar sold in the Pacific Northwest region are presented in table 9. During the period of January 1985 to June 1988 bid prices for stumpage 'fluctuated dramatically. Stumpage prices increased irregularly from $140.40 per thousand board feet in January-March 1985 to $350.90 per thousand board feet in July-September 1987. In the fourth quarter of 1987 average stumpage prices decreased to $141.80 per thousand board feet .
. Log prices.--Cedar logs are the most important input to producers of shakes and shingles. ~/ 11 Price data for cedar logs is compiled by several· different sources that rely on surveys, either telephone or written, of mills. "Because of this, log prices vary from source to source; however, most demonstrate overall increases ·in log prices in the past few years. The
l/ See USITC Publication 1826, March 1986, p. A-63. ~/ Cost of wood to U.S. producers of shakes and shingles was about 50 percent of net sales during 1985-87 (see table 4). 1J U.S. producers of shakes and shingles use red cedar logs that are grown in the northwestern region of the United States. Since June 1986, there has been a total ban on exports of Canadian red cedar logs; thus, u .. S. producers of shakes and shingles must rely on the supply of red cedar logs in the United States.

A-28
Table 9 Average prices of cedar stumpage !/ sold by the U.S. Forest Service, by quarters, January 1985-June 1988
Period
1985: Jan. -Mar .............. . Apr. -June ............. . July-Sept ............. . Oct-Dec ............... .
1986: Jan. -Mar ....... ; ...... . Apr. -June .............. . July-Sept ............. . Oct-Dec ............... .
1987: Jan. -Mar .............. . Apr. ~June ......... • ... . July-Sept ............. .
- Oct-Dec· ............. : .. 1988:
Jan. -Mar .............. . Apr. -June ....... · ...... .
Price 2/
$140.40 109.80 117.10 129.20
105.50 208.90 l,55.70 156.10
120.60 180.60
y 350.90 141. so·
!/ Predominantly western red cedar.
Index
100.00 78.21 83.40 92.02
75.14 148.79 110. 90 111.18
85.90 128.63 249.93 101. 00
~ Prices for stumpage are reported in dollars per thousand board feet. Y This price is unusually high because of an abnormally large volume of Port Orford and Alaskan cedar stumpage sold in this quarter. These species are considerably more expensive than western red cedar. !!J Not available.
Source: Statistics of the U.S. Forest Service.

A-29
following tabulation shows western red _cedar pond values !J for the three grades of cedar used in shake and shingle production sold from the Olympic National Forest (per thousand board feet):'!:./
Date
April 1983 ........ . June 1983 ......... . October 1983 ...... . April 1984 ........ . June 1984 ......... . October 1984 ...... . November 1984 ..... . March 1985 ........ . October 1985 ...... . December 1985 ..... . March 1986 ........ . December 1986 ..... . March 1987 ........ . May 1987 ........... . July 1987 ......... . August 1987 ....... . November 1987 ..... .
·February 1988 ..... . May 1988 .......... . July 1988 ......... .
Grade 1
$389 403 441 501 508 534 460 452 425 433 410 400 453 468 516 535 559 577 456 448
Grade
-$302 304 319 375
.384 362 362 363 307 353 368 318 361 373 411 426 445 460 362 356
2 Grade 3
$255 263 275 310 331 277 277 251 274 261. 238 242 273 282 311 322 337 348 278 274
Prices for all three grades of red cedar logs increased irregularly from April 1983 to July 1988. Prices for red cedar logs in the Puget Sound Area of Washington State are· published in the Pacific Rim Log Market Reports; prices for all three grades nearly doubled during the period November 1985 to May 1988. ~/
Shake and shingle production in Canada is concentrated in British Columbia. Three grades of red cedar logs are used.to produce shakes and shingles in Canada--grades K, L, and M. W'eighted_-average log prices for wes~ern red cedar logs sold in the Vancouver, British Columbia, market are compiled by the Ministry of Forests. The log prices for red cedar sold in the Vancouver area are based on copies of invoices of log producers for their sales to Canadian shake and shingle producers. Prices for cedar logs sold in Vancouver fluctuated during the period January 1985 to June 1988 but
!/ The pond value of logs is the value of the log delivered to the mill. '!:j These prices are based on market surveys of mills' actual payments· for cedar logs. 1f Prices for grade 1 cedar logs increased from $375-$425 in November 1985 to $600-$800 in May 1988. Prices for grade 2 and grade 3 cedar logs increased
·during the same period from $300-$325 and $260-$280 to $500-$600 and $375-$450, respectively. (Fraser Valley prehearing brief, table 4, .p. 16, compiled from Pacific Rim Log Reports.)

A-30
registered an overall increase of 43 percent (table 10). .Prices for wood shakes and shingles, both domesti~ and Canadian, rose at a fairly steady rate, increasing 88 percent during the period. !/
Table 10 Composite U.S. prices for western red cedar shakes and shingles and prices of western red cedar logs sold in British Columbia, by quarters, Jan~ary 1985-June 1988
Period
1985: Jan.-Mar .......... Apr. -June ......... July-Sept ......... Oct-Dec ...........
1986: Jan.-Mar .......... Apr.-June ......... July-Sept ......... Oct-Dec ...........
1987: Jan.-Mar .......... Apr. -June ......... July-Sept ......... Oct. -Dec ..........
1988: Jan. -Mar .......... Apr.-June .........
(January-March 1985=100.00) Composite price of western red cedar shakes and shingles Value Index Per square
$39.62 40.72 42.68 42.03
42.04 46.55 52.38 61.22
57.15 57.46 59.68 62.18
68.68 74.61
100.00 102.78 107.72 106.08
106 .11 117.49 132.21 154.52
144.25 - 145.03
150.63 156.94
173.35 188.31
1/
Composite price of western red cedar logs in British Columbia 2/ Value Index Per cubic meter
can$44.99 100.00 52.46 116.60 47.88 106.42 50.04 111. 22
58.21 129.38 59.12 131. 41 43.19 96.00
·45.09 100.22
58.40 129.81 55.27 122.85 52.27 116.18 56.17 124.85
61. 21 136.05 64.24 142.79
!/ Composite prices and indexes are based on the sales of shakes and shingles in the U.S. market in U.S. dollars. ?:_! Composite prices for red cedar logs sold in Vancouver are weighted-averages for the three grades of red cedar logs that are used in the production of red cedar shakes and shingles.
Sourc~: Random Lengths' Lumber Price Guide, Council of Forest Industries of British Columbia, and The Ministry of Forest average log prices.
The supply of western red cedar.--Western red cedar is primarily a West Coast species whose range extends from southern California north to southeastern Alaska. British Columbia has by far the largest stock of red
!/ Staff used market share estimates of the Red Cedar Shingle and Handsplit Shake Bureau to calculate weighted-ave~age composite western red cedar shake and shingle prices.

A-31
cedar, followed by Washington State. The shake and shingle industry relies almost exclusively on old growth western red cedar, which typically comes from trees in excess of 200 years of age. !/ Young growth western red cedar does not contain the natural preservatives or have the structural integrity necessary to serve as a viable raw material for the shake and shingle industry. The supply of cedar in the northwestern United States, particularly that under private ownership, has been depleted to the point that it _has at times during 1988 represented a constraint on shake and shingle production. ~/ Because old growth western red cedar is a limited resource, supply considerations are likely to have an even greater effect on shake and shingle production in the future. Although there are no precise figures available on the remaining supply of old growth western red cedar in the United States, Wesley Rickard, Inc., estimates that the supply in western Washington, which represents the greatest concentration in the United States, will last 16.5 years at 1980-85 harvest rates. lf Prospective harvest levels are difficult. to predict, in part because future sales of cedar on Federal and State lands may be curtailed as supplies diminish.
In recent years, U.S. shake and shingle producers have sought access to lower-cost Canadian western red cedar, which at current harvest levels will last another century or so. ~/ However, at present Canada prohibits the export of cedar logs. ~/
Housing construction.--The demand for western cedar shakes and shingles is both seasonal and cyclical and is determined largely by new housing construction and to a somewhat lesser extent by the replacement of roofing and siding. The demand for shakes and shingles is not evenly distributed geographically; a large portion of shakes and shingles are used in the western region of the United States. New single-family housing units started in this region peaked during April-June and were lowest during January-March and October-December of 1985-87 (table 11). When compared with the same quarter of the previous year, housing starts increased in each quarter of 1986 and in January-March 1987 and then declined in each quarter from April-June 1987 through April-June 1988. New housing construction in January-March and April-June 1988 was 11 percent and 4 percent higher, respectively, than the level of construction in the same quarters of 1985.
Seasonal fluctuations in shake and shingle prices were less pronounced, as prices in the western region increased at a relatively steady rate throughout the period. With the exception of shake prices in October-December 1987, shake and shingle prices were higher in every quarter during January
!/ The Western Red Cedar Timber Resource in the United States As It Relates to the United States Production of Shakes and Shingles (Preliminary); Wesley Rickard, Inc., July 1988, p. 2. ~/ Numerous shake and shingle producers noted, in questionnaire responses and staff interviews, that they experienced difficulty during 1988 in obtaining cedar logs and they were often forced to purchase blocks or bolts of salvage wood, typically removed from the timber site by helicopter. Others were forced to discontinue production intermittently. 11 Wesley Rickard, Inc., The Western Red Cedar Timber Resource ... , p. 10. ~/Fraser Valley posthearing brief, p. 8. ~/ Transcript, p. 139.

A-32
Table 11 U.S. prices of western red cedar shakes and shingles and new one-unit housing started in the western region of the United States, by quarters, January 1985-June 1988
Shake Period Value
Per square
1985: Jan. -Mar ... . $38.43 Apr. -June .. . 38.10 July-Sept .. . 39.28 Oct. -Dec ... . 40.60
1986: Jan. -Mar ... . 40.76 Apr. -June .. . 43. 77 July-Sept .. . 49.92 Oct. -Dec ... . 62.15
1987: Jan. -Mar ... . 56.23 Apr. -June .. . 53.60 July-Sept .. . 56.29 Oct. -Dec ... . 58.28
1988: Jan. -Mar ... . 63.13 Apr. -June .. . 71. 74
(January-March 1985=100)
Erice Shingle price Index Value Index
Per square
100.00 $42.38 100.00 99.14 46.89 110. 65
102.21 50.62 119. 44 105.64 45.35 107.01
106.06 45.03 106.25 113. 90 53.03 125.14 129.90 58.13 137.17 161. 71 59.06 139. 36
146.31 59. 31 139.95 139.46 66.47 156.84 146.47 67.58 159.46 151.65 71. 31 168.26
164.27 81. 62 192.59 186.67 81. 29 191. 81
Single-family housing starts Quantity Index
units
53.0 69.0 67.0 50.0
54.0 81.0 68.0 58.0
64.0 76.0 65.0 50.0
59.0 72.0
100.00 130.19 126.42
94.34
101. 89 152.83 128.30 109.43
120.75 143.40 122.64
94.34
111. 32 135.85
Source: Random Lengths' Publications and Current Construction Reports of the U.S. Department of Commerce, Bureau of the Census.
1986-June 1988 than in comparable quarters of the preceding year. In January-March and April-June 1988, shake prices were 64 percent and 88 percent higher, respectively, than in the corresponding quarters of 1985, and shingle prices were 93 percent and 73 percent higher, respectively.
Exchange rates
Quarterly data reported by the International Monetary Fund indicate that during January 1985-June 1988 the nominal value of the Canadian dollar appreciated 10.0 percent relative to the U.S. dollar (table 12). !/ Adjus~ed
for movements in producer price indices in the United States and Canada, the real value of the Canadian currency registered an overall appreciation equivalent to 15.4 percent as of April-June 1988 relative to that of January-March 1985.
!/ International Financial Statistics, July 1988.
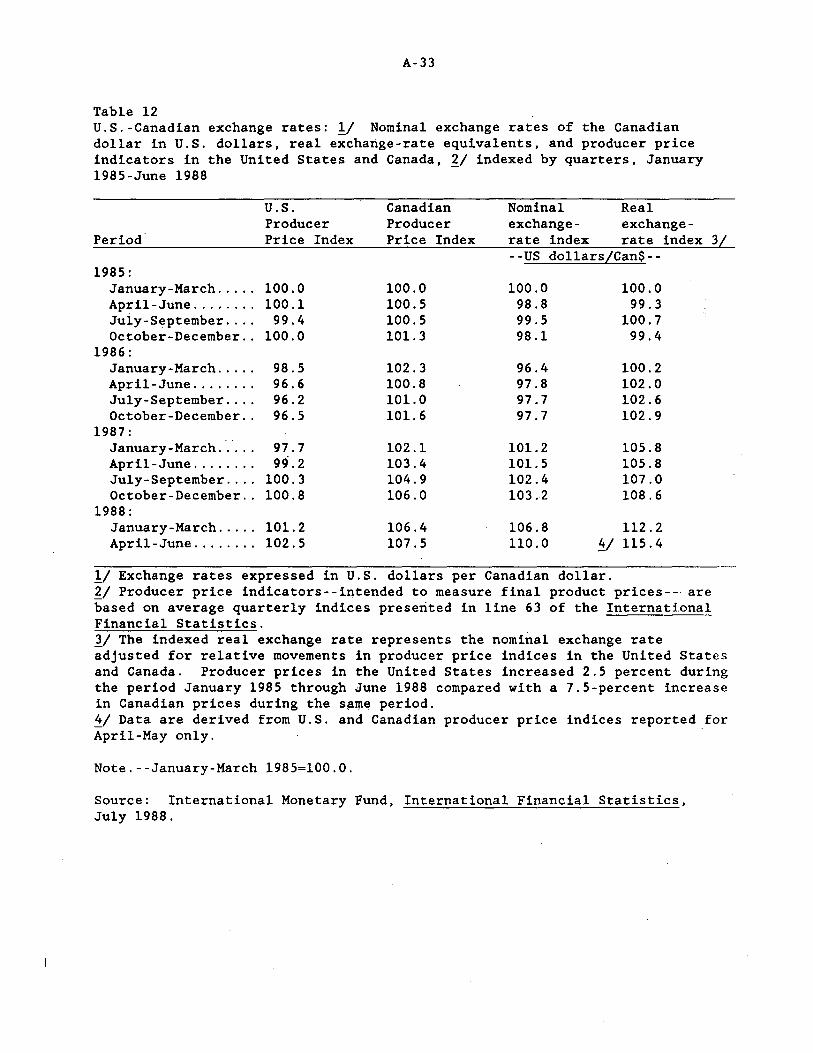
A-33
Table 12 U.S.-Canadian exchange rates: !/ Nominal exchange rates of the Canadian dollar in U.S. dollars, real exchange-rate equivalents, and producer price indicators in the United States and Canada, ~/ indexed by quarters, January 1985-June 1988
U.S. Canadian Nominal Real Producer Producer exchange- exchange-
Period Price Index Price Index rate index rate index --US dollarsL_Can$--
1985: January-March ..... 100.0 100.0 100.0 100.0 April-June ........ 100.1 100.5 98.8 99.3 Juiy-September .... 99.4 100.5 99.5 100.7 October-December .. 100.0 101.3 98.1 99.4
1986: January-March ..... 98.5 102.3 96.4 100.2 April-June ........ 96.6 100.8 97.8 102.0 July-September .... 96.2 101.0 97.7 102.6 October-December .. 96.5 101. 6 97.7 102.9
1987: January-March ..... 97.7 102.l 101.2 105.8 April-June ........ 99.2 103.4 101. 5 105.8 July-September .... 100.3 104.9 102.4 107.0 October-December .. 100.8 106.0 103 .. 2 108.6
1988: January-March ..... 101. 2 106.4 106.8 112.2 April-June ........ 102.5 107.5 110.0 !±I 115.4
!/ Exchange rates expressed in U.S. dollars per Canadian dollar. ~/ Producer price indicators--intended to measure final product prices--· are based on average quarterly indices presented in line 63 of the International Financial Statistics.
3L_
11 The indexed real exchange rate represents the nominal exchange rate adjusted for relative movements in producer price indices in the United States and Canada. Producer prices in the United States increased 2.5 percent during the period January 1985 through June 1988 compared with a 7.5-percent increase in Canadian prices during the s~~e period. !±I Data are derived from U.S. and Canadian producer price indices reported for April-May only.
Note.--January-March 1985=100.0.
Source: International Monetary Fund, International Financial Statistics, July 1988.
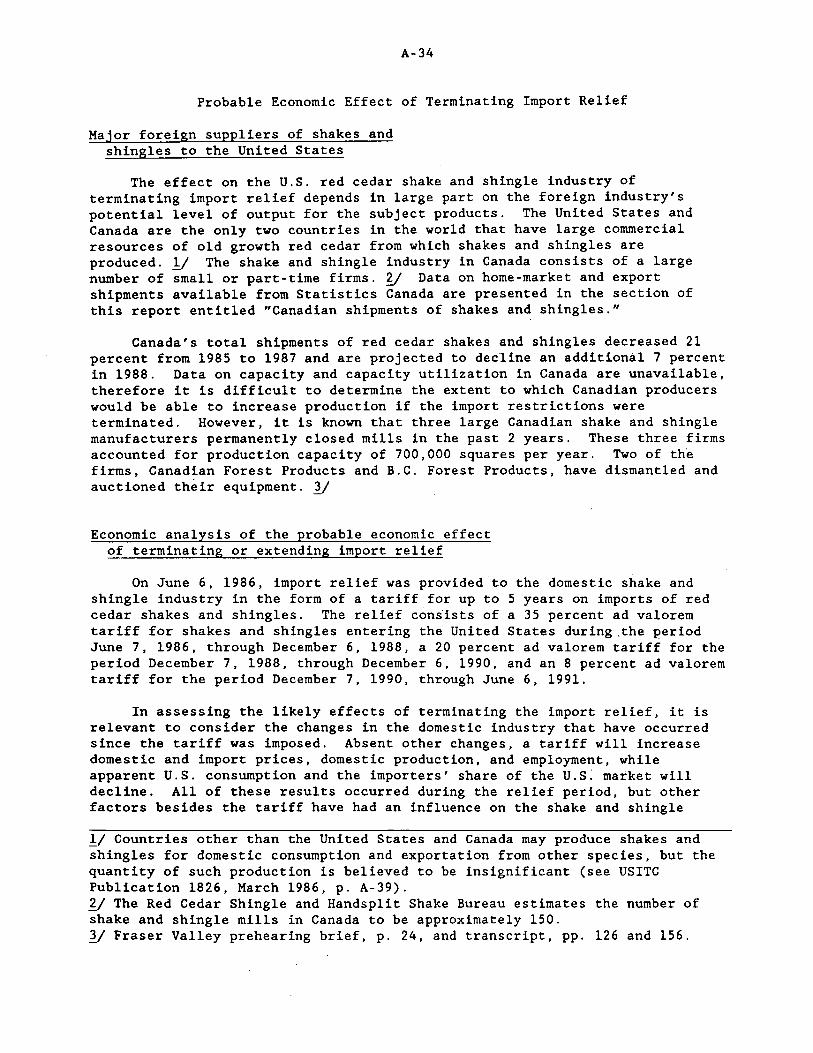
A-34
Probable Economic Effect of Terminating Import Relief
Major foreign suppliers of shakes and shingles to the United States
The effect on the U.S. red cedar shake and shingle industry of terminating import relief depends in large part on the foreign industry's potential level of output for the subject products. The United States and Canada are the only two countries in the world that have large commercial resources of old growth red cedar from which shakes and shingles are produced. 1/ The shake and shingle industry in Canada consists of a large number of small or part-time firms. ~/ Data on home-market and export shipments available from Statistics Canada are presented in the section of this report entitled "Canadian shipments of shakes and shingles."
Canada's total shipments of red cedar shakes and shingles decreased 21 percent from 1985 to 1987 and are projected to decline an additional 7 percent in 1988. Data on capacity and capacity utilization in Canada are unavailable, therefore it is difficult to determine the extent to which Canadian producers would be able to increase production if the import restrictions were terminated. However, it is known that three large Canadian shake and shingle manufacturers permanently closed mills in the past 2 years. These three firms accounted for production capacity of 700,000 squares per year. Two of the firms, Canadian Forest Products and B.C. Forest Products, have dismantled and auctioned their equipment. 3/
Economic analysis of the probable economic effect of terminating or extending import relief
On June 6, 1986, import relief was provided.to the domestic shake and shingle industry in the form of a tariff for up to 5 years on imports of red cedar shakes and shingles. The relief consists of a 35 percent ad valorem tariff for shakes and shingles entering the United States during .the period June 7, 1986, through December 6, 1988, a 20 percent ad valorem tariff for the period December 7, 1988, through December 6, 1990, and an 8 percent ad valorem tariff for the period December 7, 1990, through June 6, 1991.
In assessing the likely effects of terminating the import relief, it is relevant to consider the changes in the domestic industry that have occurred since the tariff was imposed. Absent other changes, a tariff will increase domestic and import prices, domestic production, and employment, while apparent U.S. consumption and the importers' share of the u.s: market will decline. All of these results occurred during the relief period, but other factors besides the tariff have had an influence on the shake and shingle
!/ Countries other than the United States and Canada may produce shakes and shingles for domestic consumption and exportation from other species, but the quantity of such production is believed to be insignificant (see USITC Publication 1826, March 1986, p. A-39). ~/ The Red Cedar Shingle and Handsplit Shake Bureau estimates the number of shake and shingle mills in Canada to be approximately 150. 11 Fraser Valley prehearing brief, p. 24, and transcript, pp. 126 and 156.

..
A-35
market. Continuation of high demand for red cedar in the presence of a declining supply of these logs has caused log prices to increase. This increase in log prices has contributed to the increase in shake and shingle prices. Prices for shakes and shingles during the period prior to the temporary duty ranged from $39 to $46 per square during January 1985-June 1986. During the period under import relief, July 1986-June 1988, shake and
.·.shingle prices rose from $52 to $74 per square. Domestic production and employment also increased. The following tabulation presents semiannual domestic production figures from January 1985 to December 1987 (in thousands of squares):
Period
1985: January-June ........... . July-December .......... .
1986: January-June ........... . July-December .......... .
1987: January-June ........... . July-December .......... .
Production
775 868
849 1,282
1,102 1,124
U.S. production of shakes and shingles was significantly higher during the 18-month period after the temporary duty, July 1986-December 1987, compared with production in the 18-month period before the tariff, January 1985-June 1986.
Apparent U.S. consumption of red cedar shakes and shingles increased 10.6 percent from 1985 to 1986. It then decreased 11.7 percent from 1986 to 1987 a~d continued to decrease in January-June 1988, down 3.0 percent compared with consumption in the corresponding period of 1987. U.S. imports increased 2.3 percent from 1985 to 1986 and then declined 20.0 percent from 1986 to 1987.
Termination of the import relief is likely to decrease prices of both domestic and Canadian shakes and shingles. Removal of the 35 percent tariff will cause the share of imports in the domestic market to increase and ~o~estic production to decrease. The effect of termination of import relief on the domestic shake and shingle industry will also be influenced by the ~esponse of the log market. Since the imposition of a 35 percent tariff on imported shakes and shingles, the demand for red cedar logs in the United States has increased substantially, and this has caused the prices of logs to increase. However, as the demand for domestic shakes and shingles declines, the demand for cedar logs by shake and shingle producers will also decline. Therefore, prices for cedar logs are likely to decrease, and the price decrease in shakes and shingles would be at least partially offset by lower raw material costs.
~- ,,· · Supply and demand conditions. - -The probable effects of removal of import · restrictions on the red cedar shake and shingle industry depend importantly ~pon the domestic and import supply and demand elasticities and the overall ~ggregate demand elasticity in the United States for shakes and shingles.

A-36
Both domestic and import supply are believed to be moderately inelastic. The major input for domestic and Canadian shake and shingle producers is cedar logs. Red cedar logs are harvested along with other species of timber but generally account for a small portion of the total harvest. Thus, the supply of cedar logs is not very responsive to changes in cedar log prices, and the supply of shakes and shingles is also likely to be relatively inelastic. However, because western red .cedar is more abundant in Canada and can still be found in purer stands than exist in the United States, import supply is likely to be somewhat more elastic than domestic supply.
The aggregate demand for red cedar shakes and shingles is determined largely by new housing construction and to a lesser extent by the replacement of roofing and siding. In the new housing market, shakes and shingles are generally used in upscale housing and account for a relatively small portion of the total cost of the structure. There are several close substitutes for wood shakes and shingles in terms of performance and, as prices rise, customers can turn to alternative products, such as ceramic tile, asphalt shingles, and cedar and hardboard siding. There may be considerable reluctance to switch to alternative products, especially in upscale applications, because the style of roof can be a key element of this type of housing. This inflexibility is reflected in the relativity modest response in
·the decrease in apparent consumption to the substantial increase in prices. In light of all available information, the aggregate demand for wood shakes and shingles is considered to be moderately inelastic.
Demand for both the domestic and imported products is likely to be elastic even though the aggregate demand for red cedar shakes and shingles is considered moderately inelastic. Once the consumer has decided to use red cedar shakes and shingles, the decision becomes whether to use domestic or foreign product. Because domestic and Canadian shakes and shingles are used in the same applications and are virtually identical, i.e., highly substitutable, consumers will readily shift between the domestic and foreign products.
The probable economic effects on the domestic industry of removal of the tariff have been calculated through the use of a static economic model. !/ This methodology allows for estimating the effect of a tariff reduction on aggregate demand, domestic shipments, imports, prices, and employment. Data from 1987 were used to estimate the effects that a tariff reduction of 15 or 35 percentage points would have had on consumers during that year. A tariff reduction of 15 percentage points represents the reduction that is scheduled to occur if the import relief continues as originally scheduled. A tariff reduction of 35 percentage points represents termination of the import relief. The estim~ted effects of a decrease or removal of a tariff are explored using a range of likely price elasticities that are believed to be
1/ The model assumes that the domestic and imported products are substitutes and that both domestic and import supply curves slope upward. A more detailed explanation on the methodology is described in the USITC staff research paper: Rousslang and Suomela, "Calculating the Consumer and Net Welfare Costs of Import Relief," July 1985.

A-37
reasonable for the shake and shingle industry; these elasticities range from a low to a high level, thus providing lower and upper bound results. !/
Reduction of the tariff from 35 percent to 20 percent.--The effects of a 15 percentage-point tariff reduction are smaller than those of removing the 35 percent duty entirely (table 13). Imports are estimated to increase by 160,000 to 230,000 squares, or between 5.0 and 7.0 percent. Total consumption is estimated to increase by 130,000 to 140,000 squares; the domestic producers' share of total consumption is estimated to decrease from approximately 39.8 percent to between 37.2 and 38.4 percent. Domestic shipments are estimated to decline by 20,000 to 80,000 squares; the value of these shipments is estimated to decrease from $120 million to between $109 million and $116 million. Estimates of declines in employment producing shakes and shingles are 16 to 69 jobs. Domestic and import prices are estimated to decrease by 2.6 to 5.0 percent and 2.2 to 4.1 percent, respectively. Domestic capacity utilization is estimated to decline from 59.1 percent to between 57.0 and 58.6 percent.
Table 13 Estimated effects of reducing the 35 percent tariff on red cedar shakes and shingles to 20 percent
Case I lL Case II 2L Actual New Change New Change
Item level level (+ or -~ level (+ or
U.S. consmnption (million squares) ..... 5.44 5.57 + 0.13 5.58 + 0.14 Importers' shipments (million squares). 3.27 3.43 + .16 3.50 + 0.23 u.s. producers' shipments
(million squares) 'ii . ................ 2.16 2.14 .02 2.08 - 0.08 U.S. exports (million squares) ......... .06 .06 .00 .07 + 0.01 U.S. employment '(workers) .............. 1,906 1,890 16 1,837 69 U.S. capacity utilization (percent) .... 59.1 58.6 .5 57.0 2.1 Price changes:
Domestic prices (percent) ............ - 2.55 - 5.00 Import prices (percent) .......... , ... - 2.20 - 4.10
Total net welfare loss ($million) ...... 18.33 15.02 Consumer gains ($million) .............. 6.65 12.79
-)
!/Elasticities used in case I are as follows: U.S. supply, 0.4; import supply, 0.5; and aggregate demand, -1.0. ~/Elasticities used in case II are as follows: U.S. supply, 0.8; import supply, 0.9; and aggregate demand, -0.5. '}_/Derived by subtracting U.S. exports from U.S. production.
Source: Estimates prepared by the staff of the U.S. International Trade Commission, Office of Economics.
!/ The following ranges of elasticity estimates were used in the model: aggregate demand, -0.5 to -1.0; domestic demand, -10; import demand, -9.9; domestic supply, 0.4 to 0.8; and import supply, 0.5 to 0.9.

A-38
Termination of import relief.--Effects of the removal of the 35 percent tariff are summarized in table 14. !/ Imports are estimated to increase by 420,000 to 620,000 squares, or between 13 and 19 percent. Domestic shipments are estimated to decline by 50,000 to 220,000 squares; the value of these shipments is estimated to decrease from $120 million to between $93 million and $109 million. Estimates of declines in employment are 42 to 177 jobs. Prices for domestic and imported shakes and shingles are estimated to decrease by 6.6 to 12.9 percent and 5.4 to 10.1 percent, respectively. Total consumption is estimated to decline by 360,000 to 390,000 squares; the domestic producers' share of total consumption is estimated to decrease from approximately 39.8 percent to between 33.2 and 36.3 percent. Domestic capacity utilization is also estimated to decrease from 59.1 percent to between 53.6 and 57.8 percent.
Table 14 Estimated effects of terminating the 35 percent tariff on red cedar shakes and shingles
Case I lL Case II 2L
Item
U.S. consumption (million squares) ..... Importers' shipments (million squares). U.S. producers' shipments
(million squares) 11· ..... .......... . U.S. exports (million squares) ........ . U.S. employment (workers) ............. . U.S. capacity utilization (percent) ... . Price changes:
Domestic prices (percent) ........... . Import prices (percent) ............. .
Total net welfare loss ($million) ..... . Consumer gains ($million) ............. .
Actual level
5.44 3.27
2.16 .06
1,906 59.1
New Change level (+ or
5.80 + 0.36 3.69 + .42
2.11 .05 .07 + .01
1,864 42 57.8 1. 3
- 6.56 - 5.40
48.86 17.14
New Change -) level (+ or -)
5.83 + 0.39 3.89 + .62
1. 94 .22 0.08 + .02
1, 729 177 53.6 5.5
12.92 - 10.10
40.27 32.74
!/ Elasticities used in case I are as follows: and aggregate demand, -1.0.
U.S. supply, 0.4; import supply, 0.5;
~/ Elasticities used in case II are as follows: 0.9; and aggregate demand, -0.5.
U.S. supply, 0.8; import supply,
11 Derived by subtracting U.S. exports from U.S. production.
Source: Estimates prepared by the staff of the U.S. International Trade Commission, Office of Economics.
!/ The following ranges of elasticities were used in the model: demand, -0.5 to -1.0; domestic demand, -10; import demand, -9.9; supply, 0.4 to 0.8; and import supply, 0.5 to 0.9.
aggregate domestic

A-39
Considerations under section 202(c) of the Trade Act of 1974
Section 202(c)(l).--Section 202(c)(l) directs that consideration be given to "information and advice from the Secretary of Labor on the extent to which workers in the industry have applied for, are receiving, or are likely to receive adjustment assistance under chapter two or benefits from other manpower programs."
During 1973-85, the Department of Labor instituted 150 investigations in response to petitions from workers in the shake and shingle industry. A total of 2,666 employees applied for certification through June 30, 1985; 1,024 of these workers were certified, whereas petitions on behalf of 1,642 workers were denied. Workers received funds in the form of cash benefits, training, and job search and relocation allowances. These payments and the number of recipients are presented in table 15.
Table 15 Adjustment assistance paid to workers in the shake and shingle industry, 1979-85
Cash benefits Training Job search Relocation Year Value Workers Value Workers Value Workers Value Workers
1979 ....... $344,530 79 1980 ....... 1,929,214 529 $8,709 27 $1,620 16 $5,423 6 1981 ....... 432,496 161 50,608 106 323 2 2,020 1 1982 ....... 35,216 32 22,010 40 20 1 1,241 2 1983 ....... 0 0 6,184 9 0 0 1,580 2 1984 ....... 750 1 0 0 0 0 0 0 1985 ....... 4,286 7 0 0 0 0 0 0
Total .. 2,746,492 809 87, 511 182 1,963 19 10,264 11
Source: Compiled from official statistics of the U.S. Department of Labor.
Since June 30, 1985, the Department of Labor has instituted six shake and shingle investigations. Through February 6, 1988, 162 employees had applied for certification, and all of these workers were certified. !/ Under the program, the Department of Labor distributes funds to state unemployment insurance offices, which in turn allocate the funds to workers. Payment data for shake and shingle investigations instituted after June 30, 1985, are not available because state unemployment insurance offices have not reported this information to the Department of Labor.
Section 202(c)(2).--Section 202(c)(2) directs that consideration be given to "information and advice from the Secretary of Commerce on the extent to which firms in the industry have applied for, are rece1v1ng, or are likely to receive adjustment a,ssistance under chapters 3 and 4."
!/Derived from official statistics of the U.S. Department of Labor's Employment and Training Administration, Office of Trade Adjustment Assistance, Report KG630RP1 (Certification and Denials).

A-40
Since 1980, 30 of the 31 cedar shake and shingle firms that petitioned the Commerce Department for adjustment assistance were· certified, and 1 firm terminated its petition for assistance. No firms have been certified since March 1985. The shake and shingle industry has never received any direct financial assistance in the form of direct loans or loan guarantees from the Commerce Department. Financial assistance was discontinued effective April 7, 1986, upon enactment of the Consolidated Omnibus Reconciliation Act of 1985.
However, the Department has provided technical advice and assistance to the industry. Specifically, in June 1980, the Commerce Department's Economic Development Administration provided a $241,000 grant to the western red cedar industry for the purpose of identifying methods and technologies that have the potential to improve the competitive position of the U.S. shake and shingle manufacturers. In addition, since 1980, the Trade Adjustment Assistance program of the Commerce Department has provided $102,184 worth of indirect assistance in the form of technical consultations and adjustment plans to 30 shake and shingle firms, as shown in the following tabulation: !/
Year Firms Technical assistance ---
1980 ....... 1 $6,222 1981 ....... 11 38,539 1982 ....... 17 48,028 1983 ....... 1 5,420 1984 ....... 0 0 1985 ....... 1 3,875 1986 ....... 1 100 1987 ....... 0 0
Total .. !/ 32 102,184
!/ Two firms received assistance in 2 different years.
Section 202(c)(3).--Section 202(c)(3) directs that consideration be given to "the probable effectiveness of import relief as a means to promote adjustment, the efforts being made or to be implemented by the industry concerned to adjust to import competition, and other considerations relative to the position of ~he industry in the Nation's economy."
Forty mills responded that adjustments had been made and/or are currently underway; 16 of these mills have plans for adjustments should the relief be extended. Thirty-two mills that responded to questionnaires stated that they made no adjustments subsequent to the imposition of the import relief, nor do they have future plans for adjustment. ~/
!/ Compiled from official statistics of the Department of Commerce. ~ For more detailed information and dollar amounts of adjustments made in the shake and shingle industry, see the section of this report entitled "Efforts by U.S. producers to adjust to import competition."
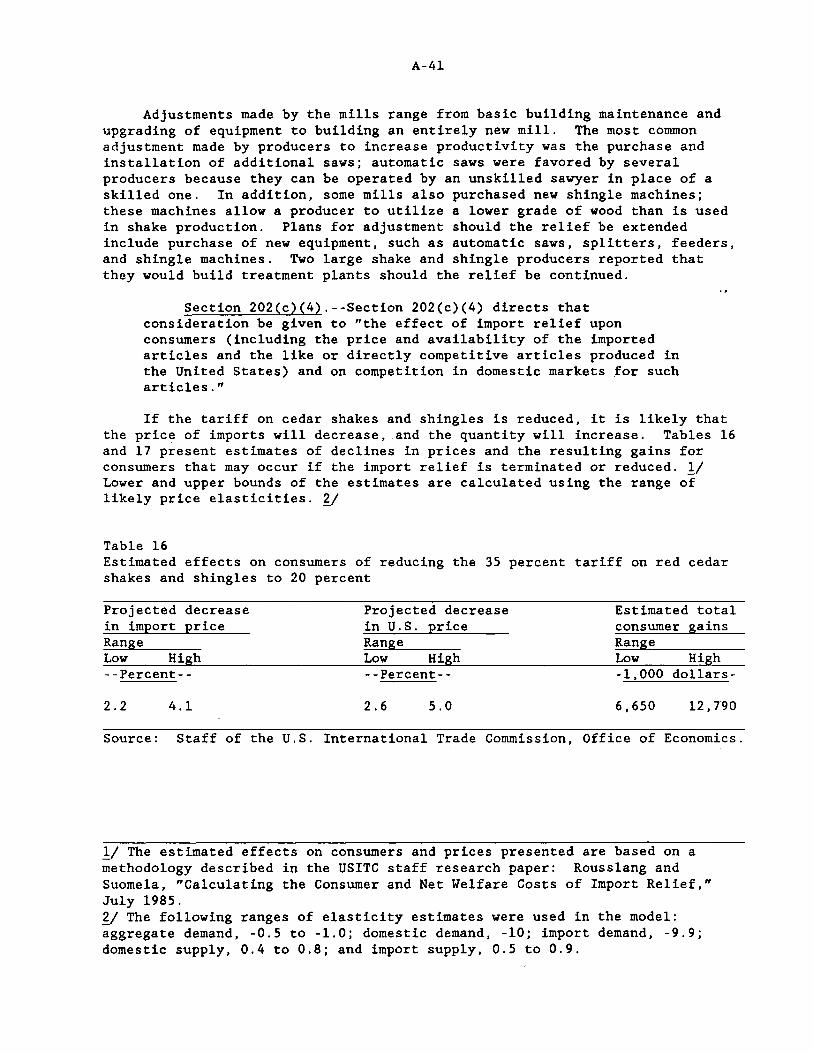
A-41
Adjustments made by the mills range from basic building maintenance and upgrading of equipment to building an entirely new mill. The most common adjustment made by producers to increase productivity was the purchase and installation of additional saws; automatic saws were favored by several producers because they can be operated by an unskilled sawyer in place of a skilled one. In addition, some mills also purchased new shingle machines; these machines allow a producer to utilize a lower grade of wood than is used in shake production. Plans for adjustment should the relief be extended include purchase of new equipment, such as automatic saws, splitters, feeders, and shingle machines. Two large shake and shingle producers reported that they would build treatment plants should the relief be continued.
Section 202(c)(4).--Section 202(c)(4) directs that consideration be given to "the effect of import relief upon consumers (including the price and availability of the imported articles and the like or directly competitive articles produced in the United States) and on competition in domestic markets for such articles."
If the tariff on cedar shakes and shingles is reduced, it is likely that the price of imports will decrease, and the quantity will increase. Tables 16 and 17 present estimates of declines in prices and the resulting gains for consumers that may occur if the import relief is terminated or reduced. !/ Lower and upper bounds of the estimates are calculated using the range of likely price elasticities. ~/
Table 16 Estimated effects on consumers of reducing the 35 percent tariff on red cedar shakes and shingles to 20 percent
Projected decrease in import price Range Low High --Percent--
2.2 4.1
Projected decrease in U.S. price Range Low High --Percent--
2.6 5.0
Estimated total consumer gains Range Low High -1,000 dollars-
6,650 12,790
Source: Staff of the U.S. International Trade Commission, Office of Economics.
!/ The estimated effects on consumers and prices presented are based on a methodology described in the USITC staff research paper: Rousslang and Suomela, "Calculating the Consumer and Net Welfare Costs of Import Relief," July 1985. ~/ The following ranges of elasticity estimates were used in the model: aggregate demand, -0.5 to -1.0; domestic demand, -10; import demand, -9.9; domestic supply, 0.4 to 0.8; and import supply, 0.5 to 0.9.

A-42
Table 17 Estimated effects on consumers of removing the 35 percent tariff on red cedar shakes and shingles
Projected decrease in import price Range
Projected decrease in U.S. price Range
Estimated total consumer gains Range
Low High Low High Low High ---Percent-- ---Percent-- -1,000 dollars-
5.4 10.l 6.6 12.9 17,140 32,740
Source: Staff of the U.S. International Trade Commission, Office of Economics.
Section 202(c)(S) and 202(c)(6).--Sections 202(c)(S) and 202(c)(6) direct that consideration be given to "the effect of import relief on the international economic interests of the United States;" and "the impact on U.S. industries and firms as a consequence of any possible modification of duties or other import restrictions which may result from international obligations with respect to compensation."
In 1987, Canada accounted for 99 percent of U.S. imports of red cedar shakes and shingles. The following tabulation presents for 1987 the bilateral trade balance between the United States and Canada, total U.S. imports from Canada and exports to Canada in 1987, and 1987 U.S. imports of Canadian red cedar shakes and shingles (in millions of U.S. dollars):
U.S. trade deficit with Canada
(13,849.6)
U.S. imports from Canada
70,850.6
U.S. exports to Canada
57 ,001.0
U.S. shake and shingle imports from Canada
163.0
Under article XIX of the GATT, member countries adversely affected by U.S. import relief are entitled to claim equivalent compensation for the U.S. action. Compensation is generally in the form of duty reductions on other products that the affected countries export to the United States. If consultations do not produce agreement as to the form and level of compensation, or if the traded articles are not bound by GATT accords, a trading partner can retaliate by imposing restrictions against products that it selects.
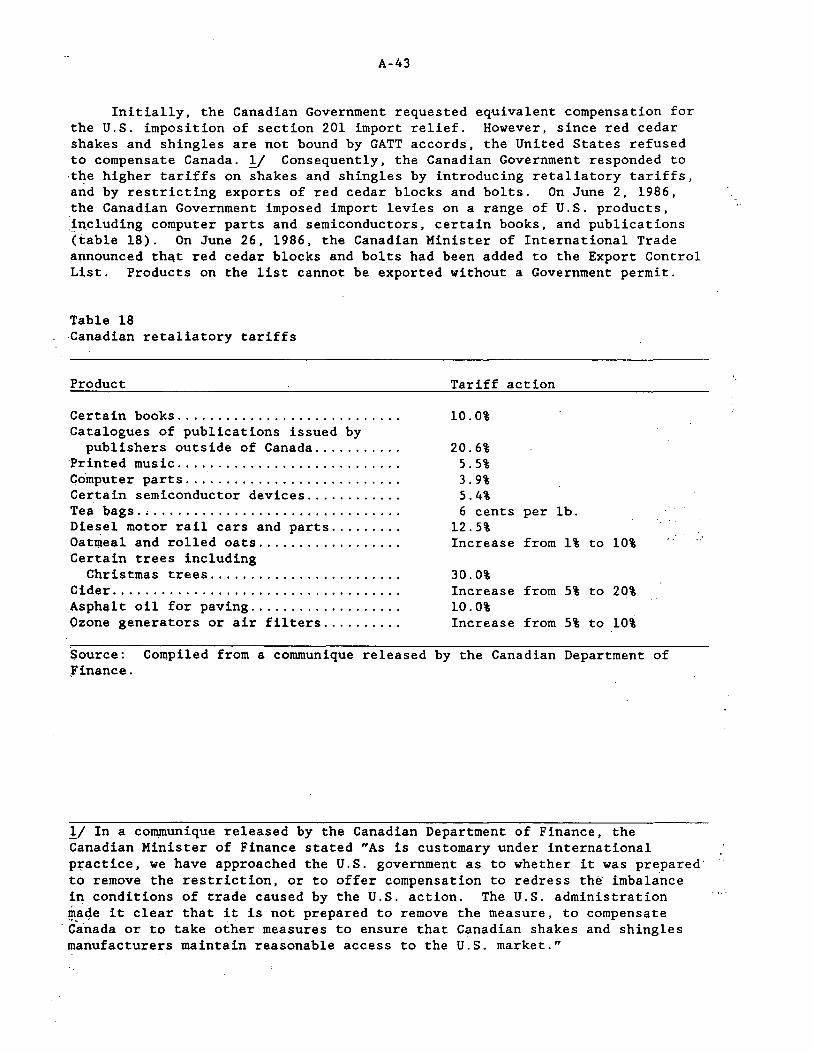
A-43
Initially, the Canadian Government requested equivalent compensation for the U.S. imposition of section 201 import relief. However, since red cedar shakes and shingles are not bound by GATT accords, the United States refused to compensate Canada. !J Consequently, the Canadian Government responded to ·t~e higher tariffs on shakes and shingles by introducing retaliatory tariffs, and by restricting exports of red cedar blocks and bolts. On June 2, 1986, the Canadian Government imposed import levies on a range of U.S. products, ~n_cluding computer parts and semiconductors, certain books, and publications (table 18). On June 26, 1986, the Canadian Minister of International Trade announced that red cedar blocks and bol.ts had been added to the Export Control List. Products on the list cannot be exported without a Government permit.
Table 18 Canadian retaliatory tariffs
Product Tariff action
Certain books ........................... . 10.0% Catalogues of publications issued by
publishers outside of Canada .......... . 20.6% ·Printed music ........................... . 5.5% Computer parts .......................... . 3.9% Certain semiconductor devices ........... . 5.4% Tea bags.; .............................. . 6 cents per lb. Die~el motor rail cars and parts ........ . 12.5% Oatmeal and rolled oats ................. . Increase from 1% to 10% Certain trees including
Christmas trees ....................... . 30.0% Cider ................................... . Increase from 5% to 2q% Asphalt oil for paving .................. . 10.0% Ozone generators or air filters ......... . Increase from 5% to 10%
Source: Compiled from a communique released by the Canadian Department of finance.
!/ In a com,rnunique released by the Canadian Department of Finance, the Canadian Minister of Finance stated "As is customary under international pi;actice, we have approached the U.S. government as to whether it was prepared· to remove the restriction, or to offer compensation to redress th~ imbalance in conditions of trade caused by the U.S. action. The U.S. administration ~aqe it clear that it is not prepared to remove the measure, to compensate
· Canada or to take other measures to ensure that Canadian shakes and shingles manufacturers maintain reasonable access to the U.S. market."

A-44
Section 202(c)(7).--Section 202(c)(7) directs that consideration be given to "the geographic concentration of imported products marketed in the United States."
In 1987, the bulk of the red cedar shake and shingle imports entered the United States on the West Coast, followed by the Midwest, as shown in the following tabulation (in percent):
Region !/
West Coast .............. . Midwest ................. . Northeast ............... . Other ................... .
Total ............... .
Share
76.9 11.8
7.3 4.0
100.0
!/ Customs districts, listed in order of importance for each of the regions presented, are--West Coast (Seattle, WA; Portland, OR); Midwest (Duluth, MN; Detroit, MI; Chicago, IL); Northeast (St. Albans, VT; Ogdensburg, NY; Buffalo, NY; Portland, ME); Other (all other customs districts not previously indicated). · ·
The principal customs district of importation of red cedar shakes and shingles, Seattle, YA, accounted for 76.8 percent of 1987 imports. Thus, any impact of the import relief on employment in firms that handle, transport, or distribute the subject products may have been felt primarily in that area.
Section 202(c)(8).--Section 202(c)(8) directs that consideration be given to "the extent to which the U.S. market is the focal point for exports of such ·article by reason of restraints on exports of such article to, or on imports of such article into, third-country markets."
The vast majority of the Canadian-produced western red cedar shakes and shingles, 88.0 percent on average since 1986, are exported; 98.7 percent of these exports entered the U.S. market during 1986-87. The Red Cedar Shingle and Handsplit Shake Bureau states that there are no restrictions on exports of Canadian cedar shakes and shingles to third-country markets.
Section 202(c)(9).--Section 202(c)(9) directs that consideration be given to "the economic and social costs which would be incurred by taxpayers, communities, and workers, if import relief were or were not provided."
Red cedar shake and shingle producers tend to be small firms employing a relatively low number of workers. On average, from 1980 to 1985, shake and shingle mills employed seven workers per mill. Employment in the shake.and shingle industry is concentrated in Washington, and to a lesser extent, in Oregon (table 19).

A-45
Table 19 Number of firms and workers engaged in production of western red cedar shakes and shingles, 1980-87 !/
Washington Oregon Total Year Firms Workers Firms Workers Firms Workers 1980 .......... 296 2,144 59 482 355 2,626 1981 .......... 260 1,749 52 378 312 2,061 1982 .......... 227 1,414 41 277 268 1,691 1983 .......... 218 1,910 41 275 259 2,185 1984 .......... 208 1,763 39 201 247 1,964 1985 .......... 187 1,262 37 295 224 1,557 1986 .......... 173 1,425 34 277 207 1,702 1987 .......... 180 1,588 32 318 212 1,906
!/ Only Washington and Oregon employment data are available after 1984. However, from 1980 to 1984, 90 percent of the shake and shingle workers were employed in Washington or Oregon.
Source: Data supplied by the U.S. Department of Labor and the States of Washington and Oregon.
I-f the tariff on Canadian shakes and shingles is removed, the domestic industry will no longer be protected from import competition. To the extent that the elimination of section 201 import protection would cause an increase in imports and a reduction in domestic sales, the industry would be forced to reduce output and lay off workers. Economic costs faced by taxpayers under these conditions would include State and Federal unemployment insurance payments, income maintenance in cases of extended need, food stamps, and reduced Federal, State, and local tax receipts. Social costs to the workers · and the communities would result from the added unemployment burden and would be concentrated in Yashington and Oregon.


A-47
APPENDIX A
PRESIDENTIAL PROCLAMATION 5498, MAY 26, 1986, PRESIDENTIAL MEMORANDUM, AND
REQUEST FROM THE UNITED STATES TRADE REP.RESENTATIVE
A-48
Proclamation 5498 or f une 8.. 1988
Temporary Duty Increase on the Importation Into the United Slates of Wood Shingles and Shakes of Western Red Cedar
By the President of the United States of America A Proclamation
1. Pursuant to Section Zot(dl(l) or the Trade Act of 1974 (the Trade Act) (19 U.S.C. Z251(d)(l)), the United States International Trade Commission (USITC) on March 2.5. 1986. reported to the President the resulu of its in· ve:stigation No. TA-ZDl-56 under Section Z01(b) of the Trade Act (19 U.S.C. 2.ZSl(b)]. The USITC determi.ned that wood shi.ngles and shakes. provided for in item zoo.as of the Tariff Schedwes of the United States (TSUS), are being imported into the United States in such i.ncreased quantities as to be a substantial cause of serious injury to the dome-:stic industry producing ar· ticles like or directly ,competitive with the imported.cµticles. ne usrrc recommended that a tariff of 35 percent ad valorem. be impqsed for a .period of 5 yean on imporu of wood shingles and shakes of w·estern red cedar in order to remedy this aeriou1 injury.
Z. On May 23. 1986. pursuant to Section ZOZ(b)(l) of the Trade Act (19 U.S.C. 2.ZSZ(b )(1)), and after taking into account the considerations specified in Section ZOZ(c) of the Trade Act (19 U.S.C Z25Z(c)). in order to remedy this serious injury, I determined to impose a tariff on imports into the United States of wood shingles and shakes of western red cedar in an amount that diffen from the tariff recommended by the USITC. Or. May 23. 1986. in accordance with Section Z03(b)(1) of the Trade Act (19 U.S.C. Z25J(b)(1)), I transmitted a report to the Congress setting forth my determination and in· tention to proclaim a temporary tariff and stating the reuon why my deci· sion dil:!ered from the action recommended by the usrrc. 3. Section Z03(e)(1) of the Trade Act (19 U.S.C. Z2S3(e)(1)) requires that lmport relief be proclaimed and take effect within 15 daya after the import relief determination date. ·
85 a-oal 0-IT~
•·.

A-49
Proc. 5498 Title 3-The
4. Punuant to Sections ZD3(a)(1) and ZD3(e)(1) of the Trade Act I am providir.g import reiief through the temporary imposition of a tariff on wood slling.les and 3ha.ke9 of western red cedar. as hereinafter procl.a.imed.
NOW. THEREFORE. I. RONALD REAGAN. President of the United State,, of America. acting under the authority vested in me by the Corutitution and the statute3 of the Un.ited State9. inclu~ Sections Z03 and 504 of the Trade Act (19 U.S.C. 2.2..53 and Z483), do proclaim that-
(1) Subpart A. part Z of the Appendix to the TSUS i.a tnodified as set forth in the Annex to this proclamation.
(Z) Thi.s proclamation shall be effective with respect to articles entered. or withdrawn from warehouse for con.sumption. on or after June 7, 1986, and before the close of June 6. 1991. unless the period of its effectiveness ia earlier expreuly modified or terminated. .
IN WITNESS WHEREOF. I have hereunto set my hand this 6th day of June, in the year of ou.r Lord nineteen hundred and eighty-six. and of the Independence of the United States of America the two hundttd and tenth.
RONALD REAGAN
ANNEX
Nau: The new t&n.B' item• &r1 HI forth i.n columnar form. and material In l\lch ail11111Z1• i1 Ua&rt· ed ill tba aiiw=a af lha TSUS d111gna1td ·uem", •AnicJ11", ·RatH of Oury r. and ·Ratn af Oury : ... re1pecunly.
S11biect to tbt aban 0011. th1 TSUS i1 modified 11 rollow.:
E!!'ectiv1 u 10 anicln entered. or withdrawn frcm w&r1bouH for ainaw:aptio11. Oii or altar th1 efl'ecav1 date a! ~ proclamacon and before lhe cloH of tb1 da11 provided by this proclama• tion. 111bpan A af pan i of lhe Appendix la lha Tariff Schedllln of the United S1a1u (19 U.S.C. t21UJ (1 mocillied by w1nin1 iP nwnenc.al 1equenc.1 lilt faUo~ new itema uid 111p1nar b1ad· il1I:
"Woad 1hin31n uid 1bakH of w11tara red cedar pro:mdN for ill item zoo.~
924.JQ U eotel"ld durin8 tba period from Juna 7, 111811. thraugb DKember e. 1984. illclll11v1 l.5'l ad val.
924.ll U entered d~ lilt period frcm Oaccmber 7. llleL thrauab Deamb1r a. 19Ql. lllclua1n - 20'S ad nl.
IZ4.J.Z U eatartd d~ I.ha period from Dec.mbcr 7, lSl'lilO. thrauali jUAa e. 11191. lncluain n ad n1.
lS'l ad val.
. 2ll"l ad val.
8" ad val.•

A-50
fuJur11l Ru~i&tur / Vul. 51. No. 102 / Wt:J11cs1luy, M1ty 21.1, 10U6 f Pn:11lJuullul Oocun1unl1 1Ul57
pt o.c. •i-. N.4H7~t.m-I
~-u.~-w
Presidential Documents
Me1uorlllldwn or t.foy 23, 1uae . ·1
Wo&tern Red Cednr Sbakea 'and Shlagl~a Import Ruliuf DotonnlnaUon
Memorandum for lha Unllod &l1to1 Trad1 lapreaeotallve
Pu.rauant to Suction 202(b}(1) of the Trade Act of 197( (19 U.S.C. 2251(b)(t}). I have dotennlned the actloD I will tak1 with re1pecl to the report of the United St11le1 lnlern~tlonal Trude C111nmJaalon (ITC), tran1mllted to me on March 25, 196&, concerning tho reeulta or lt1 lnveattaatlon of a petition for Import relief filed by the Northweal Independent Fcire1t Manufacturera on behalf or the dame1tJc lndu1try productns wood 1h1k11 and 1hinalot, provldod lor Ln ltom 200.85 or the TariU Schedulea of the United Statet.
Arter conaldering 1&tl relevant 11pecta of the c111. lncludln1 tho11 11t forth In· SecUan 202(c) of the Trade Act of 1974. I b•v• determined \hat p_ro~lalon ol Import nUef In the (orrn of i tariff for up ta I ytart 11 ln the nGtlonal economic lnlere,~·:;[he turlCf will apply to all U.S. lmporta of weatam rtd cedar ahakee and 1niita111. The addltlonal dut)' will be S5 percant ad valorein ror lhe nrat 30 snantha of the period, 20 percont ad valor1m fo!on1h1 30 lhruuah 54, and a percent ad valorem for mon1h11 H thtouah oo. · 'hla 5~year r1lh1C proaram ahould be 1ulficient to enable the domeaUc pro ucera of rtd codar 1hak11 and ahlnatea to 1dJu1t to competition dwina the reliaf period. . • , ., ... In confuncllon with pravldlns Import r11l1f, I hereby dlrect·you fo r1qu111t th1tt the ITC advf11 me of tht probabl1 aeonomlc 1ft1ct on the dom11llc lndu1try of the tenntnaUon or Import relief alter 30 montht •. Thl• advice la ta lnclud11 11 review of 0\1 proareH and 1peclnc eflorta belna meda by tho domutlc producart of we1tem red cedar 1bak11 and 1hlnal1a to 1dj1.11t to l"'port compeUUon. I al10 direct yo11 to requeat, on my ·btbDlf, advlee regardJna termlnaUon of reUef from lhe Sec:r1tarl11 of C<immerce and IAbor. The ITC, Conun1rc1, and Labor advice l1 to be provided lo me, throush you, S montha prior to lhe explrallon of the SO-montb period. It 11 my lntenUon to continue relief ror the enUr1 6--)'oar poriod ll 11neral market condlclon1 conUnue to warrant relief and 11 the dom11Uc produc.ra have beaun to make ra11on1blo proareaa tQward adJuatmanl durlns Ibo flrat •moath period.
At requJred by S.ctlon Z03(e)(1) of the Trade Act of 1974, thl1 turllr will be lmpJomented by Pre1ld1A1Jal ProclamaUon no lttter th11n Jl.l!l1 1, 1880, which 11 the 15th dar after the date or thlt dtltrmlnatlon. .
• Tbl1 detorraJna\lon 1hAl.l b1 publlabod In the Fod1r~I l•Klaler.
111B WI UTE I IOUSE. Wr- I ..... ,on, May 23. zga8,

---~~.:; l
~ : .. - ' ..... ,1,. ____ _J
A-51 THE UNITED STATES TRADE REPRESENTATIVE
Executive Office of the President Washington.DC 20506
June 29, 1988
The Honorable Alfred E. Eckes, Jr. Acting Chairman U.S. International Trade Commission 500 E Street, s.w. Washington, D.C. 20436
Dear Mr. Chairman:
~
(_
1.-. - .,
-..J
- .
In a memorandum on May 23, 1986, the President determih"ed to provide import relief for the domestic industry producim}- wood shakes and shingles in the form of a tariff for up t~. 5 yeai:s on imports of western red cedar shakes and shingles.· The President's action followed a determination by the U.S. International Trade Commission that such shakes and shingles were being imported into . the United States in such increased quantities as to be a substantial cau$e of serious injury to the domestic industry producing articles like or directly competitive with the imported articles.
In conjunction with providing import relief, the President directed ~e to request, pursuant to section 203 (i) (2) of the Trade Act of 1974, that the Commission advise him of the probable economic effect on the domestic industry of the termination of import relief after 30 months, which would be December 7, 1988.This advice is to include a review of the progress and specific efforts being made by the domestic producers of western red cedar shakes and shingles to adjust to import competition. At the time the President decided to grant import relief he indicated that it was his intention to continue relief for the entire five-year period if it appears at the end of 30 months that market conditions warrant a continuation of relief and that domestic producers have begun to make reasonable progress toward adjustment.
I am hereby requesting the Commission to provide such advice to the President not later than September 6, 1988.
The Commission's assistance in this matter is greatly appreciated.
C'l:A:st


A-53
APPENDIX B
THE COMMISSf9~'S FEDERAL REGISTER NOTICE

27.UO
A-54
Federal Register / Vol. 53. No. 139 / Wednesday. fuly 20. 1988 / Notices
[Investigation No. TA-203-16]
Wood Shakes and Shingles
AGENCY: United States International Trade Commission. ACTION: Institution of an investigation under section 203(i)(2) of the Trade Act of 1974 (19 U.S.C. 2253(i)(2)) and scheduling of a hearing to be held in connection with the investigation.
SUMMARY: Following receipt of a request filed on July 1. 1988, by the United States Trade Representative under authority delegated by section 5(a) of Executive Order 11846, the United States International Trade Commission instituted investigation No. TA-203-18 _ under section 203(i)(2) of the Trade Act of 1974 for the purpose of gathering information in order that it might advise the President of its judgment as to the probable economic .effect on the domestic industry concerned of the termination of import relief presently in effect with respect to shingles and shakes of western red cedar, provided for in item 200.85 of the Tariff schedules of the United States (TSUS). Such relief was provided by Presidential Proclamation 5498 of June 6. 1986, published in the Federal Register on June 10. 1986 (51 FR 20953) and is set forth in items 924.30, 924.31, and 924.32 of the Appendix to the TSUS. The relief . is scheduled to terminate on June 6, 1991.
For further information concerning the conduct of this investigation. hearing procedures, and rules of general application. consult the Commission's Rules of Practice and Procedure. Part 206, Subparts A and D (19 CFR Part 206). and Part 201, subparts A through E (19
· CFR Part 201).
EFFECTIVE DATE: July 1, 1988.
FOR FURTHER INFORMATION CONTACT: Bruce Cates (202-252-1187), Office of Investigations, U.S. International Trade Commission, 500 E Street SW .. Washington. DC 20436. Hearingimpaired individuals are advised that information on this matter can be obtained by contacting the Commission's TDD terminal on 202-252-1810. Persons with mobility impairments who will need special assistance in gaining access to the Commission should contact the Office of the Secretary at 202-2~2-1000.
SUPPLEMENTARY INFORMATION:
Participation in the in ves ::3at:on.Persons wishing to participate in the investigation as parties must file an entry of appearance with the Secretary to the Commission. as provided in § 201.11 of the Commission's rules (19 CFR 201.11), not later than twenty-one (21) days after publication of this notice in the Federal Register. Any en try of appearance filed after this date will be referred to· the Chairman, who will determine whether to accept the late entry for good cause shown by the person desiring to file the entry.
Service /ist.-Pursuant to § 201.11(d) of the Commission's rules (19 CFR 201.ll(d)). the Secretary will prepare a service list containing the names and addresses of all persons, or their representatives, who are parties to this investigation upon the expiration of the period for filing entries of appearance. In accordance with § 201.16( c) of the rules (19 CFR 201.16(c)), each document filed by a party to the investigation must be served on all other parties to the investigation (as identified by the service list), and a certificate of service must accompany the document. The Secretary will not accept a document for filing without a certificate of service.
Hearing.-The Commission will hold a hearing in connection with this investigation beginning at 9:30 a.m. on August 16, 1988, at the U.S. International Trade Commission Building, 500 E Street SW .. Washington. DC. Requests to appear at the hearing should be filed in writing with the Secretary to the Commission not later than the close of business (5:15 p.m.) on August 3, 1988. All persons desiring to appear at the hearing and make oral presentations. with the exception of public officials ·and persons not represented by counsel. should file prehearing briefs by August 8. 1988, and attend a prehearing conference to be held at 9:30 a.m. on August 9, 1988, in the hearing room of the U.S. International Trade Commission Building. Posthearir.g briefs must be submitted not later than the dose of business on August 19. 1988. Confidential material should be filed in accordance with the procedures described below.
Parties are encouraged to limit their testimony at the hearing to a nonconfidential summary and analysis of material contained in prehearing briefs and to information not available at the time the prehearing brief was submitted. Any written materials submitted at the hearing must be filed in accordance with the procedures described below and any cor.fider.tial materials must be submitted at least three (3) working days prior to the

A-55
Federal Register / Vol. 53; No. 139 / Wednesday. July ZO. 1~88 / Notices
hearing (see § 201.6(b )(2) of the Corr:mission's rules (19 CFR ZOUi(b}(Z)}).
Written submissions.-As mentioned. parties to this investigation may file prchea~ing and posthearing briefs by the d:ites sho.,..'!1 above. In addition. any :;ers.on who has not ente~ed an appearance as a party to the
· investigation may submit a written statement of information pertinent to the subject of the investigation on or before August 19. 1988. A signed original and fourteen (14) copies of each submission must be filed with the Secretary to the Commission in accordance with section 201.8 of the Commission's rules (19 CFR 201.8). All written submissions except for confidential business data will be av~ilable for public inspection during regular business hours (8:45 a.m. to 5:15 p.m.) in the Office of the Secretary of the Commission.
Any business information for which confidential treatment is desired shall be submitted separately. The envelope . and all pages of such submissions must be clearly labeled "Confidential Business Information." Confidential sL1i:Jmissions and requests for confidential treatment must conform with the requirements of§ 201.6 of the Ccmmission's rul!!S (19 CFR 201.6).
Authority: This investigation is being _conducted under the authority of Section 201 of the Trade Act of 1974. This notice _is published pursuant to § 201.10 of the Commission's rules (19 CFR 201.10).
By order of the Commission. Issued: July 15. 1988.
Kenn_eth R. Mason, . ·Secretary. ·
[FR Doc. 88-16338 FHed 7-19-88; 8:45 am) 61LUtlG CODE 702().()2-W
2;-.; 1

A-57
APPENDIX C
L~ST OF WITNESSES

A-58.
CALENDAR OF PUBLIC HEARING
Those listed below appeared as witnesses at the United States International Trade Commission's hearing:
Subject ~-Jood Shakes and Shingles
Inv. No. TA-203-18
Date and time: August 16, 1988 - 9:30 a.m.
Sessions were held in connection with the investigation in the Main Hearing Room 101 of the United States International Trade Commission, 500 E Street, S.W., in Washington.
Government appearance:
u. s. Department of Agriculture Forest Service, Washington, D.C.
Robert Koeppen, Staff Specialist, Forest Products and Harvesting Research
Domestic:
Northwest Independent Forest Manufacturer, Tacoma, Washington
on behalf of:
M. J. "Gus" Kuehne, President
Bruce Miller, Sr., Miller Shingle Co., Inc.
Eric Christenson, Christenson Bros. Shake Inc.
Clarence Jones, Jones Shake & Logging
Ron Hurn, Sol Due Shake Co.
- more -

A-59
Importers:
Arnold & Porter--Counsel Washington, D .C.
on behalf of:
The Fraser Valley Independent Shake and Shingle Producers Association, an association of Canadian producers of red cedar shakes and shinqles
James R. Arthurs, President, Arthurs Cedar Corporation, Mission, British Columbia
Robert Karney, General Manaqer, Washington Cedar & Supply Co.
Sindy Calabrigo, Blue Ribbon Insp'ection and Grading Bureau
Scott Clark, Co-Chairman, The Frazer Valley Independent Shake and Shingle Producers Association
Alano. Sykes >--OF COUNSEL Shelley R. Sladel


SEM~ANNUAL TRADE DATA ···. ''

.A-62 · .\. ;.
Table D-1 Western red cedar shakes and shingles: Semiannual U.S. production, exports of domestic merchandise, imports for consumption, and apparent consumption, January 1985-June 1988
(In thousands of sguares)
Period Production 1/ Exports
1985: Jan. -June .... 775 33 July-Dec ..... 868 35
1986: Jan. -June .... 849 34 July-Dec ..... 1,282 26 .
1987: Jan. -June .... y l,102 24 July-Dec ..... 1,124 38
1988: Jan. -June .... 1,050 37
!/ Estimated from data supplied by. shake
Imports
1,901 2,093
2,387 1,699
1,521 1,750
1,507
Apparent consumption
2,643 2,926
3,202 2,955
2,599 2,836
2,520
and shingle inspection official statistics of the U.S. Departme~~ of Commerce. ']j Estimated by Comm.ission staff ..
Share of consumption supplied by-Imports Production
71.9 28.1 71.5 28.5
74.5 25.5 57.5 42.5
58.5 41. 5 61. 7 38.3
59.8 40.2
bureaus and
Source: Compiled from official statistic~ of the U.S. Department of Commerce, except as noted.