westminster health checks summary 2013transact.westminster.gov.uk/docstores/publications... ·...
TRANSCRIPT

Westminster City Council Shopping Centre Health Checks 2013
Summary Report Prepared by The Retail Group
November 2013

Contents
1 Floorspace– Total units and floor space 2007/8 vs. 2012– Vacancies
2 Health & Vitality Measures– Evidence of refurbishment & extensions– Retail churn / recent new openings– Visibly long term vacant retail units– Long term undeveloped plots
5 Rents & Yields6 Crime7 Consumer Research Responses
– Purpose of visit– Shopping patterns– Mode of travel– Parking – Overall Satisfaction
2
– Quality of public realm– Quality of retail environment– Visible street drinking / beggars– Thriving night-time economy– Litter & cleanliness– Signage and way-finding– Thriving market– Total score
3 Footfall4 Bus and Cycle Hire Usage
8 Business Research Responses– Parking– Year on year performance– Future trade expectations– Percentage that would recommend centre
9 Health Check Conclusion
Introduction
This report is a summary report comparing the findings and results of the Shopping Centre Health Checks completed by The Retail Group for Westminster City Council in 2013, covering Westminster’s larger neighbourhood high street type centres.
The ten shopping centres are;• Baker Street (South) • Marylebone High Street• Berwick Street • Praed Street• Church Street / Edgware Road • Queensway / Westbourne Grove
3
• Church Street / Edgware Road • Queensway / Westbourne Grove• Edgware Road (South) • St John’s Wood High Street• Harrow Road • Warwick Way / Tachbrook Street
The aim of this comparison report is to pull together key findings from the various health checks together as one document, to act as a reference source to compare and contrast the results.
The Victoria Business Improvement District (BID) commissioned a separate health check for the Victoria area, including substantial parts of the Opportunity Area, the character and function of which is very different when compared to the above centres. As such, Victoria has not been included in this comparison exercise.

Section 1: Floorspace

Floorspace
District Centre Floorspace 2007/8 (sqm)
Floorspace2012 (sqm)
Trend
Baker Street (South) 20,195 20,122Berwick Street* N/A 9,258 N/AChurch Street / Edgware Road 26,683 21,171Edgware Road (South) 25,072 25,394Harrow Road 14,051 11,604
Queensway / Westbourne Grove is the largest of the10 centres surveyed in terms of floor space, despite a decrease (caused by the exclusion of the ground floor of the Whiteley’s Shopping Centre).
Berwick Street is the smallest.
5
Marylebone High Street 24,402 25,651Praed Street 17,717 20,505Queensway / Westbourne Grove 41,389 36,591St John’s Wood High Street 11,783 10,803Warwick Way / Tachbrook Street 21,420 17,972
* Berwick Street - no individual previous health check completed
Retail floor space in Baker Street (South), Edgware Road (South) and Marylebone High Street has remained fairly constant.
Floor space within five of the centres has decreased due mainly to minor revisions to the dataset (such as the exclusion of vacant plots), but has increased in PraedStreet.

Vacancies –
District Centre Vacancies 2007/8
Vacancies 2012
Trend
Baker Street (South) 13.0% 5.1%Berwick Street* N/A 8.3% N/AChurch Street / Edgware Road 6.8% 6.7%Edgware Road (South) 10.7% 1.1%Harrow Road 13.8% 8.2%
Vacancy levels have decreased in all centres apart from Queensway /Westbourne Grove.
Edgware Road (South) has the lowest level of all the district centres, however more units have become vacant in the centre since the last land use survey used to
Percentage of Total Units
6
Marylebone High Street 6.6% 5.2%Praed Street 7.8% 5.6%Queensway / Westbourne Grove 4.8% 6.7%St John’s Wood High Street 3.0% 3.0% N/AWarwick Way / Tachbrook Street 14.6% 4.3%
* Berwick Street no previous health check completed
the last land use survey used to inform the analysis. St John’s Wood High Street has historically the lowest vacancy rate, with current vacant units being refurbished for new openings.
Berwick Street has the highest proportion of vacant floor space, however is also one of the smallest centres.

Section 2: Health and Vitality Measures

Evidence of refurbishment & extensions
Edgware Road (South) and Harrow Road are the centres with the least evidence of recent refurbishment activity and this marks them out from the remainder of the centres surveyed.
Warwick Way / Tachbrook Street is the centre where there has been
District Centre Score – Evidence of refurbishment and extensions
Baker Street (South) 4Berwick Street 3Church Street / Edgware Road 3Edgware Road (South) 1
Scored 1-5, where 1 is negative and 5 is positive
8
the centre where there has been the most significant amount of refurbishment activity.
Baker Street (South), Marylebone High Street, Praed Street, Queensway / Westbourne Grove and St John’s Wood High Street also show plenty of signs of recent and ongoing refurbishment activity.
Harrow Road 1Marylebone High Street 4Praed Street 4Queensway / Westbourne Grove 4St John’s Wood High Street 4Warwick Way / Tachbrook Street 5

Retail churn / recent new openings
The majority of the centres, in particular Baker Street (South), Berwick Street and Warwick Way / Tachbrook Street have all benefited from good levels of new retail activity and store openings since 2008.
Harrow Road is the most stagnant
District Centre Score – Retail churn / recent new openings
Baker Street (South) 5Berwick Street 5Church Street / Edgware Road 3Edgware Road (South) 4
Scored 1-5, where 1 is negative and 5 is positive
9
Harrow Road is the most stagnant in terms of retail churn and new openings followed by Church Street / Edgware Road. The remainder of the centres have experienced a reasonable level of turnover in terms of occupants.
Harrow Road 2Marylebone High Street 4Praed Street 4Queensway / Westbourne Grove 4St John’s Wood High Street 4Warwick Way / Tachbrook Street 5

Visibly long term vacant retail units
Long term vacancies are most prevalent in Harrow Road, Edgware Road (South) and to a slightly lesser extent Queensway / Westbourne Grove.
Long term vacancies are not a significant issue in the remaining centres for the most part
District Centre Score – Visibly long term vacant retail units
Baker Street (South) 3Berwick Street 4Church Street / Edgware Road 4Edgware Road (South) 1
Scored 1-5, where 1 is negative and 5 is positive
10
centres, for the most part.
Occupancy is strongest in Marylebone High Street, St John’s Wood High Street and Warwick Way / Tachbrook Street where there are few, if any, long term vacancies.
Harrow Road 1Marylebone High Street 5Praed Street 4Queensway / Westbourne Grove 2St John’s Wood High Street 5Warwick Way / Tachbrook Street 5

Long term undeveloped plots
The majority of centres have few, if any, long term undeveloped plots.
Church Street / Edgware Road and Edgware Road (South) have the most long term undeveloped plots, including the major development site at 285 - 329 Edgware Road which is understood to be up for sale.
Queensway/Westbourne Grove also has a reasonably
District Centre Score – Long term undeveloped plots
Baker Street (South) 5Berwick Street 4Church Street 3Edgware Road (South) 3
Scored 1-5, where 1 is negative and 5 is positive
11
Q y ylarge building (former cinema) at the top of the street, which has been unoccupied and undeveloped for a long period of time. Praed Street could potentially become an issue in the future depending on when the post office site comes around for development, as it covers a large portion of frontage on the street.
Harrow Road 4Marylebone High Street 5Praed Street 4Queensway / Westbourne Grove 4St John’s Wood High Street 5Warwick Way / Tachbrook Street 5

Quality of public realm
Quality of public realm is poorest in Church Street / Edgware Road and Berwick Street, with issues around cleansing, the quality of materials and the overall ease of pedestrian movement.
There is room for further improvement in Edgware Road (South) and Warwick Way / Tachbrook Street.
Westminster’s Civic Streets programme has already led
District Centre Score – Quality of public realm
Baker Street (South) 4Berwick Street 2Church Street / Edgware Road 1Edgware Road (South) 3
Scored 1-5, where 1 is negative and 5 is positive
12
p g yto improvements on Harrow Road and St John’s Wood High Street, with further schemes planned for Queensway/Westbourne Grove amongst others.
Harrow Road 4Marylebone High Street 4Praed Street 4Queensway / Westbourne Grove 4St John’s Wood High Street 4Warwick Way / Tachbrook Street 3

Quality of retail environment
Church Street / Edgware Road and Harrow Road rate the poorest in terms of the quality of the retail environment.
Baker Street (South) and St John’s Wood High Street rate the highest.
Praed Street, Queensway / Westbourne Grove and Edgware Road (South) all have opportunities to improve
District Centre Score – Quality of retail environment
Baker Street (South) 5Berwick Street 2Church Street / Edgware Road 1Edgware Road (South) 3
Scored 1-5, where 1 is negative and 5 is positive
13
g ( ) pp pthe current quality of their retail environments.Harrow Road 2
Marylebone High Street 4Praed Street 3Queensway / Westbourne Grove 3St John’s Wood High Street 5Warwick Way / Tachbrook Street 4

Visible street drinking / beggars
Visible street drinking and presence of beggars is an issue in circa half of the centres.
It is of greatest issue in Queensway / Westbourne Grove, and Warwick Way / Tachbrook Street. It remains a significant issue in Edgware Road (South), Harrow Road and to a lesser extent Praed Street.
Visible street drinking and presence of beggars is not an
District Centre Score – Visible street drinking / beggars
Baker Street (South) 4Berwick Street 4Church Street / Edgware Road 4Edgware Road (South) 2
Scored 1-5, where 1 is negative and 5 is positive
14
g p ggissue in St. John’s Wood or Marylebone High Street, while the other three centres all perform well in this aspect.
Harrow Road 2Marylebone High Street 5Praed Street 3Queensway / Westbourne Grove 1St John’s Wood High Street 5Warwick Way / Tachbrook Street 1

Thriving night time economy
The centres are mostly diverse with the majority benefiting from a night time economy to at least some extent.
However, Church Street / Edgware Road and Harrow Road have little to no night time economy being located in the most residential parts of Westminster.
The NTE is most probably strongest in Queensway/
District Centre Score – Thriving night time economy
Baker Street (South) 5Berwick Street 2Church Street / Edgware Road 1Edgware Road (South) 5
Scored 1-5, where 1 is negative and 5 is positive
15
p y g Q yWestbourne Grove (which is a designated stress area for such uses) and Warwick Way/Tachbrook Street.
While Berwick Street is rated poorly in this aspect, it has to be considered as a part of Soho as a wider area, which is the core of the West End and the country’s largest NTE area.
Harrow Road 1Marylebone High Street 5Praed Street 5Queensway / Westbourne Grove 5St John’s Wood High Street 5Warwick Way / Tachbrook Street 5

Litter & cleanliness
Edgware Road (South) and Church Street / Edgware Road score the poorest in terms of litter and cleanliness.
The remaining centres all score well, with Baker Street (south) rated as the best in this instance.
District Centre Score – Litter & cleanliness
Baker Street (South) 5Berwick Street 4Church Street / Edgware Road 2Edgware Road (South) 1
Scored 1-5, where 1 is negative and 5 is positive
16
Harrow Road 4Marylebone High Street 4Praed Street 4Queensway / Westbourne Grove 4St John’s Wood High Street 4Warwick Way / Tachbrook Street 4

Signage and way-finding
Signage and way-finding is something that could be improved in a number of the centres, in particular Berwick Street and Warwick Way / Tachbrook Street.
However Baker Street (South), Praed Street, Queensway / Westbourne Grove and St John’s Wood High Street all score well in this respect.
A vast majority of the city is covered by the Legible
District Centre Score – Signage and way-finding
Baker Street (South) 4Berwick Street 2Church Street / Edgware Road 3Edgware Road (South) 3
Scored 1-5, where 1 is negative and 5 is positive
17
j y y y gLondon on street way finding system, however consumer responses indicate that this remains an issue for some centres.
Harrow Road 3Marylebone High Street 3Praed Street 4Queensway / Westbourne Grove 4St John’s Wood High Street 4Warwick Way / Tachbrook Street 2

Thriving market
Of the five centres with street markets; Berwick Street, Church Street / Edgware Road and Warwick Way / Tachbrook Street benefit from the most thriving streetmarkets.
The markets at Harrow Road and to a lesser extent Marylebone High Street have opportunities to improve (street market is adjacent to Marylebone High St, not on the high street itself)
District Centre Score – Thriving market
Baker Street (South) N/ABerwick Street 4Church Street / Edgware Road 4Edgware Road (South) N/A
Scored 1-5, where 1 is negative and 5 is positive
18
the high street itself).Harrow Road 2Marylebone High Street 3Praed Street N/AQueensway / Westbourne Grove N/ASt John’s Wood High Street N/AWarwick Way / Tachbrook Street 4

Total Score: Health and Vitality
In terms of the summary and overall score of health and vitality measures, St John’s Wood High Street, Baker Street (South) and Marylebone High Street score the highest.
Harrow Road, at 47% has the lowest score, followed by Edgware Road (South) and Church Street / Edgware Road.
District Centre Total Score – Health and Vitality
St John’s Wood High Street
45/50 (90%)
Baker Street (South) 44/50 (88%)Marylebone High Street 46/55 (84%)Warwick Way / Tachbrook Street
43/55 (78%)
19
Average score is 69% across the ten centres surveyed.
Tachbrook StreetPraed Street 35/50 (70%)Queensway / Westbourne Grove
34/50 (68%)
Berwick Street 36/55 (65%)Church Street / Edgware Road
29/55 (53%)
Edgware Road (South) 26/50 (52%)Harrow Road 26/55 (47%)

Section 3: Footfall

Footfall
District Centre Footfall at busiest point
(per hour)Baker Street (South) 1,608
Berwick Street 1,663
Church Street / Edgware Road 1,424
Edgware Road (South) 1,577
H R d 771
Queensway / Westbourne Grove and Praed Street (street entrance to Paddington Station) benefit from the highest levels of footfall. These are two of the larger, more accessible centres in terms of public transport.
St John’s Wood High Street (the smallest and most ‘local’ centre under study) has the lowest footfall levels, followed by Harrow Road, which again is a smaller centre
21
Harrow Road 771
Marylebone High Street 964
Praed Street 2,266
Queensway / Westbourne Grove 2,300
St John’s Wood High Street 497
Warwick Way / Tachbrook Street 1,092
centre.
Average footfall (at busiest point) across the 10 centres is over 1,400 per hour.

Section 4: Bus and Cycle Hire Usage

Bus usage
District Centre Average Numberof People Alighting or Boarding during
Lunchtime(per bus )
Average Number of People Alighting or Boarding during the
Evening(per bus )
Baker Street (South) 4 2 Berwick Street N/A N/AChurch Street / Edgware Road 10 7
Average number of bus users (per bus) is highest at Warwick Way / Tachbrook Street; significantly higher than in the other centres surveyed.
Queensway / Westbourne Grove and Baker Street (South) have the lowest average numbers boarding
Numbers alighting or boarding
23
Edgware Road (South) 5 6Harrow Road 5 8Marylebone High Street N/A N/APraed Street 7 5Queensway / Westbourne Grove 2 4St John’s Wood High Street N/A N/AWarwick Way / Tachbrook Street 14 13
lowest average numbers boarding or alighting per bus.
There are broadly similar numbers using buses during the lunchtime and evening periods.

Cycle hire
District Centre Total July 2012
Total December 2012
Baker Street (South): 1Baker Street (South): 2
2,9182,385
1,5221,224
Berwick Street N/A N/AChurch Street / Edgware Road 3,365 1,627Edgware Road (South) 2,895 1,332Harrow Road N/A N/A
Three of the Centres benefit from more than one docking point nearby; Baker Street (South), Queensway / Westbourne Grove and Warwick Way / Tachbrook Street.
Usage of cycle hire is greatest during the Summer months
Hires and docks
24
Harrow Road N/A N/AMarylebone High Street 4,402 2,315Praed Street 5,148 2,204Queensway / Westbourne Grove: 1Queensway / Westbourne Grove: 2
4,3773,339
2,1801,399
St John’s Wood High Street N/A N/AWarwick Way / Tachbrook Street: 1Warwick Way / Tachbrook Street: 2
3,0052,239
1,6251,284
during the Summer months.
The most used docking points within the centres are in Praed Street, followed by Marylebone High Street and Queensway / Westbourne Grove.
Three centres do not currently have cycle hire provision.

Section 5: Rents and Yields

Rents and yields
District Centre Highest Published Achieved Rent (£/sqm)
Highest PublishedYield Achieved (% )
Baker Street (South) £398 (07/2013) Or £169 average 5.14% (03/2012) or 5.02 averageBerwick Street £1,143 (01/2013) Or £733 average 5.78 (07/2010)Church Street / Edgware Road £382 (06/2012) Or £330 3.61 (03/2007)Edgware Road (South) £954 (09/2009) Or £581 8.75 (05/2009) or 5.73 averageHarrow Road £162 average No data
Highest recorded in recent years
26
Marylebone High Street £1,355 (02/2013) Or £618 5.2 (04/2010) or 4.1Praed Street £1,082 (11/2010) Or £648 6.07 (04/2012)Queensway / Westbourne Grove £1,922 (03/2012) Or £674 6.0 (01/2011) or 5.89St John’s Wood High Street £1,168 (03/2013) Or £763 4.45 (08/2010)Warwick Way / Tachbrook Street £245 (02/2011) Or £348 5.19 (03/2013) or 5.43

Section 6: Crime
Crime
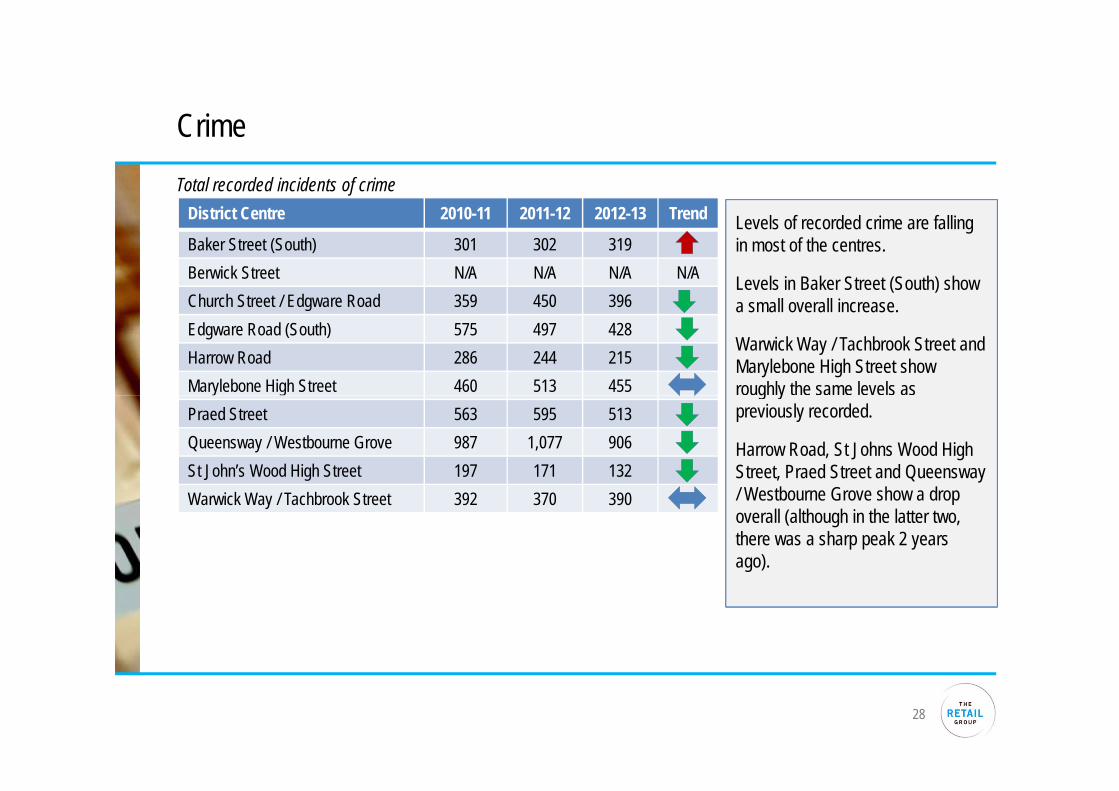
District Centre 2010-11 2011-12 2012-13 Trend
Baker Street (South) 301 302 319Berwick Street N/A N/A N/A N/AChurch Street / Edgware Road 359 450 396Edgware Road (South) 575 497 428Harrow Road 286 244 215Marylebone High Street 460 513 455
Total recorded incidents of crime
Levels of recorded crime are falling in most of the centres.
Levels in Baker Street (South) show a small overall increase.
Warwick Way / Tachbrook Street and Marylebone High Street show roughly the same levels as
28
Praed Street 563 595 513Queensway / Westbourne Grove 987 1,077 906St John’s Wood High Street 197 171 132Warwick Way / Tachbrook Street 392 370 390
g ypreviously recorded.
Harrow Road, St Johns Wood High Street, Praed Street and Queensway / Westbourne Grove show a drop overall (although in the latter two, there was a sharp peak 2 years ago).

Section 7: Consumer Research Responses

Purpose of visit
District Centre 1 2
Baker Street (South) Work (52%) Shopping (13%)Berwick Street Work (39%) Shopping (35%)Church Street / Edgware Road Shopping (69%) Work (8%)Edgware Road (South) Shopping (58%) Work (19%)Harrow Road Shopping (68%) Work (12%)Marylebone High Street Shopping (33%) Work (33%)
Consumer Survey responses; top 2
Work and shopping are the primary reasons for visiting in all of the centres.
Church Street / Edgware Road , Harrow Road and Edgware Road (South) are attracting significant proportions of shopping visits, illustrating their primary
30
y g pp g ( ) ( )Praed Street Work (39%) Shopping (14%)Queensway / Westbourne Grove Shopping (35%) Work (28%)St John’s Wood High Street Shopping (44%) Work (23%)Warwick Way / Tachbrook Street Shopping (48%) Work (21%)
illustrating their primary convenience shopping function in predominantly residential areas.
Baker Street (South), Berwick Street and Praed Street are locations dominated by local workers.

Visiting the centre more or less than a year ago?
District Centre More Less Same
Baker Street (South) 17% 3% 72%Berwick Street 21% 5% 67%Church Street / Edgware Road 2% 7% 88%Edgware Road (South) 7% 9% 81%Harrow Road 13% 5% 73%Marylebone High Street 15% 5% 75%
Consumer Survey responses (top 3 responses)
Across all the centres surveyed, consumers consider that their visit patterns remain largely unchanged since last year.
Many are benefitting from more frequent visit patterns, in particular; Berwick Street, Baker Street (South), Marylebone High Street
31
y gPraed Street 15% 7% 65%Queensway / Westbourne Grove 10% 3% 84%St John’s Wood High Street 11% 9% 79%Warwick Way / Tachbrook Street 11% 3% 79%
( ), y gand Praed Street.
Overall the picture is one of stability and more frequent visits for most centres.

Mode of travel
District Centre 1 2 3
Baker Street (South) Train / Undergrd (45%) Bus (23%) Walk (23%)Berwick Street Train / Undergrd (53%) Walk (24%) Bus (14%)Church Street / Edgware Road Walk (56%) Bus (31%) Car (7%)Edgware Road (South) Walk (47%) Bus (27%) Train / Undergrd (15%)Harrow Road Walk (61%) Bus (25%) Car (6%)Marylebone High Street Train / Undergrd (40%) Walk (35%) Car (9/10%)
Consumer Survey responses; top 3
32
y g g ( ) ( ) ( )Praed Street Train / Undergrd (33%) Walk (32%) Bus (31%)Queensway / Westbourne Grove Walk (50%) Train / Undergrd (25%) Bus (17%)St John’s Wood High Street Walk (56%) Car (16%) Train / Undergrd (14%)Warwick Way / Tachbrook Street Walk (82%) Train / Undergrd (8%) Car (4%)
Walking is the main method of travel for most locations reflecting the ‘local’ often residential characteristic of the consumer base, in particular Warwick Way / Tachbrook Street and Harrow Road.Public transport dominates as a mode of transport across all centres, many of which are well served by underground and sometimes mainline rail services in addition to local buses.Car usage is very low.

Parking*: Consumer view
District Centre Availability Charges
Baker Street (South) Poor / Very Poor (44%) Poor / Very Poor (41%)Berwick Street Poor / Very Poor (46%) Poor / Very Poor (50%)Church Street / Edgware Road Poor / Very Poor (23%) Poor / Very Poor (25%)Edgware Road (South) Poor / Very Poor (56%) Poor / Very Poor (60%)Harrow Road Poor / Very Poor (58%) Poor / Very Poor (57%)Marylebone High Street Poor / Very Poor (33%) Poor / Very Poor (45%)
Consumer Survey responses, scored 1 – very poor to 5 – very good Parking is perceived poorly by consumers overall.
Parking availability and parking cost is perceived as poor by over half of respondents in Edgware Road (South), H R d d S
33
y g y ( ) y ( )Praed Street Poor / Very Poor (45%) Poor / Very Poor (50%)Queensway / Westbourne Grove Poor / Very Poor (21%) Poor / Very Poor (34%)St John’s Wood High Street Poor / Very Poor (56%) Poor / Very Poor (57%)Warwick Way / Tachbrook Street Poor / Very Poor (32%) Poor / Very Poor (43%)
* This question achieved a very high level of no replies reflecting the low car usage
Harrow Road and St John’s Wood High Street.
However it should be noted that car usage is very low and the high level of ‘no replies’ to this question reflects this.
Parking often scores badly in this type of consumer survey.

Satisfaction: Consumer
District Centre Satisfied / Very Satisfied
Baker Street (South) 76%Berwick Street 77%Church Street / Edgware Road 75%Edgware Road (South) 56%*Harrow Road 54%*Marylebone High Street 96%
Consumer Survey responses
Satisfaction among consumers is generally high, in particular at Marylebone High Street which scored the highest overall rating by far.
St John’s Wood High Street and Warwick Way / Tachbrook Street also score very highly
34
y gPraed Street 69%Queensway / Westbourne Grove 77%St John’s Wood High Street 82%Warwick Way / Tachbrook Street 81%
* High percentage of neither / nor
also score very highly.
The lowest levels of satisfaction were at Harrow Road and Edgware Road (South), though in both instances the question received a significant proportion of ‘neither / nor’ responses.

Section 8: Business

Parking: Business view
District Centre Availability Charges Restrictions
Baker Street (South) Poor / Very Poor (59%) Poor / Very Poor (53%) Poor / Very Poor (53%)Berwick Street Poor / Very Poor (76%) Poor / Very Poor (69%) Poor / Very Poor (64%)Church Street / Edgware Road Poor / Very Poor (57%) Poor / Very Poor (52%) Poor / Very Poor (60%)Edgware Road (South) Poor / Very Poor (66%) Poor / Very Poor (65%) Poor / Very Poor (65%)Harrow Road Poor / Very Poor (73%) Poor / Very Poor (58%) Poor / Very Poor (69%)Marylebone High Street Poor / Very Poor (55%) Poor / Very Poor (53%) Poor / Very Poor (51%)
Business Survey responses, scored 1-5 very poor to very good
36
y g y ( ) y ( ) y ( )Praed Street Poor / Very Poor (59%) Poor / Very Poor (50%) Poor / Very Poor (48%)Queensway / Westbourne Grove Poor / Very Poor (53%) Poor / Very Poor (46%) Poor / Very Poor (48%)St John’s Wood High Street Poor / Very Poor (60%) Poor / Very Poor (50%) Poor / Very Poor (52%)Warwick Way / Tachbrook Street Poor / Very Poor (46%) Poor / Very Poor (56%) Poor / Very Poor (44%)
Parking is perceived poorly by businesses overall. The negative perception is even higher among businesses than consumers.Parking availability, charges and restrictions are viewed very negatively by businesses in Berwick Street, Edgware Road (South) and Harrow Road. However the Consumer Survey identified that overall car usage is very low.

Trading performance
District Centre Up Down Level No response
Baker Street (South) 42% 25% 12% 21%Berwick Street 25% 33% 16% 26%Church Street / Edgware Road 24% 25% 32% 19%Edgware Road (South) 25% 32% 13% 30%Harrow Road 33% 43% 23% 1%Marylebone High Street 28% 21% 18% 33%
Business Survey responses
Given the current economic climate trading performance in the centres is largely good.
Baker Street (South) and Marylebone High Street report strong trading performances with over half up or level on the year.
37
y gPraed Street 21% 40% 17% 22%Queensway / Westbourne Grove 29% 36% 18% 17%St John’s Wood High Street 27% 27% 14% 32%Warwick Way / Tachbrook Street 44% 40% 17% –
Harrow Road, Praed Street and Warwick Way / Tachbrook Street have the greatest proportion of businesses reporting that their trading is down on last year.

Future expectations: Next 12 months
District Centre Improve Stay the same Decline
Baker Street (South) 48% 24% 9%Berwick Street 31% 26% 22%Church Street / Edgware Road 16% 31% 28%Edgware Road (South) 22% 37% 21%Harrow Road 17% 25% 33%Marylebone High Street 42% 35% 7%
Business Survey responses
Overall, businesses are fairly positive about their future trading expectations.
Businesses in Baker Street (South), Marylebone High Street and Queensway / Westbourne Grove are particularly positive.
38
y gPraed Street 31% 25% 19%Queensway / Westbourne Grove 39% 25% 24%St John’s Wood High Street 29% 25% 25%Warwick Way / Tachbrook Street 21% 35% 21%
Businesses in Harrow Road and Church Street / Edgware Road are the least positive.

Satisfaction: Business
District Centre Would Recommend as a Trading Location
Baker Street (South) 66%Berwick Street 44%*Church Street / Edgware Road 40%*Edgware Road (South) 49%*Harrow Road 34%
Business Survey responses
Satisfaction with the location is highest in Marylebone High Street and Baker Street (South) where the majority of businesses surveyed would recommend it as a trading location.
Satisfaction with the location is lowest in Harrow Road
39
Marylebone High Street 76%Praed Street 58%Queensway / Westbourne Grove 58%St John’s Wood High Street 54%Warwick Way / Tachbrook Street 54%
* High percentage of neither / nor responses
lowest in Harrow Road.
In Edgware Road (South), Berwick Street and Church Street / Edgware Road a high proportion of ‘neither / nor’ responses were received indicating a degree of ambivalence towards the location.

Section 9: Health Check Conclusion

Overall Health Check conclusion
District Centre Conclusion 2013 vs. 2007/8
Baker Street (South) Healthy HealthyBerwick Street* Healthy N/AChurch Street / Edgware Road Neutral NeutralEdgware Road (South) Healthy HealthyHarrow Road In decline In declineMarylebone High Street Healthy Healthy
The majority of the locations in the health check programme are in good health.
Warwick Way / Tachbrook Street and Praed Street have moved from a neutral position to healthy.
Harrow Road is the only location
41
y g y yPraed Street Healthy NeutralQueensway / Westbourne Grove Healthy HealthySt John’s Wood High Street Healthy HealthyWarwick Way / Tachbrook Street Healthy Neutral
* Berwick Street: no previous health check completed
ywhich remains in decline, and Church Street / Edgware Road the only one whose health remains neutral.

The Retail GroupInformed Solutions
Dunnings Oak Offices, Dunnings Road,East Grinstead, West Sussex, RH19 4AT
Tel. 0844 209 8480 Fax. 0844 209 8481Web. www.theretailgroup.co.ukEmail. [email protected]