wetland assessment and monitoring - scs home
TRANSCRIPT

WETLAND ASSESSMENT AND MONITORING
Vo Si Tuan, Senior Expert The Project Coordinating Unit, Division of Global Environment Facility Coordination, United Nations Environment Programme E-mail: [email protected]
Regional Training Course on Sustainable Use and Management of Wetlands, Mahidol University, Thailand, 5th – 20th November 2007
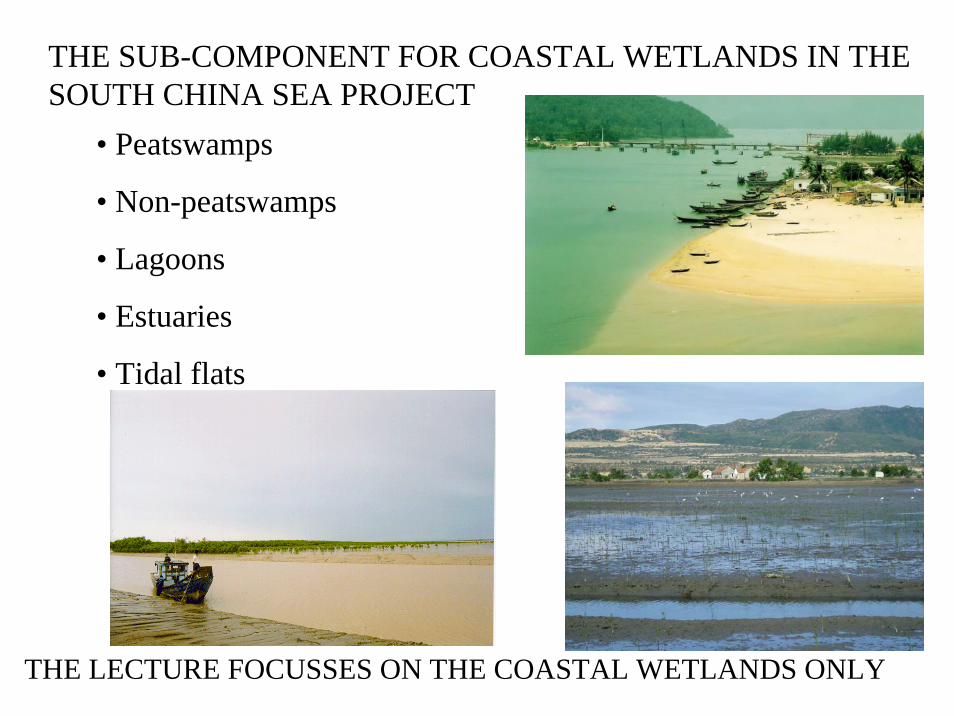
THE SUB-COMPONENT FOR COASTAL WETLANDS IN THE SOUTH CHINA SEA PROJECT
• Peatswamps
• Non-peatswamps
• Lagoons
• Estuaries
• Tidal flats
THE LECTURE FOCUSSES ON THE COASTAL WETLANDS ONLY

CONCEPTS
Assessment is the process of documenting, usually in measurable terms, knowledge, skills, attitudes and beliefs(Wikipedia); or to judge or decide the amount, value, quality or importance of something (Cambridge Advanced Learner's Dictionary)
Habitat Assessment (scientific and technical activities)
Provision of knowledge on habitats and ecosystems, and resources, and their inter-connectivity with ambient environments
Understanding of threats and impact by human activities
Linkages between natural and socio-economic systems
CONCEPTS (cont.)
To monitor or monitoring generally means to be aware of the state of a system (Wikipedia); or to watch and check a situation carefully for a period of time in order to discover something about it (Cambridge Advanced Learner's Dictionary)
Habitat Monitoring (possible resources management activities)
Records evidences of changes in physical, biological, conditions, environment quality and related socio-economic activities
Do not confuse with Project/Programme Monitoring that includes collecting information that will help to answer questions about the project. This information is collected in a planned, organised and routine way and used to report on a project achievement and to help in evaluation of whether the project achieves its objectives

Assessment: Measurement of state, providing knowledge and understanding on natural and socio-economic characteristics and processes
Monitoring: Sequential measurement of state, that enables “change” to be detected; possible used to evaluate effectiveness of a certain management action and/or implementation of a management plan for adaptive management
ASSESSMENT IS REQUIRED IN THE BEGINING OF ANY MANAGEMENT ACTION OR/AND PLAN TO DEFINE THE
BASELINE FOR PLANNING; AND AGAINT WHICH MONITORING IS UNDERTAKEN
MONITORING IS CONTINUOUS PRACTICES IN ADVANCE OF, DURING AND AFTER ACTIONS FOR
ADAPTIVE MANAGEMENT
PURPOSES

METHODOLOGY FOR ASSESSEMENT AND MONITORING
METHODOLOGY USED FOR AN ASSESSMENT OR MONITORING SHOULD BE BASED ON LEVELS OF
REQUIREMENT FOR SCIENTIFICALLY SOUND DATA AND INFORMATION; AND HUMAN AND FINANCIAL CAPACITY
Field surveys and/or establishment of permanent measure stations
Laboratory work
Secondary data collection and analysis
Participatory Rural Appraisal*
Mapping and GIS
Application of Remote Sensing
Trace tracking
Others
METHODOLOGY (Cont.)
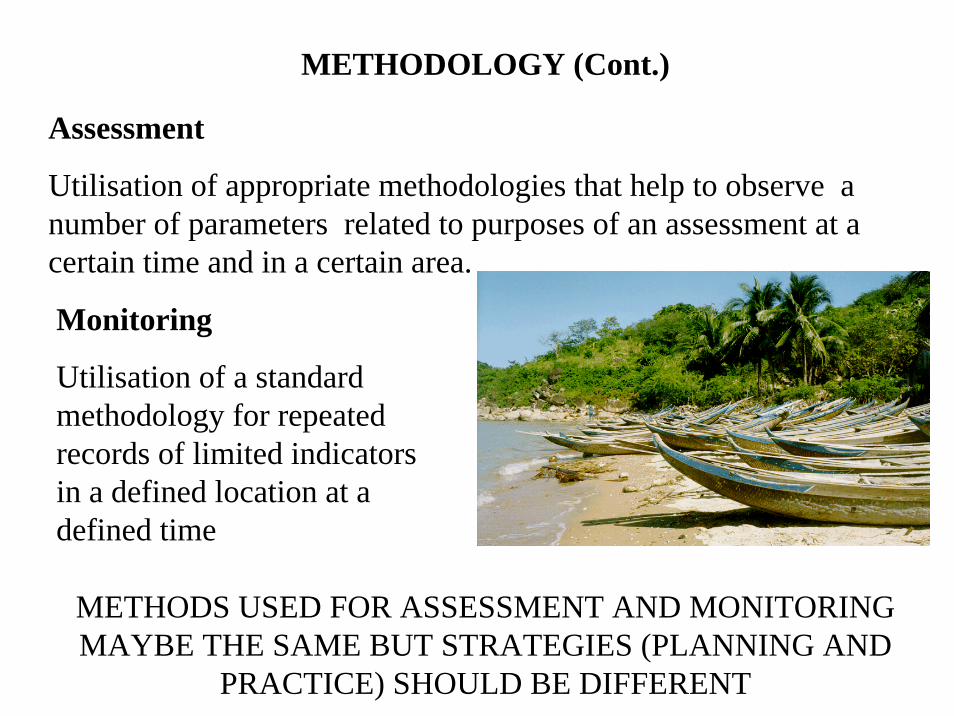
Assessment
Utilisation of appropriate methodologies that help to observe anumber of parameters related to purposes of an assessment at a certain time and in a certain area.
Monitoring
Utilisation of a standard methodology for repeated records of limited indicators in a defined location at a defined time
METHODS USED FOR ASSESSMENT AND MONITORING MAYBE THE SAME BUT STRATEGIES (PLANNING AND
PRACTICE) SHOULD BE DIFFERENT
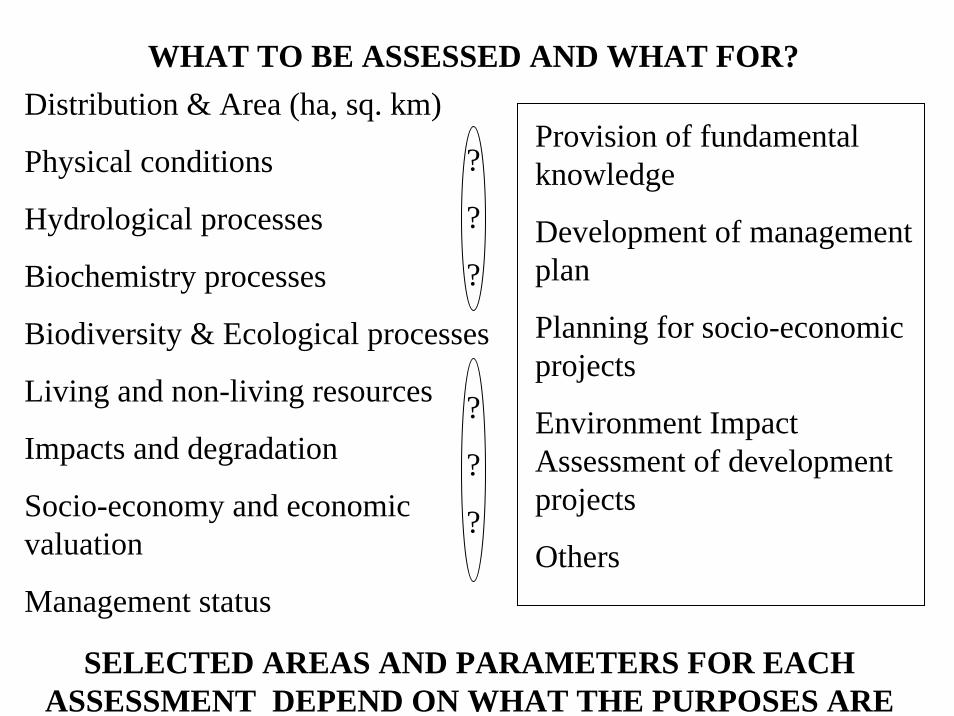
WHAT TO BE ASSESSED AND WHAT FOR?
SELECTED AREAS AND PARAMETERS FOR EACH ASSESSMENT DEPEND ON WHAT THE PURPOSES ARE
Distribution & Area (ha, sq. km)
Physical conditions
Hydrological processes
Biochemistry processes
Biodiversity & Ecological processes
Living and non-living resources
Impacts and degradation
Socio-economy and economic valuation
Management status
Provision of fundamental knowledge
Development of management plan
Planning for socio-economic projects
Environment Impact Assessment of development projects
Others
?
?
?
?
?
?

CASE STUDY 1*. ECOLOGICAL SIGNIFICANCE AND POTENTIAL FOR DEVEPMENT OF THE WETLAND OF THE
LOWER BARITO BASIN (SOUTH KALIMANTAN, INDONESIA)
Hydrology
Rainfall, temperature, evaporation
Swamp water levels and flows
Tidal regime
Water quality
Soil
Habitats & Flora and fauna
Bird and wildlife
Fisheries
Fish culture and other livestock
Social and economic Situation
CONCLUSIONLoss of natural resources due to development without consideration of environment impacts
Proposed options for sustainable development:
• Carefully executed extension of traditional utilisation;
• Better management of forestry & Rattan cultivation;
• Formalised and extended protection of fish resources; and
•Intensification of existing irrigation scheme

CASE STUDY 2. ASSESSMENT FOR DEVELOPMENT OF THE PLAN FOR ECOLOGICAL RESTORATION AND SUSTAINABLE
USE OF CON CHIM AREA, THI NAI LAGOON, VIETNAM
%
32
77
404240
0
20
40
60
80
100
2001 2002 2003 2004 2005
Tỷ lệ diện tích nuôi bị nhiễm bệnh (2001-2005)% of culture area collapsed by disease
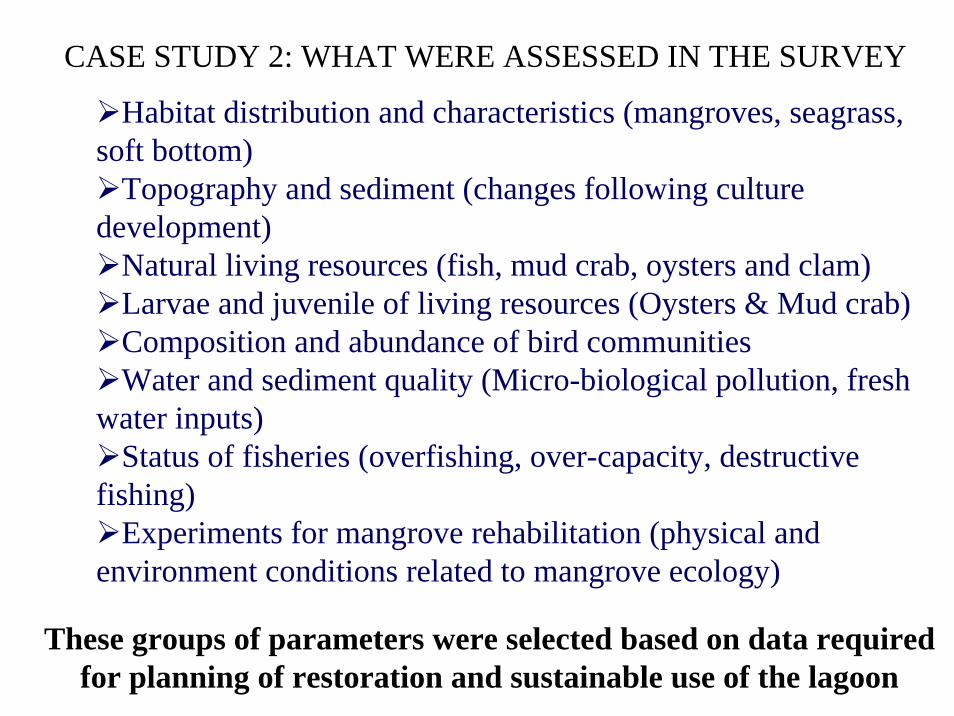
CASE STUDY 2: WHAT WERE ASSESSED IN THE SURVEY
Habitat distribution and characteristics (mangroves, seagrass, soft bottom)
Topography and sediment (changes following culture development)
Natural living resources (fish, mud crab, oysters and clam)Larvae and juvenile of living resources (Oysters & Mud crab)Composition and abundance of bird communitiesWater and sediment quality (Micro-biological pollution, fresh
water inputs)Status of fisheries (overfishing, over-capacity, destructive
fishing)Experiments for mangrove rehabilitation (physical and
environment conditions related to mangrove ecology)
These groups of parameters were selected based on data required for planning of restoration and sustainable use of the lagoon
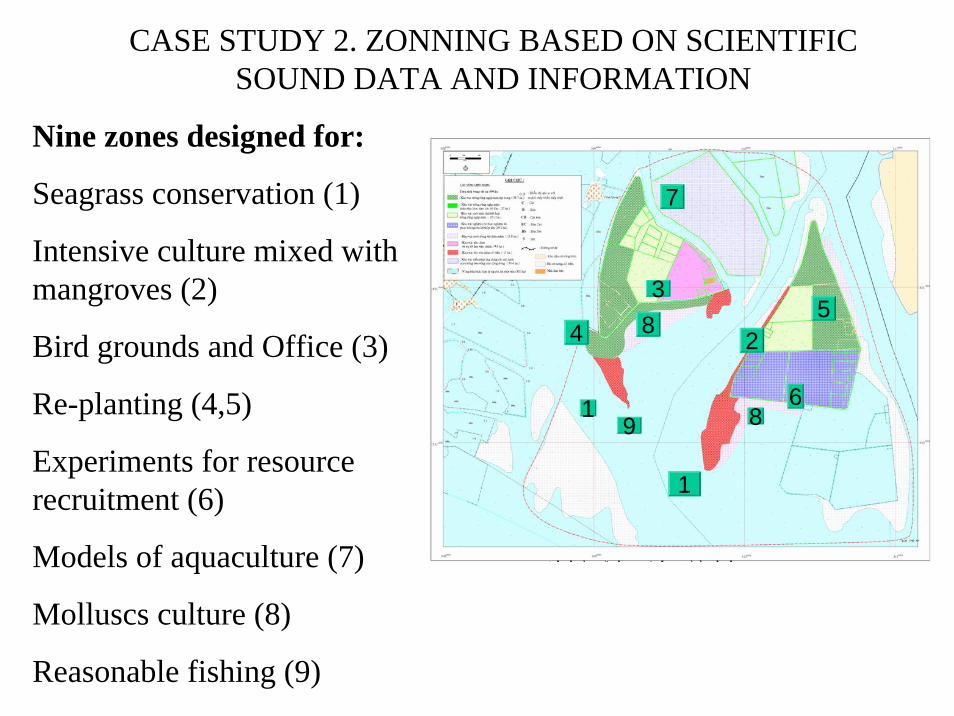
Nine zones designed for:
Seagrass conservation (1)
Intensive culture mixed with mangroves (2)
Bird grounds and Office (3)
Re-planting (4,5)
Experiments for resource recruitment (6)
Models of aquaculture (7)
Molluscs culture (8)
Reasonable fishing (9)
CASE STUDY 2. ZONNING BASED ON SCIENTIFIC SOUND DATA AND INFORMATION
1
1
3
25
4
6
7
8
89

DEVELOPMENT OF MONITORING STRATEGY
Selection of indicators
Location
Time and FrequencyMeasurable
Quantifiable
Realistic
Actually related to what needs to be evaluated
Human capacity
Facilities & equipment
Financial demand
Consideration of space and time frame of natural process
Realistic and adaptive
Local involvement

STEPS IN DEVELOPMENT AND IMPLEMENATTION OF A MONITORING STRATEGY
1. Identification of purpose(s)
2. Preliminary surveys
3. Selection of indicators
4. Selection of sampling sites and time arrangement
5. Standardisation of monitoring methods (collection, transportation and store of samples, analytical methods)
6. Preparation of equipment, human capacity & budget
7. Monitoring practices
8. Data analysis and reporting
9. Interpretation of data and information to management
RELAIONSHIP AMONG STEPS AND WITH REAL CONDITIONS
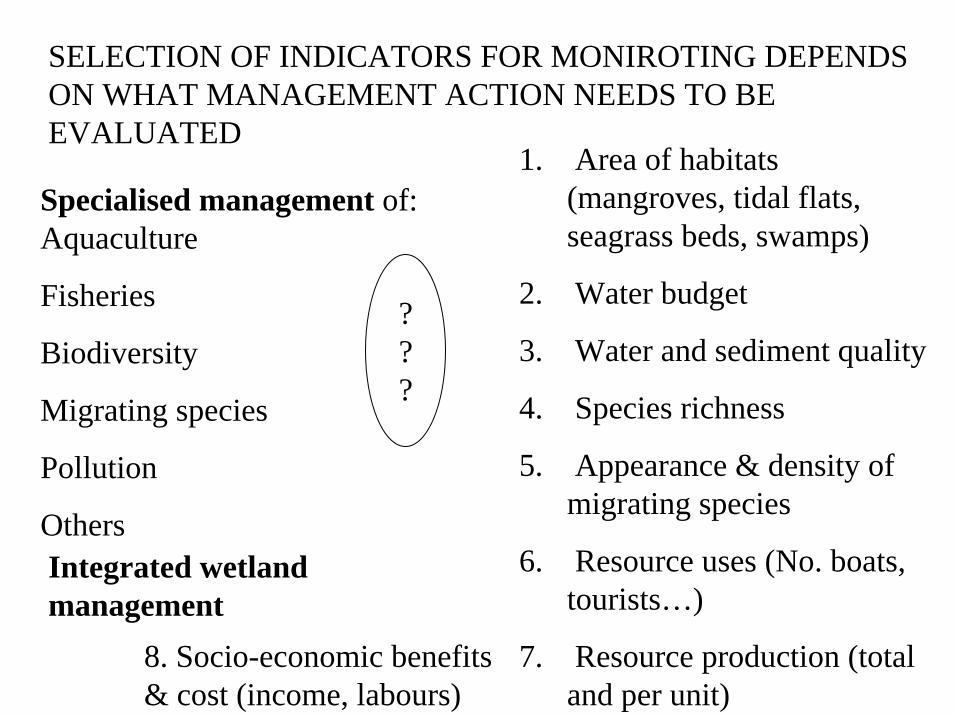
1. Area of habitats (mangroves, tidal flats, seagrass beds, swamps)
2. Water budget
3. Water and sediment quality
4. Species richness
5. Appearance & density of migrating species
6. Resource uses (No. boats, tourists…)
7. Resource production (total and per unit)
SELECTION OF INDICATORS FOR MONIROTING DEPENDS ON WHAT MANAGEMENT ACTION NEEDS TO BE EVALUATED
Specialised management of: Aquaculture
Fisheries
Biodiversity
Migrating species
Pollution
OthersIntegrated wetland management
8. Socio-economic benefits & cost (income, labours)
???
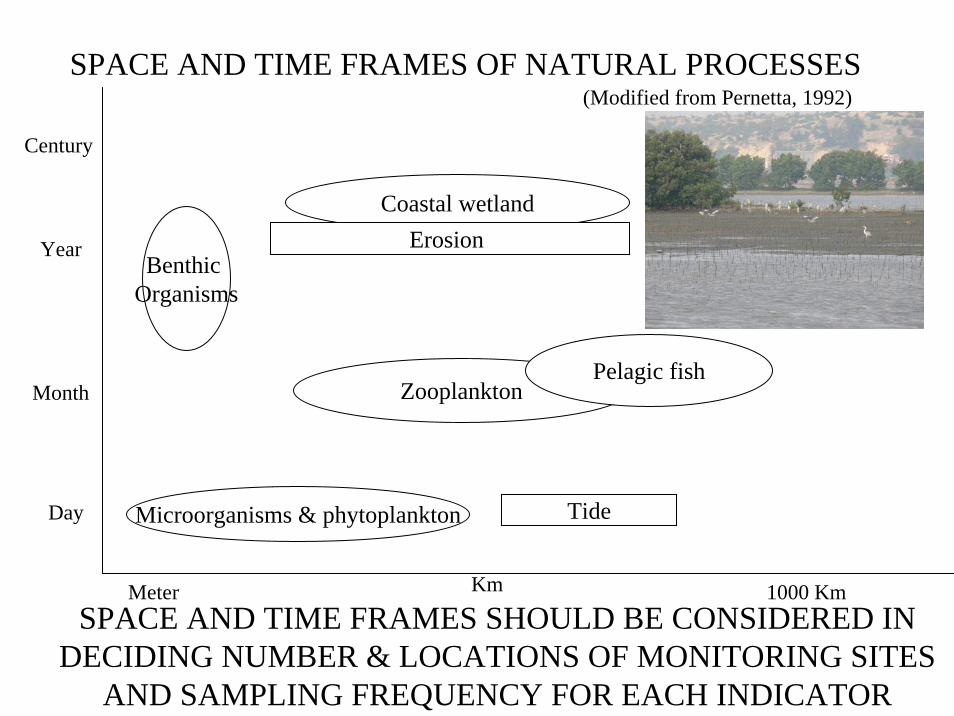
SPACE AND TIME FRAMES OF NATURAL PROCESSES
SPACE AND TIME FRAMES SHOULD BE CONSIDERED IN DECIDING NUMBER & LOCATIONS OF MONITORING SITES
AND SAMPLING FREQUENCY FOR EACH INDICATOR
Day
Month
Year
Century
Meter Km 1000 Km
Microorganisms & phytoplankton Tide
Zooplankton
Coastal wetland
Benthic Organisms
Erosion
(Modified from Pernetta, 1992)
Pelagic fish
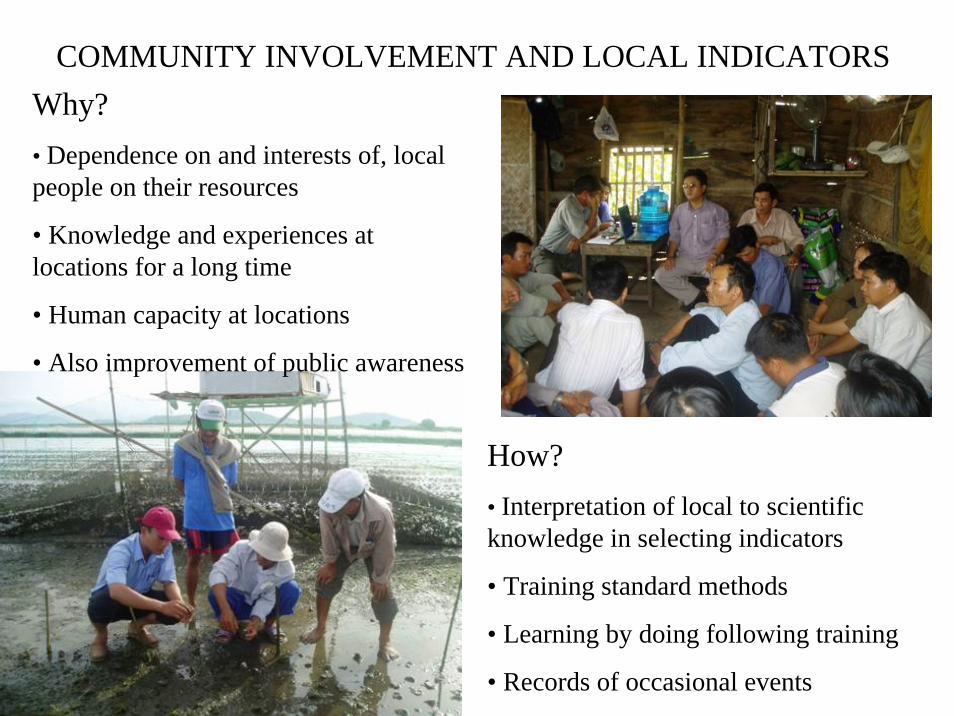
COMMUNITY INVOLVEMENT AND LOCAL INDICATORSWhy?• Dependence on and interests of, local people on their resources
• Knowledge and experiences at locations for a long time
• Human capacity at locations
• Also improvement of public awareness
How?• Interpretation of local to scientific knowledge in selecting indicators
• Training standard methods
• Learning by doing following training
• Records of occasional events
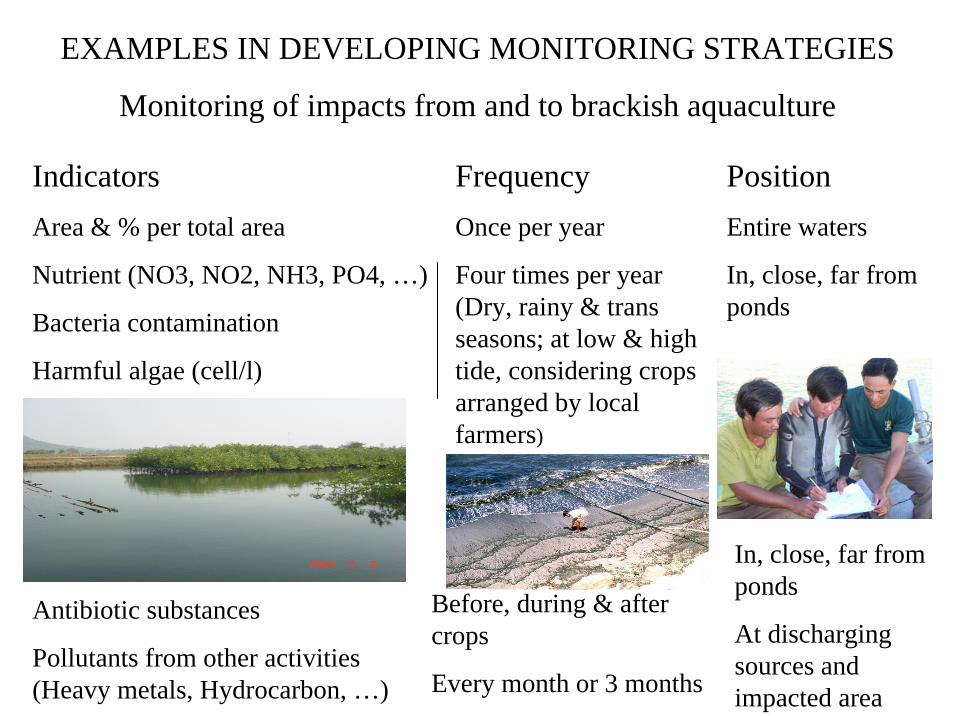
EXAMPLES IN DEVELOPING MONITORING STRATEGIES
Monitoring of impacts from and to brackish aquaculture
IndicatorsArea & % per total area
Nutrient (NO3, NO2, NH3, PO4, …)
Bacteria contamination
Harmful algae (cell/l)
Antibiotic substances
Pollutants from other activities (Heavy metals, Hydrocarbon, …)
PositionEntire waters
In, close, far from ponds
FrequencyOnce per year
Four times per year (Dry, rainy & trans seasons; at low & high tide, considering crops arranged by local farmers)
Before, during & after crops
Every month or 3 months
In, close, far from ponds
At discharging sources and impacted area

EXAMPLES IN DEVELOPING MONITORING STRATEGIES
Monitoring of impacts from and to brackish aquaculture (cont.)
IndicatorsCase of diseases
Culture productivity (ton/ha)
Net benefit per ha
Total income
Social problems
Others ?????
Entire culture area
Entire culture area
Entire culture area
All farmers involved
Villages involved
?
Every crop
Every crop
Every year
Every year
Every year
?
Frequency Position
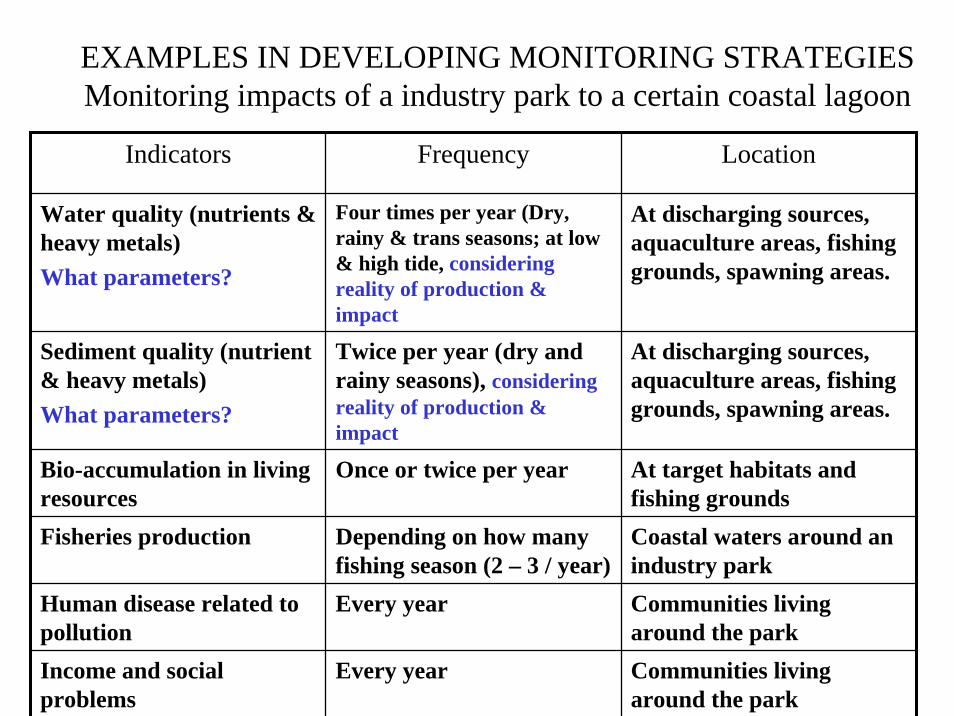
EXAMPLES IN DEVELOPING MONITORING STRATEGIESMonitoring impacts of a industry park to a certain coastal lagoon
Indicators Frequency Location
Water quality (nutrients & heavy metals)What parameters?
Four times per year (Dry, rainy & trans seasons; at low & high tide, considering reality of production & impact
At discharging sources, aquaculture areas, fishing grounds, spawning areas.
Sediment quality (nutrient & heavy metals)What parameters?
Twice per year (dry and rainy seasons), considering reality of production & impact
At discharging sources, aquaculture areas, fishing grounds, spawning areas.
Bio-accumulation in living resources
Once or twice per year At target habitats and fishing grounds
Fisheries production Depending on how many fishing season (2 – 3 / year)
Coastal waters around an industry park
Human disease related to pollution
Every year Communities living around the park
Income and social problems
Every year Communities living around the park
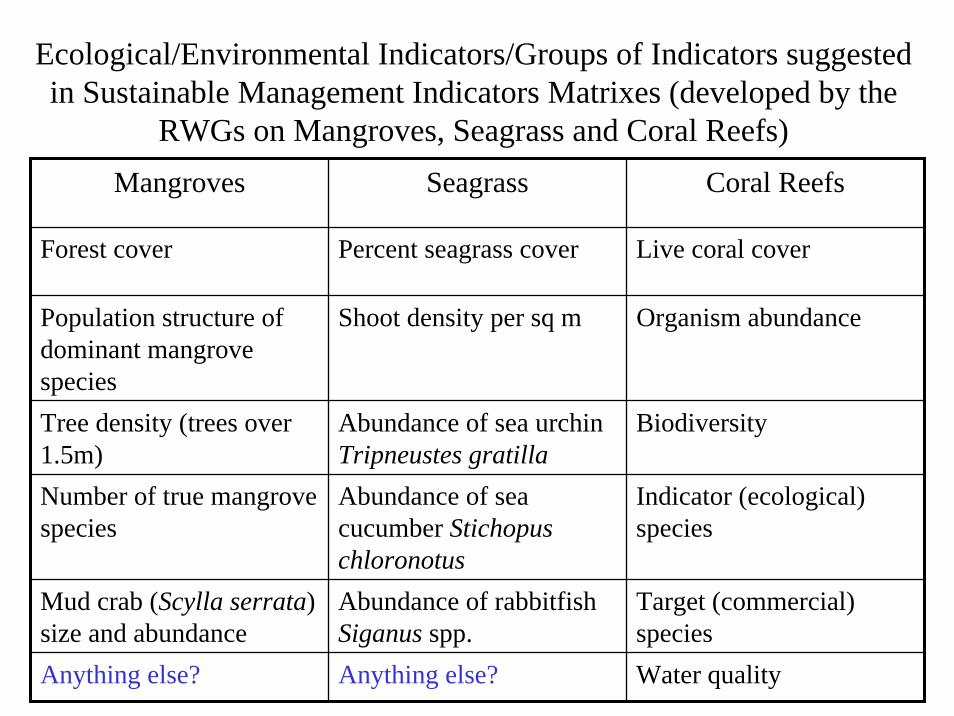
Ecological/Environmental Indicators/Groups of Indicators suggested in Sustainable Management Indicators Matrixes (developed by the
RWGs on Mangroves, Seagrass and Coral Reefs)Mangroves Seagrass Coral Reefs
Forest cover Percent seagrass cover Live coral cover
Population structure of dominant mangrove species
Shoot density per sq m Organism abundance
Tree density (trees over 1.5m)
Abundance of sea urchin Tripneustes gratilla
Biodiversity
Number of true mangrove species
Abundance of sea cucumber Stichopus chloronotus
Indicator (ecological) species
Mud crab (Scylla serrata) size and abundance
Abundance of rabbitfish Siganus spp.
Target (commercial) species
Anything else? Anything else? Water quality

Management Indicators Ecological/Environ-mental Indicators
Socio-Economic IndicatorsMANAGEMENT CAPACITY
•Formal Management framework•Trained Man-power (No./levels)•Facilities and equipment•Sustainable Financing•Regional wetland information system operational
•Wetland area (ha)
•Water quality (nutrients, pH, turbidity, and hydrocarbons)
•Hydrological and sedimentary patterns
•Flora and fauna (vegetation, dominant species, abundance of flagship species, exotic invasive species, endemic species, biodiversity index)
FISHERIES•Catch per unit effort•Total landing•Catch composition•Income
MANAGEMENT APPROACH•Sectoral•Integrated•Community-based•Multiple-use
TOURISM•Number of visitors•Number of tourism operators•Income
FORESTRY (Peat Swamp)•Volume of timber•Income
MANAGEMENT TOOLS•Monitoring system established•Regulations and agreements (e.g. seasonal closures, zoning, licensing, and permits)
OTHER ACTIVITIES•Numbers of people involved•Per capita incomeOVERALL LIVING STANDARD•Population density•Level of education•Health of the community•Cultural aspects
SUSTAINABLE MANAGEMENT INDICATOR MATRIX FOR WETLAND (developed by the Regional Working Group on Wetlands)
What are indicators for monitoring?

QUESTIONS AND DISCUSSION
PERSPECTIVES AND GAPS IN WETLAND ASSESSEMNT & MONITORING IN YOUR COUNTRIES?

?
?
?
?
?
?
?
INPUTS FROM THE PARTICIPANTS