wgr sc ks_report
TRANSCRIPT

South Central Gaming Zone of Kansas
Projections of Casino Visits and Gaming Revenues
Prepared For:
Kansas Lottery Gaming Facility Review Board October 2009
Prepared by:
Wells Gaming Research 495 Apple Street, Suite 205 - Reno, NV 89502 775-826-3232 - http://www.wellsgaming.com

South Central Gaming Zone of Kansas Projections of Casino Visits & Gaming Revenues
Wells Gaming Research October 2009
Table of Contents
Page #
Section 1
Introduction 1-1
Project Objective 1-4
Scope of Work & Research Methodology 1-5
Map - South Central Kansas Zone 1-6
Gravity Model 1-7
Limiting Conditions 1-9
Section 2
Executive Summary
Highlights of the Scope of Work 2-1
Casino Capacities for the SC Trade Area - Summary 2-2
Trade Area Demographics - Summary 2-3
Casino Visits Projections - WGR & Chisholm Creek 2-4
Gaming Revenues Projections - WGR & Chisholm Creek 2-5
Key 2009 Applicant Forecasts
Chisholm Creek Compared with WGR & the 2008 Applicants 2-6
Section 3
Chisholm Creek Casino Resort Detail
Site Map 3-1
Facility Statistics & Amenities 3-2
Gaming Capacity 3-5
Trade Area Demographics - Detail 3-7
Casino Visit Projection Details - WGR & Chisholm Creek 3-10
Gaming Revenue Projection Details - WGR & Chisholm Creek 3-11
Comparative Analyses - Details
Chisholm Creek Compared with 2008 Applicants 3-12

South Central Gaming Zone of Kansas Projections of Casino Visits & Gaming Revenues
Wells Gaming Research October 2009
Section 1
Introduction, Research Methodology, & Limiting Conditions

South Central Gaming Zone of Kansas Projections of Casino Visits & Gaming Revenues
October 2009 Wells Gaming Research Page 1-1
Introduction The State of Kansas has lost gaming revenues for many years to a number of surrounding states, particularly to Missouri and Oklahoma. The recent development of numerous tribal casinos in Oklahoma has exacerbated the problem. In an effort to stem the flow of gaming revenues and related taxes out of the State of Kansas, the legislature passed Senate Bill 66 (SB 66), the Kansas Expanded Lottery Act, which legalized casino gaming. The governor, Kathleen Sebelius, signed SB 66 on April 12, 2007. Key Gaming Provisions of Senate Bill 66
1. Establishment of four casino gaming zones: Northeast (located in Wyandotte County) Southeast (located in Crawford and Cherokee Counties) South Central (located in Sumner and Sedgwick Counties) Southwest (located in Ford County)
2. Building one state owned lottery gaming facility in each of the four Kansas
gaming zones.
3. Permitting an aggregate of 2,800 slot machines to be installed at the three existing racetracks.
Other provisions included in SB 66:
Referendum Elections SB 66 required the counties located within the four subject gaming zones to hold referendum elections for the purpose of either approving or disapproving casino gaming, or slot machines to be located at their respective racetracks. Three gaming zones have racetracks (northeast, southeast, and south central). However, Sedgwick County, located in the south central gaming zone, rejected gaming in their referendum election. As a result, slot machines will be limited to two Kansas racetracks: The Woodlands (closed in 2008) located in Kansas City, Kansas (northeast gaming zone), and Camptown Greyhound Park (closed since November 2000) located near Frontenac, Kansas (southeast gaming zone).
Kansas Lottery Commission Casino companies interested in developing casino projects in one of the gaming zones must submit their applications to the Executive Director of the Kansas Lottery Commission. The lottery commission approves management contracts with potential lottery gaming facility managers to operate and/or to construct and operate a casino within one of the four designated gaming zones where it has been determined that the casino would promote tourism and generate economic development. Kansas Lottery Commission negotiates and signs a contract with

South Central Gaming Zone of Kansas Projections of Casino Visits & Gaming Revenues
October 2009 Wells Gaming Research Page 1-2
the applicant(s). These documents are, in turn, sent to the Lottery Gaming Facility Review Board for consideration. Lottery Gaming Facility Review Board SB 66 provided for the creation of an independent, seven-member lottery gaming facility review board (three members are appointed by the governor, two by the president of the senate, and two by the speaker of the house). The Lottery Gaming Facility Review Board evaluates the applications to become lottery gaming facility managers that are submitted to the Kansas Lottery Commission. The Board can engage recognized experts and consultants in the casino gaming industry to provide the assistance necessary to fully review and analyze the subject applications. The cost for the outside services is paid by the prospective lottery gaming facility managers.
Capital Investment Requirements & Privilege Fees SB 66 requires the casino developers to make the following minimum capital investments, and pay the accompanying privilege fees.
Gaming
Zone
Minimum
Capital Investment (Dollars in Millions)
Privilege Fee (Dollars in Millions)
Northeast $225 $25
Southeast $225 $25
South Central $225 $25
Southwest $50 $5 The capital investment represents the minimum investment required to build the proposed gaming facility. The privilege fee is an upfront, one-time fee paid by the prospective lottery gaming facility manager, for the privilege of being selected as a lottery gaming facility manager of a lottery gaming facility. For example, a developer in the south central gaming zone would be required to make a minimum capital investment of $225 million and pay a one-time only privilege fee of $25 million to the state. Creation of a State Owned Lottery Gaming Facility SB 66 stipulates that the Kansas lottery gaming facilities will be state-owned, the first in the United States. The state will own and control the gaming functions. The Lottery Gaming Facility Review Board will select the applicants, who in turn will become gaming facility managers of the state-owned gaming facilities. These managers will act on behalf of the Kansas Lottery Commission. The gaming facility managers will fund, build, and operate all of the lottery gaming facilities under contract with the state lottery.
South Central Gaming Zone of Kansas Projections of Casino Visits & Gaming Revenues
October 2009 Wells Gaming Research Page 1-3
Gaming Taxes The contract managers will be required to pay the following taxes, all of which are based on a percentage of each lottery gaming facility’s gaming revenues:
1. The lottery gaming facility would pay a minimum of 22% of gaming revenues to the state, plus an additional 2% to fund programs for problem gamblers and gaming addiction issues.
2. If a lottery gaming facility were located in either the northeast or southwest
gaming zones, but not in a city, the gaming facility would be required to pay an additional 3% of gaming revenues to the county where the gaming facility was located.
3. If, on the other hand, the gaming facility were located in a city, the facility
would pay 1.5% of gaming revenues to the city and 1.5% to the county.
4. If the lottery gaming facility were located in either the southeast or the south central gaming zone, but not in a city, the lottery gaming facility would pay 2% of gaming revenues to the county in which the facility were located, and an additional 1% to the other county in the gaming zone (each gaming zone has two counties).
5. If a gaming facility were located in a city, a combined tax equal to 3% of
gaming revenues would be paid to the city (1%), to the county in which the lottery gaming facility were located (1%), and to the second county in the gaming zone (1%).
2009 Applications The State of Kansas reopened the application bidding process in 2009. To date, only two of the gaming zones (northeast and south central) have applicants who are positioned to move forward with their respective lottery gaming facilities: the Hollywood Casino (northeast zone) and the Chisholm Creek Casino Resort (south central zone).

South Central Gaming Zone of Kansas Projections of Casino Visits & Gaming Revenues
October 2009 Wells Gaming Research Page 1-4
Gaming Revenue Potential in Kansas Before enactment of Senate Bill 66 (the Kansas Expanded Lottery Act), the Kansas Lottery Commission engaged Christensen Capital to update their study addressing the gaming revenue potential of the four Kansas gaming zones. The updated study was released in March of 2008. The Kansas Lottery Gaming Facility Review Board engaged experts in 2008 to address a variety of issues including the gaming revenue potential for the State of Kansas. Wells Gaming Research (WGR) and Cummings & Associates were both asked to conduct independent market analyses of the four gaming zones, and to evaluate the revenue potential of each applicant’s proposal. This evaluation process was completed in September 2008, and four winning applicants were selected: the Hard Rock Speedway (northeast zone), Penn National Hollywood (southeast zone), Harrah’s (south central zone), and Boot Hill (southwest zone).
Recession Impacts The 2008-2009 ongoing recession has unfortunately triggered severe economic downturns in the casino gaming industry. The impact for Kansas was that three of the four winning applicants were unable to fund and build their proposed lottery gaming facilities. Boot Hill was the only applicant able to move forward with construction and development of its lottery gaming facility. Heightened Competition in the Southeast The southeast gaming zone now faces formidable competition from the Downstream Casino, a large, new Tribal casino located in the northeast corner of Oklahoma within a few hundred yards of the Kansas casino development site. The realities of the recession together with the increased competition raise questions regarding the economic viability of a casino located in the southeast gaming zone of Kansas that requires a minimum capital invest of $225 million plus a $25 million privilege fee.
Project Objective
The objective of the following report and analyses is to provide the Lottery Gaming Review Board with independent forecasts for the number of potential casino visitors and the gaming revenues for the proposed Chisholm Creek Casino Resort.

South Central Gaming Zone of Kansas Projections of Casino Visits & Gaming Revenues
October 2009 Wells Gaming Research Page 1-5
Scope of Work & Research Methodology
The scope of work and research methodology required to forecast the casino visits and gaming revenues for the Chisholm Creek Casino Resort included: Identifying the Trade Area WGR defined the south central trade area as the geography lying within an approximate 100-to-125-mile radius of the Sumner County, Kansas casino development site. It takes in counties located in two states (Kansas and Oklahoma). The boundaries extend to Saline and Dickinson Counties, Kansas on the north; to the Oklahoma counties of Canadian, Oklahoma, and Lincoln on the south; Kiowa and Comanche Counties, Kansas on the west; and Labette County, Kansas on the east. The trade area was extended south to include all of the Oklahoma City metro area (refer to the map on page 1-6). Site Visits Richard Wells (Wells), president of WGR, visited Chisholm Creek’s 75-acre development site in Sumner County, Kansas (south central gaming zone). Other site visits included the Oklahoma and Missouri casinos that are located within the trade area boundaries for both the northeast and south central gaming zones of Kansas. These site visits were made between June and September 2009. Wells also visited the five Kansas tribal casinos; Kansas City, Missouri casinos; and the northern Oklahoma casinos in June-July of 2008. Demographic Data Detailed population (total and adult) data for the trade area was obtained from the Bureau of Business & Economic Research, University of Nevada, Reno at the census tract level of detail for 2000 through 2015. Median household income statistics were also obtained from the same source. Capacity Statistics In addition to compiling the current gaming capacity and amenity statistics, the following information was also included in the gravity models:
Two casino expansions in Oklahoma including an entertainment venue at the Cherokee Hard Rock Casino Tulsa and parking at the River Spirit Casino in Tulsa. New Boot Hill Casino (southwest gaming zone of Kansas) with 875 slots, 20 table games, and 124 hotel rooms. Chisholm Creek – Phase 1 with 1,300 slot machines and 30 table games. Chisholm Creek – Full Build Out with 2,000 slots, 50 table games, and 150 hotel rooms.

South Central Gaming Zone of Kansas Projections of Casino Visits & Gaming Revenues
October 2009 Wells Gaming Research Page 1-6
South Central Gaming Zone of Kansas Projections of Casino Visits & Gaming Revenues
October 2009 Wells Gaming Research Page 1-7
WGR’s Proprietary Databases WGR’s proprietary databases were used as a data resource. The databases contain a wealth of casino related statistics dating back to 1990 and running continuously through the present. This is an unmatched data resource available exclusively to WGR for use in casino market studies. Applicant Templates & Application Documents Project and pro forma specific data were obtained from the templates and applications prepared by Chisholm Creek and submitted to the Kansas Racing and Gaming Commission (KRGC). The KRGC provided the documents to WGR. Chisholm Creek’s 2009 Application versus the three 2008 Applicants WGR conducted a line item comparison of the Hollywood’s 2009 application with the three 2008 applicants: Harrah’s, Marvel’s Trailhead, and Penn National’s Hollywood (refer to Exhibit 3-9, page 3-12, for a line item comparison of the results). Gravity Models By way of background, gravity models use the principal of Isaac Newton’s law of gravity, wherein the attraction between two objects is proportional to their mass, and is inversely proportional to the square of their respective distances.
Applications for the Business World Even though Newton’s law of gravity dealt with planets, the amount of gravitational force that they exert on each other, and the effects that the forces of gravity have on their trajectory, the concepts have been successfully applied to business. William J. Reilly first advanced the concept of using gravity modeling in 1931 in his book entitled Law of Retail Gravitation. Reilly illustrated that the concept of gravitational force (pull) can be applied to various types of problems, including business, retail, and traffic. Reilly applied the concept to retail shopping center trade areas and customer attraction. WGR’s Gravity Model WGR has developed a custom, proprietary, gravity model for use in estimating casino gaming revenues as well as for evaluating the impacts of increased competition on those revenues. WGR’s gravity modeling methodology has proven to be a flexible and effective tool for estimating gaming revenues for casino projects where the interplay with existing and/or proposed competing casinos could affect future gaming revenues.
Recession Analyses WGR analyzed the impact of the ongoing 2008-2009 economic recession on casino gaming. Our findings show that the recession has not had a significant negative impact on casinos located in the Midwest region of the United States. In contrast, the period-over-period declines for the fiscal year

South Central Gaming Zone of Kansas Projections of Casino Visits & Gaming Revenues
October 2009 Wells Gaming Research Page 1-8
ended June 30, 2009 for Las Vegas have been 11% or more. Reno comparisons for the same period show declines of approximately 20%. Unfortunately, Reno’s casino industry has not only had to cope with the economic slowdown, but also with the continued expansion of Tribal gaming in northern California (Reno’s primary feeder market). Gravity Model for the South Central Gaming Zone WGR built a new, custom designed gravity model for the south central gaming zone for the 2009 analyses. It contains current demographic and competitive information. Recession Assumption for 2010 WGR has assumed that the impact of the current recession will continue through 2010. As a result, we have assumed that there will be zero growth in gaming revenues during 2010 in both the northeast and south central gaming markets. We are assuming that the recession will be over and that normal growth will resume in 2011. Inflation Factors WGR, together with the other consultants working on this project, agreed to use a 3% annual inflation rate beginning in 2011. Gaming Revenues Gaming revenue projections will only be reported for the mid case (mean). Footnotes will be included that identify the low and high percentage variances for a 68% confidence interval. In this way, the reader will know the statistical percentage variances in the casino revenues that can be expected within one standard deviation of the mean, i.e. within a 68% confidence interval.

South Central Gaming Zone of Kansas Projections of Casino Visits & Gaming Revenues
October 2009 Wells Gaming Research Page 1-9
Limiting Conditions
Limit of Liability The liability of Wells Gaming Research, a Nevada corporation, (hereinafter referred to as WGR) and its employees, is limited to the named Client only, Kansas lottery Gaming Facility Review Board. No obligation or liability to any third party is foreseen. If this report is disseminated to anyone other than the Client, the Client shall make each party aware of all of the limiting conditions, assumptions, and related discussions of the assignment. If any of this data were used for limited partnerships, syndication offerings, stock offerings, or debt offerings, the Client agrees that if any legal action (including arbitration) is initiated by any lender, partner, part owner in any form of ownership, tenant, or any other person or entity against WGR or its employees, then the Client shall hold WGR and its employees completely harmless in any such action from any and all awards or settlements of any type (including but not limited to the attorney's fees and costs), regardless of the outcome(s).
Litigation Expenses In the event that Wells Gaming Research (WGR), Richard H Wells, or any WGR staff members are named as parties to a law suit or are compelled by a court to provide testimony and documents relating to WGR’s work for the Kansas Lottery Gaming Facility Review Board, Client agrees to reimburse WGR for all out-of-pocket expenses including attorney fees, deposition expenses, travel, and document production expenses required to comply with a court order or other litigation requirements. If WGR is compelled to be a witness in litigation arising from this assignment, Client will reimburse WGR at WGR’s customary billing rate for staff time required to comply with the court order.
Copies, Publication, Distribution, & Use of Report Possession of this report or any copy thereof does not carry with it the right of publication, nor may it be used for other than its intended limited purpose. The physical report(s) remain the property of WGR for use by the Client. The fee, which the Client has paid, was only for the Kansas Casino Market Study & Gaming Revenue Projections, the accompanying analytical services, and the project reporting that was provided. This report is to be used only in its entirety. No part is to be used or displayed without the whole report. Except as hereinafter provided, the Client may only distribute copies of this report in its entirety to such third parties as he may select on the conditions stated herein. Selected portions of this report shall not be given to third parties without the prior written consent of WGR. Neither this report nor any part of this report may be disseminated to the public by the use of the advertising media, public relations,
South Central Gaming Zone of Kansas Projections of Casino Visits & Gaming Revenues
October 2009 Wells Gaming Research Page 1-10
news, sales, or other media for public communication without the prior written consent of WGR. Information Used No warranty is made for the accuracy of information furnished by others, the Client, his designee, or public records. The data relied upon in this report has been confirmed and/or sources thought reliable have been used. All sources and data are considered appropriate for inclusion to the best of our factual judgment and knowledge. An impractical and uneconomic expenditure of time would be required in attempting to furnish unimpeachable verification of all data in all instances. ACCEPTANCE AND/OR USE OF THE RESULTS AND ANALYSES CONTAINED IN THIS REPORT BY THE CLIENT OR ANY THIRD PARTY CONSTITUTES ACCEPTANCE OF THE ABOVE CONDITIONS. WGR'S LIABILITY EXTENDS ONLY TO THE STATED CLIENT AND NOT TO SUBSEQUENT PARTIES OR USERS. THESE STUDY RESULTS AND ANALYSES ARE NOT REPRESENTATIONS OR GUARANTEES OF ANY SPECIFIC LEVEL OF PERFORMANCE THAT MIGHT RESULT FROM THE ADDITION OR EXPANSION OF CASINOS IN THE KANSAS GAMING MARKET.

South Central Gaming Zone of Kansas Projections of Casino Visits & Gaming Revenues
Wells Gaming Research October 2009
Section 2
Executive Summary

South Central Gaming Zone of Kansas Projections of Casino Visits & Gaming Revenues
October 2009 Wells Gaming Research Page 2-1
Executive Summary
Chisholm Creek Casino Resort, LLC is proposing to build a lottery gaming facility (casino) on 75 acres in Sumner County, Kansas (south central gaming zone). The development site is located southwest of the Intersection of I-35 (Kansas Turnpike) and Highway 53 (Exit 33). It is bounded on the west by Highway 81. The Kansas Lottery Gaming Facility Review Board engaged Wells Gaming Research (WGR) to conduct an independent study of Chisholm Creek’s application. WGR’s assignment included: • Defining the project’s trade area (refer to Section 1, pages 1-5 and 1-6 for a description
of the trade are boundaries and the map). • Inventorying the existing casino capacity located within the boundaries of the
south central trade area
• Identifying casino expansions and proposed new casinos that could ratchet up
future competition
• Researching demographic trends for the trade area (population, both total and
adult, and median household income)
• Estimating the number of casino visits for the Chisholm Creek Casino Resort
• Forecasting gaming revenues for Chisholm Creek
• Conducting side by side analyses of Chisholm Creek’s 2009 application with
the three 2008 applicants (Harrah’s, Marvel, and Penn National).
Highlights of WGR’s research and analyses follow in this section. Complete detailed analyses can be found in the subsequent section.

South Central Gaming Zone of Kansas Projections of Casino Visits & Gaming Revenues
October 2009 Wells Gaming Research Page 2-2
Casino Capacities for the South Central Trade Area Casino capacity is summarized in Exhibit 2-1. Currently, there are 61 casinos located within the boundaries of the south central trade area (refer to Section 3, page 3-6 for details).
Exhibit 2-1 Casino Capacity for the South Central Gaming Zone
Casinos# of
Slots
# of
Tables
# of
Rooms Entertainment Parking
Current Capacity for Existing Casinos
Existing 61 Casinos 35,197 571 1,372 17 43,807
Expansions & ProposedExpansions:
Cherokee Hard Rock 0 0 0 1 0
River Spirit Casino 0 0 0 0 1,700
Proposed:
Boot Hill Casino & Resort 875 20 124 2 1,575
Subtotal 875 20 124 3 3,275
Chisholm Creek - Phase-1
Chisholm Creek - Phase I 1,300 30 0 0 1,925
Total Existing, Expansions & New 37,372 621 1,496 20 49,007
% Change Over Current 6% 9% 9% 18% 12%
Chisholm Creek - Full Build Out
Chisholm Creek - Full Build Out 2,000 50 150 3 3,000
Total Existing, Expansions & New 38,072 641 1,646 23 50,082
% Change Over Current 8% 12% 20% 35% 14%
Data Source: Wells Gaming Research, October 2009. Expansions and proposed includes expansions at two northeastern Oklahoma casinos (an entertainment venue at the Cherokee Hard Rock Casino Tulsa and parking at the River Spirit Casino in Tulsa). Also includes the new Boot Hill Casino located in the southwest gaming zone of Kansas. Chisholm Creek – Phase 1 includes the expansions and proposed plus phase 1 of Chisholm Creek’s Casino Resort. The capacity proposed in phase 1 would increase the number of slot machines by 6% (up from the current capacity of 35,197 to 37,372), the total number of table games by 9% (up from the current 571 to 621), and the number of hotel rooms by 9% (up from 1,372 to 1,496). Chisholm Creek – Full Build Out includes key capacity increases of 8% for slot machines (up from the current 35,197 machines to 38,072), 12% for table games (up from 571 to 641), and 20% for hotel rooms (up from 1,372 to 1,646).

South Central Gaming Zone of Kansas Projections of Casino Visits & Gaming Revenues
October 2009 Wells Gaming Research Page 2-3
Demographic Data for the Trade Area Demographic statistics for the south central trade area are summarized in Exhibit 2-2 for 2000, 2013, and 2015. Gaming population (adults 21 + years old) forecasts for the south central trade area for 2013-2015 indicate that adults will make up approximately 69% of the total in both the Kansas and Oklahoma sections of the defined trade area. Population concentrations for 2013-2015 indicate that approximately one-third (33%) of the trade area’s gaming population will be located in Kansas and two-thirds (67%) in Oklahoma.
Exhibit 2-2 Trade Area Demographic Statistics
2000 2013 2015
State
Total
Pop
Adult
Pop
%
Adult
by ST MHI
Total
Pop
Adult
Pop
%
Adult
by ST MHI
Total
Pop
Adult
Pop
%
Adult
by ST MHI
KS 1,004,072 690,510 35% $40,919 1,028,926 706,586 33% $55,396 1,032,710 709,065 33% $57,826
OK 1,875,349 1,303,213 65% $38,907 2,059,792 1,430,577 67% $55,417 2,085,193 1,448,150 67% $58,271
Total 2,879,421 1,993,723 100% $39,604 3,088,718 2,137,163 100% $50,257 3,117,903 2,157,215 100% $58,125
% Total 69.2% 69.2% 69.2%
Data Sources: University of Nevada, Center for Regional Studies & Wells Gaming Research, October 2009. Median household income statistics for the south central trade area have been forecasted at $55,396 for 2013 for the Kansas portion of the trade area and $55,417 for the Oklahoma part. Corresponding median household income levels for 2015 have been forecasted to reach $57,826 for the Kansas geography located within the trade area and $58,271 for the Oklahoma portion. By way of comparison, the US Census Bureau projects MHI at $58,606 for 2013 and at $61,464 for 2015 for the United States.

South Central Gaming Zone of Kansas Projections of Casino Visits & Gaming Revenues
October 2009 Wells Gaming Research Page 2-4
Casino Visits WGR used a custom, proprietary gravity model to forecast Chisholm Creek’s casino visits. A comparison between Chisholm Creek’s forecast and WGR’s is illustrated in Exhibit 2-3.
Exhibit 2-3 Casino Visit Projections
Chisholm Creek Visits Phase I
Full
Build Out
2013 2015 2015
Chisholm Creek's Projections 1,866,744 1,885,470 3,020,000
WGR's Projections 2,052,682 2,070,664 2,711,986
Difference - Applicant vs WGR -185,938 -185,194 308,014
Data Sources: Wells Gaming Research & Chisholm Creek Casino Resort. LLC, October 2009. Chisholm Creek versus WGR (2013 & 2015) • Phase 1
Chisholm Creek’s forecast of 1.87 million visits for 2013 is 186 thousand visits (8%) lower than WGR’s 2.01 million. A similar difference of 185 thousand visits was forecasted for 2015.
• Full Build Out
Chisholm Creek’s 3.0 million forecast for 2015 is 308 thousand higher (10%) than WGR’s 2.7 million.

South Central Gaming Zone of Kansas Projections of Casino Visits & Gaming Revenues
October 2009 Wells Gaming Research Page 2-5
Gaming Revenue Projections WGR used gravity modeling techniques to forecast casino gaming revenues for the Chisholm Creek Casino Resort. WGR’s gravity modeling methodology has proven to be a flexible and effective tool for estimating gaming revenues for casino projects where the interplay with existing and/or proposed competing casinos could affect the future gaming revenues of a particular project (refer to section-1, pages 1-8 and 1-9 for additional information on WGR’s gravity modeling methodology). WGR’s 2013 gaming revenue forecasts for Chisholm Creek included the impacts of the 2008-2009 ongoing recession and a 3% inflation factor, which was used in the calculations starting in 2011 (inflation was not calculated into the 2010 forecast because of the recession).
Exhibit 2-4 Revenue Projections
Chisholm Creek Revenues Phase I
Full
Build Out
2013 1
2015 1
2015 2
Chisholm Creek's Projections $121,139,087 $129,794,817 $230,000,000
WGR's Projections $144,643,292 $154,757,092 $206,064,825
Difference - Applicant vs WGR -$23,504,205 -$24,962,275 $23,935,175 Footnotes: 1. Phase 1 for WGR --- At a 68% confidence interval (one standard deviation from the mean, assuming a normal
distribution), revenues can be expected to vary +8% and -10%. In other words, predicted revenues can be expected to fall within this range 68% of the time.
2. Full Build Out for WGR --- At a 68% confidence interval, revenue can be expected to vary +6% and -7%, i.e., predicted
revenues can be expected to fall within this range 68% of the time.
Data Source: Wells Gaming Research, October 2009. Chisholm Creek versus WGR • Phase 1
Chisholm Creek’s $121.1 million gaming revenue projection for 2013 is $23.5 million (19%) lower than WGR’s $144.6 million. A similar difference was forecasted for 2015 with Chisholm at $129.8 million and WGR at $154.8 million, a $25 million difference (19%).
• Full Build Out
Chisholm Creek’s $230 million gaming revenue forecast for 2015 is $23.9 million (10%) higher than WGR’s at $206.1 million.

South Central Gaming Zone of Kansas Projections of Casino Visits & Gaming Revenues
October 2009 Wells Gaming Research Page 2-6
Key 2009 Applicant Forecasts Compared with WGR & the 2008 Applicants Highlights of Chisholm Creek’s 2009 forecasts (phase 1 and the full build out) compared with WGR, and the three 2008 applicants (Harrah’s, Marvel, and Penn National) are illustrated in Exhibit 2-5. It is important to note that due to the availability of data, a timing difference does exist between Chisholm Creek’s 2015 forecasts for the full build out, and the 2012 projections developed by the 2008 applicants. The following comparison is being presented to the Kansas Lottery Gaming Facility Review Board to lend additional perspective on the 2009 applicant’s project.
Exhibit 2-5 Chisholm Creek’s versus WGR & the 2008 Applicants
2009 Application
Chisholm Creek
2008 Applications
(Projections Made by WGR for 2012) 1
Capacities & AmenitiesPhase I
(2012)
Full Build Out
(2015) Harrah's
Marvel's
Trailhead
Penn National's
Hollywood
Capital Investment $125,000,000 $225,000,000 $450,000,000 $393,156,577 $365,000,000
Gaming Revenues:
Applicant $117,037,434 $230,000,000 $252,359,000 $258,216,000 $194,234,748
WGR $139,843,679 $206,064,825 $203,911,008 $138,363,216 $125,679,360
Gasming Capacity
# of Slots 1,300 2,000 2,000 2,000 1,500
# of Tables Games 30 50 59 83 40
Hotel Rooms 0 150 365 304 350
Capital Investment Comparisons
Phase 1 - Variances between Chisholm Creek’s proposed $125 million investment for phase 1 and the 2008 applicants illustrate that the applicants are: • $325 million (72%) lower than Harrah’s $450 million • $268 million (68%) lower than the Marvel’s $393 million • $240 million (66%) lower than the Penn National’s $365 million
Full Build Out - Variances show that the Chisholm Creek’s proposed investment of $225 million is: • $225 million (50%) lower than Harrah’s $450 million • $168 million (43%) lower than the Marvel’s $393 million • $140 million (38%) lower than the Penn National’s $365 million

South Central Gaming Zone of Kansas Projections of Casino Visits & Gaming Revenues
October 2009 Wells Gaming Research Page 2-7
Gaming Revenue Comparisons Variances between Chisholm Creek’s proposed gaming revenues and WGR’s forecasts illustrates that the: Chisholm Creek 2009 application vs. WGR projections Phase 1 • $117 million projection for 2012 is $23 million (20%) lower than WGR’s $140
million (Chisholm Creek’s 2012 gaming revenue projections should not be confused with the 2013 forecasts featured in Exhibit 2-4, page 2-5).
Full Build Out • $230 million forecast for 2015 is $22 million (10%) higher than WGR’s $206
million Chisholm Creek 2009 application vs. the 2008 applicants Phase 1 Gaming revenue comparisons between Chisholm Creek’s $117 million gaming revenue projection and the 2008 applicants shows that the Chisholm Creek is: • $135 million (54%) lower than Harrah’s $252 million • $141 million (55%) lower than the Marvel’s $258 million • $77 million (40%) lower than the Penn National’s $194 million
Full Build Out Chisholm Creek’s gaming revenue projection of $230 million for 2015 is: • $22 million (9%) lower than Harrah’s $252 million • $28 million (11%) lower than the Marvel’s $258 million • $36 million (19%) higher than the Penn National’s $194 million
Slot Machines Phase 1 Compared to the 2008 applicants, Chisholm Creek’s proposed 1,300 slots are:
• 700 (35%) lower than Harrah’s 2,000 • 700 (35%) lower than the Marvel’s 2,000 • 200 (13%) lower than the Penn National’s 1,500

South Central Gaming Zone of Kansas Projections of Casino Visits & Gaming Revenues
October 2009 Wells Gaming Research Page 2-8
Full Build Out Chisholm Creek’s slot capacity projections of 2,000 slots are:
• Equal to Harrah’s 2,000 • Equal to Marvel’s 2,000 • 500 (33%) higher than the Penn National’s 1,500
Total Table Games
Phase 1 Capacity variances between the Chisholm Creek and the 2008 applicants shows that Chisholm’s 30 table games are:
• 29 (49%) lower than Harrah’s 59 • 53 (64%) lower than Marvel’s 83 • 10 (25%) higher than the Penn National’s 40
Full Build Out Chisholm Creek’s proposed 50 table games are: • 9 (15%) lower than Harrah’s 59 • 33 (40%) lower than the Marvel’s 83 • 10 (25%) higher than the Penn National’s 40
Hotel Rooms Chisholm Creek’s Phase 1 proposal did not include hotel rooms; however, 150 rooms were proposed for the full build out. Full Build Out Chisholm Creek versus the 2008 applicants shows the following variances: • 215 (59%) lower than Harrah’s 365 • 154 (51%) lower than the Marvel’s 304 • 200 (57%) lower than Penn National’s 350

South Central Gaming Zone of Kansas Projections of Casino Visits & Gaming Revenues
Wells Gaming Research October 2009
Section 3
Chisholm Creek Casino Resort Detail

South Central Gaming Zone of Kansas Projections of Casino Visits & Gaming Revenues
October 2009 Wells Gaming Research Page 3-1
Chisholm Creek Casino Resort Detail
Chisholm Creek Casino Resort, LLC is proposing to build the Chisholm Creek Casino Resort on 75 acres in Sumner County, Kansas. The development site shown below is located southwest of the Intersection of I-35 (Kansas Turnpike) and Highway 53 (Exit 33). It is bounded on the west by Highway 81.

South Central Gaming Zone of Kansas Projections of Casino Visits & Gaming Revenues
October 2009 Wells Gaming Research Page 3-2
Facility Statistics & Amenities Exhibit 3-1 shows the capacity statistics and amenities proposed for phase 1 (opening status for the Chisholm Creek Casino Resort), as well as for the full build out (proposed for completion in 2015).
Exhibit 3-1 Phase-1 versus Full Build Out
Capacities & Amenities
Phase I (2012)
Full Build Out (2015)
Capital Investment $125,000,000 $225,000,000
Gaming Revenues:
Applicant $117,037,434 $230,000,000
WGR $139,843,679 $206,064,825
Difference -$22,806,245 $23,935,175
Visitor Projections:
Applicant 1,857,565 3,020,000
WGR 2,043,836 2,711,986
Difference -186,271 308,014
Casino:
Square Footage 54,475 95,000
# of Slots 1,300 2,000
# of Tables Games 30 50
# of Poker tables Not Specified Not Specified
Hotel Rooms 0 150
Restaurants/Entertainment:
# of Restaurants 3 5
# of Small Entertainment Venues 0 1
# of Large Entertainment Venues 0 2 1
Convention Square Footage 0 12,000 1
Sports/Recreation Facilities Not Specified Not Specified
Parking:
# of Surface Spaces 1,925 3,000
# of Covered Spaces 0 0
# of RV Spaces 0 0
# of Retail Outlets 1 1
# of FTE's (full time equivalents) 874 Not Specified Footnote: 1. One live entertainment venue is included in addition to a multipurpose meeting and entertainment venue.
Data Source: Wells Gaming Research, October 2099.

South Central Gaming Zone of Kansas Projections of Casino Visits & Gaming Revenues
October 2009 Wells Gaming Research Page 3-3
Capital Investment Chisholm Creek estimates that a $125 million capital investment would be required to complete phase 1 (the opening status of the lottery gaming facility). The full build out would require an additional $100 million bringing the total capital investment to $225 million. Projected Opening Date The targeted opening date is September 1, 2011 (assuming an August 31, 2010 start). As proposed, the first full year of operation would be 2012.
Facility Size & Design Phase 1 would encompass an estimated 153,000 square feet and reflect a prairie style contemporary architectural theme. Prairie style architecture is most common in the Midwest United States. Typically, it reflects horizontal lines, flat or hipped roofs with broad overhanging eaves, windows grouped in horizontal bands, integration with the landscape, solid construction, craftsmanship, and discipline in the use of ornamentation. Frank Lloyd Wright was the most famous proponent of prairie style architecture.
Casino Phase 1 would have 54,475 square feet of gaming space equipped with 1,300 slots and 30 table games. An additional 2,000 square feet would be dedicated to the cage, slot club, and promotions. The casino in the full build out would have 95,000 square feet of gaming space equipped with 2,000 slots and 30 table games. Hotel A 150-room hotel, targeted for completion by 2015, would be part of the full build out.
Restaurants The applicant’s template included three restaurants (buffet, deli, and casual steakhouse) in phase 1. The full build out would have five restaurants (the three included in phase 1 and two additional for full build out).
Entertainment Venues The template information did not include any entertainment venues for phase 1. The full build out has been projected to have two entertainment venues, one live and one multipurpose meeting and entertainment space.

South Central Gaming Zone of Kansas Projections of Casino Visits & Gaming Revenues
October 2009 Wells Gaming Research Page 3-4
Convention & Meeting Space Multipurpose convention and entertainment space has been included in the full build out plans. Sports/Recreational Facilities None have been specified. Parking Facilities Phase 1 of the applicant’s template identified 1,925 parking spaces. Parking for 3,000 vehicles was included in the full build out.
Retail Space The applicant’s template included 1,200 square feet of retail space (1 outlet). Additional retail was not proposed in the full build out.
FTE’s Phase 1 includes 874 FTE’s. The number required to operate the full build out was not been provided by Chisholm Creek; however, the expanded property would most likely require additional FTE’s.
South Central Gaming Zone of Kansas Projections of Casino Visits & Gaming Revenues
October 2009 Wells Gaming Research Page 3-5
Gaming Capacity
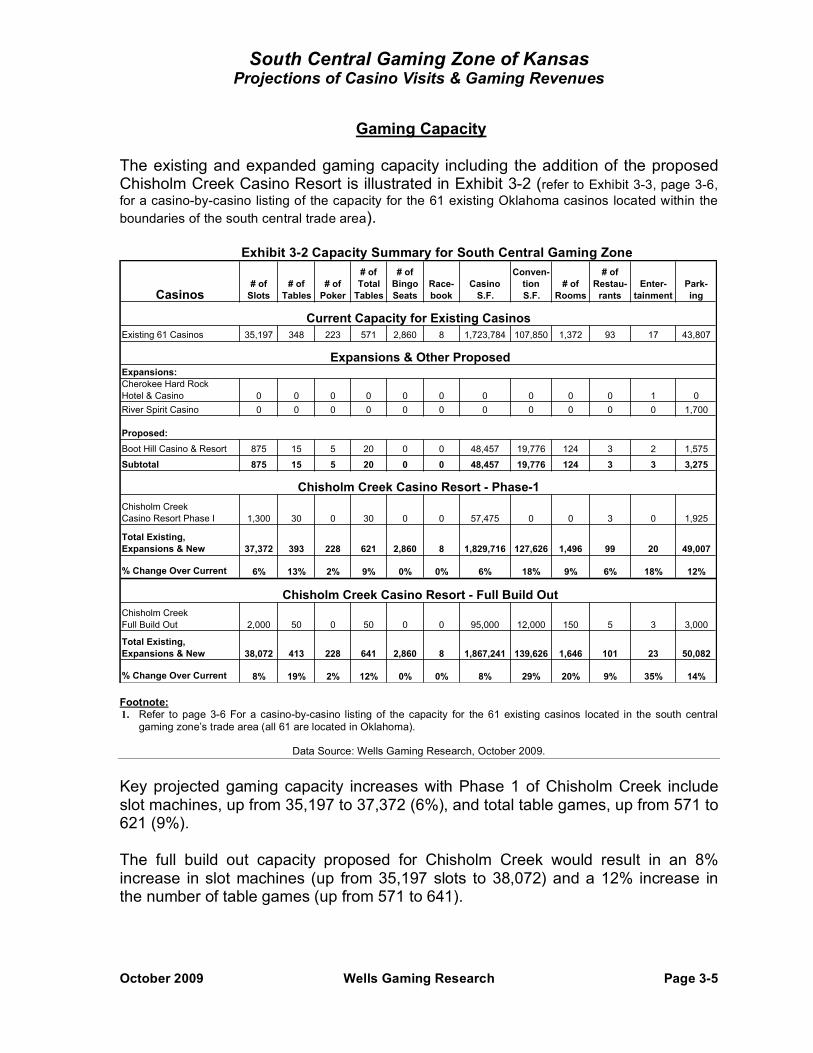
The existing and expanded gaming capacity including the addition of the proposed Chisholm Creek Casino Resort is illustrated in Exhibit 3-2 (refer to Exhibit 3-3, page 3-6, for a casino-by-casino listing of the capacity for the 61 existing Oklahoma casinos located within the boundaries of the south central trade area).
Exhibit 3-2 Capacity Summary for South Central Gaming Zone
Casinos# of
Slots
# of
Tables
# of
Poker
# of
Total
Tables
# of
Bingo
Seats
Race-
book
Casino
S.F.
Conven-
tion
S.F.
# of
Rooms
# of
Restau-
rants
Enter-
tainment
Park-
ing
Current Capacity for Existing Casinos
Existing 61 Casinos 35,197 348 223 571 2,860 8 1,723,784 107,850 1,372 93 17 43,807
Expansions & Other ProposedExpansions:
Cherokee Hard Rock
Hotel & Casino 0 0 0 0 0 0 0 0 0 0 1 0
River Spirit Casino 0 0 0 0 0 0 0 0 0 0 0 1,700
Proposed:
Boot Hill Casino & Resort 875 15 5 20 0 0 48,457 19,776 124 3 2 1,575
Subtotal 875 15 5 20 0 0 48,457 19,776 124 3 3 3,275
Chisholm Creek Casino Resort - Phase-1
Chisholm Creek
Casino Resort Phase I 1,300 30 0 30 0 0 57,475 0 0 3 0 1,925
Total Existing,
Expansions & New 37,372 393 228 621 2,860 8 1,829,716 127,626 1,496 99 20 49,007
% Change Over Current 6% 13% 2% 9% 0% 0% 6% 18% 9% 6% 18% 12%
Chisholm Creek Casino Resort - Full Build Out
Chisholm Creek
Full Build Out 2,000 50 0 50 0 0 95,000 12,000 150 5 3 3,000
Total Existing,
Expansions & New 38,072 413 228 641 2,860 8 1,867,241 139,626 1,646 101 23 50,082
% Change Over Current 8% 19% 2% 12% 0% 0% 8% 29% 20% 9% 35% 14% Footnote: 1. Refer to page 3-6 For a casino-by-casino listing of the capacity for the 61 existing casinos located in the south central
gaming zone’s trade area (all 61 are located in Oklahoma).
Data Source: Wells Gaming Research, October 2009.
Key projected gaming capacity increases with Phase 1 of Chisholm Creek include slot machines, up from 35,197 to 37,372 (6%), and total table games, up from 571 to 621 (9%). The full build out capacity proposed for Chisholm Creek would result in an 8% increase in slot machines (up from 35,197 slots to 38,072) and a 12% increase in the number of table games (up from 571 to 641).

South Central Gaming Zone of Kansas Projections of Casino Visits & Gaming Revenues
October 2009 Wells Gaming Research Page 3-6
Exhibit 3-3 Existing Gaming Capacity
# of
Loc Oklahoma Casinos# of
Slots
# of
Tables
# of
Poker
Tables
# of
Total
Tables
# of
Bingo
Seats
Race-
book
Casino
S.F.
Conven-
tion
S.F.
# of
Rooms
# of
Restau-
rants
Enter-
tainment
Park-
ing
1 7 Clans Paradise Casino 632 8 6 14 0 0 30,000 0 0 2 0 500
2 Blue Star Gaming and Casino 196 0 0 0 300 0 20,000 0 0 1 0 200
3 Border Town Casino 1,300 10 10 20 650 1 73,000 0 0 2 0 400
4 Bordertown Outpost Casino 265 0 0 0 0 0 3,000 0 0 0 0 1,300
5 Buffalo Run Casino 925 14 10 24 0 0 70,000 10,000 101 3 1 1,300
6 Cherokee Casino - Fort Gibson 295 0 0 0 0 0 7,430 0 0 1 0 182
7 Cherokee Casino - Will Rogers Downs 500 0 0 0 0 1 18,277 11,000 450 2 0 728
8 Cherokee Hard Rock Hotel & Casino 2,303 35 35 70 0 0 125,000 35,000 471 8 4 2,415
9 Cherokee Nation Outpost Tobacco Shop 81 0 0 0 0 0 1,728 0 0 0 0 42
10 Cimarron Casino 368 0 0 0 0 0 9,600 0 0 1 0 400
11 Creek Nation Casino Bristow 219 0 0 0 0 0 8,500 0 0 1 0 215
12 Creek Nation Casino Muscogee 456 7 10 17 300 0 30,000 0 0 1 0 450
13 Creek Nation Casino Okemah 298 0 0 0 110 0 1,800 0 0 0 0 200
14 Creek Nation Casino Okmulgee 334 2 3 5 0 0 11,000 0 0 1 0 600
15 Creek Nation Travel Plaza 43 0 0 0 0 0 920 0 0 1 0 50
16 Downstream Casino Resort 2,000 30 14 44 0 1 70,000 10,000 222 5 3 3,000
17 Duck Creek Casino 265 0 0 0 0 0 5,000 0 0 1 0 300
18 Feather Warrior Casino - Canton 137 0 0 0 0 0 0 0 0 0 0 92
19 Feather Warrior Casino - Watonga 175 0 0 0 0 0 2,200 0 0 0 0 118
20 FireLake Casino 800 13 8 21 500 0 50,000 5,000 0 3 0 800
21 FireLake Grand Casino 1,800 23 22 45 0 0 125,000 13,000 0 5 2 4,000
22 First Council Casino 700 10 8 18 0 0 0 0 0 3 0 950
23 Golden Pony Casino 400 0 0 0 0 0 10,000 0 0 1 0 500
24 Goldsby Gaming Center 294 0 0 0 300 1 15,462 0 0 1 0 190
25 Grand Lake Casino 920 10 0 10 0 0 45,000 0 0 1 1 1,000
26 High Winds Casino 500 8 0 8 0 0 35,000 0 0 2 0 505
27 Kaw Southwind Casino 800 6 10 16 700 0 55,000 0 0 2 0 1,000
28 Kickapoo Casino 615 10 0 10 0 0 20,000 0 0 1 0 600
29 Kickapoo Conoco Station 52 0 0 0 0 0 900 0 0 0 0 30
30 Lil' Bit of Paradise Casino 1 306 0 0 0 0 0 0 0 0 0 0 60
31 Lil' Bit of Paradise Casino 2 47 0 0 0 0 0 0 0 0 0 0 30
32 Lucky Star Casino - Clinton 710 8 8 16 0 0 13,000 0 0 1 0 600
33 Lucky Star Casino - Concho 930 13 11 24 0 0 40,000 0 0 1 0 1,000
34 Lucky Turtle Casino 113 0 0 0 0 0 3,000 0 0 1 0 140
35 Miami Tribe Entertainment 93 0 0 0 0 0 0 0 0 0 0 60
36 Muscogee Travel Plaza 129 0 0 0 0 0 3,000 0 0 0 0 80
37 Mystic Winds Casino 322 0 0 0 0 0 0 0 0 0 0 215
38 Native Lights Casino 652 6 0 6 0 0 22,500 0 0 2 0 590
39 Newcastle Gaming Center I & II 1,255 28 14 42 0 0 21,073 0 0 3 0 1,100
40 Osage Million $ Elm - Bartlesville 575 6 2 8 0 0 42,000 0 0 3 0 700
41 Osage Million $ Elm Casino - Hominy 225 0 0 0 0 0 0 0 0 1 0 215
42 Osage Million $ Elm - Pawhuska 178 0 0 0 0 0 0 0 0 1 0 50
43 Osage Million $ Elm - Ponca City 223 0 0 0 0 0 7,700 0 0 0 0 150
44 Osage Million $ Elm - Sand Springs 506 6 0 6 0 0 25,000 0 0 1 0 500
45 Osage Million $ Elm - Skiatook 148 0 0 0 0 0 0 0 28 1 0 165
46 Osage Million $ Elm - Tulsa 1,269 11 8 19 0 0 47,000 1,600 0 3 2 800
47 Pawnee Travel Plaza 35 0 0 0 0 0 0 0 0 0 0 20
48 Peoria Gaming Center 160 0 0 0 0 0 4,200 0 0 1 0 250
49 Quapaw Casino 498 8 0 8 0 0 27,000 0 0 1 0 430
50 Remington Park 700 0 0 0 0 1 55,000 0 0 3 0 6,700
51 River Spirit Casino 2,800 24 15 39 0 0 300,000 0 0 4 1 1,000
52 Riverwind Casino 2,318 32 23 55 0 1 76,308 14,000 100 7 2 4,000
53 Sac and Fox Casino - Shawnee 651 0 5 5 0 0 35,000 0 0 2 0 575
54 Sac and Fox Casino - Stroud 161 0 0 0 0 0 825 0 0 0 0 105
55 Seminole Nation Trading Post 175 0 0 0 0 0 3,424 0 0 0 0 115
56 Sugar Creek Casino 400 0 0 0 0 0 0 0 0 0 0 260
57 The Stables Casino 533 4 0 4 0 1 25,000 0 0 2 0 260
58 Thunderbird Casino 420 6 0 6 0 1 61,000 8,250 0 2 0 600
59 Tonkawa Casino 380 2 1 3 0 0 14,437 0 0 1 0 330
60 Trading Post Casino 98 0 0 0 0 0 3,500 0 0 1 0 130
61 Wyandotte Nation Casino 514 8 0 8 0 0 50,000 0 0 2 1 510
61 Total Existing Casinos 35,197 348 223 571 2,860 8 1,723,784 107,850 1,372 93 17 43,807

South Central Gaming Zone of Kansas Projections of Casino Visits & Gaming Revenues
October 2009 Wells Gaming Research Page 3-7
Demographic Statistics
The following demographic statistics (total and adult population, and median household income) were compiled by research category for the south central trade area. Included are statistics for each of the seven counties contiguous with Sumner County (includes Sumner), as well as a combined total for the contiguous counties. Also included are demographic statistics for the 26 non-contiguous Kansas counties, 19 non-contiguous Oklahoma counties located within the trade area, and for the total 53 counties that make up the geography of the south central trade area. Total Population of the South Central Gaming Zone Exhibit 3-4 shows a total trade area population of 3.03 million for 2009, increasing slightly to 3.1 million by 2015. Of this total, 687.6 thousand (22%) will live in the counties contiguous with Sumner. Approximately 73% of the contiguous county population will be in Sedgwick County, Kansas. Butler and Kay are a distant second and third with 9.9% and 6.8%, respectively. By 2015, the Kansas population excluding the contiguous counties will represent 12.71% of the 3.1 million trade area total. Oklahoma excluding the contiguous counties will represent 65.23%. The average compound growth rate in total population for 2009-2015 has been estimated at 0.43% for the contiguous counties and 0.47% for the total trade area.
Exhibit 3-4 Total Population for the South Central Trade Area - 2000 & 2009 through 20151
County 2000 2008 2009 2010 2011 2012 2013 2014 2015
% of
2015 CACGR
Butler County, KS 59,482 63,562 64,190 64,826 65,572 66,253 66,944 67,641 68,346 9.94% 1.05%
Cowley County, KS 36,291 34,065 33,919 33,769 33,688 33,563 33,437 33,313 33,190 4.83% -0.36%
Harper County, KS 6,536 5,857 5,775 5,695 5,632 5,558 5,486 5,414 5,343 0.78% -1.29%
Kingman County, KS 8,673 7,720 7,629 7,543 7,477 7,398 7,320 7,242 7,165 1.04% -1.04%
Sedgwick County, KS 452,869 482,866 485,043 487,237 490,194 492,667 495,143 497,630 500,141 72.73% 0.51%
Sumner County, KS 25,946 23,616 23,393 23,173 22,999 22,795 22,595 22,395 22,199 3.23% -0.87%
Grant County, OK 5,144 4,450 4,450 4,450 4,450 4,450 4,450 4,450 4,450 0.65% 0.00%
Kay County, OK 48,080 45,633 45,744 45,854 46,132 46,301 46,469 46,639 46,807 6.81% 0.38%
Total Contiguous
Counties 643,021 667,769 670,143 672,547 676,144 678,985 681,844 684,724 687,641 100.00% 0.43%
KS Excluding
Contiguous Counties 414,275 402,381 401,177 399,978 399,723 398,855 398,001 397,163 396,326 12.71% -0.20%
OK Excluding
Contiguous Counties 1,822,125 1,947,781 1,960,748 1,973,808 1,984,174 1,996,479 2,008,873 2,021,347 2,033,936 65.23% 0.61%
Total Population 2,879,421 3,017,931 3,032,068 3,046,333 3,060,041 3,074,319 3,088,718 3,103,234 3,117,903 100.00% 0.47% Footnote: 1. The population statistics shown above are limited to those counties located in the identified south central trade area and
are not necessarily representative of the population for the entire states of Kansas or Oklahoma.
Data Sources: Center for Regional Studies, University of Nevada, Reno & Wells Gaming Research, October 2009.

South Central Gaming Zone of Kansas Projections of Casino Visits & Gaming Revenues
October 2009 Wells Gaming Research Page 3-8
Adult Population Statistics for the South Central Trade Area Exhibit 3-5 shows that in 2009 approximately 455.1 thousand adults reside in the counties contiguous with the Chisholm Creek casino site in Sumner County. Projections for 2015 reflect an increase to 466.9 thousand. Of these, 72.6% will be in Sedgwick County, Kansas. Butler and Kay with 9.8% and 6.9%, respectively, will continue to rank a distant second and third in adult population for the contiguous counties. By 2015, the Kansas adult population, excluding the contiguous counties, will represent 12.87% of the 2.2 million adults in the trade area total. Oklahoma excluding the contiguous counties will represent 65.49%. The average compound growth rate in adult population for 2009-2015 has been estimated at 0.42% for the counties contiguous with Sumner and 0.46% for the total trade area.
Exhibit 3-5 Adult Population - 2000 & 2009 through 20151
# of
CO County 2000 2008 2009 2010 2011 2012 2013 2014 2015
% of
2015 CACGR
Butler County, KS 39,923 42,661 43,084 43,509 44,010 44,468 44,931 45,397 45,872 9.82% 1.05%
Cowley County, KS 24,901 23,374 23,274 23,171 23,115 23,029 22,941 22,858 22,774 4.88% -0.37%
Harper County, KS 4,719 4,229 4,170 4,111 4,067 4,013 3,961 3,909 3,858 0.83% -1.30%
Kingman County, KS 6,044 5,380 5,317 5,257 5,211 5,156 5,101 5,047 4,993 1.07% -1.06%
Sedgwick County, KS 306,890 327,219 328,692 330,179 332,185 333,862 335,537 337,222 338,927 72.59% 0.50%
Sumner County, KS 17,554 15,978 15,826 15,678 15,560 15,423 15,288 15,152 15,018 3.22% -0.88%
Grant County, OK 3,669 3,174 3,174 3,174 3,174 3,174 3,174 3,174 3,174 0.68% 0.00%
Kay County, OK 33,194 31,505 31,582 31,658 31,849 31,964 32,081 32,200 32,315 6.92% 0.36%
8
Total Contiguous
Counties 436,894 453,520 455,119 456,737 459,171 461,089 463,014 464,959 466,931 21.65% 0.42%
26
KS excl. Contiguous
Counties 290,479 281,988 281,119 280,271 280,076 279,452 278,827 278,227 277,623 12.87% -0.22%
19
OK excl. Contiguous
Counties 1,266,350 1,353,053 1,362,022 1,371,055 1,378,231 1,386,751 1,395,322 1,403,952 1,412,661 65.49% 0.62%
53 Total Adult Population 1,993,723 2,088,561 2,098,260 2,108,063 2,117,478 2,127,292 2,137,163 2,147,138 2,157,215 100.00% 0.46% Footnote: 1. The population statistics shown above are limited to those counties located in the identified south central trade area and
are not necessarily representative of the population for the entire states of Kansas or Oklahoma.
Data Sources: Center for Regional Studies, University of Nevada, Reno & Wells Gaming Research, October 2009.
Adult Population for the Trade Area The total adult population for 2009 has been estimated at 2.1 million. It is expected to increase to approximately 2.2 million by 2015. The average compound growth rate (2009-2015) has been projected at less than one half of a percent (0.46%).
South Central Gaming Zone of Kansas Projections of Casino Visits & Gaming Revenues
October 2009 Wells Gaming Research Page 3-9
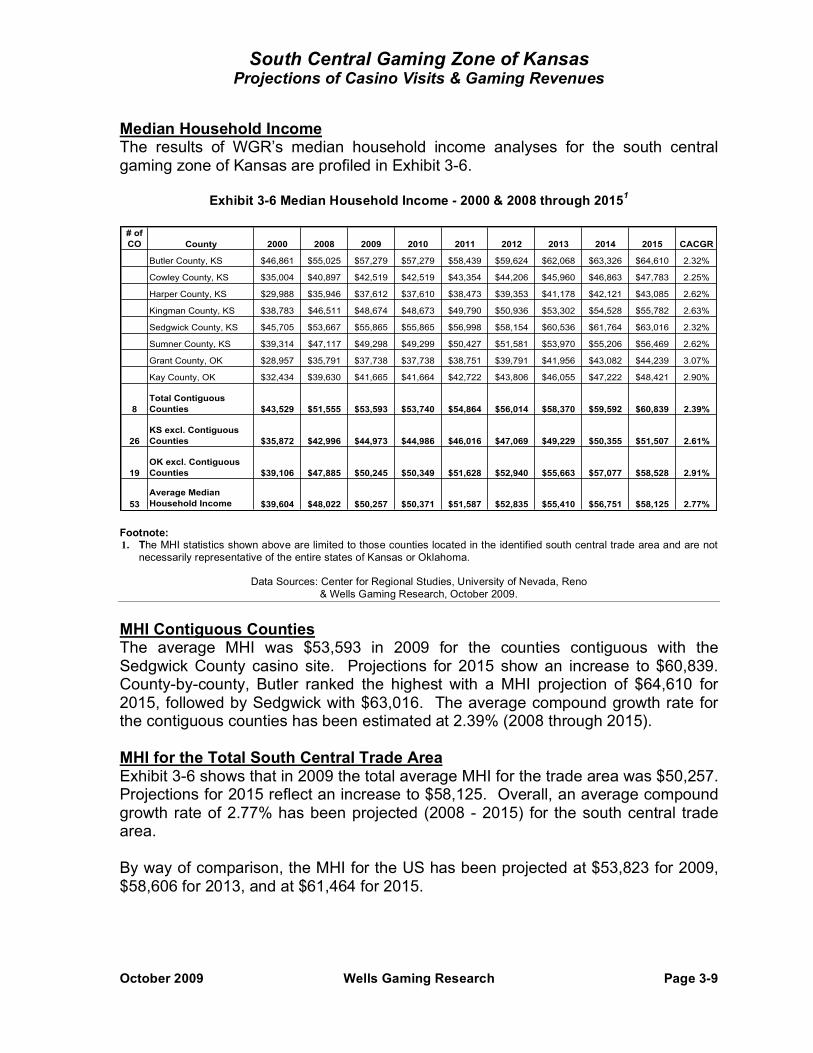
Median Household Income The results of WGR’s median household income analyses for the south central gaming zone of Kansas are profiled in Exhibit 3-6.
Exhibit 3-6 Median Household Income - 2000 & 2008 through 20151
# of
CO County 2000 2008 2009 2010 2011 2012 2013 2014 2015 CACGR
Butler County, KS $46,861 $55,025 $57,279 $57,279 $58,439 $59,624 $62,068 $63,326 $64,610 2.32%
Cowley County, KS $35,004 $40,897 $42,519 $42,519 $43,354 $44,206 $45,960 $46,863 $47,783 2.25%
Harper County, KS $29,988 $35,946 $37,612 $37,610 $38,473 $39,353 $41,178 $42,121 $43,085 2.62%
Kingman County, KS $38,783 $46,511 $48,674 $48,673 $49,790 $50,936 $53,302 $54,528 $55,782 2.63%
Sedgwick County, KS $45,705 $53,667 $55,865 $55,865 $56,998 $58,154 $60,536 $61,764 $63,016 2.32%
Sumner County, KS $39,314 $47,117 $49,298 $49,299 $50,427 $51,581 $53,970 $55,206 $56,469 2.62%
Grant County, OK $28,957 $35,791 $37,738 $37,738 $38,751 $39,791 $41,956 $43,082 $44,239 3.07%
Kay County, OK $32,434 $39,630 $41,665 $41,664 $42,722 $43,806 $46,055 $47,222 $48,421 2.90%
8
Total Contiguous
Counties $43,529 $51,555 $53,593 $53,740 $54,864 $56,014 $58,370 $59,592 $60,839 2.39%
26
KS excl. Contiguous
Counties $35,872 $42,996 $44,973 $44,986 $46,016 $47,069 $49,229 $50,355 $51,507 2.61%
19
OK excl. Contiguous
Counties $39,106 $47,885 $50,245 $50,349 $51,628 $52,940 $55,663 $57,077 $58,528 2.91%
53
Average Median
Household Income $39,604 $48,022 $50,257 $50,371 $51,587 $52,835 $55,410 $56,751 $58,125 2.77% Footnote: 1. The MHI statistics shown above are limited to those counties located in the identified south central trade area and are not
necessarily representative of the entire states of Kansas or Oklahoma.
Data Sources: Center for Regional Studies, University of Nevada, Reno & Wells Gaming Research, October 2009.
MHI Contiguous Counties The average MHI was $53,593 in 2009 for the counties contiguous with the Sedgwick County casino site. Projections for 2015 show an increase to $60,839. County-by-county, Butler ranked the highest with a MHI projection of $64,610 for 2015, followed by Sedgwick with $63,016. The average compound growth rate for the contiguous counties has been estimated at 2.39% (2008 through 2015). MHI for the Total South Central Trade Area Exhibit 3-6 shows that in 2009 the total average MHI for the trade area was $50,257. Projections for 2015 reflect an increase to $58,125. Overall, an average compound growth rate of 2.77% has been projected (2008 - 2015) for the south central trade area. By way of comparison, the MHI for the US has been projected at $53,823 for 2009, $58,606 for 2013, and at $61,464 for 2015.

South Central Gaming Zone of Kansas Projections of Casino Visits & Gaming Revenues
October 2009 Wells Gaming Research Page 3-10
Casino Visits WGR used a proprietary gravity model to forecast the number of casino visits. A comparison of Chisholm Creek’s forecast versus WGR’s is illustrated in Exhibit 3-7.
Exhibit 3-7 Casino Visit Projections
Chisholm Creek Visits Phase I
Full
Build Out
2013 2015 2015
Chisholm Creek Casino Application - Residential 1,686,192 1,703,107 N/A
Chisholm Creek Casino Application - Tourist 180,552 182,363 N/A
Chisholm Creek Casino Application - Total 1,866,744 1,885,470 3,020,000
WGR's Casino Visit Projections 2013 2015 2015
Chisholm Creek Casino 2,052,682 2,070,664 2,711,986
Difference - Applicant vs WGR -185,938 -185,194 308,014
% Difference -9.96% -9.82% 10.20%
Data Source: Wells Gaming Research, October 2009.
Chisholm Creek forecasted 1.87 million casino visits for 2013 versus 2.1 million estimated by WGR. Chisholm Creek’s forecast was 186 thousand visits (10%) lower than WGR’s. Casino visit projections for 2015 showed a similar spread. Chisholm Creek projected 1.9 million casino visits, while WGR estimated 2.1 million. Chisholm Creek’s were lower by 185 thousand visits (10%). In the full build out case, the Hollywood projected 3.0 million visits relative to WGR’s 2.7 million. Chisholm Creek’s estimates were 308 thousand visits (10%) higher than WGR’s.

South Central Gaming Zone of Kansas Projections of Casino Visits & Gaming Revenues
October 2009 Wells Gaming Research Page 3-11
Gaming Revenue Projections WGR used proprietary gravity modeling methods to forecast the casino gaming revenues for the Hollywood. WGR’s gravity modeling methodology has proven to be a flexible and effective tool for estimating gaming revenues for casino projects where the interplay with existing and/or proposed competing casinos could affect the future gaming revenues of a particular project (refer to section 1, pages 1-7 and 1-8 for additional information on WGR’s gravity modeling methodology). WGR’s 2013 forecasts for Chisholm Creek include the impacts of the 2008-2009 ongoing recession, and a 3% inflation factor. Chisholm Creek versus WGR
Chisholm Creek’s gaming revenue forecast of $121 million for 2013 compares with WGR’s $145 million, a difference of 24 million (19%). Chisholm Creek’s 2015 forecast of $130 million was $25 million (19%) lower than WGR’s gaming revenue projection of $155 million. In the full build out scenario, Chisholm Creek’s revenue estimate of $230 million was $24 million (10%) higher than WGR’s $206 million.
Exhibit 3-8 Revenue Projections
Phase I
Full Build Out
Applicant's Casino Revenue Projections 2013 2015 2015
Chisholm Creek Casino Application - Residential $108,978,060 $116,763,754 N/A
Chisholm Creek Casino Application - Tourist $12,161,027 $13,031,063 N/A
Chisholm Creek Casino Application - Total $121,139,087 $129,794,817 $230,000,000
WGR's Casino Revenue Projections (Inflated) 2013 1
2015 1
2015 2
Chisholm Creek Casino $144,643,292 $154,757,092 $206,064,825
Difference - Applicant vs WGR -$23,504,205 -$24,962,275 $23,935,175
% Difference -19% -19% 10%
Footnotes: 1. Phase 1 for WGR --- At a 68% confidence interval (one standard deviation from the mean, assuming a normal
distribution), revenues can be expected to vary +8% and -10%. In other words, predicted revenues can be expected to fall within this range 68% of the time.
2. Full Build Out for WGR --- At a 68% confidence interval (one standard deviation from the mean, assuming a normal
distribution), revenue can be expected to vary +6% and -7%, i.e., predicted revenues can be expected to fall within this range 68% of the time.
Data Source: Wells Gaming Research, October 2009.

South Central Gaming Zone of Kansas Projections of Casino Visits & Gaming Revenues
October 2009 Wells Gaming Research Page 3-12
Chisholm Creek versus the 2008 Applicants WGR compared Chisholm Creek’s 2009 proposal (phase 1 and the full build out) with the 2012 forecasts developed for Harrah’s, Marvel (Trailhead Casino Resort), and Penn National (Hollywood Casino). The results are illustrated in Exhibit 2-9.
Exhibit 2-9 Comparison of Chisholm Creek 2009 versus 2008 Applicants 2009 Application Chisholm Creek
2008 Applications
(Projections Made by WGR for 2012) 1
Capacities & AmenitiesPhase I (2012)
Full Build Out (2015) Harrah's
Trailhead (Marvel)
Hollywood (Penn National)
Capital Investment $125,000,000 $225,000,000 $450,000,000 $393,156,577 $365,000,000
Gaming Revenues:
Applicant $117,037,434 $230,000,000 $252,359,000 $258,216,000 $194,234,748
WGR $139,843,679 $206,064,825 $203,911,008 $138,363,216 $125,679,360
Difference -$22,806,245 $23,935,175 $48,447,992 $119,852,784 $68,555,388
Visitor Projections:
Applicant 1,857,565 3,020,000 3,316,668 2,577,666 2,516,040
WGR 2,043,836 2,711,986 2,922,106 1,823,298 1,660,359
Difference -186,271 308,014 394,562 754,368 855,681
Casino:
Square Footage 54,475 95,000 70,000 65,000 70,000
# of Slots 1,300 2,000 2,000 2,000 1,500
# of Tables Games 30 50 50 65 40
# of Poker tables Not Specified Not Specified 9 18 Not Specified
Hotel Rooms 0 150 365 304 350
Restaurants/Entertainment:
# of Restaurants 3 5 5 4 5
# of Small Entertainment Venues 0 1 2 2 1
# of Large Entertainment Venues 0 2 2
2 1 1
Convention Square Footage 0 12,000 3
30,338 40,000 30,000
Sports/Recreation Facilities:
Enclosed Pool Not Specified Not Specified Not Specified Yes Yes
Outdoor Pool Not Specified Not Specified Not Specified Yes Not Specified
Spa/ Fitness Center Not Specified Not Specified Yes Yes Yes
Golf Not Specified Not Specified Yes Yes No
Tennis Not Specified Not Specified Yes Yes No
Off-Site Guided Hunting & Lodge Not Specified Not Specified No Yes No
Parking:
# of Surface Spaces 1,925 3,000 2,614 3,000 2,900
# of Covered Spaces 0 0 576 0 0
# of RV Spaces 0 0 44 150 50
# of Retail Outlets 1 1 2 4 1
# of FTE's (full time equivalents) 874 Not Specified 1,187 1,520 875 Footnotes:
1. Recap of WGR’s projections presented to the Kansas Gaming Facility Review Board in Sept. 2008. 2. Includes one live venue in addition to multipurpose meeting and entertainment venue. 3. Multipurpose meeting and entertainment venue.

South Central Gaming Zone of Kansas Projections of Casino Visits & Gaming Revenues
October 2009 Wells Gaming Research Page 3-13
Capital Investment Comparisons
Phase 1 - Variances between Chisholm Creek’s proposed $125 million investment for phase 1 and the 2008 applicants illustrate that Chisholm Creek is: • $325 million (260%) lower than Harrah’s $450 million • $268 million (215%) lower than the Marvel’s $393 million • $240 million (192%) lower than the Penn National’s $365 million
Full Build Out - Variances show that the Chisholm Creek’s proposed investment of $225 million is: • $225 million (100%) lower than Harrah’s $450 million • $168 million (75%) lower than the Marvel’s $393 million • $140 million (62%) lower than the Penn National’s $365 million
Gaming Revenue Comparisons Chisholm Creek 2009 application vs. WGR projections Variances between Chisholm Creek’s proposed gaming revenues and WGR’s forecasts illustrates that the: Phase 1 • $117 million projection for 2012 is $23 million (19%) lower than WGR’s $140
million (Chisholm Creek’s 2012 gaming revenue projections should not be confused with the 2013 forecasts featured in Exhibit 2-4, page 2-5).
Full Build Out • $230 million forecast for 2015 is $24 million (10%) higher than WGR’s $206
million Chisholm Creek 2009 application vs. the 2008 applicants Phase 1 Gaming Revenue Comparisons between Chisholm Creek’s $117 million gaming revenue projection and the 2008 applicants shows that the Chisholm Creek is: • $135 million (116%) lower than Harrah’s $252 million • $141 million (121%) lower than the Marvel’s $258 million • $77 million (66%) lower than the Penn National’s $194 million
Full Build Out Chisholm Creek’s gaming revenue projection of $230 million for 2015 is: • $22 million (10%) lower than Harrah’s $252 million • $28 million (12%) lower than the Marvel’s $258 million • $36 million (16%) higher than the Penn National’s $194 million
South Central Gaming Zone of Kansas Projections of Casino Visits & Gaming Revenues
October 2009 Wells Gaming Research Page 3-14
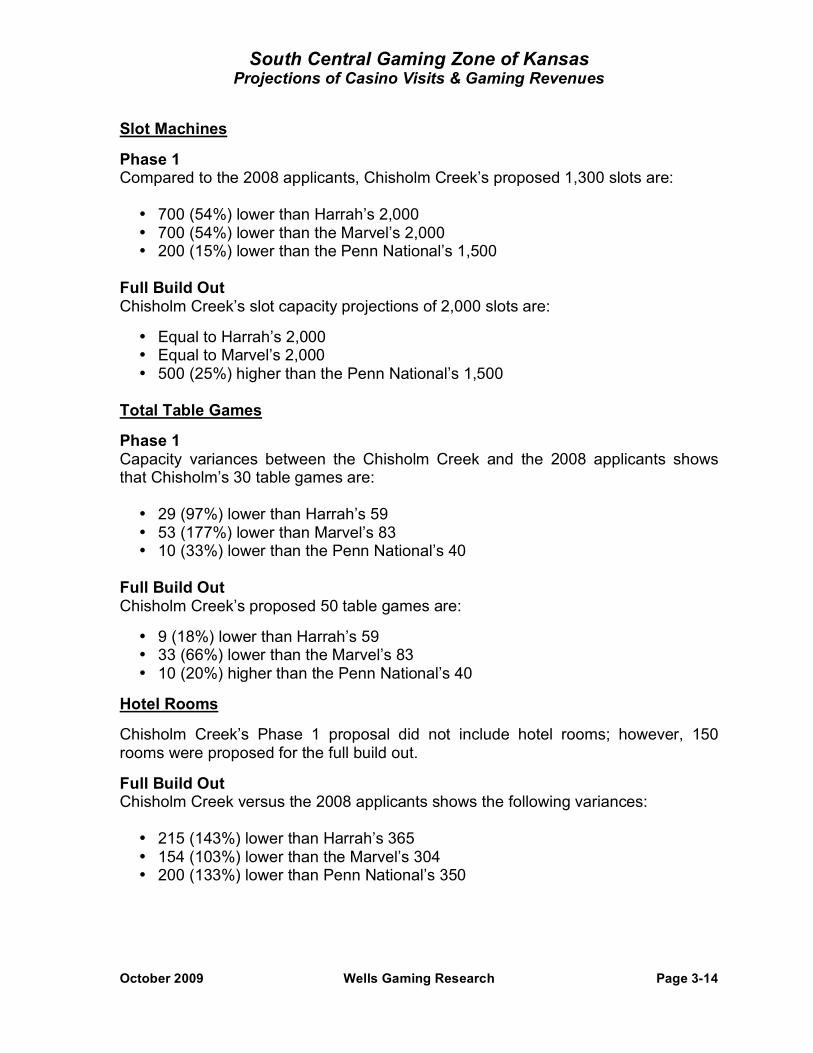
Slot Machines Phase 1 Compared to the 2008 applicants, Chisholm Creek’s proposed 1,300 slots are:
• 700 (54%) lower than Harrah’s 2,000 • 700 (54%) lower than the Marvel’s 2,000 • 200 (15%) lower than the Penn National’s 1,500
Full Build Out Chisholm Creek’s slot capacity projections of 2,000 slots are:
• Equal to Harrah’s 2,000 • Equal to Marvel’s 2,000 • 500 (25%) higher than the Penn National’s 1,500
Total Table Games
Phase 1 Capacity variances between the Chisholm Creek and the 2008 applicants shows that Chisholm’s 30 table games are:
• 29 (97%) lower than Harrah’s 59 • 53 (177%) lower than Marvel’s 83 • 10 (33%) lower than the Penn National’s 40
Full Build Out Chisholm Creek’s proposed 50 table games are: • 9 (18%) lower than Harrah’s 59 • 33 (66%) lower than the Marvel’s 83 • 10 (20%) higher than the Penn National’s 40
Hotel Rooms Chisholm Creek’s Phase 1 proposal did not include hotel rooms; however, 150 rooms were proposed for the full build out. Full Build Out Chisholm Creek versus the 2008 applicants shows the following variances: • 215 (143%) lower than Harrah’s 365 • 154 (103%) lower than the Marvel’s 304 • 200 (133%) lower than Penn National’s 350