wharton department of statistics data mining bob stine department of statistics bob
TRANSCRIPT
WhartonDepartment of Statistics
Data MiningData Mining
Bob Stine
Department of Statistics
www-stat.wharton.upenn.edu/~bob
WhartonDepartment of Statistics
2
OverviewOverview
Applications- Marketing: Direct mail advertising (Zahavi example)
- Biomedical: finding predictive risk factors
- Financial: predicting returns and bankruptcy
Role of management- Setting goals
- Coordinating players
Critical stages of modeling process- Picking the model <-- My research interest
- Validation
WhartonDepartment of Statistics
3
Predicting Health RiskPredicting Health Risk
Who is at risk for a disease?- Costs
• False positive: treat a healthy person• False negative: miss a person with the disease
- Example: detect osteoporosis without need for x-ray
What sort of predictors, at what cost?- Very expensive: Laboratory measurements, “genetic”- Expensive: Doctor reported clinical observations- Cheap: Self-reported behavior
Missing data- Always present- Are records with missing data like those that are not missing?
WhartonDepartment of Statistics
4
Predicting Stock Market Predicting Stock Market ReturnsReturns
Predicting returns on the S&P 500 index- Extrapolate recent history
- Exogenous factors
What would distinguish a good model?- Highly statistically significant predictors
- Reproduces pattern in observed history
- Extrapolate better than guessing, hunches
Validation - Test of the model yields sobering insight
WhartonDepartment of Statistics
5
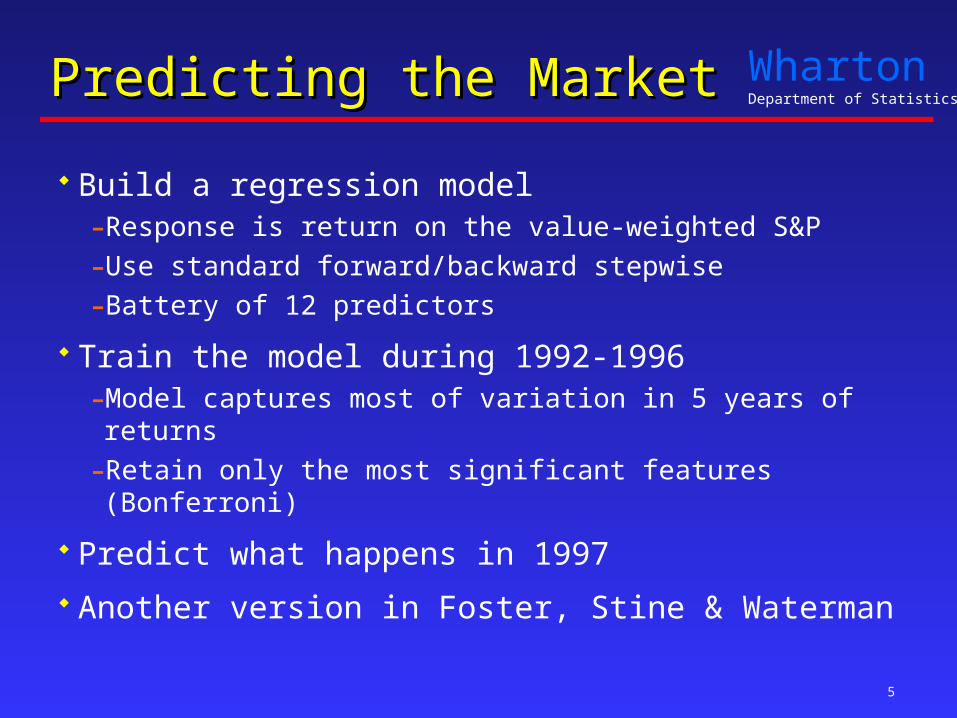
Predicting the MarketPredicting the Market
Build a regression model - Response is return on the value-weighted S&P
- Use standard forward/backward stepwise
- Battery of 12 predictors
Train the model during 1992-1996- Model captures most of variation in 5 years of returns
- Retain only the most significant features (Bonferroni)
Predict what happens in 1997
Another version in Foster, Stine & Waterman
WhartonDepartment of Statistics
6
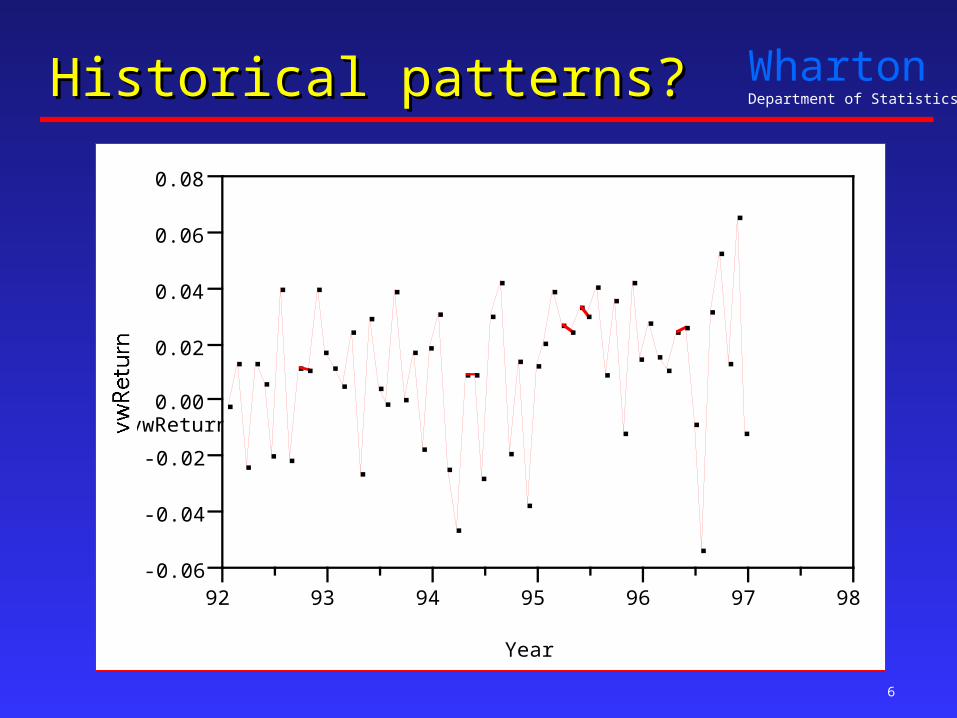
Historical patterns?Historical patterns?
vwReturn
-0.06
-0.04
-0.02
0.00
0.02
0.04
0.06
0.08
92 93 94 95 96 97 98
Year
?
WhartonDepartment of Statistics
7
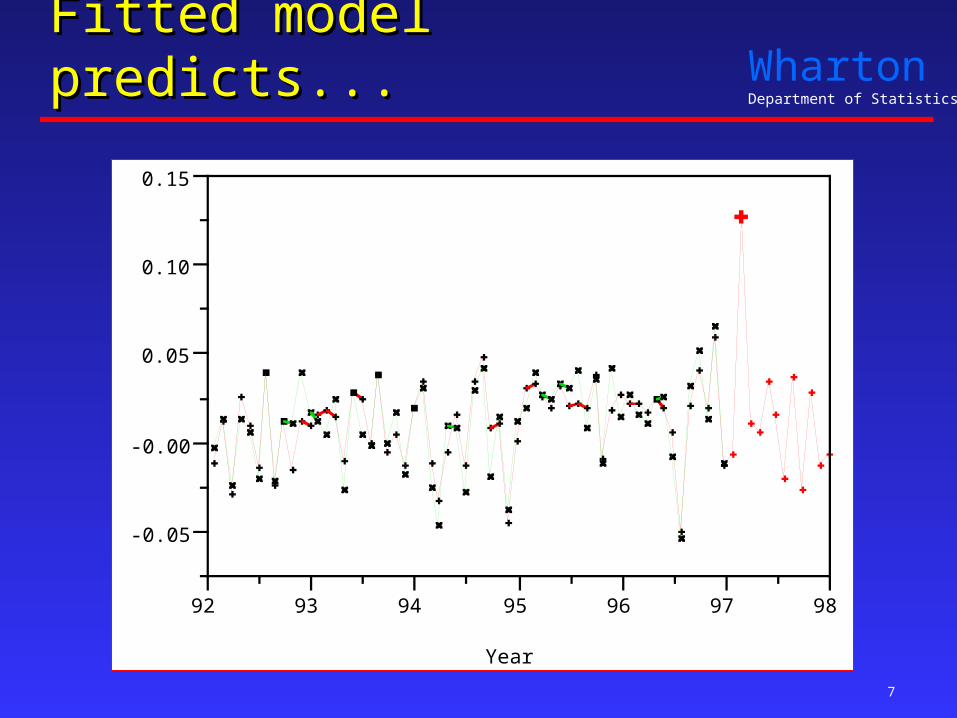
Fitted model predicts...Fitted model predicts...
-0.05
-0.00
0.05
0.10
0.15
92 93 94 95 96 97 98
Year
Exceptional Feb return?
WhartonDepartment of Statistics
8
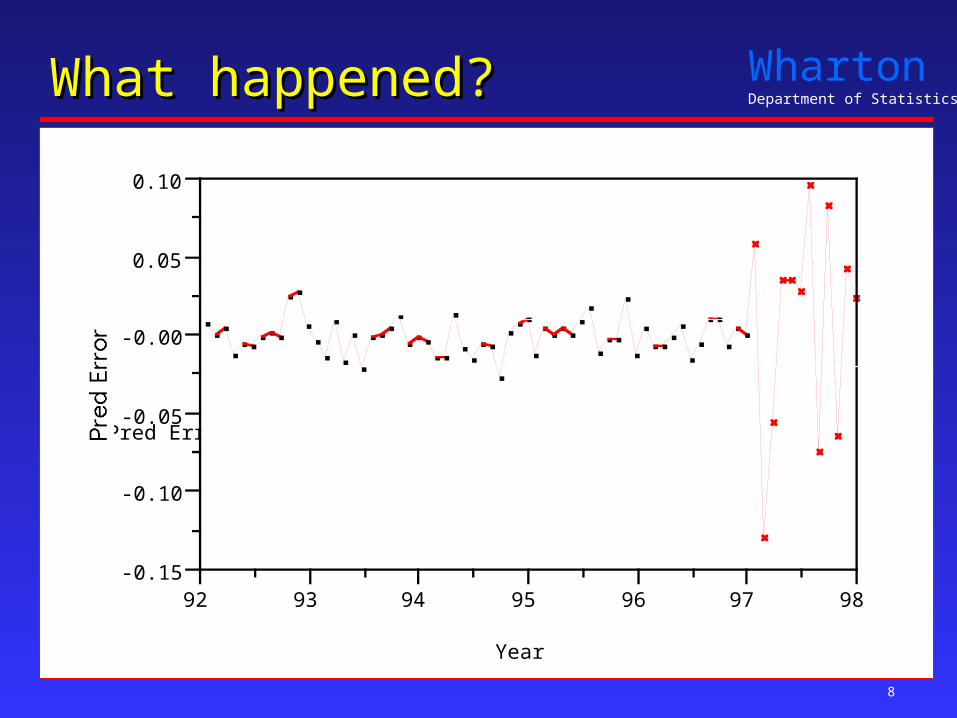
What happened?What happened?
Pred Error
-0.15
-0.10
-0.05
-0.00
0.05
0.10
92 93 94 95 96 97 98
Year
Training Period
WhartonDepartment of Statistics
9
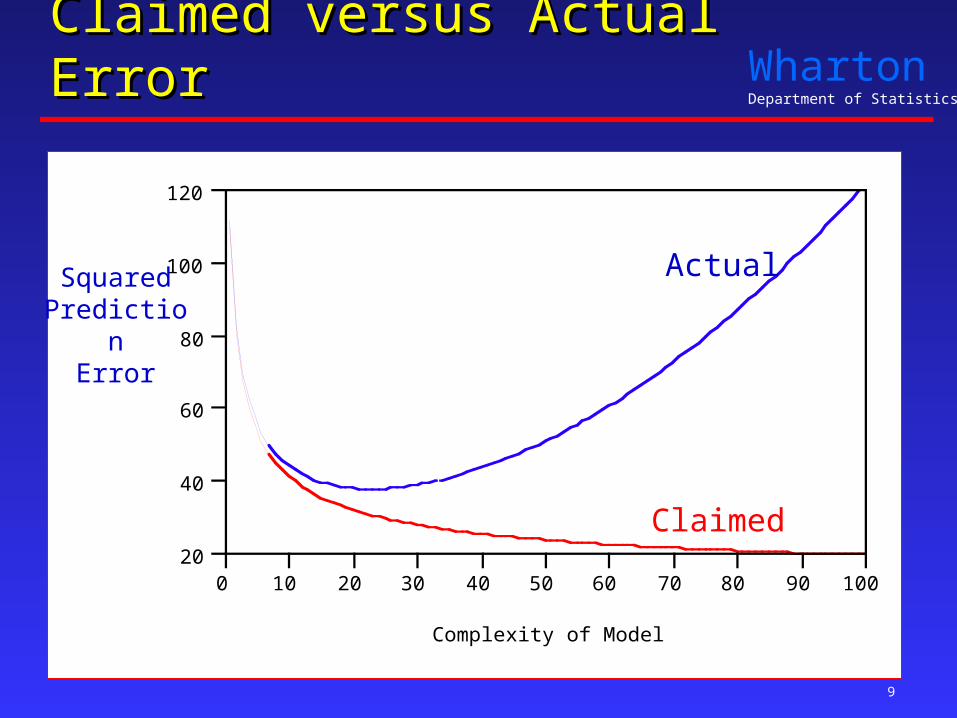
Claimed versus Actual ErrorClaimed versus Actual Error
20
40
60
80
100
120
0 10 20 30 40 50 60 70 80 90 100
Complexity of Model
Actual
Claimed
SquaredPrediction
Error
WhartonDepartment of Statistics
10
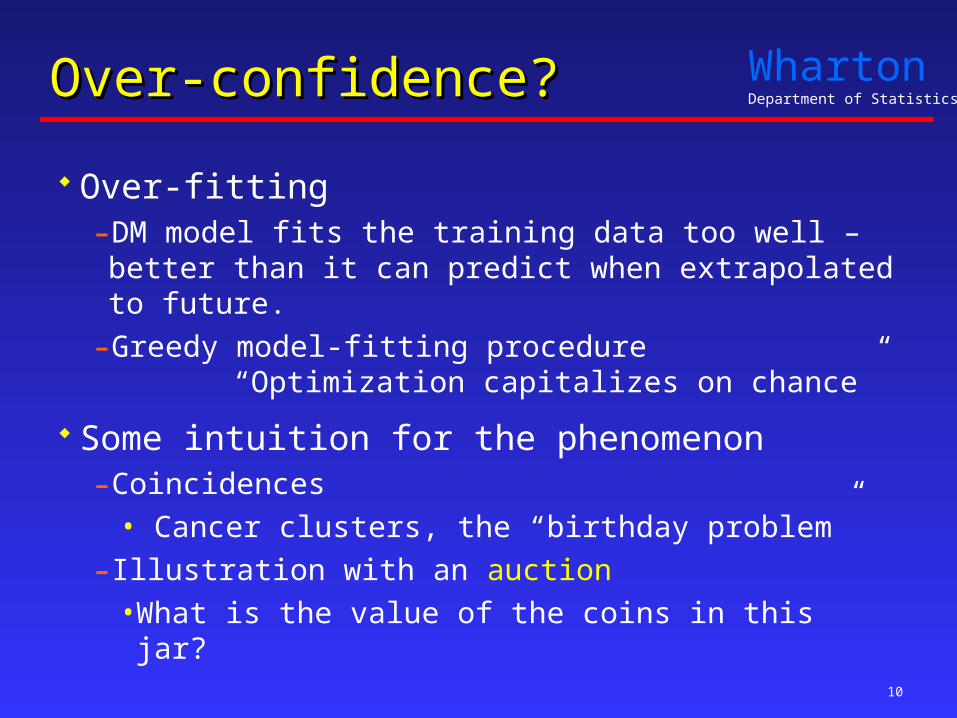
Over-confidence?Over-confidence?
Over-fitting- DM model fits the training data too well – better than it can
predict when extrapolated to future.
- Greedy model-fitting procedure “Optimization capitalizes on chance”
Some intuition for the phenomenon- Coincidences
• Cancer clusters, the “birthday problem”
- Illustration with an auction
• What is the value of the coins in this jar?

WhartonDepartment of Statistics
11
Auctions and Over-fitting Auctions and Over-fitting
Auction jar of coins to a class of students
Histogram shows the bids of 30 students
Some were suspicious, but a few were not!
Actual value is $3.85
Known as “Winner’s Curse”
Similar to over-fitting:best model like high bidder
1
2
3
4
5
6
7
8
9
WhartonDepartment of Statistics
12
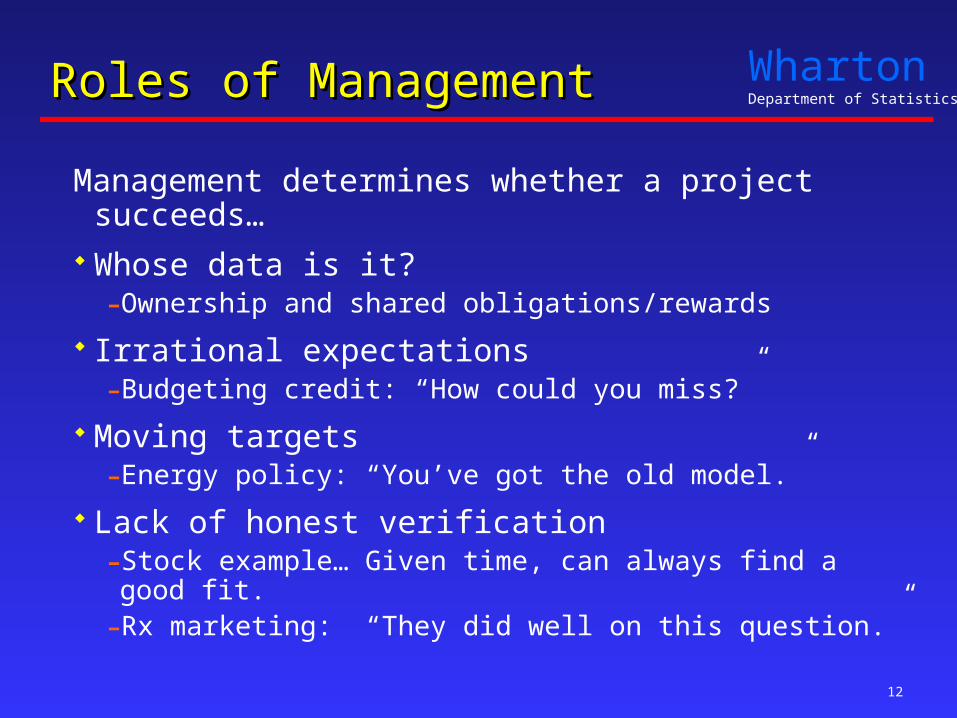
Roles of ManagementRoles of Management
Management determines whether a project succeeds… Whose data is it?
- Ownership and shared obligations/rewards
Irrational expectations- Budgeting credit: “How could you miss?”
Moving targets- Energy policy: “You’ve got the old model.”
Lack of honest verification- Stock example… Given time, can always find a good fit.- Rx marketing: “They did well on this question.”

WhartonDepartment of Statistics
13
What are the costs?What are the costs?
Symmetry of mistakes?- Is over-predicting as costly as under-predicting?
- Managing inventories and sales
- Visible costs versus hidden costs
Does a false positive = a false negative?- Classification
• Credit modeling, flagging “risky” customers
- Differential costs for different types of errors
• False positive: call a good customer “bad”
• False negative: fail to identify a “bad”
WhartonDepartment of Statistics
14
Back to a real application…Back to a real application…
How can we avoid some of these problems?
I’ll focus on
* statistical modeling aspects (my research interest), and also
* reinforce the business environment.
WhartonDepartment of Statistics
15
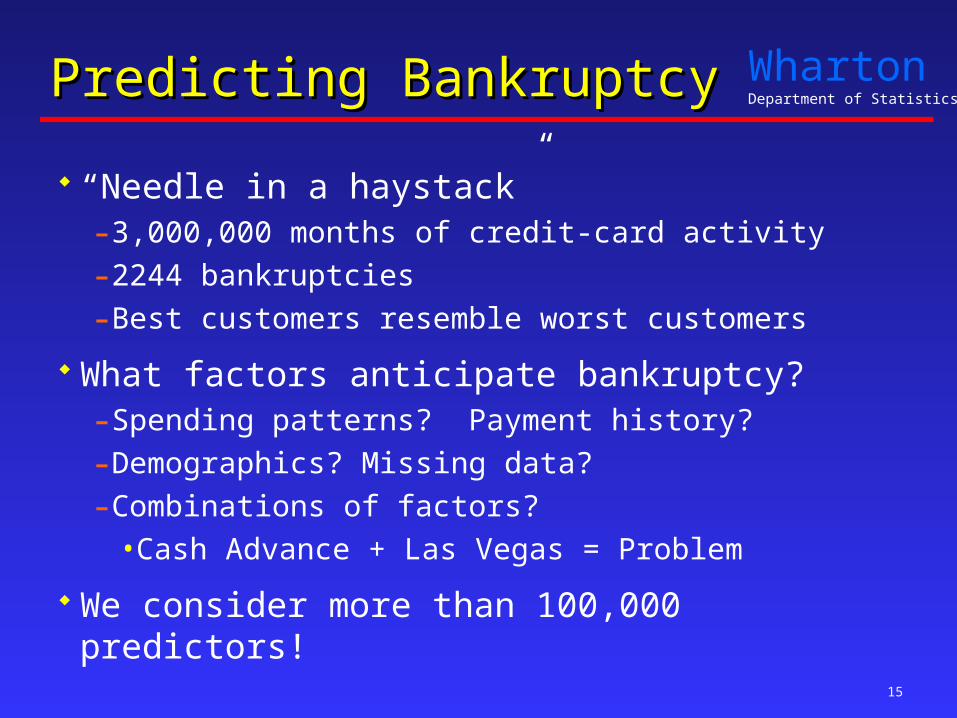
Predicting BankruptcyPredicting Bankruptcy
“Needle in a haystack”- 3,000,000 months of credit-card activity
- 2244 bankruptcies
- Best customers resemble worst customers
What factors anticipate bankruptcy?- Spending patterns? Payment history?
- Demographics? Missing data?
- Combinations of factors?
• Cash Advance + Las Vegas = Problem
We consider more than 100,000 predictors!
WhartonDepartment of Statistics
16
Stages in ModelingStages in Modeling
Having framed the problem, gotten relevant data…
Build the modelIdentify patterns that predict future observations.
Evaluate the modelWhen can you tell if its going to succeed…- During the model construction phase
• Only incorporate meaningful features
- After the model is built
• Validate by predicting new observations
WhartonDepartment of Statistics
17
Building a Predictive ModelBuilding a Predictive Model
So many choices… Structure: What type of model?
• Neural net (projection pursuit)• CART, classification tree• Additive model or regression spline (MARS)
Identification: Which features to use?• Time lags, “natural” transformations• Combinations of other features
Search: How does one find these features?• Brute force has become cheap.
WhartonDepartment of Statistics
18
My ChoicesMy Choices
Simple structure- Linear regression with nonlinear via interactions
- All 2-way and many 3-way, 4-way interactions
Rigorous identification- Conservative standard error
- Comparison of conservative t-ratio to adaptive threshold
Greedy search- Forward stepwise regression
- Coming: Dynamically changing list of features
• Good choice affects where you search next.
WhartonDepartment of Statistics
19
Bankruptcy Model: ConstructionBankruptcy Model: Construction
Context- Identify current customers who might declare bankruptcy
Split data to allow validation, comparison- Training data
• 600,000 months with 450 bankruptcies
- Validation data
• 2,400,000 months with 1786 bankruptcies
Selection via adaptive thresholding - Analogy: Compare sequence of t-stats to Sqrt(2 log p/q)
- Dynamic expansion of feature space
WhartonDepartment of Statistics
20
Bankruptcy Model: FittingBankruptcy Model: Fitting
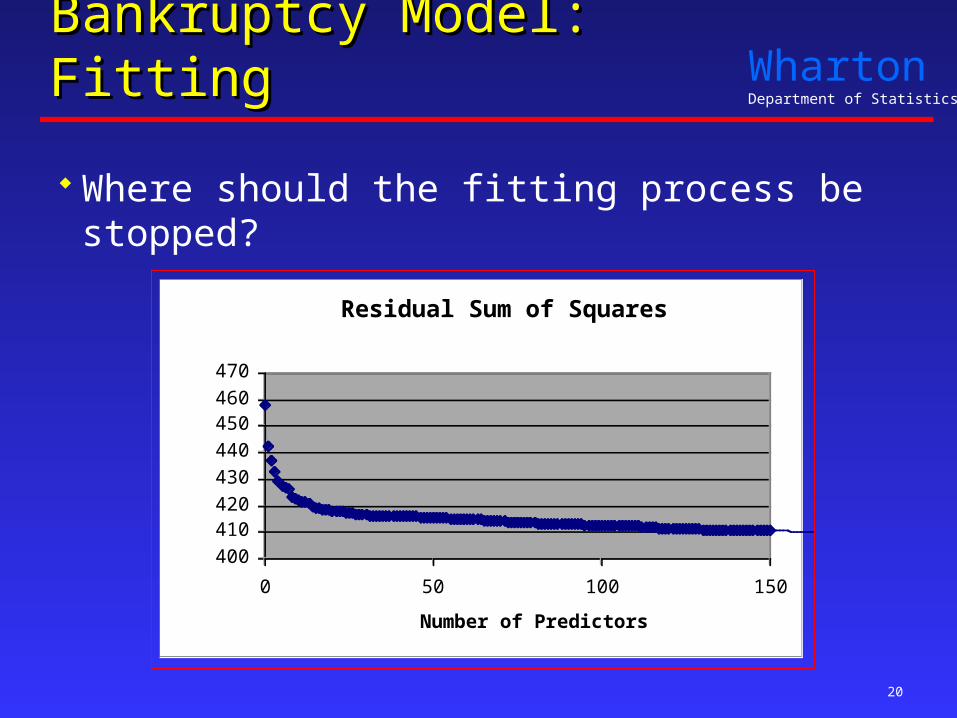
Where should the fitting process be stopped?
Residual Sum of Squares
400
410420
430
440
450460
470
0 50 100 150
Number of Predictors
SS
WhartonDepartment of Statistics
21
Bankruptcy Model: FittingBankruptcy Model: Fitting
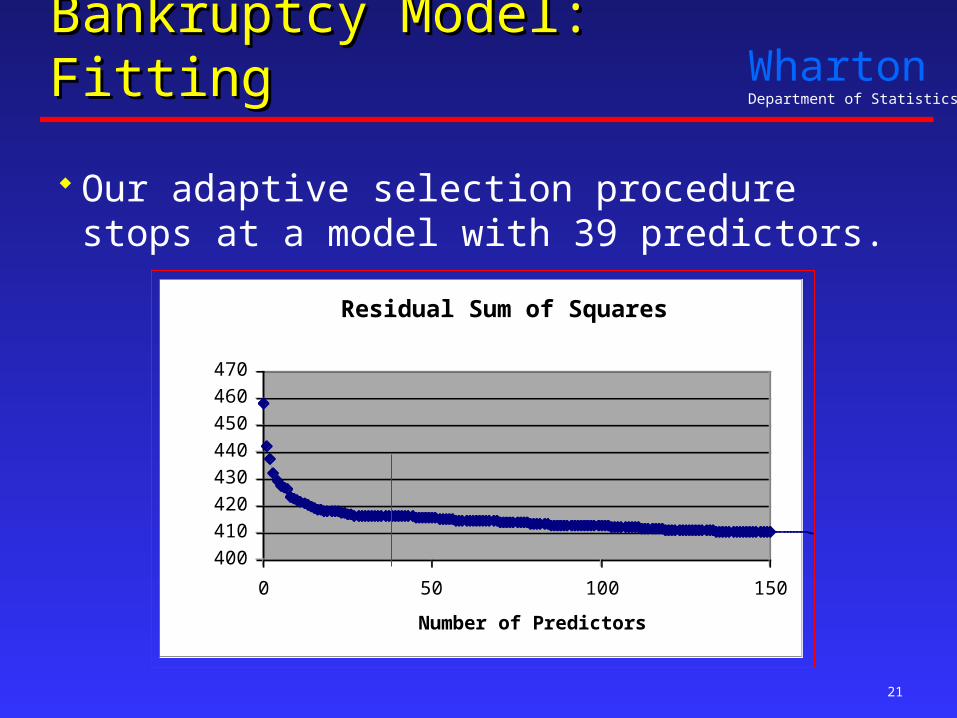
Our adaptive selection procedure stops at a model with 39 predictors.
Residual Sum of Squares
400
410
420
430
440
450
460
470
0 50 100 150
Number of Predictors
SS
WhartonDepartment of Statistics
22
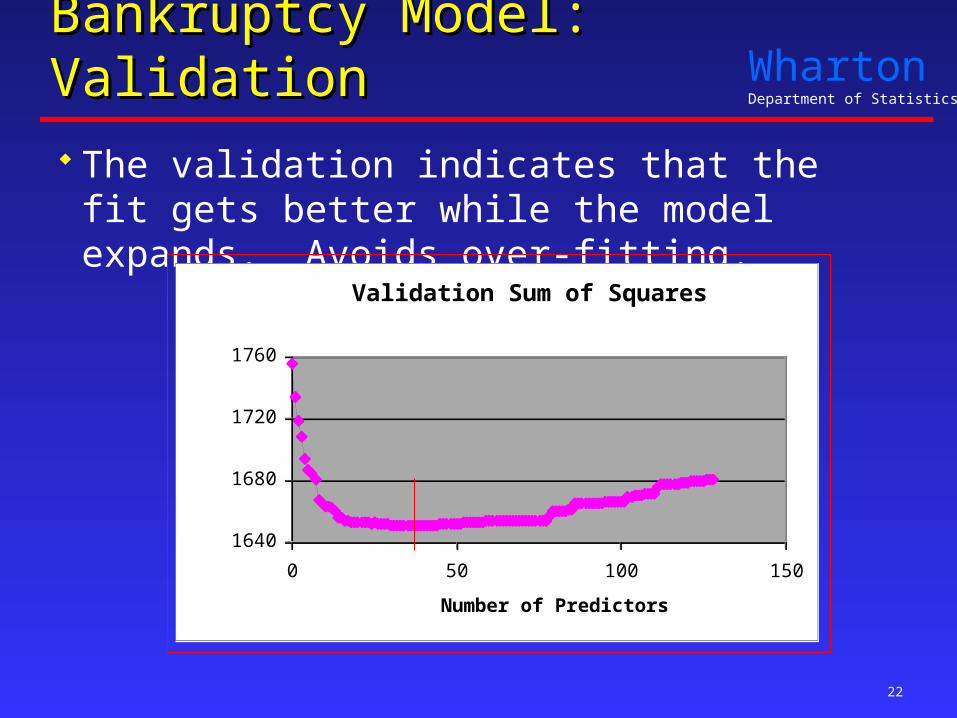
Bankruptcy Model: ValidationBankruptcy Model: Validation The validation indicates that the fit gets better while
the model expands. Avoids over-fitting.
Validation Sum of Squares
1640
1680
1720
1760
0 50 100 150
Number of Predictors
SS
WhartonDepartment of Statistics
23
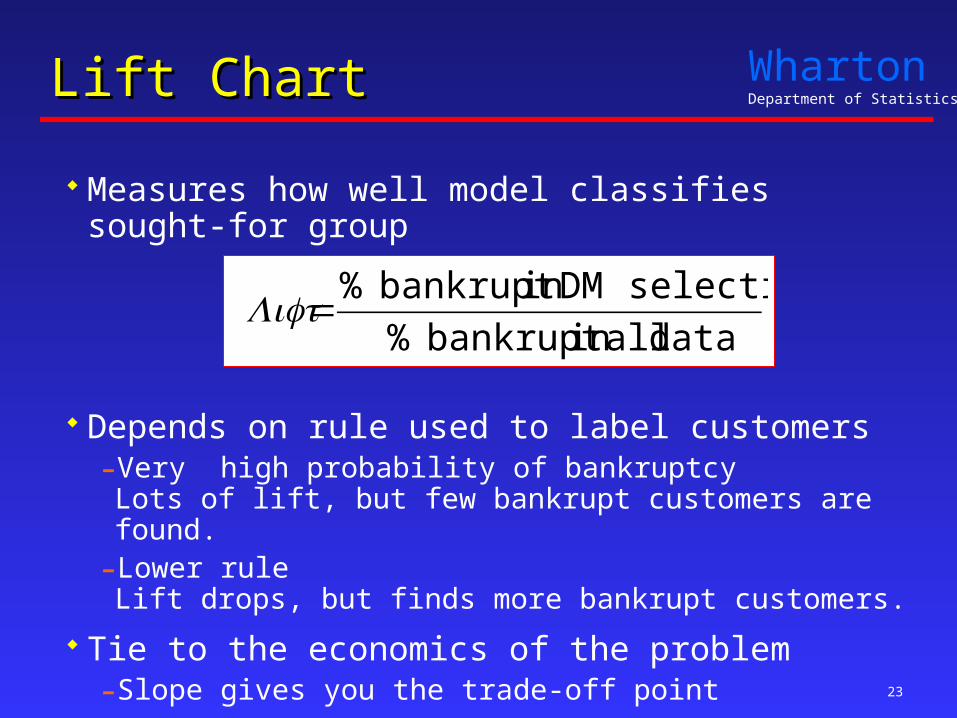
Lift ChartLift Chart
Measures how well model classifies sought-for group
Depends on rule used to label customers - Very high probability of bankruptcy
Lots of lift, but few bankrupt customers are found.- Lower rule
Lift drops, but finds more bankrupt customers.
Tie to the economics of the problem- Slope gives you the trade-off point
data allin bankrupt %
selectionDMinbankrupt %=Lift
WhartonDepartment of Statistics
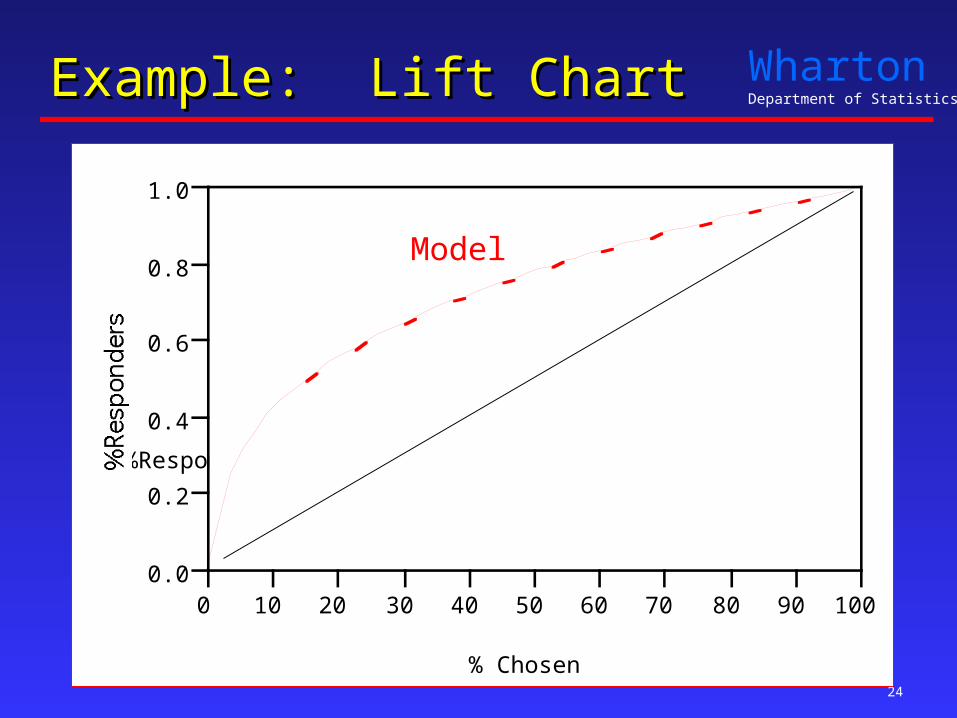
24
Example: Lift ChartExample: Lift Chart
%Responders
0.0
0.2
0.4
0.6
0.8
1.0
0 10 20 30 40 50 60 70 80 90 100
% Chosen
Model
Random
WhartonDepartment of Statistics
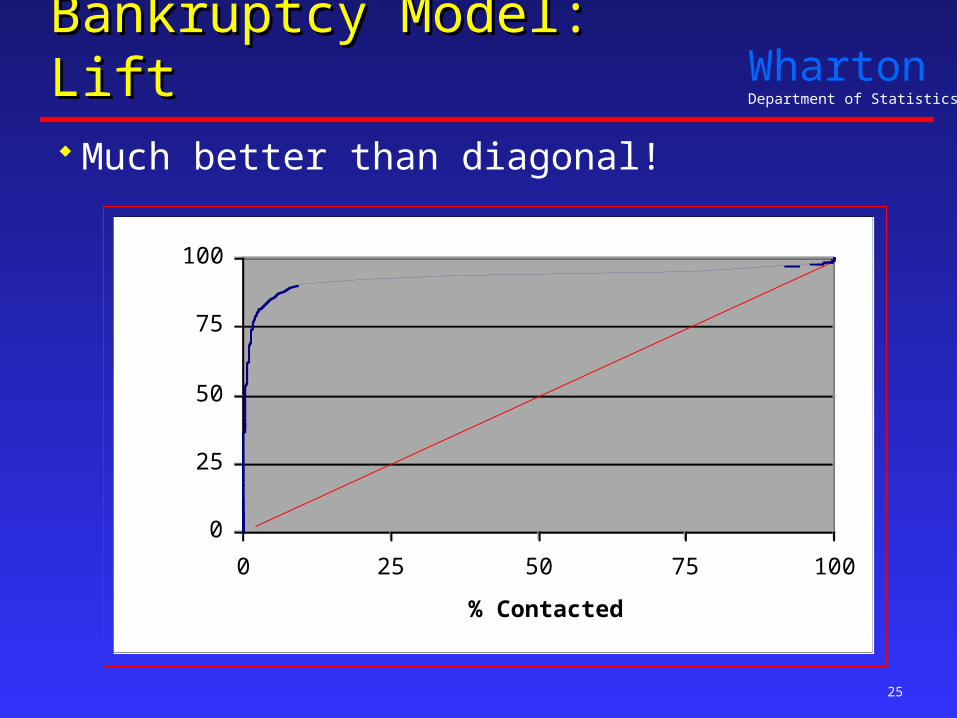
25
Bankruptcy Model: LiftBankruptcy Model: Lift Much better than diagonal!
0
25
50
75
100
0 25 50 75 100
% Contacted
% Found
WhartonDepartment of Statistics
26
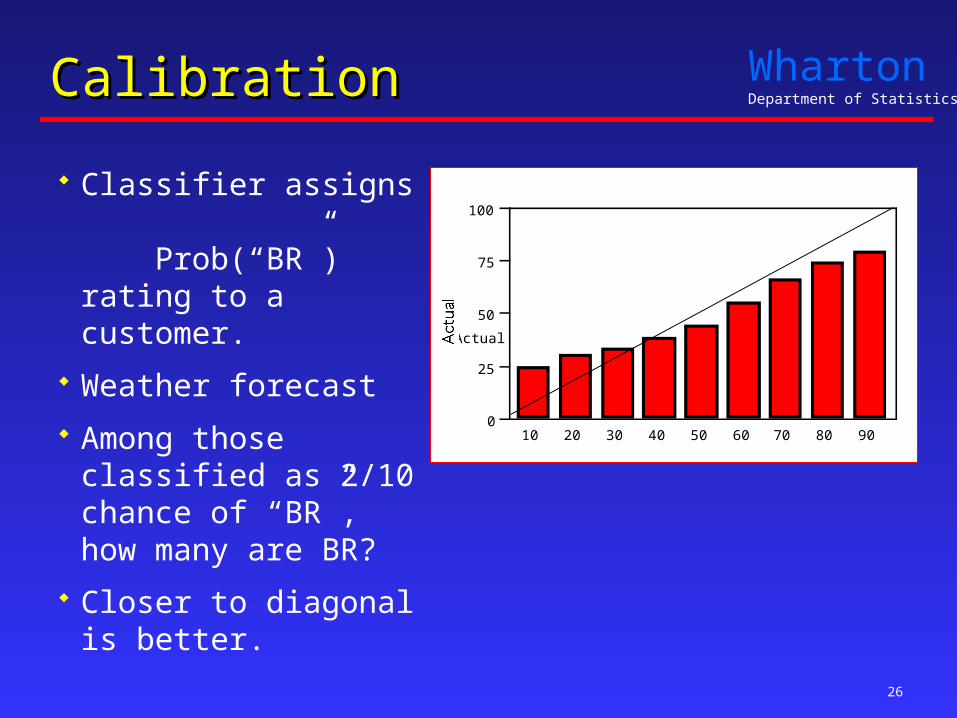
CalibrationCalibration
Classifier assigns Prob(“BR”)rating to a customer.
Weather forecast
Among those classified as 2/10 chance of “BR”, how many are BR?
Closer to diagonal is better.
Actual
0
25
50
75
100
10 20 30 40 50 60 70 80 90

WhartonDepartment of Statistics
27
Bankruptcy Model: CalibrationBankruptcy Model: Calibration Over-predicts risk near claimed probability 0.3.
Calibration Chart
0
0.2
0.4
0.6
0.8
1
1.2
0 0.2 0.4 0.6 0.8
Claim
Actual
WhartonDepartment of Statistics
28
Modeling BankruptcyModeling Bankruptcy
Automatic, adaptive selection- Finds patterns that predict new observations- Predictive, but not easy to explain
Dynamic feature set- Current research- Information theory allows changing search space- Finds more structure than direct search could find
Validation- Remains essential only for judging fit, reserve more for
modeling- Comparison to rival technology (we compared to C4.5)
WhartonDepartment of Statistics
29
Wrap-Up Data MiningWrap-Up Data Mining
Data, data, data- Often most time consuming steps
• Cleaning and merging data
- Without relevant, timely data, no chance for success.
Clear objective- Identified in advance
- Checked along the way, with “honest” methods
Rewards- Who benefits from success?
- Who suffers if it fails?