what are the causes and timing of loss for insured crops ... are the causes and timing of loss for...
TRANSCRIPT

What are the causes and timing of loss for insured crops in the U.S. Pacific Northwest?
Scott Auld
Senior Project for Bachelor of Science
Department of Applied Economics
Oregon State University
August 25, 2016

II
Table of Contents
Abstract……………………………………………………………………………………...III
Introduction…………………………………………………………………………………1
Literature Review…………………………………………………………………………...3
Project Statement…………………………………………………………………………....5
Approach……………………………………………………………………………………5
Results………………………………………………………………………………………7
Cause of Loss in the PNW………………………………………………………….7
Months of Loss in the PNW………………………………………………………...8
Major Insured Crops in the PWN…………………………………………………..11
Months of Loss for the Major Crops in the PNW………………………………….12
PNW and the West Coast…………………………………………………………..14
Discussion………………………………………………………………………………….15
Conclusion…………………………………………………………………………………17
References………………………………………………………………………………….19
Appendix A………………………………………………………………………………...20
Appendix B………………………………………………………………………………...21

III
Abstract
Climate is one of the primary risks to agricultural production in the United States. Extreme
climate events cause billions of dollars in damage and reduce yields for crops across the country.
This research examines the causes and timing of loss for insured crops in the U.S. Pacific
Northwest (Idaho, Oregon, and Washington). I find that frost/freeze, drought, and heat are the
primary causes of loss in the region, and these events primarily take place during the spring and
summer season. The major crops that experience loss in the region are wheat, barley, cherries,
dry peas, and apples. I find that field crops are most susceptible to drought and heat during the
summer and perennial crops are most susceptible to late spring freezes.

1
Introduction
Variations in climate risk have long been one of the biggest threats to agricultural
production. Extreme climate events that damage crops impact agricultural production here in the
United States and cause billions of dollars in damage annually. To manage these challenges, the
U.S. government has legislated measures that encourage participation in the federal crop
insurance program and other ad hoc disaster assistance programs. The enactment of the Federal
Crop Insurance Act of 1938, which focused on struggling wheat farmers in the years following
the Great Depression and Dust Bowl, launched the groundwork for what would evolve into
today’s crop insurance program. Research by O’Donoghue (2014) examines the impact of
premium subsidies on the demand for crop insurance. As programs expand, such as the
enactment of the Federal Crop Insurance Reform Act of 1994 (FCIRA) and the Agricultural Risk
Protection Act of 2000 (ARPA), subsidies continue to increase. Greater participation rates
induced by larger subsidies discourage adverse selection by reducing moral hazard for high-risk
producers. FCIRA introduced the fully subsidized Catastrophic Risk Protection Endorsement
(CAT) that covered severe losses of yields greater than 50 percent. Farmers who enroll in CAT
are automatically eligible for federal benefits. The turn of the century brought more reforms,
with new types of insurance coverage that included a larger number of crops. The Whole-Farm
Revenue Protection (WFRP) program, introduced under the 2014 Farm Bill, encourages
participation and greater crop diversity by insuring all commodities on the farm under one
policy. With the continuous evolution of the federal crop insurance program and climate change,
it is valuable to assess the causes and timing of loss for insured crops to provide insights about
producers’ production risks and ways to improve the design of federal crop insurance programs.

2
I address this need by analyzing the causes and timing of loss for insured crops in the U.S.
Pacific Northwest from 1989-2015.
The U.S. Pacific Northwest (Idaho, Oregon, and Washington) is no stranger to extreme
climate events. Unusually dry or wet weather can effect agricultural production during any given
time of year. The region is also susceptible to a reoccurring phenomenon known as the El Nino
Southern Oscillation (ENSO). During these periods, warm and cool phases around the equatorial
Pacific increase variations in the climate. By recognizing the occurrences of ENSO, and the
primary causes of loss associated with climate risk, producers could choose better planting
strategies based on advanced weather predictions that focus on the largest risks to insured crops.
This paper attempts to do this by applying analysis to historical COL data in order to uncover the
largest frequencies of reported causes of loss. To examine these climate risks for the Pacific
Northwest (PNW) from a historical perspective, we examine the Cause of Loss data (COL)
provided by the USDA Risk Management Agency, the agency that administers the federal crop
insurance program. This database provides reported cause of loss and month of loss for all
insured crops for the years 1989-2015. The data analysis in this paper provides information on
the overall causes of loss and months of loss in the PNW, as well as the causes of loss for major
crops (wheat, barley, cherries, dry peas, and apples). I find that the primary causes of loss in the
PNW are frost/freeze, drought, and heat, and these losses occur most frequently during the late
spring and early summer. The three field crops (wheat, barley, and dry peas) experience losses
most frequently from drought and heat in May, June, and July. The two perennial crops (cherries
and apples) experience losses most frequently from frost/freeze in March, April, May, and June.
An examination of this data can be beneficial to development of future policy. Producers will
benefit from weather predictions that focus on frost/freeze, drought, and heat, since these three

3
causes of loss occur most frequently. Insurers will be able to examine the demand for different
types of insurance policies, such as specific peril coverage. Researchers will be able to develop
models of future causes of loss for insured crops in the PNW based on this cause of loss data by
examining climate variations for the region. Producers, insurance companies, and policymakers
alike will be able to use this research to improve the application of insurance while raising
awareness of potential pitfalls for insured crops in the region.
Literature Review
This study builds on research about crop insurance and extreme weather from OreCal
Issues Brief No. 012. Olen and Wu (2014) used the COL data provided by the USDA Risk
Management Agency to examine the reported cause of loss for all insured crops in the U.S. West
Coast (California, Oregon, and Washington), as well as the 2008 Farm and Ranch Irrigation
Survey to predict how producers mitigate damage from extreme weather. Their research looked
into the vulnerability of specialty crops to extreme climate events and how irrigations practices
adjusted to fit those circumstances. The COL database that Olen and Wu used does not include
the timing of loss for insured crops in the West Coast, but it is possible to compare results for the
causes of loss for wheat in the PNW and the West Coast. A comparison of wheat in the PNW
and crop categories in the West Coast will show if there are connections across abiotic and biotic
factors.
Olen et aI. (2015) analyze the major climate risks for agriculture in the PNW using a
unique statistical profile of spatial and temporal climate variations for the growing season. They
find that precipitation risk, fall freeze risk, and spring freeze risk are greatest near the coast, but
temperature risk is lowest in those areas. Overall, they find temperature variation is low across
the region. Precipitation risk and fall freeze risk are greatest at higher elevations. Olen et al.
4
(2015) do not research causes or timing of loss for specific crops in the PNW. An analysis of the
spatial and temporal variations of climate and the specific crops in the region exposed to those
variations would benefit local producers.
The Rain and Hail Insurance Society (2015) provide insight on crop insurance issues in
their annual publication. They examine the reported causes of loss for insured crops in the United
State for the year 2014. They identify the most frequent causes of loss to be excess
moisture/precipitation/rain (28 percent), decline in price (20 percent), and drought (19 percent).
The report also examines the percentage of eligible acres insured and the total value of the
protection. The Rain and Hail Insurance Society (2015) does not provide information on the
timing of loss for the most frequent causes of loss in 2014 or the causes of loss for insured crops
in the U.S. over a period of years. Sherrick et al. (2004) mention that producers make crop
insurance decisions based on the maximization of utility by choosing production factors,
including crop insurance, that support the highest level of wealth. Utility maximization is only
possible if producers recognize the potential risks involved and the timing of those risks.
Cai et al. (2014) find that climate change will increase the frequency of extreme ENSO
events, so it is more important than ever to improve climate predictions. The climate patterns in
the PNW are partly due to ENSO phenomena. During warm phases of ENSO, otherwise known
as El Nino, there is an increased chance of a warmer than average winter and spring in the PNW,
while decreasing the chances of a wetter than average winter. During cool phases of ENSO,
otherwise known as La Nina, there is an increased chance of a cooler and wetter than average
winter in the PNW (Olen et al., 2015). Climate research by Adams et el. (1999) adds insight to
the variations caused by occurrences of ENSO. It becomes necessary to improve weather
predictions in order to build accurate estimates of future climate risk. Better forecasting methods

5
can also help researchers predict the potential losses to agricultural production caused by ENSO
and other extreme climate events.
It may be necessary to analyze drought and heat simultaneously. Mittler (2006)
demonstrates that crops that suffer from both drought and heat have much greater negative
growth rates and yields than crops that experienced either factor individually. Years of El Nino
could see increased frequencies of drought and heat, as well as greater frequencies of frost/freeze
events since warmer temperatures encourage early planting of annual crops and premature
flowering of perennial crops. Unlike drought or heat, frost/freeze events are fast killers that can
destroy a crop overnight (Brotak, 2014).
Project Statement
This paper addresses the following research question:
What are the causes and timing of loss for insured crops in the U.S. Pacific Northwest?
To address this research question, I achieve the following objectives:
1) Identify the reported causes of loss for insured agriculture in the PNW.
2) Identify the reported month of loss for the primary causes of loss for insured agriculture
in the PNW.
3) Identify the reported causes of loss for major insured crops in the PNW.
4) Identify the primary months of loss for the major crops in the PNW.
5) Compare the shares of reported causes of loss for wheat in the PNW to previous research
for wheat in the U.S. West Coast.
Approach
This research examines the cause and timing of loss for insured crops in the U.S. Pacific
Northwest (Idaho, Oregon, and Washington). The data used for this analysis is the USDA Risk
6
Management Agency’s Cause of Loss Historical Data Files1. Specifically, this analysis uses the
data for Indemnities with Month of Loss for 1989-2015. The database provides the year of loss,
county and state, commodity name, coverage type, cause of loss, month of loss, and indemnity
amount for insured crops in the entire United States. The federal crop insurance program is the
primary risk management program in the United States, so the cause of loss is the best available
representation of agricultural production risks. I analyze the data in Excel using the sorting,
filtering, mathematical, and graphing functions. I count each reported cause of loss in the PNW
as one observation.
To develop a profile for the reported cause of loss for agriculture in the PNW, I analyzed
data for 1989-2015. The observations were broken down by causes of loss and year of loss. The
causes of loss are frost/freeze, drought, heat, excess moisture/precipitation/rain, cold wet
weather, hail, cold winter, decline in price, wind/excess wind, failure irrigation
equipment/supply, plant disease, other causes, insects, wildlife, flood, area plan crops only, fruit
set failure, blank observations, cyclone, poor drainage, hurricane/tropical depression, earthquake,
and volcanic eruption. Each observation is found by sorting for every cause of loss in the PNW.
The total observations for each cause of loss are computed using the summation function. My
analysis provides the frequency for each cause of loss by year, as well as a combined total for
each cause of loss across all years. I display the cause of loss shares with pie charts to visualize
the most frequently reported causes of loss for insured crops in the region. Following this
approach, I then analyze the month of loss for the three primary causes of loss in the PNW.
The major insured crops are identified as the crops that experienced loss most frequently.
I examine the reported cause of loss for every insured crop from 1989-2014. The year 2015 is
1 http://www.rma.usda.gov/data/cause.html

7
excluded from this analysis because the Whole-Farm Revenue Protection (WFRP) program may
bias the results for specific crops in 2015, the first year the program was implemented. The
WFRP plan does not provide crop specific information for crops that may have been insured
under crop-specific insurance policies in the past. Insured crops that experience loss most
frequently are identified for further analysis. The timing of loss for the major crops in the PNW
provide a general understanding of when those crops are most susceptible to crop damage. I also
compare the timing of loss for major crops with the timing of loss for the three primary causes of
loss. The shares of reported causes of loss for wheat are generated into a table for cross
comparison with the shares of reported causes of loss for wheat in the U.S. West Coast (Olen and
Wu, 2014). Aside from wheat, Olen and Wu (2014) analyze the causes of loss for crop
categories. This research analyzes the causes of loss for specific crops to provide more detailed
information.
Results
Causes of Loss in the U.S. Pacific Northwest
I found the aggregate reported causes of loss for insured crops in the U.S. Pacific
Northwest for the years 1989-2015 to be 48,142 observations. These findings include the 37
blank observations that were not categorized into one of the 23 reported causes of loss. I have
identified the most frequent causes of loss for insured crops in the PNW to be frost/freeze,
drought, and heat. The share of losses for frost/freeze, drought, and heat are 20 percent, 19
percent, and 14 percent, respectively. Figure 1 provides a pie chart that displays the percentage
for each reported cause of loss. The chart shows that extreme climate events cause a larger share
of the losses in the PNW than economic and biotic factors.

8
Figure 1. Reported Causes of Loss for Insured Crops in the U.S. Pacific Northwest for
1989-2015
Note: 48,142 total observations
Months of Loss in the U.S. Pacific Northwest
An analysis of the timing of the primary causes of loss for insured crops in the PNW
indicates that frost/freeze, drought, and heat cause loss at different times in the growing season.
Frost/freeze damage most frequently occurs during the months of April (21 percent), May (19
percent), and June (13 percent). Figure 2 provides a pie chart to display the percentage for every
frost/freeze month of loss. The month of loss for 7 percent of the frost/freeze observations were
not reported. These findings suggest that late spring freezes are a more frequent problem for
agriculture in the PNW than early fall freezes.

9
Figure 2. Frost/Freeze Months of Loss for Insured Crops in the U.S. Pacific Northwest for
1989-2015
Note: 9,629 total observations
Drought most frequently occurs during the months of June (22 percent), July (18
percent), and May (16 percent). Figure 3 provides a pie chart that displays the percentage for
every drought month of loss. The month of loss for 4 percent of the drought shares were not
reported. These findings suggest that crop loss from drought most frequently occur in early
summer. This could indicate that crops are more susceptible to loss in the early stages of the
growth cycle. Crops may not be as vulnerable to drought conditions at late stages of the growth
cycle even though the driest months of the year usually occur towards the end of the summer
season.

10
Figure 3. Drought Months of Loss for Insured Crops in the U.S. Pacific Northwest for the
Years 1989-2015
Note: 9,333 total observations
Heat stress most frequently occurs during the months of July (32 percent), June (27
percent), and May (13 percent). Figure 4 provides a pie chart that displays the percentage for
every heat related month of loss. The month of loss for 1 percent of the heat shares were not
reported. These findings indicate that nearly three-fourths of heat related loss takes place during
the most frequent months of loss. If August is included, 84 percent of all heat related loss takes
place during the hottest months of the growth cycle. It is clear that heat stress has much less
variability in timing than frost/freeze and drought. Heat does show a similar timing of loss to that
of drought, and as Mittler (2006) suggested, it is common for hot and dry conditions to occur
simultaneously. Periods of drought can be induced by extended periods of heat, and periods of
heat can intensify already occurring drought conditions.

11
Figure 4. Heat Months of Loss for Insured Crops in the U.S. Pacific Northwest for the
Years 1989-2015
Note: 6,843 total observations
Major Insured Crops in the U.S. Pacific Northwest
For this analysis, major crops in the PNW are identified as the crops that report losses
most frequently for the years 1989-2014. Unlike the primary causes and timing of loss analysis,
the year 2015 is excluded for major crops because the first year of the Whole-Farm Revenue
Protection program does not provide crop specific information for crops that may have been
insured under crop-specific insurance policies in the past. In the PNW there are 45,003
observations on the reported causes of loss for insured crops for the years 1989-2014. The five
major crops that most frequently experience loss were wheat (35 percent), barley (9 percent),
cherries (5 percent), dry peas (4 percent), and apples (4 percent). Appendix A provides a pie
chart that displays the percentage for the five major crops that most frequently experience loss.

12
The five major crops make up 57 percent of total shares, with all other crops accounting for the
remaining 43 percent. Thus, the five major crops that we identify account for the majority of the
causes of loss for insured crops in the PNW.
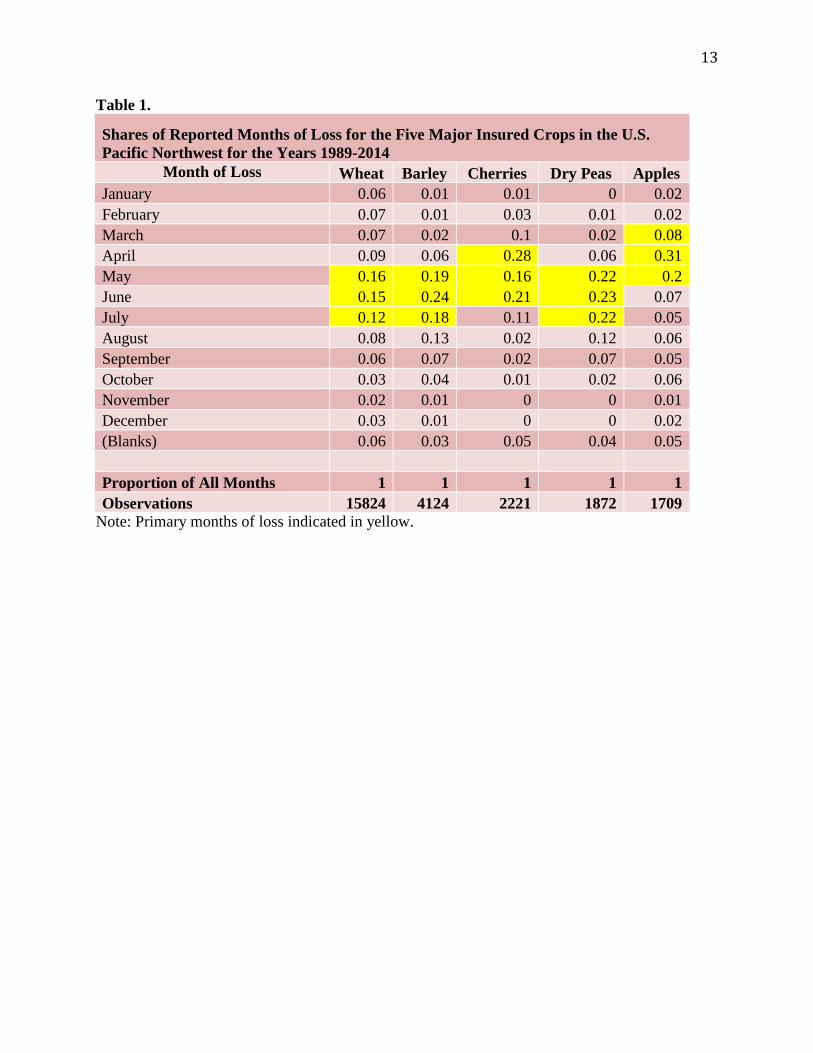
Months of Loss for the Major Crops in the U.S. Pacific Northwest
The primary months of loss for the five major crops are dependent on the type of crop.
Table 1 displays the shares of reported months of loss for each crop. The three field crops
(wheat, barley, and dry peas) most frequently experience loss during May, June, and July. These
three months are the same primary months of loss that we found for drought and heat stress.
Table 2 shows that all three field crops’ most frequent causes of loss include both drought and
heat. This suggests that field crops experience most frequent losses from drought and heat during
May, June, and July. One difference for wheat from the other two field crops is that there appears
to be greater variation in the timing of loss. The frequency of loss for wheat is more dispersed
throughout the year, which suggests that winter wheat and spring wheat are grown in the PNW,
while losses for barley and dry peas are tightly centered around the month of June. The two
perennial crops (cherries and apples) most frequently experience loss from March-June. These
months are the same primary months of loss that we found for frost/freeze. Table 2 indicates that
the primary cause of loss for both perennial crops is frost/freeze. This suggests that perennial
crops experience losses most frequently from frost/freeze in March-June. Brotak (2014) states
that frost/freeze damage crops when the internal waters within the plant freeze. This can be a
common occurrence for spring blossoming perennial crops since their fruit buds are delicate and
highly susceptible to climate variation.
13
Table 1.
Shares of Reported Months of Loss for the Five Major Insured Crops in the U.S.
Pacific Northwest for the Years 1989-2014
Month of Loss Wheat Barley Cherries Dry Peas Apples
January 0.06 0.01 0.01 0 0.02
February 0.07 0.01 0.03 0.01 0.02
March 0.07 0.02 0.1 0.02 0.08
April 0.09 0.06 0.28 0.06 0.31
May 0.16 0.19 0.16 0.22 0.2
June 0.15 0.24 0.21 0.23 0.07
July 0.12 0.18 0.11 0.22 0.05
August 0.08 0.13 0.02 0.12 0.06
September 0.06 0.07 0.02 0.07 0.05
October 0.03 0.04 0.01 0.02 0.06
November 0.02 0.01 0 0 0.01
December 0.03 0.01 0 0 0.02
(Blanks) 0.06 0.03 0.05 0.04 0.05
Proportion of All Months 1 1 1 1 1
Observations 15824 4124 2221 1872 1709
Note: Primary months of loss indicated in yellow.

14
Table 2.
Shares of Reported Causes of Loss for the Five Major Insured Crops in the U.S. Pacific
Northwest for the Years 1989-2014
Cause of Loss
Apples Barley Dry Peas Wheat Cherries
Freeze/Frost 0.5 0.15 0.05 0.16 0.38
Drought 0 0.3 0.19 0.27 0
Heat/Excess Sun/Hot Wind 0.06 0.18 0.2 0.12 0.04
Excess Moisture/Precipitation/Rain 0.01 0.1 0.2 0.07 0.18
Cold Wet Weather 0.09 0.04 0.11 0.08 0.13
Hail 0.16 0.08 0.1 0.04 0.04
Cold Winter 0.02 0.01 0.02 0.09 0.01
Decline in Price 0 0.03 0.04 0.06 0.1
Wind/Excess Wind 0.07 0.02 0.03 0.03 0.05
Failure Irrigation Equip/Supply 0 0.04 0 0.02 0
Plant Disease 0 0 0.03 0.02 0.01
Other (Snow, Lightning, Etc.) 0.02 0.01 0.01 0.02 0.04
Insects 0 0.02 0.01 0.01 0
Wildlife 0 0.01 0.01 0.01 0.02
Flood 0 0 0 0.01 0
Fruit Set Failure 0.06 0 0 0 0
Area Plan Crops Only 0 0 0 0 0
Fire 0 0 0 0 0
(Blanks) 0 0 0 0 0
Cyclone 0 0 0 0 0
Poor Drainage 0 0 0 0 0
Hurricane/Tropical Depression 0 0 0 0 0
Earthquake 0 0 0 0 0
Volcanic Eruption 0 0 0 0 0
Proportion of All Causes 1 1 1 1 1
Observations 1709 4124 1872 15824 2221
Note: Primary causes of loss indicated in yellow.
U.S. Pacific Northwest and the U.S. West Coast
A comparison of the largest major crop (wheat) by frequency of loss in the PNW to
previous research by Olen and Wu (2014) suggests that there are many similarities between
causes of loss for wheat in the PNW and the West Coast. Appendix B displays a table identical
to the one constructed by Olen and Wu (2014). Extreme climate events in the PNW consist of 88

15
percent of all reported causes of loss and 87 percent in the West Coast. Natural disasters that led
to wheat crop damage made up only 2 percent in the PNW and 3 percent in the West Coast.
Economic factors that led to wheat crop damage made up 7 percent in the PNW and 5 percent in
the West Coast. All abiotic factors contributing to wheat crop damage consist of 97 percent and
96 percent respectively. Biotic factors that led to wheat crop damage made up 3 percent of loss in
the PNW and 4 percent in the West Coast. The similarities between the findings in this research
and that by Olen and Wu (2014) suggest that both PNW wheat and West Coast wheat experience
comparable climate risks. It is important to note that Oregon and Washington are included in the
PNW and West Coast, so the differences will mainly be driven by differences between California
and Idaho.
Discussion
Over half of the reported causes of loss in the PNW for the years 1989-2015 are
attributed to three distinct climate events: frost/freeze, drought, and heat. An understanding of
the primary risks that producers face in the region encourages farmers to make efficient choices
throughout the agricultural process. Producers must know the most frequent timing of loss if they
are to take the necessary steps to reduce risk. Frost/freeze damage can be reduced in perennial
crops through better anticipation of weather variations. The primary months of loss attributed to
frost/freeze damage in the PNW are during the spring. Producers who have encountered
frost/freeze loss in the past should understand the dangers of early blossoming during unusually
warm springs. Producers can also change their irrigation practices during the primary months off
loss for frost/freeze to combat risk. Different methods of irrigation will mitigate frost/freeze
damage in both annual and perennial crops. My analysis of historical loss data has revealed that
the spring freeze season is of higher risk to crops than the fall freeze season. Farmers can choose

16
to make economically efficient decisions based on the anticipation of risk during both those
periods. The goal for producers is to maximize profit, which may include developing an accurate
and comprehensive plan to address frost/freeze risk.
This research can provide insights into future weather predictions by centering the focus
onto causes of loss that are most frequent in the PNW. Producers that are exposed to drought and
heat risk will rely on researchers to assess future risk from historical loss data. Since the primary
months for drought and heat take place during the summer season, risk can be anticipated from
previous years’ causes of loss. Any trends that show losses attributed to excessive precipitation
can forecast reduced chances of drought. If researchers are able to recognize potential drought
conditions before exposure, they can educate producers on the possible risks going forward. If a
researcher expects consecutive years of drought conditions continuing, or even intensifying, they
can make suggestions for full-scale changes before crops go into the ground. A farmer’s decision
to plant drought-tolerant crops will reduce the risk of loss during such conditions. Risk reduction
would benefit the producer through lower insurance premiums and the opportunity for greater
coverage because of lower costs. Heat risk can be mitigated in a similar way to drought. Planting
heat-tolerant crops during hot summers will reduce the risk of loss ultimately reducing cost.
Farmers can change irrigation practices to cope with extended periods of heat. Historical loss
data will help researchers analyze and anticipate potential climate variations before losses for the
producers take place.
Insurers have an incentive to understand the historical loss data in the PNW as well. They
can improve rates based on future models of risk developed from previously reported causes of
loss. Premium rates and subsidies will be based on the level of risk that they anticipate producers
will face. If farmers do not take action against moral hazard, then insurers and policymakers can

17
push the costs onto them through higher premium rates and lower subsidies since they failed to
protect against risk. High-risk producers should not be the only ones able to obtain insurance.
High premium rates have priced lower income producers and lower risk producers with low
willingness-to-pay out of the market in the past, so it is necessary for insurers to balance risk.
Adverse selection has been an unintended consequence of poorly designed programs. Modern
insurance portfolios developed from historical loss data can balance risk by offering plans based
on the anticipated level of risk participants in the region face. These portfolios will keep costs
low by implementing insurance policies built around the chances for specific perils. Insurers can
also develop regional based insurance that groups producers by crop type. Indemnity payments
would be issued whenever revenue or yields in a region fall below a target point. Overall,
insurance providers will have a better understanding of the types of crop insurance consumers
demand based on the most frequent causes of loss.
Conclusion
The U.S. Pacific Northwest is no stranger to climate variations that impact agricultural
production year round. We can gain a wealth of knowledge about the climate risks in the PNW
by examining historical yield loss from the Cause of Loss data provided by the USDA Risk
Management Agency, the agency that administers the federal crop insurance program. This
database provides reported cause of yield loss and month of loss for all insured crops for the
years 1989-2015. This research paper examines the causes and timing of loss for insured crops in
the PNW. The data analysis in this paper provides information on the overall causes of loss and
month of loss in the PNW, the primary causes of loss and month of loss for those causes, as well
as the causes of loss for major crops (wheat, barley, cherries, dry peas, and apples). I find that the
primary causes of loss in the PNW are frost/freeze, drought, and heat, and these losses occur

18
most frequently during the spring and summer seasons. I find that field crops are most
susceptible to drought and heat during the summer and perennial crops are most susceptible to
late spring freezes. An examination of this data can provide insights about development of the
federal crop insurance program, provide insights about the value of better weather predictions,
and can be an input for modeling future causes of loss for insured crops in the PNW. As climate
risks continue to change, it is important for policy to evolve in order to provide security from
risk.
Future research could correlate ENSO patterns with the causes and timing of loss for
insured crops in the PNW. This would reveal the variation in causes of loss with the changes in
El Nino and La Nina events. It would also be beneficial to look into the spatial and temporal
variations in the PNW to examine the location for each cause of loss takes within the region.

19
References
Adams, R., Chen, C., Mccarl, B., & Weiher, R. (1999). The economic consequences of ENSO events
for agriculture. Climate Research, 13, 165-172.
Brotak, E. (2014). The Big Freeze: Frost's Costly Impact on Agriculture. Weatherwise, 67(1), 30-35.
Cai, W., Borlace, S., Lengaigne, M., Rensch, P. V., Collins, M., Vecchi, G., Timmermann A.,
Santoso, A., Mcphaden, M., Wu, L., England, M., Wang, G., Guilyardi, E., Jin, F. (2014).
Increasing frequency of extreme El Niño events due to greenhouse warming. Nature Climate
Change, 4(2), 111-116.
Mittler, R. (2006, January). Abiotic stress, the field environment and stress combination. Trends in
Plant Science, 11(1), 15-19.
O’Donoghue, E. J. (2014). The Effects of Premium Subsidies on Demand for Crop Insurance
(Economic Research Report No. 169). United States Department of Agriculture, Economic
Research Service.
Olen, B., Daly, C., Halbleib, M., & Wu, J. (2015). What are the Major Climate Risks for Agriculture
in the U.S. Pacific Northwest? OreCal Publications, (OreCal Issues Brief No. 014).
Olen, B., & Wu, J. (2014). How do Extreme Climate Events Affect Specialty Crops and Irrigation
Management? OreCal Publications, (OreCal Issues Brief No. 012).
Rain and Hail Insurance Society. (2015). 2015 Crop Insurance Update (Crop insurance program
success reference).
Sherrick, B. J., Barry, P. J., Ellinger, P. N., & Schnitkey, G. D. (2004). Factors Influencing Farmers’
Crop Insurance Decisions. American Journal of Agricultural Economics, 86(1), 103–114.

20
Appendix A
Major Insured Crops Experiencing Loss in the U.S. Pacific Northwest for the Years 1989-
2014
Note: 45,003 total observations

21
Appendix B
Shares of Reported Causes of Loss for Wheat in the U.S. Pacific Northwest and the U.S.
West Coast
Cause of loss PNW West Coast
Abiotic Factors
Cold Wet Weather 0.08 0.07
Cold Winter 0.09 0.06
Drought 0.27 0.33
Excess Moisture/Precip/Rain 0.07 0.11
Frost/Freeze 0.16 0.15
Hail 0.04 0.02
Heat/Excess Sun/Hot Wind 0.12 0.1
Wind/Excess Wind 0.03 0.02
Other 0.02 0.02
All Extreme Climate Events 0.88 0.87
Flood 0.01 0.01
Other 0.01 0.02
All Natural Disasters 0.02 0.03
Area Plan Crops Only 0 0
Decline in Price 0.06 0.04
Failure in Irrig. Supply 0.02 0.01
Other 0 0
All Economic Factors 0.07 0.05
All Abiotic Factors 0.97 0.96
Biotic Factors
Insects 0.01 0.01
Plant Disease 0.02 0.03
Other 0.01 0.01
All Biotic Factors 0.03 0.04
Proportion of All Causes 1 1
Observations 158242 9001
3
2 USDA Risk Management Agency’s COL Data for the PNW from 1989-2014. 3 USDA Risk Management Agency’s COL Data for the U.S. West Coast from 1989 2012.