what consumers want from mobile communications in the united
TRANSCRIPT
September 2009
© Reuters/Lucas Jackson
What Consumers Want From Mobile
Communications in the United States, United Kingdom, Spain, and Japan
Darrell M. West
E X E C U T I V E S U M M A R Y
he thewa
United States has come a long way in its communications network since Advanced Research Projects Agency Network, known as ARPANET, s developed in 1969. Designed to link four scientific labs for interoffice
communications, that network has given rise to personal computers, the Internet, high-speed broadband, and mobile devices. Using these digital platforms, new applications for economic development, communications, education, health information technology, and smart energy grids are emerging with the goal of connecting people, businesses, and governments.
T
This burst of innovation has created new marketplace opportunities and challenges. In the American Recovery and Reinvestment Act of 2009, Congress charged the Federal Communications Commission with developing a national broadband policy by February 17, 2010. Legislators asked the commission to outline policies that would be efficient, effective, and affordable, and that would advance the public interest in “consumer welfare, civic participation, public safety and homeland security, community development, health care delivery, energy independence and efficiency, education, worker training, private sector investment, entrepreneurial activity, job creation and economic growth, and other national purposes.”
Our national leaders are devoting special attention to broadband policy because it is vital to our nation’s infrastructure and long-term economic development. Similar to highways, bridges, and dams, communications represent an infrastructure issue that makes it possible for businesses to stay connected, innovate, and create jobs. Just as we need a strong interstate highway system and viable mass transit, we require accessible and affordable broadband so that businesses and consumers can reap the benefits of wireless technology.
In this report, we focus on a key part of broadband policy, i.e., how consumers feel about cell phones and other mobile devices. Consumer sentiments are crucial for telecommunications. The way in which cell phone users see their devices affects how they employ them and what future possibilities they are willing to entertain. Specifically, we look at what people like and don’t like regarding their current communications experiences. We present data on how many people use smart phones and download applications to their mobile devices, what applications they see as important, what frustrations they feel regarding telecommunications access, and what changes they would like to see in the future.
Our project is explicitly comparative in that it investigates attitudes in four different countries (the United States, United Kingdom, Spain, and Japan). These nations represent a diversity of countries in terms of geographic location, political and economic development, regulatory regimes, and broadband policies. By evaluating how consumers feel in places with different characteristics, we see how government policies affect consumer behavior and how policy changes might affect the commercial marketplace.
Spain is a country that despite some protectionism has relatively open What Consumers Want From Mobile Communications in the United States, United Kingdom, Spain, and Japan
1
architecture in its telecommunications policy. It deregulated telecommunications in the 1990s and ended the monopoly previously held by Telefonica and encouraged it to expand abroad. Its national plan for research, development, and innovation has budgeted annual research and development expenditures at 1.4 percent of Gross Domestic Product, up from its previous figure of 1 percent. It devotes 2.5 percent of GDP to spending on innovation.
Japan is more closed in terms of mobile communications. It has not deregulated its telecommunications markets and does not make it easy for foreign companies to operate there. The country has not embraced smart phones to the extent of other nations. Its telecommunications network has relatively high consumer prices and low levels of cell phone innovation.
The United States and United Kingdom are intermediate systems with a blend of service providers, new technologies, and broadband policies. Each has opened its networks in certain respects, but been criticized for not going further towards telecommunications liberalization. Some consumers have moved towards smart phones, wireless access, and high-speed broadband. But there remain inequities in access based on age, income, and race.
In examining these nations, we find that consumers would like greater applications in mobile communications policies. They appreciate the freedom and flexibility to control applications on their cell phones. Greater ability in mobile communications leads to more extensive use of applications, an increased desire to control applications, and more willingness to pay for relevant applications. Indeed, CTIA the Wireless Association reported in a May 12, 2009 filing with the Federal Communications Commission that 42,000 wireless applications currently exist, and this number is expected to grow over 62,000. With the number of applications rising dramatically, this project suggests a “win/win” potential for the wireless industry. Both large and small service providers could do well under policies leading to more widespread consumer usage.
Darrell M. West is Vice President and Director of Governance Studies at the Brookings Institution.
Among the specific findings of this analysis are the following key points: 1) the United States has the highest utilization rates of the four nations for smart phones and PDAs
2) Spain is the country where consumers are most likely to see cell phones as an extension of personal computers
3) American consumers have a strong desire to choose and control their own cell phone applications
4) in each of the four countries, being able to chat and make cheap international calls on cell phones are the most popular features
5) Spain is the place where the largest percentage of consumers have downloaded cell phone applications
6) the most frequent reasons for not downloading new cell phone applications are lack of interest, cost, or not being able to do so on their cell phones
What Consumers Want From Mobile Communications in the United States, united Kingdom, Spain, and Japan
2
7) the most common frustrations with cell phones in the United States are the length of service contracts, roaming charges, cost of domestic calls, and lack of desired features
8) the willingness to pay more for new cell phone features is highest in Spain. When you give people more choices, they are willing to pay more because they see the value of their personal investment
9) Americans believe that innovation is driven by new devices made by Apple, Nokia, and Motorola, and new Internet features pioneered by Google
10) the cell phone factor they think is most important is less expensive services from mobile carriers
11) The most popular new cell phone features are games (named by 61.6 percent of Americans), local directories to locate businesses and restaurants (52.9 percent), music (49.8 percent), and chat and instant messaging (39.8 percent)
12) nearly half of Americans (48.9 percent) say they are likely to switch from phone landlines to cell phones and 48.1 percent say when that they are taking a short trip, they are more likely to take their cell phone than a laptop computer
13) 69.3 percent of Americans aged 18 to 29 years are willing to switch from landlines to cell phones as are 53.9 percent of those aged 30 to 49 years. This demonstrates how receptive the “leading generation” of young people are to mobile communications
14) nearly half of Americans earning over $25,000 say they are willing to switch from landlines to cell phones
15) the desire to choose their own cell phone applications is strong across all age, income, and racial categories. We find that 85.6 percent of Asian-Americans want to select their own applications, 76.1 percent of African-Americans do, and 73.9 percent of Hispanics would like to do this
16) young people are the most likely to have downloaded cell phone applications and to believe that having one general purpose mobile device is important to improving cell phones
17) young consumers are the most likely to have added games, music, and social networking to their cell phones
18) African-Americans are very interested in adding music to their cell phones, while Hispanics place a high value on social networking and Asian-Americans emphasize local directories
19) young people would like to add chat features to their cell phones, while Asian-Americans are interested in making cheap international calls
20) the groups most willing to pay more to control their cell phone applications are young people, African-Americans, and Asian-Americans.
What Consumers Want From Mobile Communications in the United States, united Kingdom, Spain, and Japan
3
Consumer Behavior and Attitudes in the United States, United Kingdom, Spain, and Japan
For our analysis of consumer behavior and attitudes, we rely on a Zogby International study of 3,428 mobile phone consumers in the United States, Spain, Japan, and the United Kingdom completed between December, 2008 and February, 2009. This research project included 1,800 cell phone users in the United States, 617 in Japan, 507 in the United Kingdom, and 504 in Spain. The margin of error for the U.S. survey was plus or minus 2.9 percentage points. In Spain and the United Kingdom, the margin of error was plus or minus 4.5 percent. In Japan, the margin of error was plus or minus 4.0 percent.
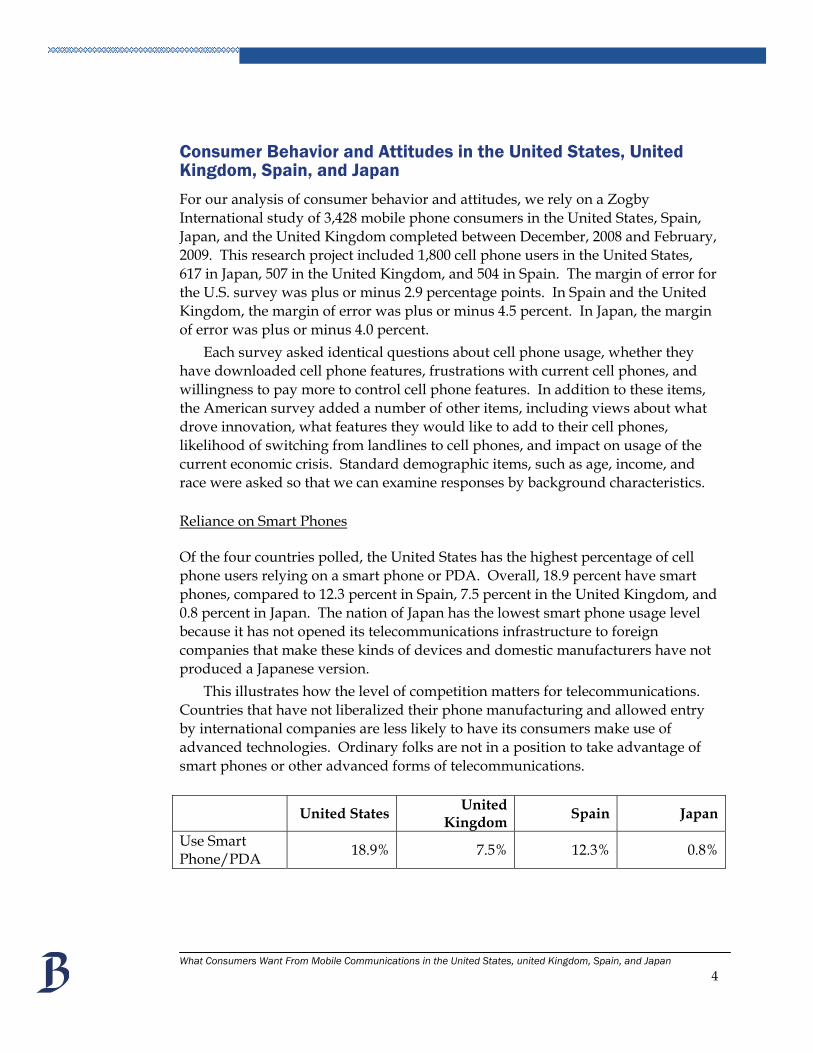
Each survey asked identical questions about cell phone usage, whether they have downloaded cell phone features, frustrations with current cell phones, and willingness to pay more to control cell phone features. In addition to these items, the American survey added a number of other items, including views about what drove innovation, what features they would like to add to their cell phones, likelihood of switching from landlines to cell phones, and impact on usage of the current economic crisis. Standard demographic items, such as age, income, and race were asked so that we can examine responses by background characteristics. Reliance on Smart Phones Of the four countries polled, the United States has the highest percentage of cell phone users relying on a smart phone or PDA. Overall, 18.9 percent have smart phones, compared to 12.3 percent in Spain, 7.5 percent in the United Kingdom, and 0.8 percent in Japan. The nation of Japan has the lowest smart phone usage level because it has not opened its telecommunications infrastructure to foreign companies that make these kinds of devices and domestic manufacturers have not produced a Japanese version.
This illustrates how the level of competition matters for telecommunications. Countries that have not liberalized their phone manufacturing and allowed entry by international companies are less likely to have its consumers make use of advanced technologies. Ordinary folks are not in a position to take advantage of smart phones or other advanced forms of telecommunications.
United States United
Kingdom Spain Japan
Use Smart Phone/PDA 18.9% 7.5% 12.3% 0.8%
What Consumers Want From Mobile Communications in the United States, united Kingdom, Spain, and Japan
4
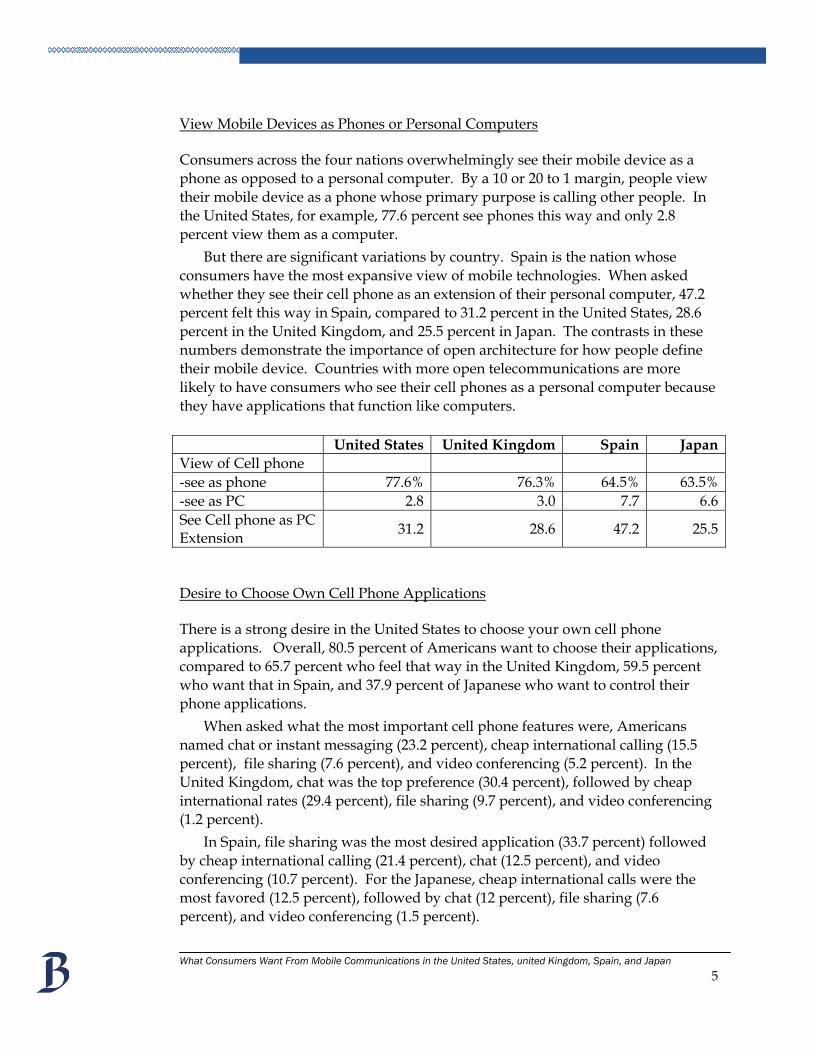
View Mobile Devices as Phones or Personal Computers Consumers across the four nations overwhelmingly see their mobile device as a phone as opposed to a personal computer. By a 10 or 20 to 1 margin, people view their mobile device as a phone whose primary purpose is calling other people. In the United States, for example, 77.6 percent see phones this way and only 2.8 percent view them as a computer.
But there are significant variations by country. Spain is the nation whose consumers have the most expansive view of mobile technologies. When asked whether they see their cell phone as an extension of their personal computer, 47.2 percent felt this way in Spain, compared to 31.2 percent in the United States, 28.6 percent in the United Kingdom, and 25.5 percent in Japan. The contrasts in these numbers demonstrate the importance of open architecture for how people define their mobile device. Countries with more open telecommunications are more likely to have consumers who see their cell phones as a personal computer because they have applications that function like computers.
United States United Kingdom Spain Japan View of Cell phone -see as phone 77.6% 76.3% 64.5% 63.5% -see as PC 2.8 3.0 7.7 6.6 See Cell phone as PC Extension 31.2 28.6 47.2 25.5
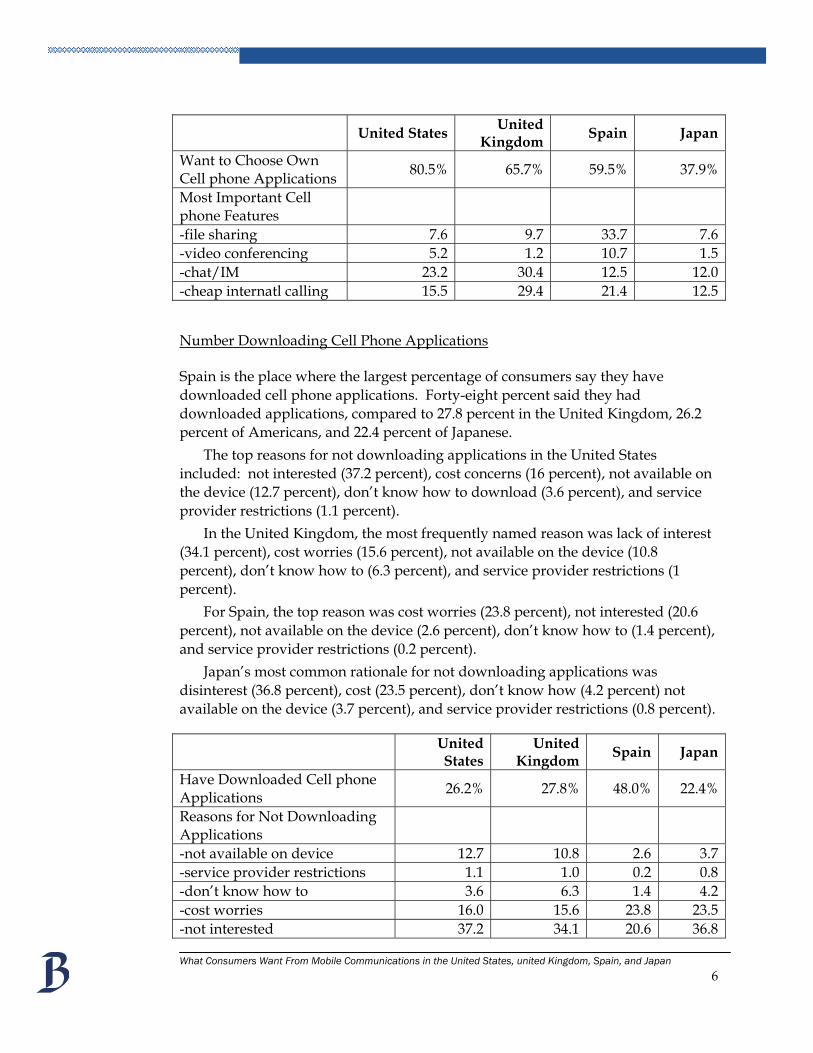
Desire to Choose Own Cell Phone Applications There is a strong desire in the United States to choose your own cell phone applications. Overall, 80.5 percent of Americans want to choose their applications, compared to 65.7 percent who feel that way in the United Kingdom, 59.5 percent who want that in Spain, and 37.9 percent of Japanese who want to control their phone applications.
When asked what the most important cell phone features were, Americans named chat or instant messaging (23.2 percent), cheap international calling (15.5 percent), file sharing (7.6 percent), and video conferencing (5.2 percent). In the United Kingdom, chat was the top preference (30.4 percent), followed by cheap international rates (29.4 percent), file sharing (9.7 percent), and video conferencing (1.2 percent).
In Spain, file sharing was the most desired application (33.7 percent) followed by cheap international calling (21.4 percent), chat (12.5 percent), and video conferencing (10.7 percent). For the Japanese, cheap international calls were the most favored (12.5 percent), followed by chat (12 percent), file sharing (7.6 percent), and video conferencing (1.5 percent).
What Consumers Want From Mobile Communications in the United States, united Kingdom, Spain, and Japan
5
United States United Kingdom Spain Japan
Want to Choose Own Cell phone Applications 80.5% 65.7% 59.5% 37.9%
Most Important Cell phone Features
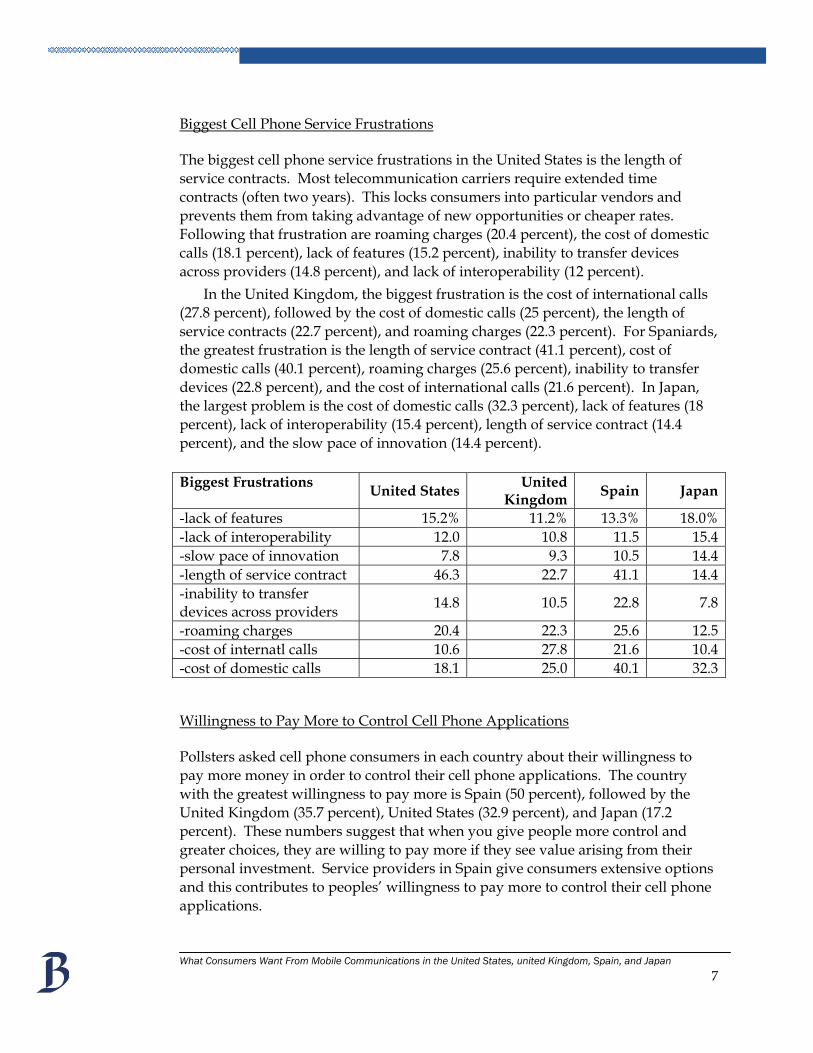
-file sharing 7.6 9.7 33.7 7.6 -video conferencing 5.2 1.2 10.7 1.5 -chat/IM 23.2 30.4 12.5 12.0 -cheap internatl calling 15.5 29.4 21.4 12.5 Number Downloading Cell Phone Applications Spain is the place where the largest percentage of consumers say they have downloaded cell phone applications. Forty-eight percent said they had downloaded applications, compared to 27.8 percent in the United Kingdom, 26.2 percent of Americans, and 22.4 percent of Japanese.
The top reasons for not downloading applications in the United States included: not interested (37.2 percent), cost concerns (16 percent), not available on the device (12.7 percent), don’t know how to download (3.6 percent), and service provider restrictions (1.1 percent).
In the United Kingdom, the most frequently named reason was lack of interest (34.1 percent), cost worries (15.6 percent), not available on the device (10.8 percent), don’t know how to (6.3 percent), and service provider restrictions (1 percent).
For Spain, the top reason was cost worries (23.8 percent), not interested (20.6 percent), not available on the device (2.6 percent), don’t know how to (1.4 percent), and service provider restrictions (0.2 percent).
Japan’s most common rationale for not downloading applications was disinterest (36.8 percent), cost (23.5 percent), don’t know how (4.2 percent) not available on the device (3.7 percent), and service provider restrictions (0.8 percent). United
States United
Kingdom Spain Japan
Have Downloaded Cell phone Applications 26.2% 27.8% 48.0% 22.4%
Reasons for Not Downloading Applications
-not available on device 12.7 10.8 2.6 3.7 -service provider restrictions 1.1 1.0 0.2 0.8 -don’t know how to 3.6 6.3 1.4 4.2 -cost worries 16.0 15.6 23.8 23.5 -not interested 37.2 34.1 20.6 36.8 What Consumers Want From Mobile Communications in the United States, united Kingdom, Spain, and Japan
6
Biggest Cell Phone Service Frustrations The biggest cell phone service frustrations in the United States is the length of service contracts. Most telecommunication carriers require extended time contracts (often two years). This locks consumers into particular vendors and prevents them from taking advantage of new opportunities or cheaper rates. Following that frustration are roaming charges (20.4 percent), the cost of domestic calls (18.1 percent), lack of features (15.2 percent), inability to transfer devices across providers (14.8 percent), and lack of interoperability (12 percent).
In the United Kingdom, the biggest frustration is the cost of international calls (27.8 percent), followed by the cost of domestic calls (25 percent), the length of service contracts (22.7 percent), and roaming charges (22.3 percent). For Spaniards, the greatest frustration is the length of service contract (41.1 percent), cost of domestic calls (40.1 percent), roaming charges (25.6 percent), inability to transfer devices (22.8 percent), and the cost of international calls (21.6 percent). In Japan, the largest problem is the cost of domestic calls (32.3 percent), lack of features (18 percent), lack of interoperability (15.4 percent), length of service contract (14.4 percent), and the slow pace of innovation (14.4 percent). Biggest Frustrations United States United
Kingdom Spain Japan
-lack of features 15.2% 11.2% 13.3% 18.0% -lack of interoperability 12.0 10.8 11.5 15.4 -slow pace of innovation 7.8 9.3 10.5 14.4 -length of service contract 46.3 22.7 41.1 14.4 -inability to transfer devices across providers 14.8 10.5 22.8 7.8
-roaming charges 20.4 22.3 25.6 12.5 -cost of internatl calls 10.6 27.8 21.6 10.4 -cost of domestic calls 18.1 25.0 40.1 32.3 Willingness to Pay More to Control Cell Phone Applications Pollsters asked cell phone consumers in each country about their willingness to pay more money in order to control their cell phone applications. The country with the greatest willingness to pay more is Spain (50 percent), followed by the United Kingdom (35.7 percent), United States (32.9 percent), and Japan (17.2 percent). These numbers suggest that when you give people more control and greater choices, they are willing to pay more if they see value arising from their personal investment. Service providers in Spain give consumers extensive options and this contributes to peoples’ willingness to pay more to control their cell phone applications.
What Consumers Want From Mobile Communications in the United States, united Kingdom, Spain, and Japan
7
United States
United Kingdom Spain Japan
Would Pay More to Control Cell phone Applications 32.9% 35.7% 50.0% 17.2%
More Detailed Analysis of American Consumer Behavior and Attitudes
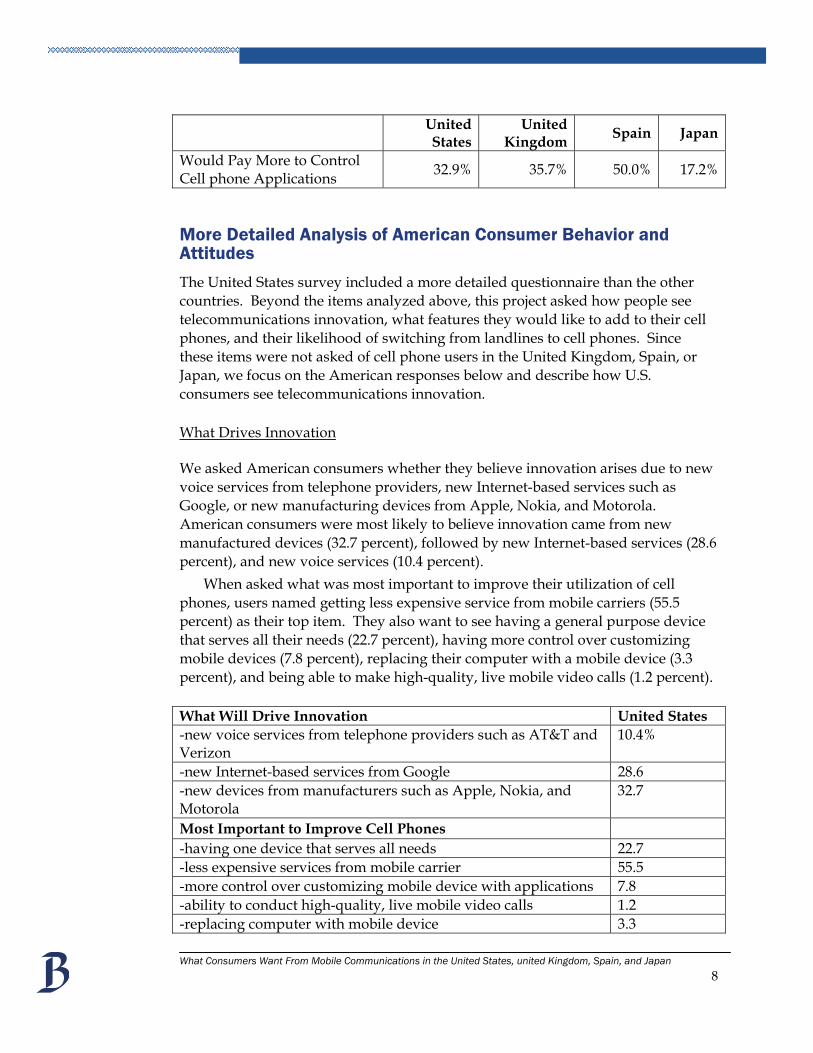
The United States survey included a more detailed questionnaire than the other countries. Beyond the items analyzed above, this project asked how people see telecommunications innovation, what features they would like to add to their cell phones, and their likelihood of switching from landlines to cell phones. Since these items were not asked of cell phone users in the United Kingdom, Spain, or Japan, we focus on the American responses below and describe how U.S. consumers see telecommunications innovation. What Drives Innovation We asked American consumers whether they believe innovation arises due to new voice services from telephone providers, new Internet-based services such as Google, or new manufacturing devices from Apple, Nokia, and Motorola. American consumers were most likely to believe innovation came from new manufactured devices (32.7 percent), followed by new Internet-based services (28.6 percent), and new voice services (10.4 percent).
When asked what was most important to improve their utilization of cell phones, users named getting less expensive service from mobile carriers (55.5 percent) as their top item. They also want to see having a general purpose device that serves all their needs (22.7 percent), having more control over customizing mobile devices (7.8 percent), replacing their computer with a mobile device (3.3 percent), and being able to make high-quality, live mobile video calls (1.2 percent). What Will Drive Innovation United States -new voice services from telephone providers such as AT&T and Verizon
10.4%
-new Internet-based services from Google 28.6 -new devices from manufacturers such as Apple, Nokia, and Motorola
32.7
Most Important to Improve Cell Phones -having one device that serves all needs 22.7 -less expensive services from mobile carrier 55.5 -more control over customizing mobile device with applications 7.8 -ability to conduct high-quality, live mobile video calls 1.2 -replacing computer with mobile device 3.3 What Consumers Want From Mobile Communications in the United States, united Kingdom, Spain, and Japan
8
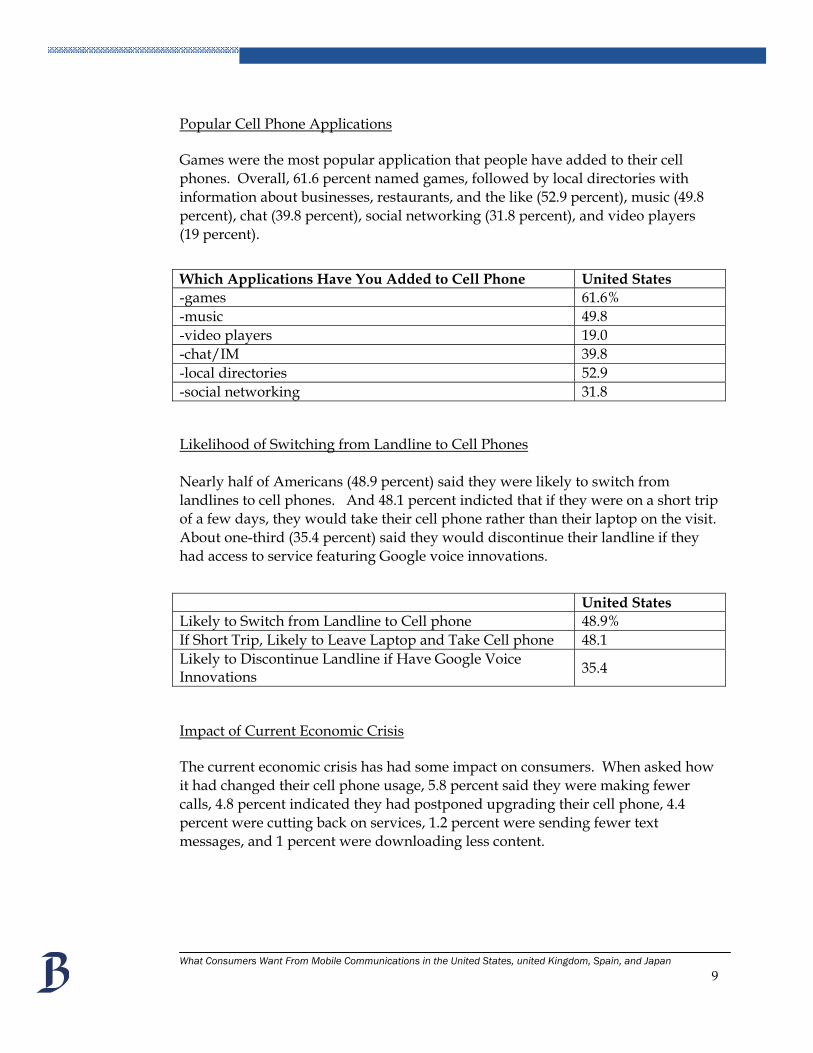
Popular Cell Phone Applications Games were the most popular application that people have added to their cell phones. Overall, 61.6 percent named games, followed by local directories with information about businesses, restaurants, and the like (52.9 percent), music (49.8 percent), chat (39.8 percent), social networking (31.8 percent), and video players (19 percent). Which Applications Have You Added to Cell Phone United States -games 61.6% -music 49.8 -video players 19.0 -chat/IM 39.8 -local directories 52.9 -social networking 31.8 Likelihood of Switching from Landline to Cell Phones Nearly half of Americans (48.9 percent) said they were likely to switch from landlines to cell phones. And 48.1 percent indicted that if they were on a short trip of a few days, they would take their cell phone rather than their laptop on the visit. About one-third (35.4 percent) said they would discontinue their landline if they had access to service featuring Google voice innovations.
United States Likely to Switch from Landline to Cell phone 48.9% If Short Trip, Likely to Leave Laptop and Take Cell phone 48.1 Likely to Discontinue Landline if Have Google Voice Innovations 35.4
Impact of Current Economic Crisis The current economic crisis has had some impact on consumers. When asked how it had changed their cell phone usage, 5.8 percent said they were making fewer calls, 4.8 percent indicated they had postponed upgrading their cell phone, 4.4 percent were cutting back on services, 1.2 percent were sending fewer text messages, and 1 percent were downloading less content.
What Consumers Want From Mobile Communications in the United States, united Kingdom, Spain, and Japan
9
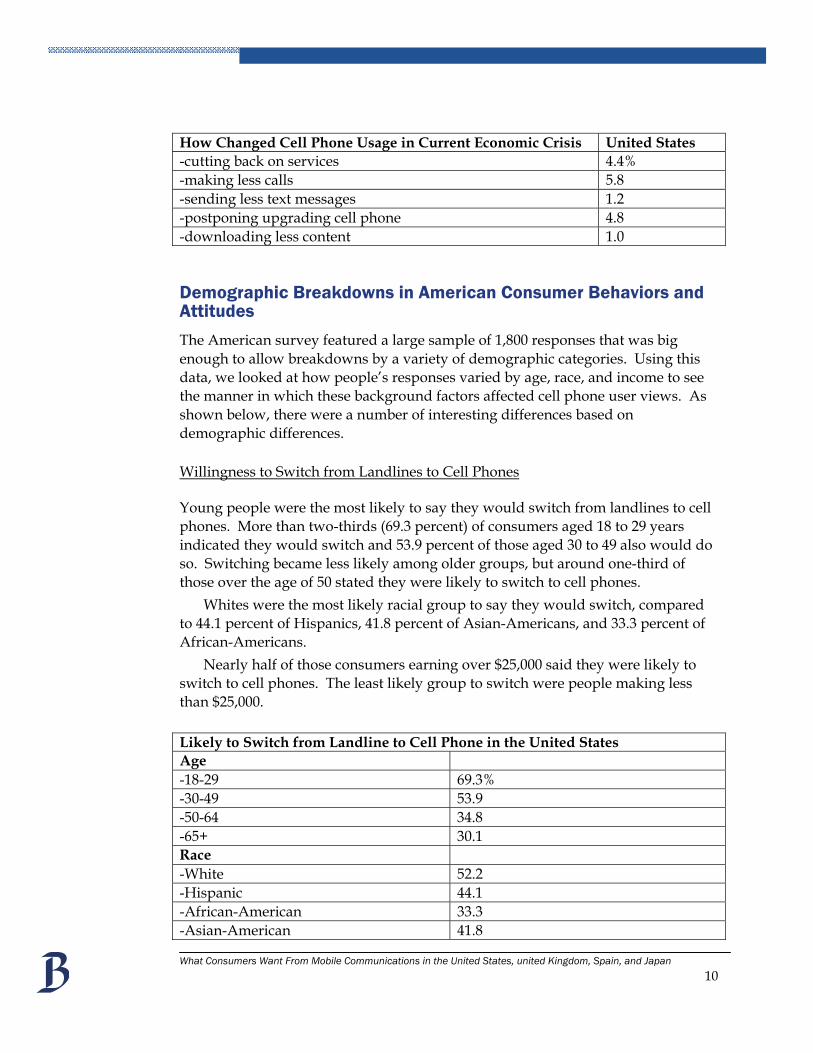
How Changed Cell Phone Usage in Current Economic Crisis United States -cutting back on services 4.4% -making less calls 5.8 -sending less text messages 1.2 -postponing upgrading cell phone 4.8 -downloading less content 1.0
Demographic Breakdowns in American Consumer Behaviors and Attitudes
The American survey featured a large sample of 1,800 responses that was big enough to allow breakdowns by a variety of demographic categories. Using this data, we looked at how people’s responses varied by age, race, and income to see the manner in which these background factors affected cell phone user views. As shown below, there were a number of interesting differences based on demographic differences. Willingness to Switch from Landlines to Cell Phones Young people were the most likely to say they would switch from landlines to cell phones. More than two-thirds (69.3 percent) of consumers aged 18 to 29 years indicated they would switch and 53.9 percent of those aged 30 to 49 also would do so. Switching became less likely among older groups, but around one-third of those over the age of 50 stated they were likely to switch to cell phones.
Whites were the most likely racial group to say they would switch, compared to 44.1 percent of Hispanics, 41.8 percent of Asian-Americans, and 33.3 percent of African-Americans.
Nearly half of those consumers earning over $25,000 said they were likely to switch to cell phones. The least likely group to switch were people making less than $25,000. Likely to Switch from Landline to Cell Phone in the United States Age -18-29 69.3% -30-49 53.9 -50-64 34.8 -65+ 30.1 Race -White 52.2 -Hispanic 44.1 -African-American 33.3 -Asian-American 41.8 What Consumers Want From Mobile Communications in the United States, united Kingdom, Spain, and Japan
10
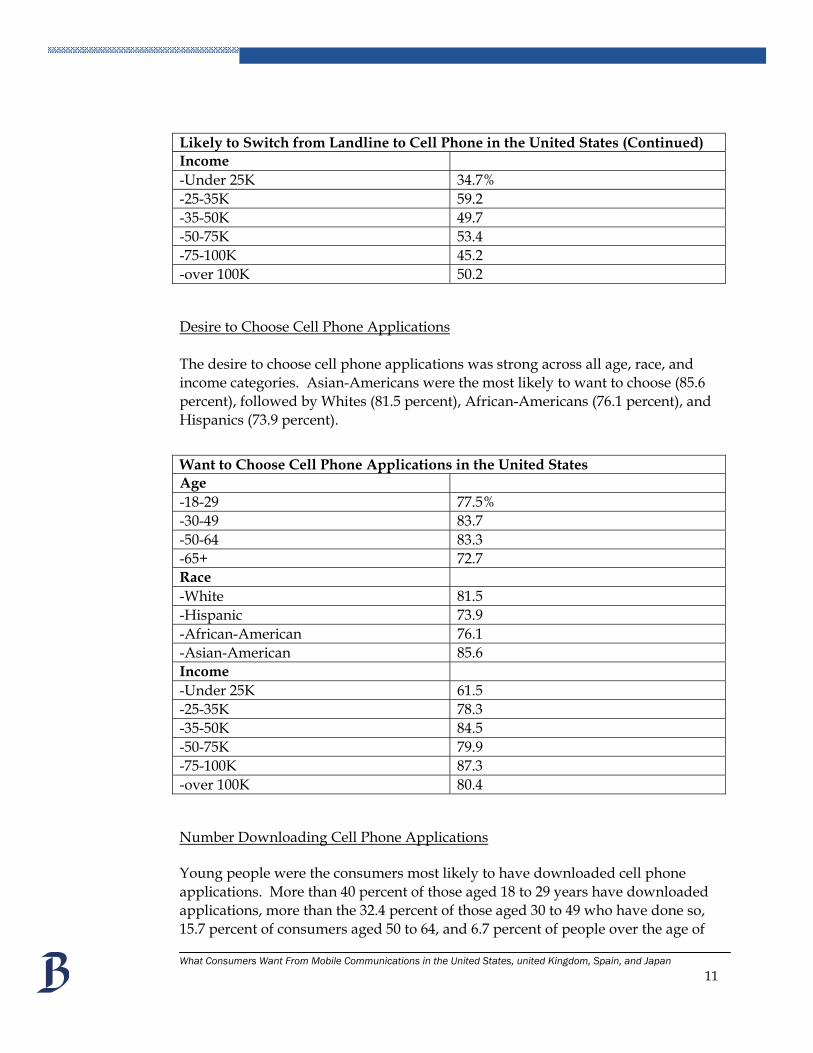
Likely to Switch from Landline to Cell Phone in the United States (Continued) Income -Under 25K 34.7% -25-35K 59.2 -35-50K 49.7 -50-75K 53.4 -75-100K 45.2 -over 100K 50.2 Desire to Choose Cell Phone Applications The desire to choose cell phone applications was strong across all age, race, and income categories. Asian-Americans were the most likely to want to choose (85.6 percent), followed by Whites (81.5 percent), African-Americans (76.1 percent), and Hispanics (73.9 percent).
Want to Choose Cell Phone Applications in the United States Age -18-29 77.5% -30-49 83.7 -50-64 83.3 -65+ 72.7 Race -White 81.5 -Hispanic 73.9 -African-American 76.1 -Asian-American 85.6 Income -Under 25K 61.5 -25-35K 78.3 -35-50K 84.5 -50-75K 79.9 -75-100K 87.3 -over 100K 80.4 Number Downloading Cell Phone Applications Young people were the consumers most likely to have downloaded cell phone applications. More than 40 percent of those aged 18 to 29 years have downloaded applications, more than the 32.4 percent of those aged 30 to 49 who have done so, 15.7 percent of consumers aged 50 to 64, and 6.7 percent of people over the age of What Consumers Want From Mobile Communications in the United States, united Kingdom, Spain, and Japan
11
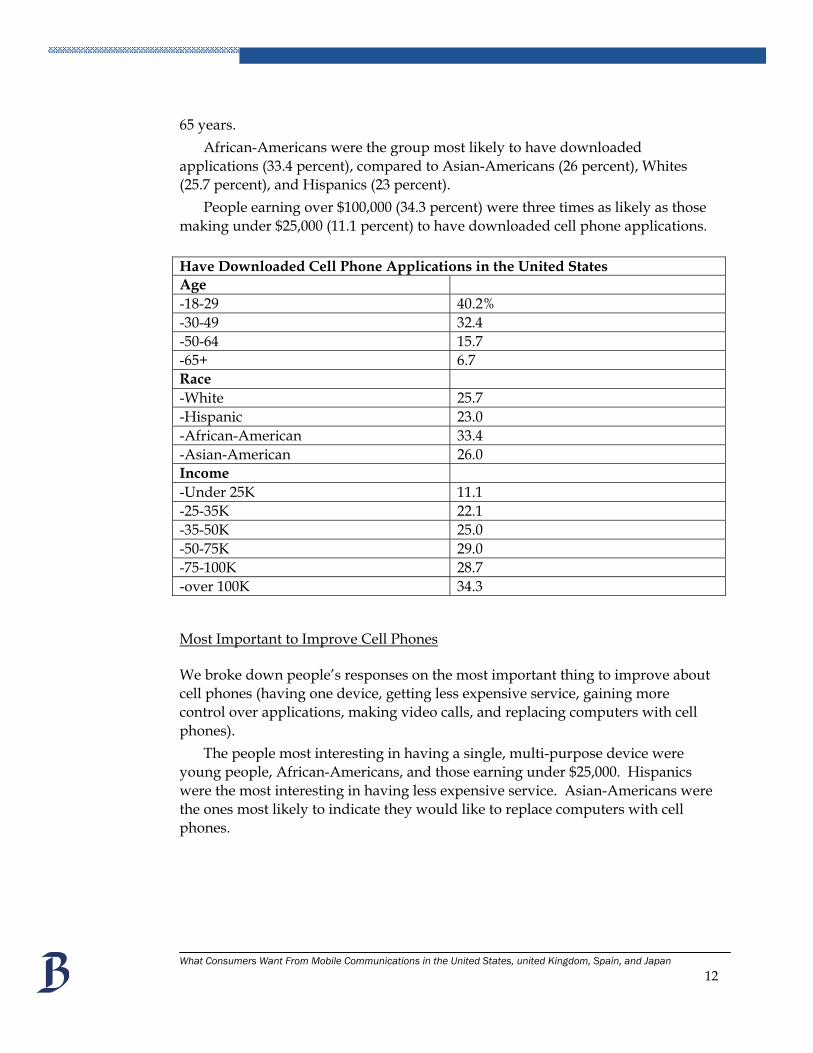
65 years. African-Americans were the group most likely to have downloaded
applications (33.4 percent), compared to Asian-Americans (26 percent), Whites (25.7 percent), and Hispanics (23 percent).
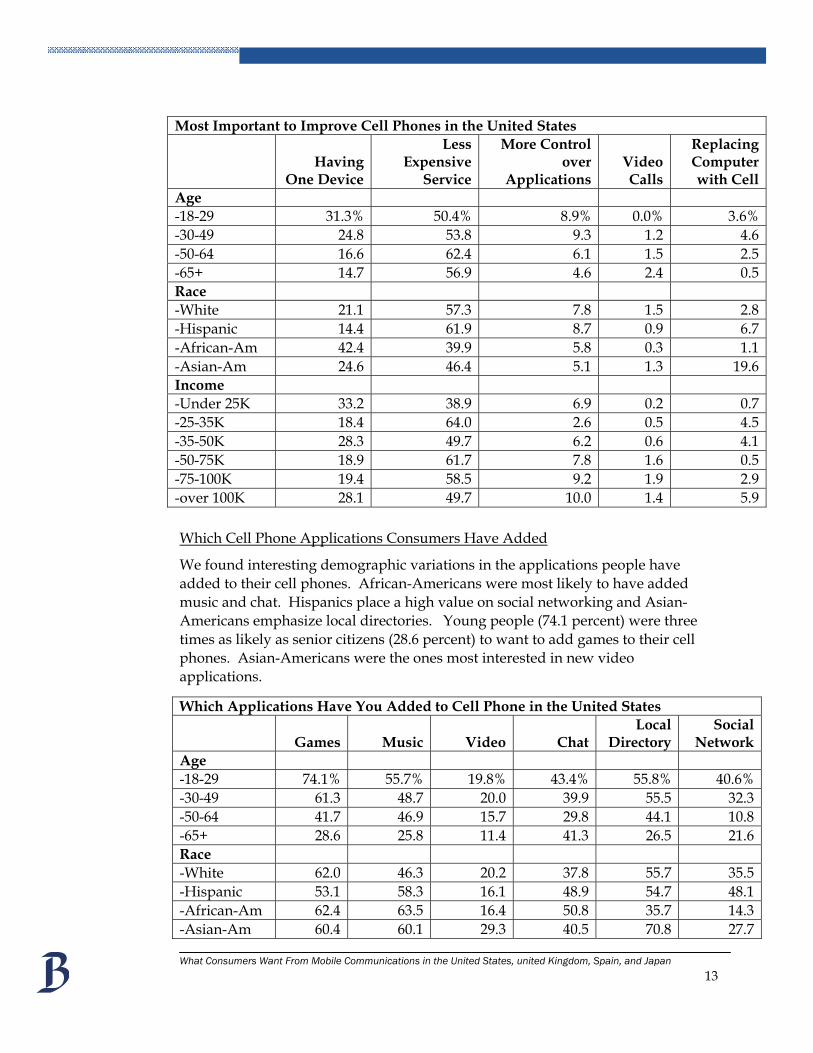
People earning over $100,000 (34.3 percent) were three times as likely as those making under $25,000 (11.1 percent) to have downloaded cell phone applications. Have Downloaded Cell Phone Applications in the United States Age -18-29 40.2% -30-49 32.4 -50-64 15.7 -65+ 6.7 Race -White 25.7 -Hispanic 23.0 -African-American 33.4 -Asian-American 26.0 Income -Under 25K 11.1 -25-35K 22.1 -35-50K 25.0 -50-75K 29.0 -75-100K 28.7 -over 100K 34.3 Most Important to Improve Cell Phones We broke down people’s responses on the most important thing to improve about cell phones (having one device, getting less expensive service, gaining more control over applications, making video calls, and replacing computers with cell phones).
The people most interesting in having a single, multi-purpose device were young people, African-Americans, and those earning under $25,000. Hispanics were the most interesting in having less expensive service. Asian-Americans were the ones most likely to indicate they would like to replace computers with cell phones.
What Consumers Want From Mobile Communications in the United States, united Kingdom, Spain, and Japan
12
Most Important to Improve Cell Phones in the United States
Having One Device
Less Expensive
Service
More Control over
Applications Video Calls
Replacing Computer with Cell
Age -18-29 31.3% 50.4% 8.9% 0.0% 3.6% -30-49 24.8 53.8 9.3 1.2 4.6 -50-64 16.6 62.4 6.1 1.5 2.5 -65+ 14.7 56.9 4.6 2.4 0.5 Race -White 21.1 57.3 7.8 1.5 2.8 -Hispanic 14.4 61.9 8.7 0.9 6.7 -African-Am 42.4 39.9 5.8 0.3 1.1 -Asian-Am 24.6 46.4 5.1 1.3 19.6 Income -Under 25K 33.2 38.9 6.9 0.2 0.7 -25-35K 18.4 64.0 2.6 0.5 4.5 -35-50K 28.3 49.7 6.2 0.6 4.1 -50-75K 18.9 61.7 7.8 1.6 0.5 -75-100K 19.4 58.5 9.2 1.9 2.9 -over 100K 28.1 49.7 10.0 1.4 5.9
Which Cell Phone Applications Consumers Have Added
We found interesting demographic variations in the applications people have added to their cell phones. African-Americans were most likely to have added music and chat. Hispanics place a high value on social networking and Asian-Americans emphasize local directories. Young people (74.1 percent) were three times as likely as senior citizens (28.6 percent) to want to add games to their cell phones. Asian-Americans were the ones most interested in new video applications.
Which Applications Have You Added to Cell Phone in the United States
Games Music Video Chat Local
Directory Social
Network Age -18-29 74.1% 55.7% 19.8% 43.4% 55.8% 40.6% -30-49 61.3 48.7 20.0 39.9 55.5 32.3 -50-64 41.7 46.9 15.7 29.8 44.1 10.8 -65+ 28.6 25.8 11.4 41.3 26.5 21.6 Race -White 62.0 46.3 20.2 37.8 55.7 35.5 -Hispanic 53.1 58.3 16.1 48.9 54.7 48.1 -African-Am 62.4 63.5 16.4 50.8 35.7 14.3 -Asian-Am 60.4 60.1 29.3 40.5 70.8 27.7
What Consumers Want From Mobile Communications in the United States, united Kingdom, Spain, and Japan 13
Which Applications Have You Added to Cell Phone in the United States (Continued)
Games Music Video Chat Local
Directory Social
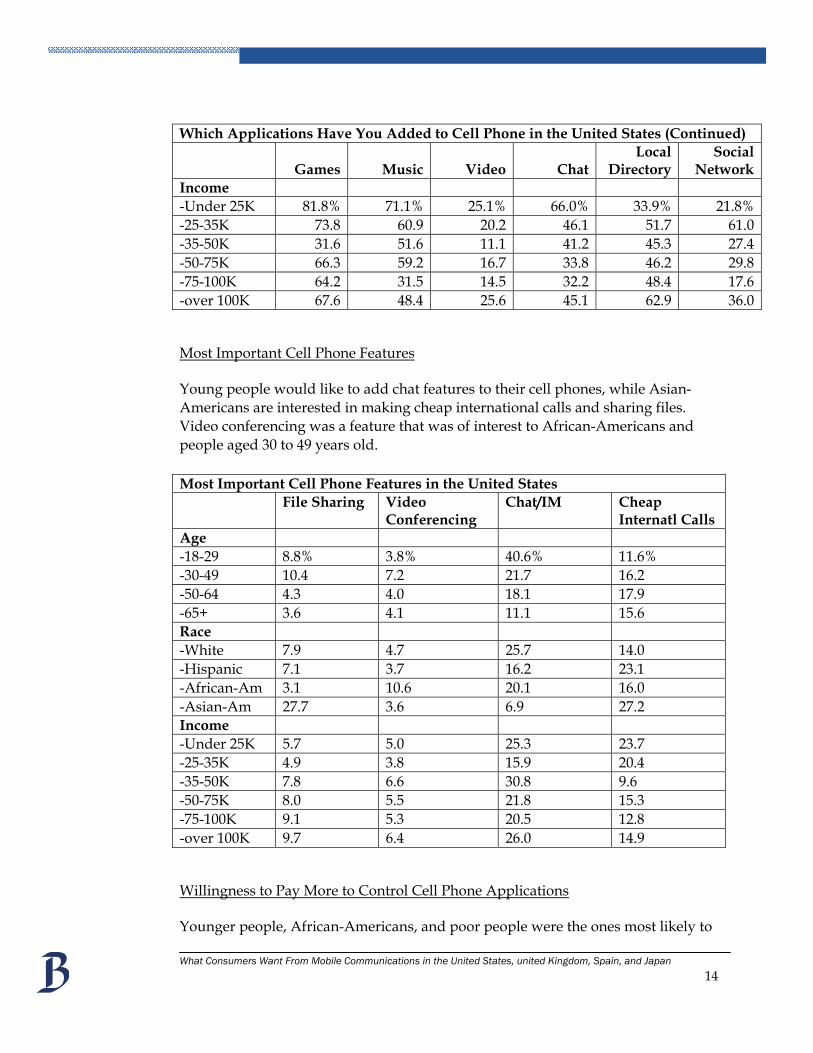
Network Income -Under 25K 81.8% 71.1% 25.1% 66.0% 33.9% 21.8% -25-35K 73.8 60.9 20.2 46.1 51.7 61.0 -35-50K 31.6 51.6 11.1 41.2 45.3 27.4 -50-75K 66.3 59.2 16.7 33.8 46.2 29.8 -75-100K 64.2 31.5 14.5 32.2 48.4 17.6 -over 100K 67.6 48.4 25.6 45.1 62.9 36.0 Most Important Cell Phone Features Young people would like to add chat features to their cell phones, while Asian-Americans are interested in making cheap international calls and sharing files. Video conferencing was a feature that was of interest to African-Americans and people aged 30 to 49 years old. Most Important Cell Phone Features in the United States File Sharing Video
Conferencing Chat/IM Cheap
Internatl Calls Age -18-29 8.8% 3.8% 40.6% 11.6% -30-49 10.4 7.2 21.7 16.2 -50-64 4.3 4.0 18.1 17.9 -65+ 3.6 4.1 11.1 15.6 Race -White 7.9 4.7 25.7 14.0 -Hispanic 7.1 3.7 16.2 23.1 -African-Am 3.1 10.6 20.1 16.0 -Asian-Am 27.7 3.6 6.9 27.2 Income -Under 25K 5.7 5.0 25.3 23.7 -25-35K 4.9 3.8 15.9 20.4 -35-50K 7.8 6.6 30.8 9.6 -50-75K 8.0 5.5 21.8 15.3 -75-100K 9.1 5.3 20.5 12.8 -over 100K 9.7 6.4 26.0 14.9 Willingness to Pay More to Control Cell Phone Applications Younger people, African-Americans, and poor people were the ones most likely to What Consumers Want From Mobile Communications in the United States, united Kingdom, Spain, and Japan
14
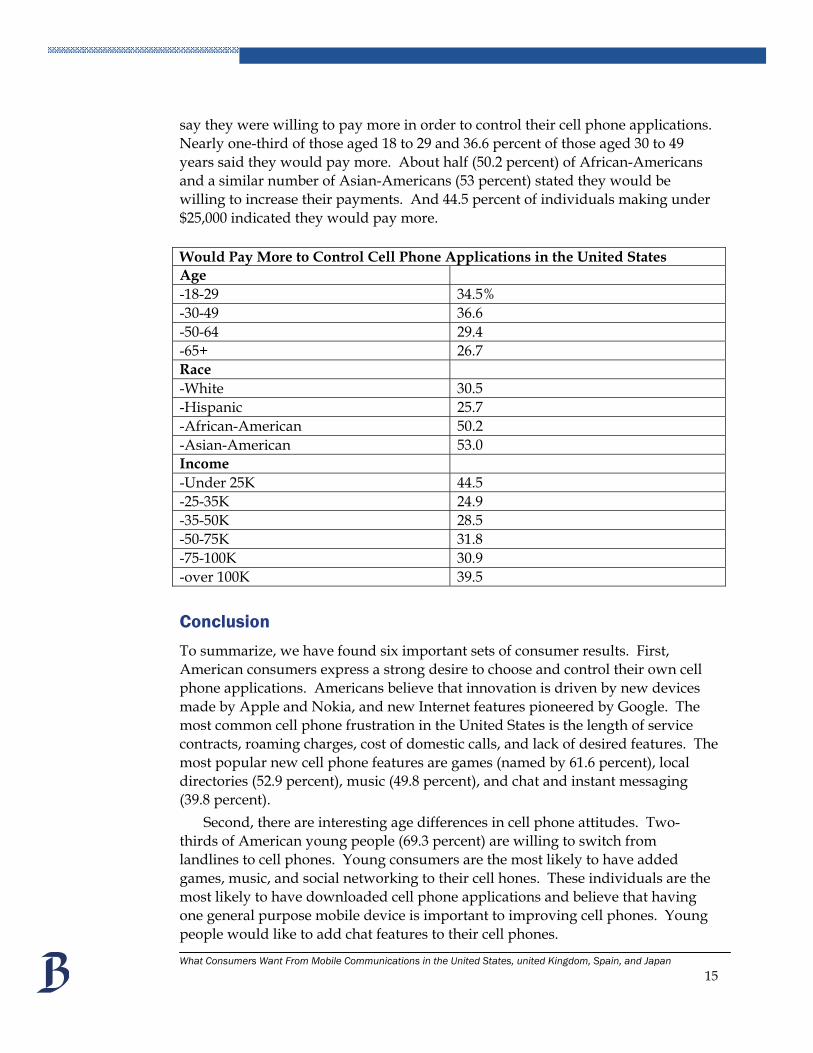
say they were willing to pay more in order to control their cell phone applications. Nearly one-third of those aged 18 to 29 and 36.6 percent of those aged 30 to 49 years said they would pay more. About half (50.2 percent) of African-Americans and a similar number of Asian-Americans (53 percent) stated they would be willing to increase their payments. And 44.5 percent of individuals making under $25,000 indicated they would pay more. Would Pay More to Control Cell Phone Applications in the United States Age -18-29 34.5% -30-49 36.6 -50-64 29.4 -65+ 26.7 Race -White 30.5 -Hispanic 25.7 -African-American 50.2 -Asian-American 53.0 Income -Under 25K 44.5 -25-35K 24.9 -35-50K 28.5 -50-75K 31.8 -75-100K 30.9 -over 100K 39.5
Conclusion
To summarize, we have found six important sets of consumer results. First, American consumers express a strong desire to choose and control their own cell phone applications. Americans believe that innovation is driven by new devices made by Apple and Nokia, and new Internet features pioneered by Google. The most common cell phone frustration in the United States is the length of service contracts, roaming charges, cost of domestic calls, and lack of desired features. The most popular new cell phone features are games (named by 61.6 percent), local directories (52.9 percent), music (49.8 percent), and chat and instant messaging (39.8 percent).
Second, there are interesting age differences in cell phone attitudes. Two-thirds of American young people (69.3 percent) are willing to switch from landlines to cell phones. Young consumers are the most likely to have added games, music, and social networking to their cell hones. These individuals are the most likely to have downloaded cell phone applications and believe that having one general purpose mobile device is important to improving cell phones. Young people would like to add chat features to their cell phones.
What Consumers Want From Mobile Communications in the United States, united Kingdom, Spain, and Japan 15
Third, we found important racial and ethnic differences. African-Americans are very interested in adding music to their cell phones, while Hispanics place a high value on social networking and Asian-Americans emphasize local directories. Asian-Americans are the group which says it is most interested in making cheap international calls.
Fourth, the groups most willing in the United States to pay more to control their cell phone applications are young people, African-Americans, and Asian-Americans.
Fifth, befitting a country that has emphasized telecommunications reform, Spain is a place where consumers are most likely of the four nations to see cell phones as an extension of personal computers and where the largest percentage of people have downloaded cell phone applications. This nation also is the location where cell phone users express the greatest willingness to pay more for new cell phone features.
Finally, in each of the four countries, being able to chat and make cheap international calls on cell phones represented the most popular features. The most frequent reasons for not downloading new cell phone applications are lack of interest, cost, or not being able to do so on their cell phones. The cell phone factor they think is most important is less expensive services from mobile carriers.
Speaking more generally, our results demonstrate the virtue of innovation for communications policy. When you give people choices, they act on those options, utilize services more often, and are willing to pay more because they see the value of their personal investment.
Data from this project suggest there are features consumers would like to add to their mobile devices. Consumers would like to have greater control over their applications and indicate they would expand their usage levels and be willing to pay more for services. Opening the networks to more applications would be win-win for businesses because the telecommunications pie would grow larger.
This finding is especially relevant in regard to the leading generation of young people. They are the age group most positive towards cell phones, most likely to have downloaded applications, and most interested in controlling their applications. Young people are the individuals most comfortable with digital technology and mobile communications. They understand the convenience of new applications and say they are willing to pay for valued features.
As America undertakes new investments in education, health information technology, and energy efficiency, it is important to have broad access to telecommunications and high-speed networks. New platforms will spur utilization and innovation, and bring additional people, businesses, and services into the digital revolution.
For example, high-speed devices will allow physicians to share digital images with colleagues in other geographic areas. Schools will be able to extend distance learning to under-served populations. Smart electric grids will produce greater
What Consumers Want From Mobile Communications in the United States, united Kingdom, Spain, and Japan
16
efficiency in monitoring energy consumption and contribute to more environment-friendly policies. Video conferencing facilities could save government and businesses large amounts of money on their travel budgets. In the telecommunications area, the old adage of “build it and they will come” seems particularly apt. Consumer survey analysis suggests that opening networks to improved applications is likely to expand demand and increase service utilization. That would be win-win for businesses both new and old.
In thinking about future policy decisions, there are several topics that warrant additional attention. First is the need for more extensive data on consumer and business practices. Right now, the Federal Communications Commission lacks detailed information on consumer and business utilization. Through its Form 477, the FCC undertakes a biannual survey of whether an area has broad Internet service broken down by zip code. However, this survey does not distinguish the number of providers or report many details on broadband speed or utilization. This lack of information hinders policymaking because it is hard to judge the current state of affairs when basic data are lacking.
There are some other sources of information. For example, the U.S. Census Bureau undertakes periodic updates on broadband utilization through its Current Population Survey. But these data collections have been completed only four times in the last decade (2000, 2001, 2003, and 2007), and therefore are not regular enough to inform policymaking.
A couple of states, such as Kentucky and North Carolina, collect more detailed data on broadband usage within their borders. They compile more specific information in terms of how people are using broadband and in what geographic areas. These states could represent a model of the kind of information that would be helpful to national policymakers.
In addition, we need to determine which openness policies make the most sense. In the communications area, there are many moving parts: consumer behavior, social background, business practices, regulatory regimes, and legislative policies. It is hard to disentangle each part to know what policy changes will lead to the greatest innovation and economic development. With more detailed data, though, it would be possible to sort out the linkages and determine which policies would have the greatest impact.
For example, it is clear from our analysis of consumer behavior data that policies have differential effects on various demographic groups. Young people are the most willing to experiment with new technologies and to want to employ more applications. Since they are the rising generation, we need to devote close attention to how a move toward openness might encourage greater utilization of networks.
Similarly, we need to think about the impact of broadband policies on the digital divide and differential impact on people of various racial, ethnic, income, and educational backgrounds. Some policies impose greater hardships on under-served areas than others. This may be due to greater utilization or different needs What Consumers Want From Mobile Communications in the United States, united Kingdom, Spain, and Japan
17
on the part of those individuals. Analysis of societal impact has to be a part of broadband decision-making, especially in terms of how decisions affect rural America and the urban core.
Comparative research helps us answer important questions. Examining countries with different regimes can provide insight into how various policy choices affect consumers and businesses, and what changes may have the most positive outcomes. In this research, for example, it was clear that Spain was the country whose consumers were most interested in downloading new applications and paying more for these applications. This suggests that openness to new applications can stimulate demand for new services and benefit service providers.
We need projects that test this possibility in the United States. If you give consumers more options, will they download new applications and be willing to pay more for those features? Ultimately, this is an empirical question, and we need data that test those kinds of innovations.
Governance Studies The Brookings Institution 1775 Massachusetts Ave., NW Washington, DC 20036 Tel: 202.797.6090 Fax: 202.797.6144 www.brookings.edu/governance.aspx Editor Christine Jacobs Production & Layout John S Seo
Email your comments to [email protected]
This paper is distributed in the expectation that it may elicit
useful comments and is subject to subsequent revision. The
views expressed in this piece are those of the author and
should not be attributed to the staff, officers or trustees of
the Brookings Institution.
What Consumers Want From Mobile Communications in the United States, united Kingdom, Spain, and Japan
18