what controls microcystis bloom in the san francisco …€¦ · california bay-delta authority...
TRANSCRIPT

What Controls Microcystis
Bloom & Toxicity in the San Francisco Estuary? (Summer/Fall 2008 & 2009)
Cécile
E. MioniUniversity of California, Santa Cruz
Email: [email protected]
Alexandrium
tamarense Alexandrium
catenella Pseudonitzschia Microcystis

AcknowledgementsUCSCPaytan
LabRob Franks & Marine Analytical LabKudela
LabSilver LabZehr
Lab**Brandon Carter ‐
MEGAMER facility**
**Pia
Moissander
& Rachel Foster**
Department of Water ResourcesPeggy LehmanEnvironmental Monitoring Program staff** Scott Waller, Gregg Schmidt, Eric Santos, Brianne Noble, Karen Gehrts
& Rich Breuer **
Funding:
Postdoctoral Fellowship California Bay-Delta Authority Agreement No. U-04-SC-005
Postdoctoral Fellowship Sacramento Regional County Sanitation District Agreement No. 93597
AwardKim Ward - California State Water Resources Control Board
USGSSF Bay Water Quality Monitoring ** Cloern Lab, Lisa Lucas**
Delta Council‐IEPAnke Mueller‐Solger
Department of Fish & GameGloria Blondina, Abdu Mekebri & Dave Crane
USCSergio Sañudo‐Wilhelmy & Doug Capone
University of Tennessee, KnoxvilleSteven Wilhelm

Outline
• Background CyanoHABs Formation and Distribution Routes of exposure Health effectsMicrocystis/Microcystins
• CyanoHABs in the San Francisco Estuary (2009) Study Area – San Francisco estuary Results
• Future strategies and Prospective work

Background –
CyanoHABs, Cyanotoxins
Courtesy: NASA

The Good…
Peter Sawyer, © The Smithsonian Institute
3.5 billion years ago…. Cyanobacteria (blue-green algae):• Oldest oxygenic phototrophs (>3.5 billion yo)
• Instrumental in the evolution of life (oxygen)
• Origin of Plants (chloroplast/endosymbiosis)
• Important in the Nitrogen Cycle (N2 fixation)
www.fossweb.com

…the bad and the ugly
• 1000 years ago – Earliest report of cyanobacteria
poisoning (soldiers) in Southern China
General Zhu Ge-Ling
• 1878 – “Poisonous Australian Lake”
(sheep poisoning, Lake Alexandrina)
George Francis. Nature. May 2, 1878
• Similar early documented mass algae poisonings
in the US in 1883, 1887, 1925.

Harmful Cyanobacteria Blooms aka CyanoHABs
Courtesy: NOAA
Produce dense blooms
Affect water quality – dissolved oxygen sags, taste & odor problems in drinking water, toxins
Produce potent toxins – illness or death
Alter water diversion & treatment operation – clogging of filters in water treatment plants, fish screens or channels
Alter the entire ecosystem – reduce growth of other algae, impact food quality/availability, fisheries decline.

CyanoHABs –
Formation
(www.odec.ca)
Courtesy: IPCC
DRIVERS:• Land use – Urban, agricultural
& industrial expansion
• Nutrient loading (N, P)
• Water use & hydrologic
changes – reduced water flow &
mixing
• Climate (temperature
increase)
Blooms become more
common, more intense and of
longer duration.

Harmful Algae Bloom in the US
(from U.S. National Office for Harmful Algal Blooms).

Reports of acute cyanotoxin poisonings of animals and/or humans
From Graham et al. 2009

Countries Exhibiting one or more documented CyanoHAB Events
(adapted from W. Carmichael)

Cyanotoxins –
Routes of Exposure
Human AnimalsRecreational
Aerosols
Drinking water
Food
Medical (dialysis)
Aerosols
Drinking water
Food
Plants
Human intoxication by microcystins
during renal dialysis treatment in Caruaru—Brazil
(Feb. 1996)
Irrigation
W. Carmichael

Cyanotoxins – Health Effects
Dermatologic effects - Lyngbyatoxins (“swimmer itch”)
Neurotoxic- Anatoxins
- Paralytic shellfish poisoning toxins (saxitoxins)
Hepatotoxic- Microcystins
- Cylindrospermopsins
Lyngbya
Anabaena
Microcystis Cylindrospermopsis
Aphanizomenon
Schizothrix (marine)

MicrocystisMicrocystis
– Small planktonic cells (3 ‐
5 µM)
– Unicellular, Colonial– Embedded in gelatinous matrix
– Buoyant (gas vesicle)– Fresh and brackish water– Warm, stable, nutrient enriched
Microcystins
(http://oehha.ca.gov/ecotox/documents/Microcystin031209.pdf)
– Most numerous of the cyanotoxins
– Over 80 variants– Extremely stable (half life = 10 weeks)
– Hepatotoxins: inhibit protein
phosphatases
– Carcinogenic : Liver, colon (Grosse et al. 2006)
Microcystis aeruginosa


Microcystis –
Adverse Impacts
– Death & cancer in human and wildlife(http://oehha.ca.gov/ecotox/documents/Microcystin031209.pdf)
– Hypoxia/anoxia (Carmichael, 1995)
– Bad taste and odor (Carmichael, 1995)
– Reduced zooplankton & fish feeding
success (Rohrlack et al., 2005; Malbrouck &
Kestemont, 2006)
– Fish food quality (Ger et al. 09)– Total carbon production – shift from
large to small zooplankton species (Smith
& Gilbert, 1995)
– Marine species (Melissa Miller, pers. com)
– Kill crops
H. Paerl, Lake Taihu
Bloom 2008, SFE

Guidance Values
(Graham et al. 2009)
Brazil is the only country to have CynoHABs mandatory regulations Other countries have guidelines (WHO guideline for drinking water = 1µg/L)

Is 1µg/L enough?
**Chronic Human Health Effects
from drinking water: Liver
and colorectal cancers**– “Microcystins from tap water
could be a risk factor for liver
and colorectal cancer: A risk
intensified by global change”
(Martínez Hernández et al., 2009)
– 0.61 µg/L in areas of high
incidence of liver cancer in
China (Yu, 1994)

Microcystis in the San Francisco Estuary
http://aem.asm.org/

SF Estuary/Delta‐Water
diverted
for
agricultural,
industrial & domestic uses
‐
Recreational
area
(fishing,
water
contact sports)
‐
Habitat
of
vulnerable
species
(Delta
Smelt,
Striped
Bass,
Threadfin Shad, Chinook Salmon)
Goals:
‐ Establishing a baseline
‐ Identifying HAB drivers
Strategy:‐Monthly monitoring @ 21 stn
‐
Variables:
toxins,
HA
cells
abundance, DOC, nutrients, …
SF Estuary: territory of outsize importance

Microcystis in the Delta
– 1980’s: Increase in cyanobacteria
biomass, decline of diatoms (Lehman & Smith,
1991)
– 1999: First Microcystis bloom (Lehman, 2000)
– Now: present throughout Delta (Lehman et al.,
2005, 2008, 2010)
– Coincided with Pelagic Organism Decline
(Delta Smelt, Striped Bass, Threadfin Shad,
Chinook Salmon, Copepods)
– Coincided with environmental changes:– Increased water transparency
– Increased temperature
– Increased salinity (specific conductance)
– Increased residence time
Microcystis Bloom 2008 www.water.ca.gov/ssr/microcystis.cfmhttp://www.science.calwater.ca.gov/pdf/workshops/POD/IEP_PO
D_2007_synthesis_report_031408.pdf

Microcystis blooms : Environmental drivers
http://www.eco‐check.org/forecast/chesapeake/2009/methods/

June 2009
(Mioni et al. in prep)

July 2009
D19 D28A D26
Mic
rocy
stin
s (
g/L)
0.0
0.5
1.0
1.5
2.0
2.5
MC-RR MC-LR
(Mioni et al. in prep)

August 2009
(Mioni et al. in prep)
D12 D19 D28A D16 D26
Mic
rocy
stin
s (
g/L)
0
1
2
3
4
5
6
7
MC-RR MC-LR MC-LA

September 2009
(Mioni et al. in prep)

Temperature (all stations)
Surface Temperature (Celsius)
19 20 21 22 23 24 25 26 27
Mic
rocy
stis
(cel
ls/m
L)
1e+2
1e+3
1e+4
1e+5
1e+6
1e+7
1e+8
(Mioni et al., in prep.)

Surface Temperature (Celsius)
21.0 21.5 22.0 22.5 23.0 23.5 24.0
Tota
l Mic
rocy
stin
s (
g/L)
0
1
2
3
4
5
6
7
Mic
rocy
stis
(cel
ls/m
L)
0.0
2.0e+6
4.0e+6
6.0e+6
8.0e+6
1.0e+7
1.2e+7
1.4e+7
1.6e+7
Temperature (only toxic stations)
D12 (Aug 09)
(Mioni et al., in prep.)

MC‐variants vs Temperature
Temperature (C)
21.0 21.5 22.0 22.5 23.0 23.5
Mic
rocy
stin
(g/
L)
0.0
0.5
1.0
1.5
2.0
2.5
3.0
MC-LR MC-LA
Temperature (C)
21.0 21.5 22.0 22.5 23.0 23.5M
icro
cyst
in (
g/L)
0.0
0.5
1.0
1.5
2.0
2.5
3.0
3.5
MC-RR
Different strains/variants? Different requirements?
(Mioni et al., in prep.)

The lower the NOx:P ratio, the greater the toxicity?
NOx:P ratio (mol:mol)
2 3 4 5 6 7 8 9 10
Mic
rocy
stin
s (
g L-1
)
1
2
3
4
5
6
7
Mic
rocy
stis
den
sity
(cel
ls m
L-1)
0.0
2.0e+6
4.0e+6
6.0e+6
8.0e+6
1.0e+7
1.2e+7
1.4e+7
1.6e+7
(Mioni et al., in prep.)

Microbial Associations?
D12
D28A
Antioch Bridge
(x40, blue: 450-490nm)
(x40, blue: 450-490nm)
• Single Microcystis cells vs. Colonies
• Associated filamentous
cyanobacterium (Mioni et al., in prep.)


MC variations with time
Antioch Bridge - 08/13/2009
8:53 (raw) 8:53 (<0.2 uM) 16:45 (raw) 16:45 (<0.2 uM)
Mic
rocy
stin
s (
g/L)
0
1
2
3
4
5
6
7
MC-RR MC-LR MC-LA
(Mioni et al., in prep.)

Why these diurnal variations?
Time NH4+
(µM)NO3
‐
(µM)PO4
3‐
(µM)N/P
8:53 0.48 12.58 2.25 5.81
16:45 0.23 15.23 1.87 8.25
8:53 (raw) 16:45 (raw)
Mic
rocy
stin
s (
g/L)
0
1
2
3
4
5
6
7
MC-RRMC-RRMC-LA
• Different water mass signatures
• Different microbial community?
• Horizontal transport?
(Mioni et al., in prep.)

Why these diurnal variations?
8:53 (raw) 16:45 (raw)
Mic
rocy
stin
s (
g/L)
0
1
2
3
4
5
6
7
MC-RRMC-RRMC-LA
8:53 (raw) 16:45 (raw)
Mic
rocy
stis
(cel
ls/m
L)
1e+3
1e+4
1e+5
1e+6
1e+7
1e+8
8:53
16:45(x40, blue: 450-490nm)
(Mioni et al., in prep.)

They were at D28A in Aug. 09 too!
August 2009
D12 D19 D28A D16 D26
Mic
rocy
stin
s (
g/L)
0
1
2
3
4
5
6
7
MC-RR MC-LR MC-LA
D28A
(Mioni et al., in prep.)

D28A
(Pearl & Pinckney, 1996)
Role of biological drivers in Microcystin toxin production?
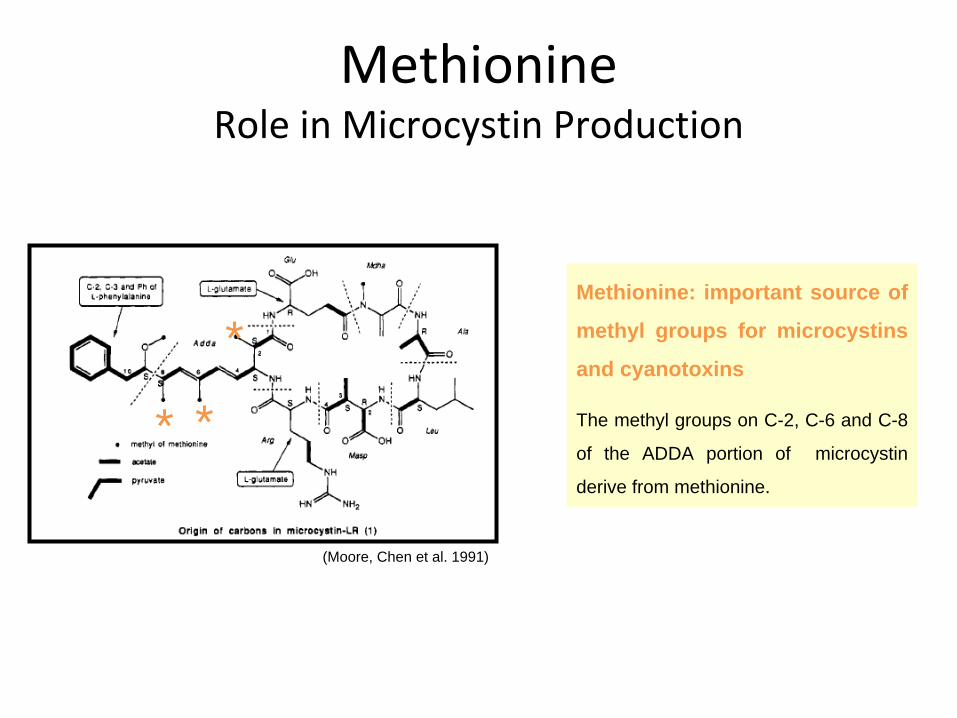
Methionine: important source of
methyl groups for microcystins
and cyanotoxins
The methyl groups on C-2, C-6 and C-8
of the ADDA portion of microcystin
derive from methionine.
Methionine Role in Microcystin Production
(Moore, Chen et al. 1991)
*
**

Cobalt and Vitamin B12 Drivers of Community Structure and Fonction?
(source: wikipedia)Vitamin B12 (Cobalamin/Cyanocobalamin)
Methionine Biosynthesis

D28A
(Pearl & Pinckney, 1996)
Role of biological drivers in Microcystin toxin production?
B12
Co + Methionine

Conclusions
• Microcystins levels > 1g/L at most stations during bloom.• Microcystis
abundance : high risk to very high risk levels.
• Total
microcystins
concentrations
correlate
with
surface
water temperature. Different variants? Different needs?
Date Microcystis
(cell/mL)
Microcystis (µg/L) Method Source
2008/9 0 – 1.4x10⁷ 0 – 6.46 LCMSMS This study
2007 7.7x10⁴
– 9.9x10⁷ 0.007 –
10.81 PPIA Baxa et al. 2010
2005 0 – 32 x 109 0 – 60 (ng/L) PPIAHPLC
Lehman et al. 2010

Problems to solve
• Integrate strong short‐time scale variations.
–
Vertical transport
–
Horizontal transport
–
Microbial consortia
• Identify associated filamentous cyanobacteria.
• Determine the Function of these cyanobacterial consortia.

Future work
We can do it!
Clear Lake, CA
The Delta, CA

New Strategies
SPATT
• Integrating temporal variations:SPATT = Solid Phase Adsorption Toxins Tracking
(Raphael Kudela, UCSC)
• Microbial community in a snapshot:PhyloCHIP : DNA barcoding microchip
(Gary Andersen, LBNL).
Distinguish 50,000 microbial species simultaneously
(353 cyanobacteria, 184 algae).
Microbial interaction (association, allelopathy)

www.peakwater.orgwww.peakwater.org

Thank you!