what makes an entrepreneur? - dartmouth collegeblnchflr/papers/jolev16p26.pdf · what makes an...
TRANSCRIPT
What Makes an Entrepreneur?
David G. Blanchflower, Dartmouth College and
National Bureau of Economic Research
Andrew J. Oswald, University of Warwick
This article uses various micro data sets to study entrepreneurship.Consistent with the existence of capital constraints on potential en-trepreneurs, the estimates imply that the probability of self-employ-ment depends positively upon whether the individual ever receivedan inheritance or gift. When directly questioned in interview surveys,potential entrepreneurs say that raising capital is their principal prob-lem. Consistent with our theoretical model’s predictions, the self-employed report higher levels of job and life satisfaction than em-ployees. Childhood psychological test scores, however, are notstrongly correlated with later self-employment.
For many commentators this is the era of the entrepre-neur. After years of neglect, those who start and managetheir own businesses are viewed as popular heroes. They
The first version of this article, Blanchflower and Oswald (1990b), dates backto 1988 and was in one of its iterations NBER Working Paper no. 3252. Wethank the ESRC and the UK Department of Employment for financial assistance.Steve Machin contributed a crucial piece of technical help on this article. Usefulsuggestions were also made by participants in seminars at Cambridge (UK),LSE, Harvard, Dartmouth, Aberdeen, Glasgow, Guelph, McMaster, Oxford, theLondon Business School, Queen Mary and Westfield College, Swansea, Uppsala,FIEF (Stockholm), and Warwick, and by Peter Abell, Graham Beaver, JoanBeaver, Fran Blau, George Borjas, Simon Burgess, Mark Casson, Andrew Clark,Robert Cressy, Peter Elias, Roger Gordon, Al Gustman, Jonathan Haskell, TomHolmes, Peter Johnson, Bruce Meyer, Chris Pissarides, Gavin Reid, David Storey,Steve Venti, and Alex Zanello.
[ Journal of Labor Economics, 1998, vol. 16, no. 1]q 1998 by The University of Chicago. All rights reserved.0734-306X/98/1601-0002$02.50
26
/ 9e0e$$ja14 11-17-97 13:11:40 laeca UC: Labor Econ
27What Makes an Entrepreneur?
are seen as risk-takers and innovators who reject therelative security of employment in large organizationsto create wealth and accumulate capital. Indeed, ac-cording to many, economic recovery . . . is largely de-pendent upon their ambitions and efforts. (ROBERTGOFFEE and RICHARD SCASE 1987, p. 1)
I. IntroductionMost Western governments provide encouragement and tax breaks to
those who run small businesses. This appears to be because politiciansbelieve, for reasons not always clearly articulated, that there are undesir-able impediments to the market supply of entrepreneurship. Despite me-dia and political interest in this topic, however, economists have contrib-uted relatively little to the debate about how the economy generatessuccessful small businesses. It has long been noted that economics text-books largely ignore the role of the entrepreneur and say little about theformation of the small enterprises that provide the beginnings of giantcorporations.
The simplest kind of entrepreneurship is self-employment. There isrecent survey evidence to suggest that, in the industrialized countries,many individuals who are currently employees would prefer to be self-employed. Although it cannot be definitive, this evidence suggests thatthere may be restrictions on the supply of entrepreneurs. For example,the International Social Survey Programme of 1989 asked random samplesof individuals from 11 countries the question: ‘‘Suppose you were work-ing and could choose between different kinds of jobs. Which of thefollowing would you choose? I would choose (i) Being an employee,( ii ) Being self-employed, ( iii ) Can’t choose.’’ Large numbers of peoplegave answer ii and thus stated that they would wish to be self-employed.This answer was given by, for example, a remarkable 63% of Americans(out of 1,453 asked), 48% of Britons (out of 1,297) , and 49% of Germans(out of 1,575) . These numbers can be compared with an actual proportionof self-employed people in these countries of approximately 15%.
The data raise a puzzle: Why do not more of these individuals followtheir apparent desire to run their own business? In this article, we explorethe factors that may be important in determining who becomes and re-mains an entrepreneur. After years of comparative neglect, research onthe economics of entrepreneurship—especially upon self-employment—is beginning to expand. Microeconometric work includes Fuchs (1982)and Rees and Shah (1986) and, more recently, Pickles and O’Farrell(1987) , Borjas and Bronars (1989) , Evans and Jovanovic (1989) , andEvans and Leighton (1989) .1 This article follows in the general spirit of
1 OECD (1986) and Blau (1987) are aggregate time-series studies. Theoreticalanalysis relevant to this article’s results includes Rosen (1983) , Shorrocks (1988) ,
/ 9e0e$$ja14 11-17-97 13:11:40 laeca UC: Labor Econ
28 Blanchflower/Oswald
these inquiries, although its data and methods differ from those in earlierinvestigations.
One possible impediment to entrepreneurship is lack of capital. Inrecent work using U.S. micro data, Evans and Leighton (1989) and Evansand Jovanovic (1989) have argued formally that entrepreneurs face liquid-ity constraints. The authors use the National Longitudinal Survey ofYoung Men for 1966–81 and the Current Population Surveys for 1968–87. The key test shows that, all else equal, people with greater familyassets are more likely to switch to self-employment from employment.This asset variable enters probit equations significantly and with a qua-dratic form. Although Evans and his collaborators draw the conclusionthat capital and liquidity constraints bind, this claim is open to the objec-tion that other interpretations of their correlation are feasible. One possi-bility, for example, is that inherently acquisitive individuals both starttheir own businesses and forgo leisure to build up family assets. In thiscase, there would be a correlation between family assets and movementinto self-employment even if capital constraints did not exist. A secondpossibility is that the correlation between family assets and the movementto self-employment arises because children tend to inherit family firms.
The article provides, in Section IV, a new test of the finance-constrainthypothesis. The test uses data on inheritances and gifts. Studying thebehavior of those who receive money is presumably as close as the econo-mist can get to the idealized laboratory experiment in which some subjectsare issued capital while those in a control group get none. Results de-scribed later show that individuals who have received inheritances or giftsare more likely to run their own businesses. This is true holding constanta group of personal, family, and geographical characteristics. The effectis large and is not the result of offspring inheriting family enterprises.
The receipt of an inheritance is not an entirely random event, so thisstudy does not provide a perfect test. Individuals who receive them maycome from backgrounds that make those people, for some unmeasuredreasons, prone to self-employment. Moreover, those who receive inheri-tances within families may be those who are—again for unmeasuredreasons—better suited to self-employment. It is not possible, without atrue experiment, to assuage all such concerns. However, the article pre-sents various complementary forms of evidence for its claims. One drawsupon questionnaires. Although simple, this is of a kind apparently not
Casson (1990) , and Holmes and Schmitz (1990) . New empirical papers includeReid and Jacobsen (1988) , De Witt and Van Winden (1990) , Lentz and Laband(1990) , Meyer (1990) , Reid (1990) , Holmes and Schmitz (1991) , and Blanch-flower and Meyer (1994) . Work by Black, de Meza, and Jeffreys (1996) finds,consistent with the general tenor of the approach taken here, that house assetvalues play an important role in shaping the supply of entrepreneurs.
/ 9e0e$$ja14 11-17-97 13:11:40 laeca UC: Labor Econ
29What Makes an Entrepreneur?
reported before in the literature. Data from interviews with random sam-ples of individuals demonstrate that, when asked, the self-employed saythat they are constrained principally by a lack of capital. Moreover, manyof those who are not self-employed say that it is predominantly a shortageof capital that prevents them from starting their own business. Section Vdescribes this survey material. Although such survey responses have tobe interpreted with caution, the message they provide is consistent withthat from the quite different econometric methods.
Another theme within the article is the role of psychological character-istics. The analysis studies the correlation between the probability ofbeing self-employed as an adult and the individual’s childhood scores ona number of psychological tests. Although originally a major motivationfor the research, the results are relatively disappointing. Individuals’ psy-chology—at least using the data available here—does not seem to playa large role.
If it is true that capital and other constraints hold back the effectivesupply of entrepreneurship, and so lead to there being frustrated employ-ees who would rather be entrepreneurs, those who run their own busi-nesses might be expected to be ‘‘happier,’’ on average, than those whodo not. In Section VI, we suggest and implement an econometric test ofthis hypothesis, using data of a kind more commonly studied by psychol-ogists.
II. Theoretical Background
Consider the following theoretical model in which people choose be-tween working in the entrepreneurial sector and being an employee. First,assume, following Knight (1921) and others, that entrepreneurial oppor-tunities cannot be assigned probabilities. This might be thought to bebecause the expected returns from new ideas and openings are inherentlyimpossible to quantify. Second, assume that entrepreneurs may be con-strained in the amount of capital they can directly acquire. Considerperson j , who by assumption is a potential businessperson with the visionto see a range of feasible business projects and, thus, is within the intrinsi-cally entrepreneurial section of the population. He or she needs capitalto undertake a project. One possibility is to use own or family funds,thereby making it unnecessary to borrow commercially. However, personj may have lower savings than are required for the entrepreneurial venture.Then there is no option but to try to obtain a business loan.
A banker in the above framework is likely to reason in the followingway. ‘‘I have little idea about whether project X will work out as Mr. Asays. I cannot assign it a probability. However, if Mr. A offers me collat-eral of Y , then I can make a loan of Y 0 d, where d is the cost ofreclaiming the collateral in the event of bankruptcy. This is effectively arisk-free loan.’’ Thus secured (‘‘collateralized’’ ) loans are a rational re-
/ 9e0e$$ja14 11-17-97 13:11:40 laeca UC: Labor Econ
30 Blanchflower/Oswald
sponse by bankers to imperfect knowledge. Such a view provides a naturalrationale for the existence of capital constraints.
Assume individual j can get an unsecured loan only z percent of thetime, where z is below unity. This is despite the fact that the businessventure is assumed sound. The reason for the apparent suboptimality isthat individual j has no way of assuring the typical banker that the hypo-thetical project is feasible. He may do so (perhaps because some within theinnovative entrepreneurial class become bankers) , but not with certainty.
This approach makes genuine uncertainty a central feature of the analy-sis. By contrast, the recent work by Khilstrom and Laffont (1979) ,Kanbur (1982) , and Grossman (1984) breaks with the tenets of earlierthought on entrepreneurial activity. Kanbur et al. develop a standardneoclassical approach in which productive business opportunities are exante feasible for, and visible to, all individuals (most simply choose notto exploit them); there is an objective probability distribution governingbusiness risk, and everyone knows that distribution; entrepreneurs receivethe same expected utility as their workers; the entrepreneur is likely tobe someone with unusually low risk aversion (see especially Khilstromand Laffont 1979) . These are different from the main assumptions andarguments of classic sources such as Knight (1921) , Schumpeter (1939) ,and Kirzner (1973) . In contrast to modern theory, the classic writingsabout the nature of the entrepreneur stressed the following: most individ-uals are not sufficiently alert or innovative to perceive business opportuni-ties; there is no objective probability distribution governing business risks;an innovative entrepreneur may receive higher expected utility than heor she would as a regular worker; attitude to risk is not the centralcharacteristic that determines who becomes an entrepreneur.
Our model draws upon the older, but recently neglected, current ofthought. It builds upon eight assumptions. Assume that proportion b ofthe population has entrepreneurial vision. This group of individuals cansee business opportunities where proportion 1 0 b see none. There is, inthis economy, an array of potential entrepreneurial projects that have notyet been developed, each of which requires a different amount of capital,k . Each project needs one entrepreneur’s labor. The profit from projectk—indexing in this way for simplicity—is p (k ) . This function describesthe return from the different entrepreneurial ventures in the economy. Itis assumed to be strictly increasing, because any high-profit projects thatrequired little capital have already been undertaken. There is a distributionof capital endowments across the population. Denote it f (k ) , where klies between zero and one. The latter normalizes the richest person’scapital assets at unity.
An individual who perceives the array of business opportunities cannotwith certainty borrow the required capital unless he or she has access tothe necessary collateral. This is because, by their nature, such opportuni-
/ 9e0e$$ja14 11-17-97 13:11:40 laeca UC: Labor Econ
31What Makes an Entrepreneur?
ties are not within the vision of most other kinds of individuals (such asbankers approached for loans) . The individual can try to borrow for aproject but has only probability z of obtaining an unsecured loan.2 Denoteutility by u . Individuals receive utility u Å p / i in self-employment,and u Å w in conventional employment, where w is defined as the wagepaid for nonentrepreneurial work, and i is the nonpecuniary utility frombeing independent and one’s own boss. Assume that anyone can findwork at wage w in the nonentrepreneurial part of the economy. It isassumed that w equals the marginal product of labor in that alternativesector and that this is a declining function, w (N ) , of the number ofemployees, N , in the sector. Population is normalized at unity. In equilib-rium, the number of entrepreneurs is E .
These assumptions lead to a simple but fairly unconventional model.To make the key points as simply as possible, all probabilistic businessrisk has been assumed away. Many potential entrepreneurs are liquidity-constrained. People enter entrepreneurship until, in equilibrium, either( i ) capital or vision constraints are binding in aggregate or ( ii ) the utilityfrom running a business is driven down to equal to that from wage work.In the latter case,
w Å p (k*) / i , (1)
wage Å profit from self-employment
/ nonpecuniary utility from independence,
where k* is the amount of capital needed for the marginal entrepreneurialproject. All projects requiring more capital have here already been un-dertaken.
The number of entrepreneurs in the economy is
E Å b *1
k*f (k )dk / bz *
k*
0f (k )dk (2)
Å 1 0 N. (3)
This is also, by the choice of units, the probability of self-employmentfor one individual. From equation (2) , the total number of entrepreneursin the economy is equal to the probability of ‘‘vision’’ multiplied by thenumber of people with a greater capital endowment than k* (that needed
2 An interesting but complex project would be to construct a complete theoryof the determinants of z ( the probability that someone with a good idea canobtain a loan from bankers who cannot themselves perceive the business opportu-nity) . This article requires only that z be less than unity.
/ 9e0e$$ja14 11-17-97 13:11:40 laeca UC: Labor Econ
32 Blanchflower/Oswald
for the marginal project) plus the probability of vision multiplied by theprobability of successfully getting an unsecured business loan multipliedby the number of individuals who are inherently short of capital.
Equilibrium in this economy can take two different forms. One isdescribed by the simultaneous solution of equations (1)–(3) . This is thecase in which the market for entrepreneurs clears: the marginal entrepre-neur earns utility (made up of profit plus the satisfaction from indepen-dence) equal to that from working in the wage sector. There is a secondpossibility, and that is when there are insufficient entrepreneurs to driveto zero the surplus from running the marginal business. When there is ashortage of b-individuals with capital, those people earn a rent, so that
p (k*) / i ú w. (4)
This distortion might be viewed as a result of the asymmetric informa-tion—about whether a project is good—between bankers and those indi-viduals in the population who were born with entrepreneurial vision.
A number of results follow.PROPOSITION 1. When the market for entrepreneurs clears (p (k*)
/ i Å w ) , the following raise the equilibrium number of entrepreneursand the economy’s wage rate: ( i ) an increase in b, the proportion of thepopulation with (entrepreneurial) vision, ( ii ) a rise in i, the utility fromindependence, ( iii ) an increase in z, the probability of loans to individualswithout sufficient capital.
PROPOSITION 2. When the market for entrepreneurs fails to clear(p (k*)/ iúw ) , the following raise the equilibrium number of entrepre-neurs and the economy’s wage rate: ( i ) an increase in b, the proportionof the population with entrepreneurial vision, ( ii ) an increase in z, theprobability of loans to individuals without sufficient capital, ( iii ) a dropin k*, the binding level of capital necessary to set up a business. Contraryto the market clearing case, ( iv) the utility from independence, i, has noeffect.
PROPOSITION 3. Entrepreneurs get higher utility than regularworkers.
PROPOSITION 4. When capital constraints bind, the larger is Z , thenumber of people in the economy who have capital, the smaller is theutility gap between entrepreneurs and workers.
For proofs, see appendix A.The underlying idea is a simple one. At the individual level, there are
capital constraints. Some of the people with the ability to see good proj-ects fail to obtain the funds to undertake them, because they do not havea large enough capital endowment, k, or are not lucky enough to get anunsecured loan. At the aggregate level, however, the capital constraintmay not bind. This is the case analyzed in proposition 1, where there is
/ 9e0e$$ja14 11-17-97 13:11:40 laeca UC: Labor Econ
33What Makes an Entrepreneur?
no distortion. The case in proposition 2 is different. Here the supply ofcapital is so short that anyone who can raise the finance earns a form ofrent created by the asymmetric information in the economy.3 In equilib-rium, either capital or vision constraints are binding in aggregate or theutility from running a business has been driven down to equal that fromwage work. Entrepreneurs are better off than regular workers, and themean gap in utility between the two kinds of work is higher if there arefewer numbers of people with capital.
This framework suggests two testable hypotheses. The first is the ideathat some potential entrepreneurs are constrained, by lack of access tocapital, to become employees rather than entrepreneurs. The second isthat individuals who run their own enterprises have higher utility thanthose who are employees in the wage sector. Sections III and IV studythe first issue using an econometric test and complementary questionnaireevidence. The second issue is intrinsically more difficult to assess, becauseit requires data on utility levels in the two sectors. Following methodsmore commonly found in psychology than economics, Section V imple-ments a test using reported satisfaction levels as proxy utility data.
III. Data and Methods
Whether or not individual j is self-employed depends on a joint proba-bility captured by the constituent parts of equation (2) :
the probability of running a business Å ( the probability of havingentrepreneurial vision)∗ ( the probability of having capital / theprobability of being able to get an unsecured loan given no capital) .
Empirically these probabilities may be assumed to depend upon a set ofpersonal characteristics, especially measures correlated with the person’sassets, and a set of regional and industrial characteristics. Rather thanwork with a highly structured model, we estimate reduced-form equa-tions based on a linearization of the assumed probability function anduses standard personal variables plus a range of childhood variables.
Should the analysis focus upon transitions into self-employment orupon cross-section evidence on those who are self-employed? Althoughit would be useful to have results for pure transitions, there is a problemwith such an approach. Policy makers (as well as economists) are inter-ested in entrepreneurs who are successful rather than unsuccessful, andin small businesses that last rather than fail. Therefore, showing thatinheritances affect the flow into entrepreneurship would, in itself, be oflimited (though positive) value, for it could be that such individuals
3 It is assumed that the existence of any specialist venture-capital companies isnot sufficient to remove the distortion created by asymmetric information.
/ 9e0e$$ja14 11-17-97 13:11:40 laeca UC: Labor Econ
34 Blanchflower/Oswald
quickly exit from self-employment. Establishing that a person’s access tofinance influences his or her decision to remain self-employed would,similarly, also be of positive but limited interest, because such peoplemight be less likely to flow in to entrepreneurship in the first place.
A natural way to learn about the lasting influence of capital injectionssuch as inheritances is thus either ( i ) simultaneously to study both setsof transitions ( in and out) or ( ii ) to study the effects of earlier inheri-tances upon the cross-section probability of being self-employed. Thisarticle—partly because of the nature of the data—adopts the secondapproach. Recent work by Holtz-Eakin, Joulfaian, and Rosen (1994a,1994b ) , which follows an early version of this article, takes route i andshows that inheritances both raise entry and slow exit. Recent cross-sectional Swedish evidence on ii is contained in Lindh and Ohlsson(1996) .
The econometric analysis described in the next section draws upon theNational Child Development Study (NCDS). This is a longitudinal birthcohort study that takes as its subjects all those living in Great Britain whowere born between March 3 and 9, 1958. These children were surveyed atbirth and at ages 7, 11, 16, 23, and 33. At each of the first three follow-ups, information was obtained from parents, teachers, and doctors. Atthe most recent sweep, conducted in 1991 when all subjects were age 33,information was also gathered about the respondent’s spouse and chil-dren. Details of the survey design are summarized in Elias and Blanch-flower (1989) .
We make use of information about employment status that was col-lected in the interviews of 1981 (NCDS4) and 1991 (NCDS5). Thesehave the useful feature that they provide snapshots of self-employmentactivity when the individuals were in their early twenties and early thirties.The 1981 sweep of NCDS contained 12,537 interviews. Of the total, 521people were self-employed, while 8,657 worked as employees. Hence,approximately one in 18 young people who were working at the time ofinterview had a job which they had, in a sense, created themselves. The1991 sweep contains data on 11,407 individuals. Of these, 1,279 were self-employed, while a further 7,703 were employees. Thus, 10 years furtherinto the life cycle, the proportion of employment accounted for by theself-employed had risen from 5.7% in 1981 to 14.2% in 1991. The perioditself probably accounts for some of this rise. In December 1981, therewere 21,142,000 employees in employment in Great Britain, of whom2,093,000, or 9.9%, were self-employed. This compares with 21,506,000employees in employment in December 1991, of whom 3,224,000, or15%, were self-employed (Employment Gazette, vol. 93, no. 1 [May1994]) .
The empirical analysis focuses on individuals who were either em-ployed or self-employed at the time of interview in either 1981 or 1991.
/ 9e0e$$ja14 11-17-97 13:11:40 laeca UC: Labor Econ
35What Makes an Entrepreneur?
In each year, we study cross-section patterns at that point in time. Thismakes the nature of the equations different from Evans’s work withJovanovic and Leighton, where the data were on the flow into self-em-ployment. We study the probability that an individual reports himself orherself as self-employed. The dependent variable is therefore a stockrather than a flow and so captures the combined effects of gifts andinheritances (among other variables) on past movements into and out ofself-employment. However, some information is available on timing, andthe later results do more than look at simple cross-section correlations.
To produce plausible evidence that an access-to-capital variable influ-ences entrepreneurial activity, it is necessary to have a well-designed sta-tistical test. It is likely to be important to be able to argue that the capitalvariable is exogenous or can be instrumented convincingly.
Two tests are done on 1981 data. One uses instrumental variables, theother lags. The data set has the valuable feature that it records in 1981(though not in 1991) whether the entrepreneur’s parents are alive or dead.A variable for parental death then makes a natural instrumental variable( in the NCDS data set, approximately 14% of individuals have at leastone parent who has died) , because it should enter an inheritance equationbut not a self-employment equation. Unfortunately, this cannot be donein the 1991 data, because parental death is not available in the later data.In order to provide an additional test of the direction of causality, wealso use data on gifts/ inheritances that were received many years beforethe start-up decision.
The key question in the NCDS surveys is: ‘‘Have you (or your hus-band/wife/partner) ever inherited, or received as a gift from anotherperson, money, property, or other goods to the value of £500 or more?’’(NCDS4, question 9; NCDS5, question E11). This question was askedin both sweeps of the National Child Development Study. In 1981, 1,060working individuals responded positively to this question. These respon-dents were asked to report both the amount of the gift/ inheritance andthe date of its receipt. Of these monies, 6.4% were received before 1975,25.7% between 1975 and 1978, and the rest received between 1979 and1981. In the 1991 data, 2,927 working individuals said they or theirspouses had received a gift or inheritance of £500 or more. Eighty percentof these inheritances or gifts had been received since 1981.
For analysis, these data on inheritance/gift payments were convertedinto constant 1981 pounds sterling by compounding the UK TreasuryBill interest rates from 1958 to 1991. Among those who received a sum,the mean size of payment received by workers was £3,617 in 1981 (witha standard deviation of £8,421) and £5,655 in 1991 (with a standarddeviation of £18,700) . Only the largest inheritance/gift was recorded, soit is not possible to aggregate over any multiple gifts. It was thought best,for later analysis, not to exclude gifts received by married people’s spouses
/ 9e0e$$ja14 11-17-97 13:11:40 laeca UC: Labor Econ
36 Blanchflower/Oswald
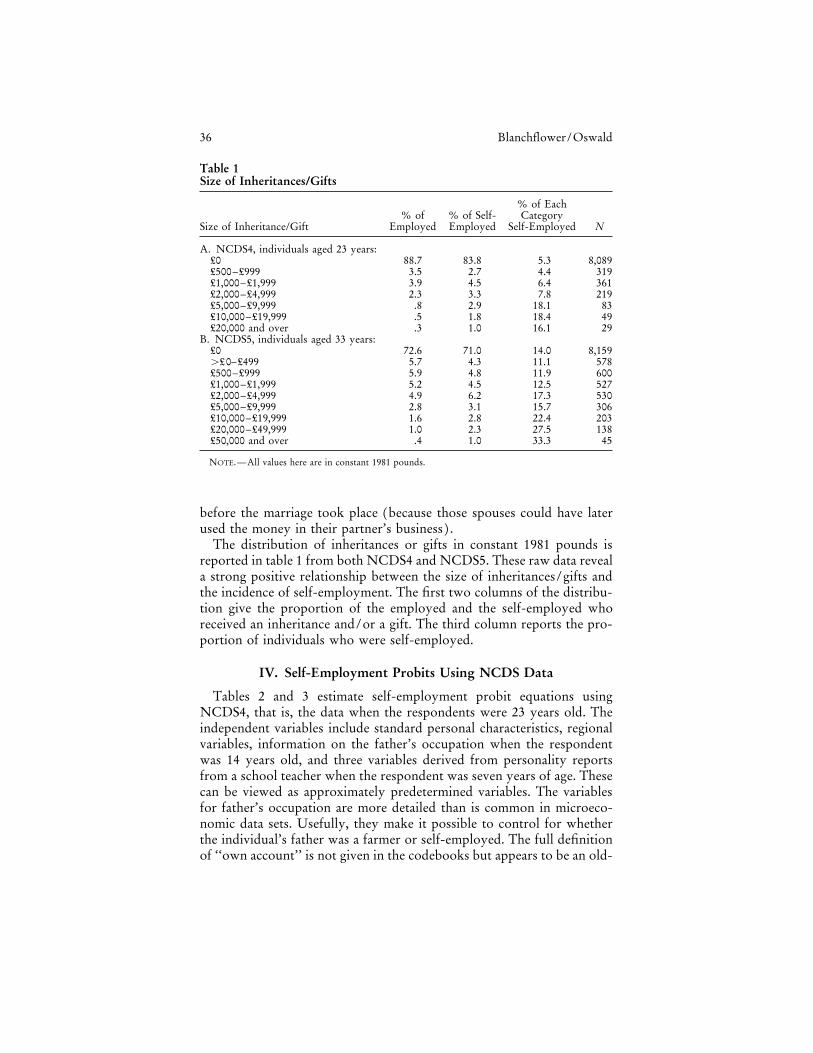
Table 1Size of Inheritances/Gifts
% of Each% of % of Self- Category
Size of Inheritance/Gift Employed Employed Self-Employed N
A. NCDS4, individuals aged 23 years:£0 88.7 83.8 5.3 8,089£500–£999 3.5 2.7 4.4 319£1,000–£1,999 3.9 4.5 6.4 361£2,000–£4,999 2.3 3.3 7.8 219£5,000–£9,999 .8 2.9 18.1 83£10,000–£19,999 .5 1.8 18.4 49£20,000 and over .3 1.0 16.1 29
B. NCDS5, individuals aged 33 years:£0 72.6 71.0 14.0 8,159ú£0–£499 5.7 4.3 11.1 578£500–£999 5.9 4.8 11.9 600£1,000–£1,999 5.2 4.5 12.5 527£2,000–£4,999 4.9 6.2 17.3 530£5,000–£9,999 2.8 3.1 15.7 306£10,000–£19,999 1.6 2.8 22.4 203£20,000–£49,999 1.0 2.3 27.5 138£50,000 and over .4 1.0 33.3 45
NOTE.—All values here are in constant 1981 pounds.
before the marriage took place (because those spouses could have laterused the money in their partner’s business) .
The distribution of inheritances or gifts in constant 1981 pounds isreported in table 1 from both NCDS4 and NCDS5. These raw data reveala strong positive relationship between the size of inheritances/gifts andthe incidence of self-employment. The first two columns of the distribu-tion give the proportion of the employed and the self-employed whoreceived an inheritance and/or a gift. The third column reports the pro-portion of individuals who were self-employed.
IV. Self-Employment Probits Using NCDS Data
Tables 2 and 3 estimate self-employment probit equations usingNCDS4, that is, the data when the respondents were 23 years old. Theindependent variables include standard personal characteristics, regionalvariables, information on the father’s occupation when the respondentwas 14 years old, and three variables derived from personality reportsfrom a school teacher when the respondent was seven years of age. Thesecan be viewed as approximately predetermined variables. The variablesfor father’s occupation are more detailed than is common in microeco-nomic data sets. Usefully, they make it possible to control for whetherthe individual’s father was a farmer or self-employed. The full definitionof ‘‘own account’’ is not given in the codebooks but appears to be an old-
/ 9e0e$$ja14 11-17-97 13:11:40 laeca UC: Labor Econ
37What Makes an Entrepreneur?
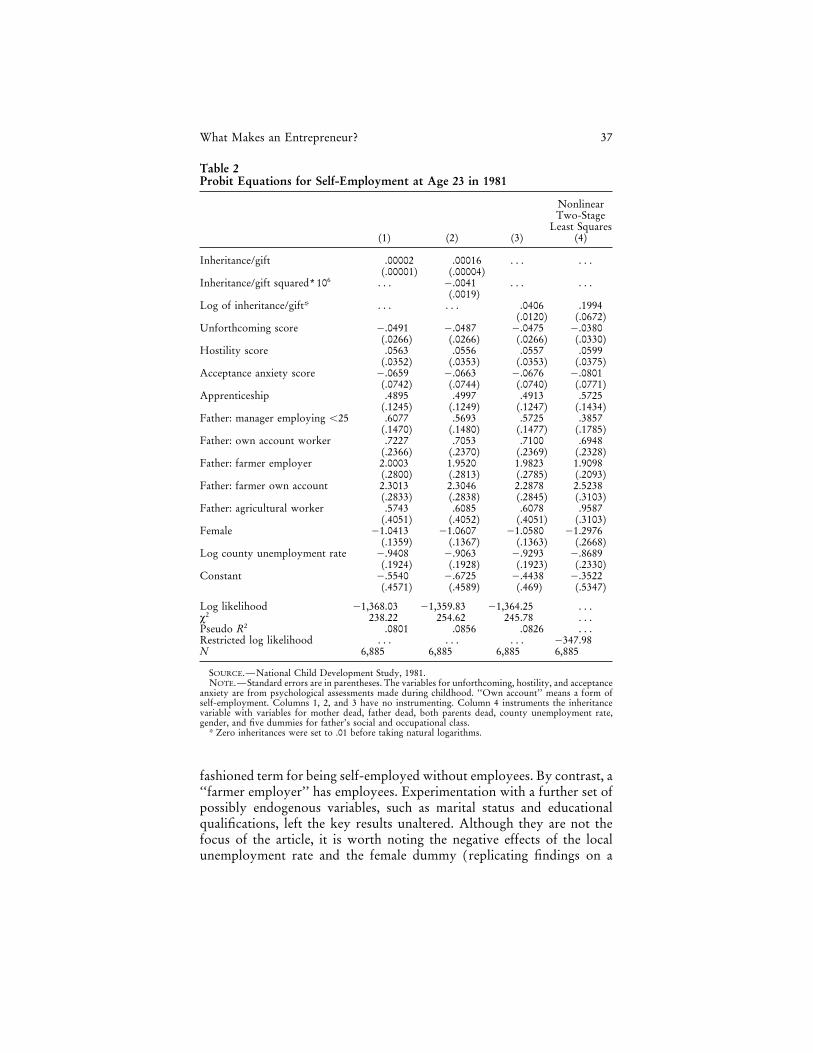
Table 2Probit Equations for Self-Employment at Age 23 in 1981
NonlinearTwo-Stage
Least Squares(1) (2) (3) (4)
Inheritance/gift .00002 .00016 . . . . . .(.00001) (.00004)
Inheritance/gift squared∗106 . . . 0.0041 . . . . . .(.0019)
Log of inheritance/gift* . . . . . . .0406 .1994(.0120) (.0672)
Unforthcoming score 0.0491 0.0487 0.0475 0.0380(.0266) (.0266) (.0266) (.0330)
Hostility score .0563 .0556 .0557 .0599(.0352) (.0353) (.0353) (.0375)
Acceptance anxiety score 0.0659 0.0663 0.0676 0.0801(.0742) (.0744) (.0740) (.0771)
Apprenticeship .4895 .4997 .4913 .5725(.1245) (.1249) (.1247) (.1434)
Father: manager employing õ25 .6077 .5693 .5725 .3857(.1470) (.1480) (.1477) (.1785)
Father: own account worker .7227 .7053 .7100 .6948(.2366) (.2370) (.2369) (.2328)
Father: farmer employer 2.0003 1.9520 1.9823 1.9098(.2800) (.2813) (.2785) (.2093)
Father: farmer own account 2.3013 2.3046 2.2878 2.5238(.2833) (.2838) (.2845) (.3103)
Father: agricultural worker .5743 .6085 .6078 .9587(.4051) (.4052) (.4051) (.3103)
Female 01.0413 01.0607 01.0580 01.2976(.1359) (.1367) (.1363) (.2668)
Log county unemployment rate 0.9408 0.9063 0.9293 0.8689(.1924) (.1928) (.1923) (.2330)
Constant 0.5540 0.6725 0.4438 0.3522(.4571) (.4589) (.469) (.5347)
Log likelihood 01,368.03 01,359.83 01,364.25 . . .x2 238.22 254.62 245.78 . . .Pseudo R2 .0801 .0856 .0826 . . .Restricted log likelihood . . . . . . . . . 0347.98N 6,885 6,885 6,885 6,885
SOURCE.—National Child Development Study, 1981.NOTE.—Standard errors are in parentheses. The variables for unforthcoming, hostility, and acceptance
anxiety are from psychological assessments made during childhood. ‘‘Own account’’ means a form ofself-employment. Columns 1, 2, and 3 have no instrumenting. Column 4 instruments the inheritancevariable with variables for mother dead, father dead, both parents dead, county unemployment rate,gender, and five dummies for father’s social and occupational class.
* Zero inheritances were set to .01 before taking natural logarithms.
fashioned term for being self-employed without employees. By contrast, a‘‘farmer employer’’ has employees. Experimentation with a further set ofpossibly endogenous variables, such as marital status and educationalqualifications, left the key results unaltered. Although they are not thefocus of the article, it is worth noting the negative effects of the localunemployment rate and the female dummy (replicating findings on a
/ 9e0e$$ja14 11-17-97 13:11:40 laeca UC: Labor Econ
38 Blanchflower/Oswald
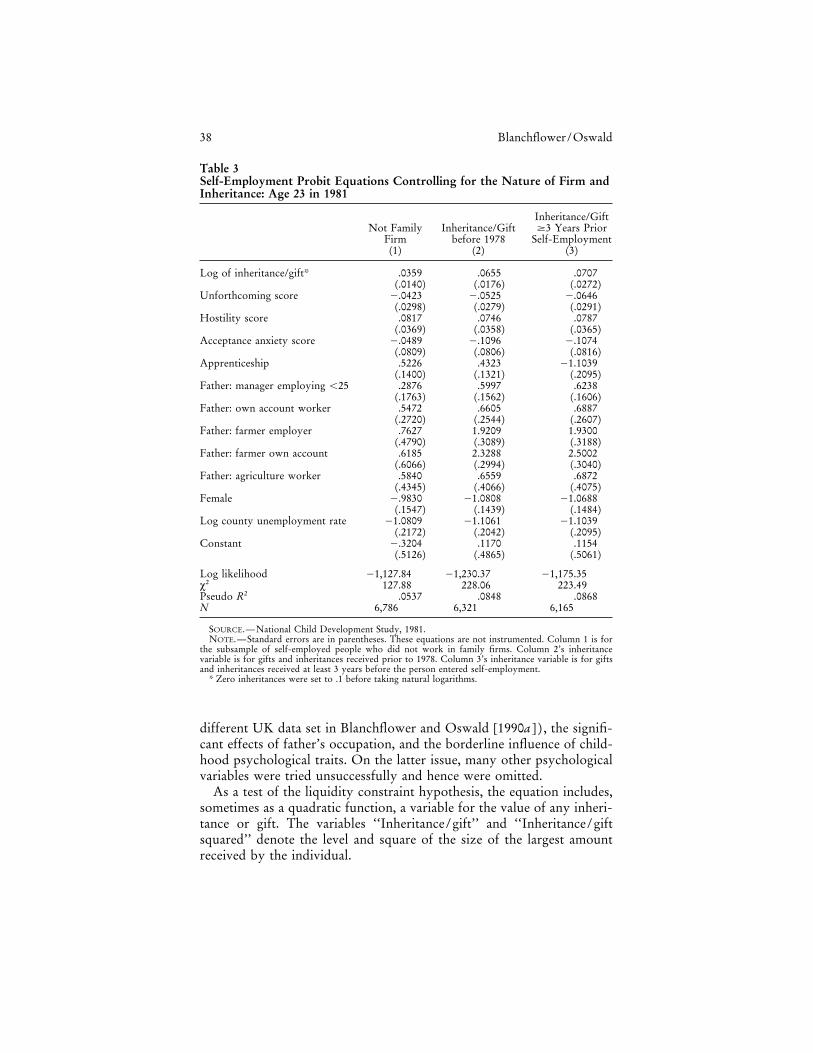
Table 3Self-Employment Probit Equations Controlling for the Nature of Firm andInheritance: Age 23 in 1981
Inheritance/GiftNot Family Inheritance/Gift ¢3 Years Prior
Firm before 1978 Self-Employment(1) (2) (3)
Log of inheritance/gift* .0359 .0655 .0707(.0140) (.0176) (.0272)
Unforthcoming score 0.0423 0.0525 0.0646(.0298) (.0279) (.0291)
Hostility score .0817 .0746 .0787(.0369) (.0358) (.0365)
Acceptance anxiety score 0.0489 0.1096 0.1074(.0809) (.0806) (.0816)
Apprenticeship .5226 .4323 01.1039(.1400) (.1321) (.2095)
Father: manager employing õ25 .2876 .5997 .6238(.1763) (.1562) (.1606)
Father: own account worker .5472 .6605 .6887(.2720) (.2544) (.2607)
Father: farmer employer .7627 1.9209 1.9300(.4790) (.3089) (.3188)
Father: farmer own account .6185 2.3288 2.5002(.6066) (.2994) (.3040)
Father: agriculture worker .5840 .6559 .6872(.4345) (.4066) (.4075)
Female 0.9830 01.0808 01.0688(.1547) (.1439) (.1484)
Log county unemployment rate 01.0809 01.1061 01.1039(.2172) (.2042) (.2095)
Constant 0.3204 .1170 .1154(.5126) (.4865) (.5061)
Log likelihood 01,127.84 01,230.37 01,175.35x2 127.88 228.06 223.49Pseudo R2 .0537 .0848 .0868N 6,786 6,321 6,165
SOURCE.—National Child Development Study, 1981.NOTE.—Standard errors are in parentheses. These equations are not instrumented. Column 1 is for
the subsample of self-employed people who did not work in family firms. Column 2’s inheritancevariable is for gifts and inheritances received prior to 1978. Column 3’s inheritance variable is for giftsand inheritances received at least 3 years before the person entered self-employment.
* Zero inheritances were set to .1 before taking natural logarithms.
different UK data set in Blanchflower and Oswald [1990a ] ) , the signifi-cant effects of father’s occupation, and the borderline influence of child-hood psychological traits. On the latter issue, many other psychologicalvariables were tried unsuccessfully and hence were omitted.
As a test of the liquidity constraint hypothesis, the equation includes,sometimes as a quadratic function, a variable for the value of any inheri-tance or gift. The variables ‘‘Inheritance/gift’’ and ‘‘Inheritance/giftsquared’’ denote the level and square of the size of the largest amountreceived by the individual.
/ 9e0e$$ja14 11-17-97 13:11:40 laeca UC: Labor Econ
39What Makes an Entrepreneur?
Column 1 of table 2 reveals that, in the simplest linear specification,the inheritance/gift variable enters positively with a coefficient that ispositive and statistically significant at the 5% level. Column 2 tests for aquadratic form. Both the level and the square are significant at better thanthe 5% level. Further evidence for a nonlinearity emerges from column3 of table 2, which switches to the logarithm of inheritance/gift (assigning0.01 to those values of zero) . The coefficient enters with a coefficient of0.04 with a standard error of 0.01. For simplicity, this article continuesto use a log structure in table 3.
Table 3 probes the nature of the correlation between self-employmentand receipt of an inheritance or gift. First, in column 1 of table 3 the sampleis restricted to those who are not self-employed in family firms (usinganswers to the question ‘‘Are you self-employed in a firm belonging to yourfamily?’’). The gift/inheritance variable remains strongly significant. Thecolumn 1 estimation is an attempt to demonstrate that table 2’s inheritance/gift effect is not merely proxying for the fact that children inherit familyfirms. It is possible, as a referee has pointed out, that some people whoinherited businesses from their parents may not refer to them as familyfirms, but the variable is the best available in this data set. Second, becausechildren who are about to go into business may approach their own familiesfor loans, it is possible that the results in columns 1–3 of table 2 might becontaminated by simultaneity bias. Although the need to use family moneyin this way could itself be construed as an illustration of capital constraints,two procedures were followed in an attempt to allow for the possible endo-geneity of the inheritance/gift variable.
Column 4 of table 2 reports estimates using nonlinear two-stage leastsquares. Here a good instrument is required, and the data set seems tocontain one. The variable for inheritances or gifts is assumed to be afunction of whether one or both of the individual’s parents had died(research on the determinants of inheritance is sparse but includes Cox[1987] and Wilhelm [1991]) . This ought to be an effective way to instru-ment, because the death of a father or mother should have no effect onthe self-employment decision per se but should, and does, enter signifi-cantly into an equation for inheritances or gifts (examples of such equa-tions are given in app. A). Approximately 14% of the sample had lostat least one parent in 1981. The exact figures are in table A.
To exploit a form of lag as an alternative to instrumenting, columns 2
Table A
Mother Alive Mother Dead
Father alive 10,797 426Father dead 1,135 94
/ 9e0e$$ja14 11-17-97 13:11:40 laeca UC: Labor Econ
40 Blanchflower/Oswald
and 3 of table 3 use only data on those inheritances and gifts that camewell before the self-employment decision. This approach attempts toestablish causality, and so solve the potential simultaneity problem, byusing a predetermined inheritance/gift variable. The coefficient in eachcase is approximately 0.07 with a standard error of less than 0.03, so thismethod seems to confirm the role of inheritances/gifts in entrepreneur-ship equations and to suggest that the evidence for effects from capital isnot created by simultaneity bias. A 3-year preinheritance interval waschosen as a compromise between the need for as long a lag as possibleand the requirement that the number of observations not be too few.
The findings from these different sets of results—uninstrumented, in-strumented, and lagged—all find statistically significant inheritance ef-fects and are thus consistent with the existence of capital constraints. Thesize of the inheritance/gift effects is large. From the probit equations itis possible to calculate that individuals who had received £5,000 ($9,000)in constant 1981 pounds sterling were approximately twice as likely tobe self-employed in 1981 as those who had received nothing (the instru-mental variable [IV] estimates are even greater, and perhaps implausiblylarge) . For example, a male in the southeast of England, with an appren-ticeship and whose father was a manager in a workplace with under 25employees, had a probability of 0.16 of being self-employed without aninheritance and/or gift. This probability was 0.37 if he had received aninheritance of £5,000. In the case of females, the probabilities were 0.07and 0.21, respectively. This seems a big effect even when contrasted withthe Evans-Jovanovic estimate that removing all liquidity constraintswould increase the flow of entrepreneurs from 3.8% to 5.1% (Evans andJovanovic 1989, p. 824) . The likely explanation—apart from possibleU.S. and UK differences and the need for caution in interpreting allestimates in early work in a field—is that capital constraints bind moreon the young.
It might be argued that age 23 is too young to study self-employedpeople. Hence, table 4 re-does the analysis for the 1991 sweep of thepanel, that is, when these individuals were age 33. Table 4 provides aprobit equation for self-employment at that date. It is designed to be closein specification to the earlier tables and continues to find an apparentlypowerful correlation between self-employment status and having receivedan inheritance or gift. The sample consists of individuals in employmentat the time of interview in 1991 when the respondents were 33 years ofage. As in tables 2 and 3, the dependent variable is set to one if self-employed in the main activity and to zero otherwise. The self-employedwere only slightly more likely to have received an inheritance than theemployed (29% compared with 27.4%, respectively) , but the amountreceived was much higher (the mean level of inheritance received was£4,692 for the employed and £11,148 for the self-employed).
/ 9e0e$$ja14 11-17-97 13:11:40 laeca UC: Labor Econ
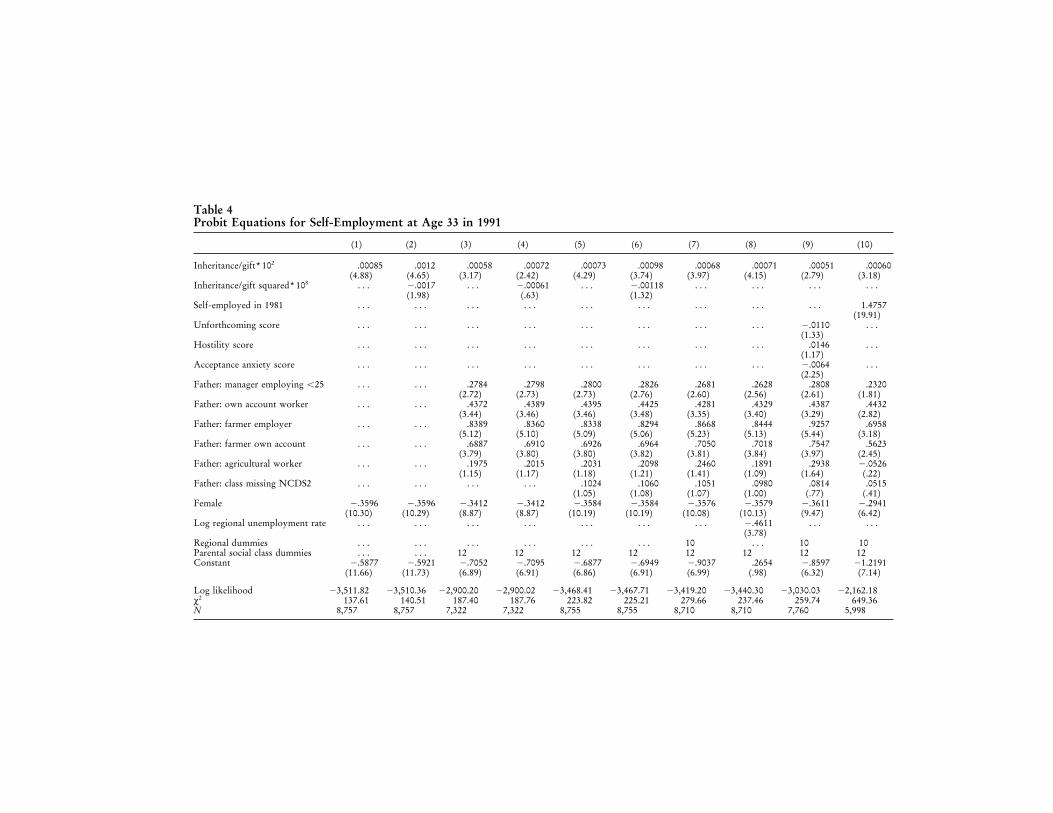
Table 4Probit Equations for Self-Employment at Age 33 in 1991
(1) (2) (3) (4) (5) (6) (7) (8) (9) (10)
Inheritance/gift∗102 .00085 .0012 .00058 .00072 .00073 .00098 .00068 .00071 .00051 .00060(4.88) (4.65) (3.17) (2.42) (4.29) (3.74) (3.97) (4.15) (2.79) (3.18)
Inheritance/gift squared∗108 . . . 0.0017 . . . 0.00061 . . . 0.00118 . . . . . . . . . . . .(1.98) (.63) (1.32)
Self-employed in 1981 . . . . . . . . . . . . . . . . . . . . . . . . . . . 1.4757(19.91)
Unforthcoming score . . . . . . . . . . . . . . . . . . . . . . . . 0.0110 . . .(1.33)
Hostility score . . . . . . . . . . . . . . . . . . . . . . . . .0146 . . .(1.17)
Acceptance anxiety score . . . . . . . . . . . . . . . . . . . . . . . . 0.0064 . . .(2.25)
Father: manager employing õ25 . . . . . . .2784 .2798 .2800 .2826 .2681 .2628 .2808 .2320(2.72) (2.73) (2.73) (2.76) (2.60) (2.56) (2.61) (1.81)
Father: own account worker . . . . . . .4372 .4389 .4395 .4425 .4281 .4329 .4387 .4432(3.44) (3.46) (3.46) (3.48) (3.35) (3.40) (3.29) (2.82)
Father: farmer employer . . . . . . .8389 .8360 .8338 .8294 .8668 .8444 .9257 .6958(5.12) (5.10) (5.09) (5.06) (5.23) (5.13) (5.44) (3.18)
Father: farmer own account . . . . . . .6887 .6910 .6926 .6964 .7050 .7018 .7547 .5623(3.79) (3.80) (3.80) (3.82) (3.81) (3.84) (3.97) (2.45)
Father: agricultural worker . . . . . . .1975 .2015 .2031 .2098 .2460 .1891 .2938 0.0526(1.15) (1.17) (1.18) (1.21) (1.41) (1.09) (1.64) (.22)
Father: class missing NCDS2 . . . . . . . . . . . . .1024 .1060 .1051 .0980 .0814 .0515(1.05) (1.08) (1.07) (1.00) (.77) (.41)
Female 0.3596 0.3596 0.3412 0.3412 0.3584 0.3584 0.3576 0.3579 0.3611 0.2941(10.30) (10.29) (8.87) (8.87) (10.19) (10.19) (10.08) (10.13) (9.47) (6.42)
Log regional unemployment rate . . . . . . . . . . . . . . . . . . . . . 0.4611 . . . . . .(3.78)
Regional dummies . . . . . . . . . . . . . . . . . . 10 . . . 10 10Parental social class dummies . . . . . . 12 12 12 12 12 12 12 12Constant 0.5877 0.5921 0.7052 0.7095 0.6877 0.6949 0.9037 .2654 0.8597 01.2191
(11.66) (11.73) (6.89) (6.91) (6.86) (6.91) (6.99) (.98) (6.32) (7.14)
Log likelihood 03,511.82 03,510.36 02,900.20 02,900.02 03,468.41 03,467.71 03,419.20 03,440.30 03,030.03 02,162.18x2 137.61 140.51 187.40 187.76 223.82 225.21 279.66 237.46 259.74 649.36N 8,757 8,757 7,322 7,322 8,755 8,755 8,710 8,710 7,760 5,998
/9e0e$$ja1411-17-97
13:11:40laeca
UC
:L
aborE
con
42 Blanchflower/Oswald
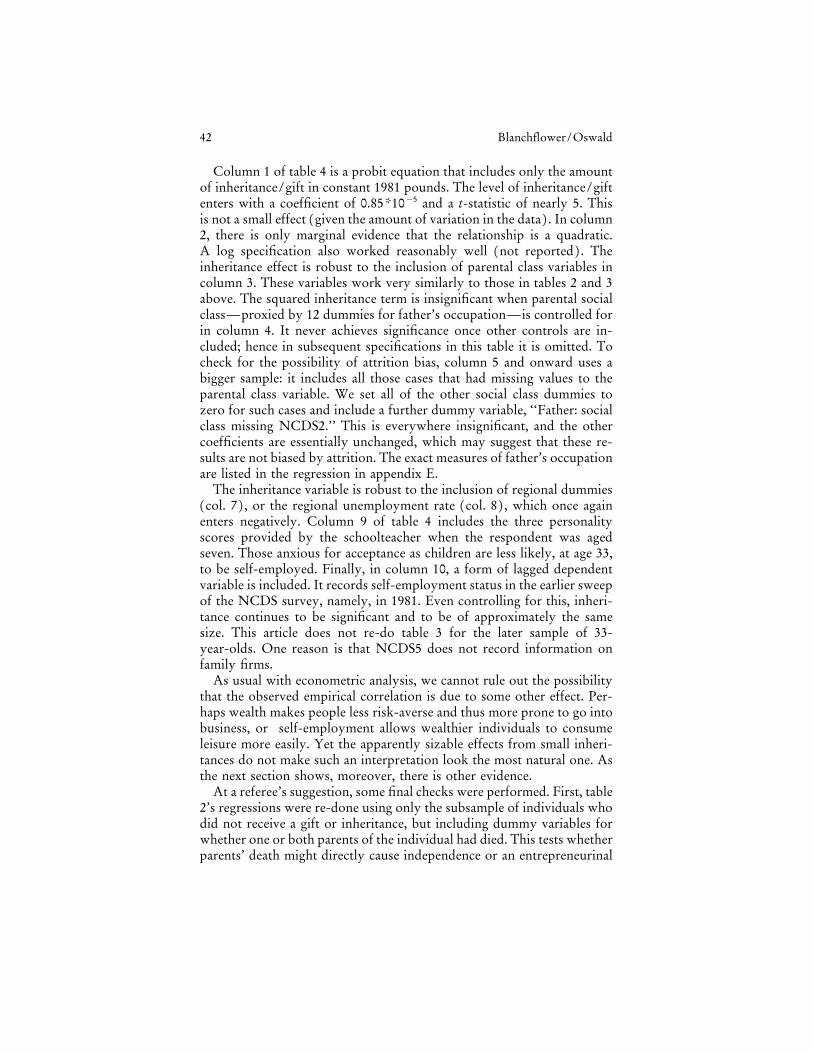
Column 1 of table 4 is a probit equation that includes only the amountof inheritance/gift in constant 1981 pounds. The level of inheritance/giftenters with a coefficient of 0.85*1005 and a t-statistic of nearly 5. Thisis not a small effect (given the amount of variation in the data) . In column2, there is only marginal evidence that the relationship is a quadratic.A log specification also worked reasonably well (not reported) . Theinheritance effect is robust to the inclusion of parental class variables incolumn 3. These variables work very similarly to those in tables 2 and 3above. The squared inheritance term is insignificant when parental socialclass—proxied by 12 dummies for father’s occupation—is controlled forin column 4. It never achieves significance once other controls are in-cluded; hence in subsequent specifications in this table it is omitted. Tocheck for the possibility of attrition bias, column 5 and onward uses abigger sample: it includes all those cases that had missing values to theparental class variable. We set all of the other social class dummies tozero for such cases and include a further dummy variable, ‘‘Father: socialclass missing NCDS2.’’ This is everywhere insignificant, and the othercoefficients are essentially unchanged, which may suggest that these re-sults are not biased by attrition. The exact measures of father’s occupationare listed in the regression in appendix E.
The inheritance variable is robust to the inclusion of regional dummies(col. 7) , or the regional unemployment rate (col. 8) , which once againenters negatively. Column 9 of table 4 includes the three personalityscores provided by the schoolteacher when the respondent was agedseven. Those anxious for acceptance as children are less likely, at age 33,to be self-employed. Finally, in column 10, a form of lagged dependentvariable is included. It records self-employment status in the earlier sweepof the NCDS survey, namely, in 1981. Even controlling for this, inheri-tance continues to be significant and to be of approximately the samesize. This article does not re-do table 3 for the later sample of 33-year-olds. One reason is that NCDS5 does not record information onfamily firms.
As usual with econometric analysis, we cannot rule out the possibilitythat the observed empirical correlation is due to some other effect. Per-haps wealth makes people less risk-averse and thus more prone to go intobusiness, or self-employment allows wealthier individuals to consumeleisure more easily. Yet the apparently sizable effects from small inheri-tances do not make such an interpretation look the most natural one. Asthe next section shows, moreover, there is other evidence.
At a referee’s suggestion, some final checks were performed. First, table2’s regressions were re-done using only the subsample of individuals whodid not receive a gift or inheritance, but including dummy variables forwhether one or both parents of the individual had died. This tests whetherparents’ death might directly cause independence or an entrepreneurinal
/ 9e0e$$ja14 11-17-97 13:11:40 laeca UC: Labor Econ

43What Makes an Entrepreneur?
Table 5How Seriously Have You Considered Becoming Self-Employed? (%)
Very Quite Not Very Not at AllSeriously Seriously Seriously Seriously N
1983 5.3 11.9 12.6 70.2 7791984 6.6 10.3 12.3 70.7 7241986 6.1 9.5 14.2 69.9 1,4701987 4.9 9.7 14.0 71.4 1,2731989 5.9 9.9 11.8 72.5 1,691
All 5.7 10.1 13.0 71.1 5,932
SOURCE.—British Social Attitudes Surveys (weighted). Own calculations.NOTE.—Base: all individuals who were employees when interviewed and who had never been self-
employed in the preceding 5 years.
spirit. However, reassuringly for this article, the parental-death dummyvariables were grossly insignificant. Second, for a subsample of individualswho had had no inheritance or gift prior to 1981, a probit equation wasestimated to see if those who had a gift/ inheritance between 1981 and1991 were more likely to have have been self-employed in 1981. Thistests the idea that any crucial omitted variables—linking self-employmentand inheritances through other, possibly unknown, mechanisms—wouldprobably begin to have an effect before the gift/ inheritance was received.Supportively for our conclusions, however, the variable for being self-employed in 1981 entered with a t-statistic of only 0.1. These two checksseem to be consistent with our favored approach.
V. Interview Evidence on Capital Constraints
New survey findings are consistent with the idea that both currentand potential self-employed business owners feel constrained by limitedcapital. Our aim in this section is to provide evidence more direct than,and complementary to, that reported in the previous section. Twopreviously unexploited sources of information are used. The first isthe British Social Attitudes (BSA) Survey series, an annual random sam-ple providing data from 1983 to 1989. The second is a 1987 govern-ment-sponsored random survey, the National Survey of the Self-Employed (NSS).
The BSA survey asked 5,947 randomly chosen employees who had notbeen self-employed in the previous 5 years (97.1% of all employees) thequestion, ‘‘How seriously have you considered being self-employed?’’The answers are given in table 5. On average, 16.8% had consideredrunning their own business either ‘‘very seriously’’ or ‘‘quite seriously.’’In 1983, 1984, and 1986 a subsample of 451 respondents who had consid-ered it very or quite seriously were asked the follow-up question, ‘‘Whydid you not become self-employed?’’ The answers, which were recorded
/ 9e0e$$ja14 11-17-97 13:11:40 laeca UC: Labor Econ
44 Blanchflower/Oswald
Table 6What Was the Reason You Did Not Become Self-Employed? (%)
Lack of Economic OtherYear Capital/Money Risk Climate Reasons N
1983 59.3 10.2 2.5 28.0 1181984 56.0 12.1 .9 31.0 1161986 44.7 22.1 .9 32.3 217
All 51.3 10.6 1.3 31.2 451
SOURCE.—British Social Attitudes Survey Series (weighted). Own calculations.NOTE.—Base: employees who reported that they had considered becoming self-employed ‘‘very
seriously’’ or ‘‘quite seriously’’ in table 4.
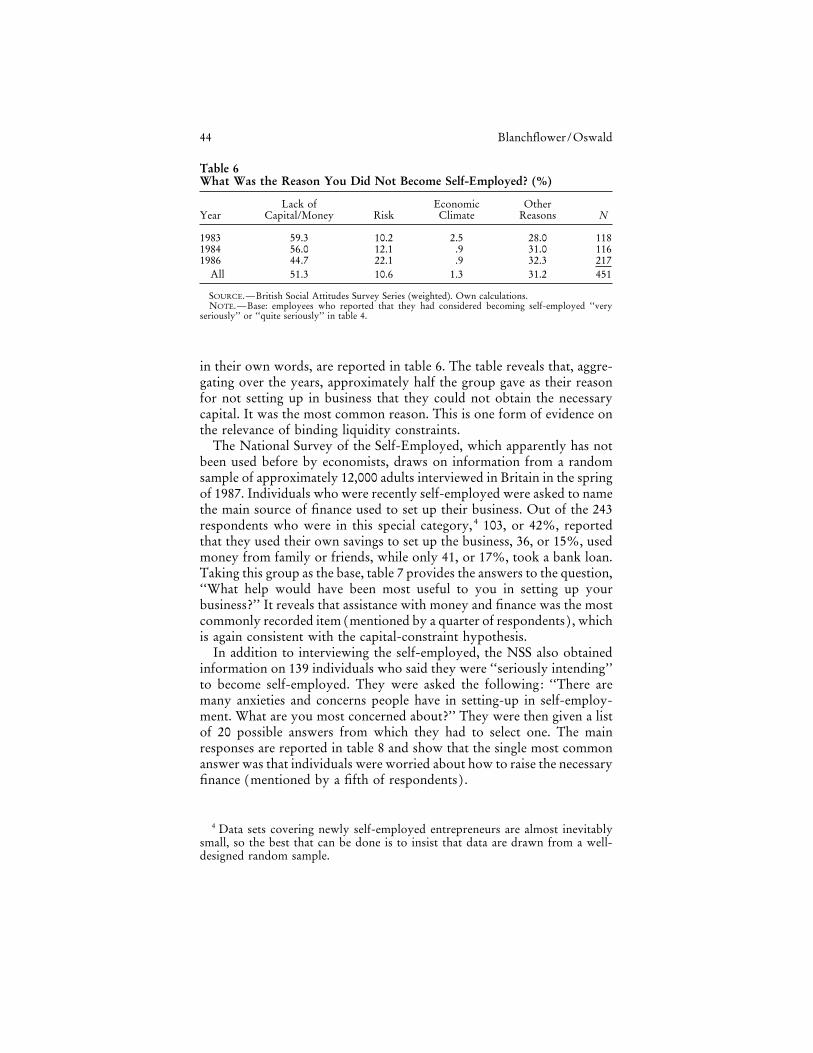
in their own words, are reported in table 6. The table reveals that, aggre-gating over the years, approximately half the group gave as their reasonfor not setting up in business that they could not obtain the necessarycapital. It was the most common reason. This is one form of evidence onthe relevance of binding liquidity constraints.
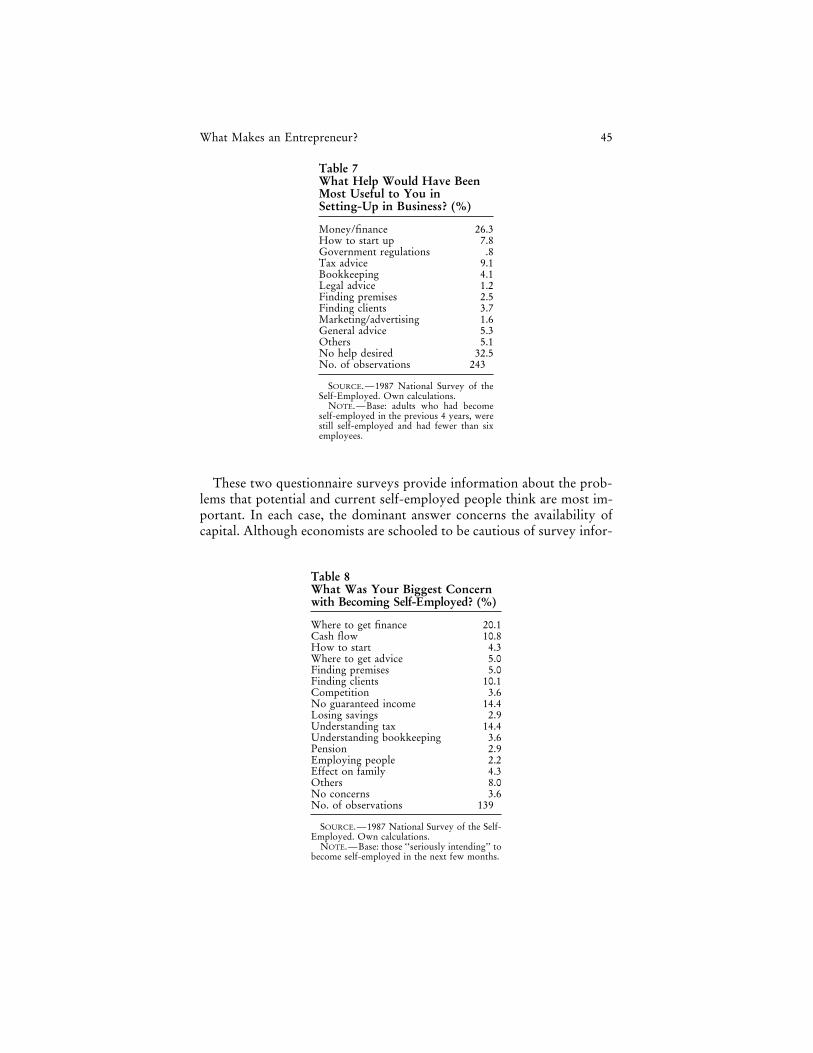
The National Survey of the Self-Employed, which apparently has notbeen used before by economists, draws on information from a randomsample of approximately 12,000 adults interviewed in Britain in the springof 1987. Individuals who were recently self-employed were asked to namethe main source of finance used to set up their business. Out of the 243respondents who were in this special category,4 103, or 42%, reportedthat they used their own savings to set up the business, 36, or 15%, usedmoney from family or friends, while only 41, or 17%, took a bank loan.Taking this group as the base, table 7 provides the answers to the question,‘‘What help would have been most useful to you in setting up yourbusiness?’’ It reveals that assistance with money and finance was the mostcommonly recorded item (mentioned by a quarter of respondents) , whichis again consistent with the capital-constraint hypothesis.
In addition to interviewing the self-employed, the NSS also obtainedinformation on 139 individuals who said they were ‘‘seriously intending’’to become self-employed. They were asked the following: ‘‘There aremany anxieties and concerns people have in setting-up in self-employ-ment. What are you most concerned about?’’ They were then given a listof 20 possible answers from which they had to select one. The mainresponses are reported in table 8 and show that the single most commonanswer was that individuals were worried about how to raise the necessaryfinance (mentioned by a fifth of respondents) .
4 Data sets covering newly self-employed entrepreneurs are almost inevitablysmall, so the best that can be done is to insist that data are drawn from a well-designed random sample.
/ 9e0e$$ja14 11-17-97 13:11:40 laeca UC: Labor Econ
45What Makes an Entrepreneur?
Table 7What Help Would Have BeenMost Useful to You inSetting-Up in Business? (%)
Money/finance 26.3How to start up 7.8Government regulations .8Tax advice 9.1Bookkeeping 4.1Legal advice 1.2Finding premises 2.5Finding clients 3.7Marketing/advertising 1.6General advice 5.3Others 5.1No help desired 32.5No. of observations 243
SOURCE.—1987 National Survey of theSelf-Employed. Own calculations.
NOTE.—Base: adults who had becomeself-employed in the previous 4 years, werestill self-employed and had fewer than sixemployees.
These two questionnaire surveys provide information about the prob-lems that potential and current self-employed people think are most im-portant. In each case, the dominant answer concerns the availability ofcapital. Although economists are schooled to be cautious of survey infor-
Table 8What Was Your Biggest Concernwith Becoming Self-Employed? (%)
Where to get finance 20.1Cash flow 10.8How to start 4.3Where to get advice 5.0Finding premises 5.0Finding clients 10.1Competition 3.6No guaranteed income 14.4Losing savings 2.9Understanding tax 14.4Understanding bookkeeping 3.6Pension 2.9Employing people 2.2Effect on family 4.3Others 8.0No concerns 3.6No. of observations 139
SOURCE.—1987 National Survey of the Self-Employed. Own calculations.
NOTE.—Base: those ‘‘seriously intending’’ tobecome self-employed in the next few months.
/ 9e0e$$ja14 11-17-97 13:11:40 laeca UC: Labor Econ
46 Blanchflower/Oswald
Table 9Overall Satisfaction with Job: Age 23 in 1981
% Answering Self-Employed Employees All Workers
Very dissatisfied 1.7 2.8 2.8Dissatisfied 2.9 9.6 9.2Neither 6.7 8.2 8.1Satisfied 42.4 50.2 49.8Very satisfied 46.2 29.1 30.1N 519 8,657 9,176
SOURCE.—National Child Development Study, 1981.NOTE.—Base: individuals in employment at the time of interview.
mation, it seems unlikely that there is nothing to be learned from thiscommon message from different surveys. They appear to sit consistentlyalongside the estimation results.
VI. Testing Whether the Self-Employed Are Happier
The model implies (proposition 3) that those running their own enter-prises will be happier than employees. For a test of this, it is necessaryto compare the total returns to conventional work and entrepreneurialactivity. The reported earnings of self-employed individuals are knownto be unreliable, and it is likely, as the model suggests, that such individu-als get a nonpecuniary benefit from being their own boss. Hence, someproxy for overall utility is required. We follow the psychology literaturein using survey data on job and life satisfaction. It is established there(see, e.g., Warr 1985 and Argyle 1989) that reported satisfaction numbersare highly correlated with observable measures of individual well-beingat work such as quitting behavior and physiological symptoms. The smalleconomics literature includes Hamermesh (1977) , Freeman (1978) , Bor-jas (1979) , Schwochau (1987) , Meng (1990) , Miller (1990) , Clark andOswald (1994, 1996) , and Blanchflower and Freeman (1994) .
The central issue is whether, ceteris paribus, the self-employed reporthigher levels of overall utility or job satisfaction than do employees. TheNational Child Development Study is again a valuable data source. Afterasking each 23-year-old individual how satisfied they were with a rangeof items, such as pay and working conditions, the following encompassingquestion was asked: ‘‘Taking everything into consideration, how satisfiedor dissatisfied are you with your job as a whole?’’ (NCDS4 questionnaire,question 19, p. 9) . Preliminary questions were asked about individualcomponents of utility. Respondents presumably saw this question as re-questing information on their entire ‘‘utility package,’’ and this makesthe answers potentially useful.
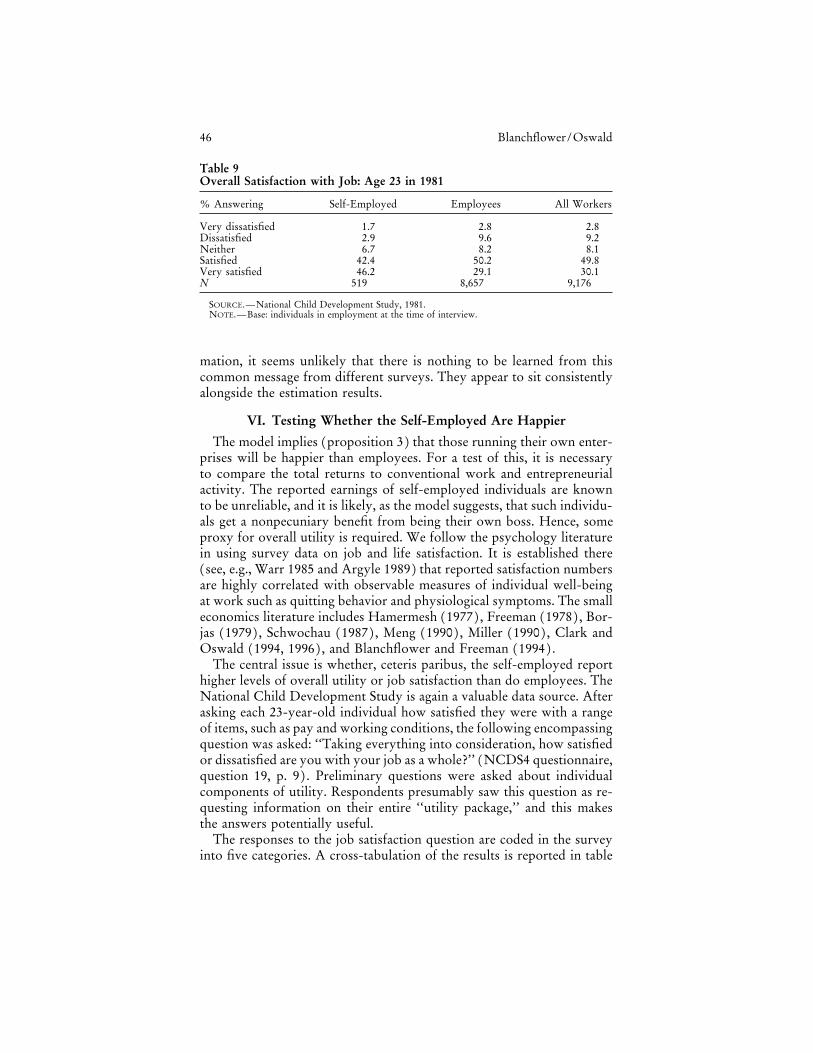
The responses to the job satisfaction question are coded in the surveyinto five categories. A cross-tabulation of the results is reported in table
/ 9e0e$$ja14 11-17-97 13:11:40 laeca UC: Labor Econ
47What Makes an Entrepreneur?
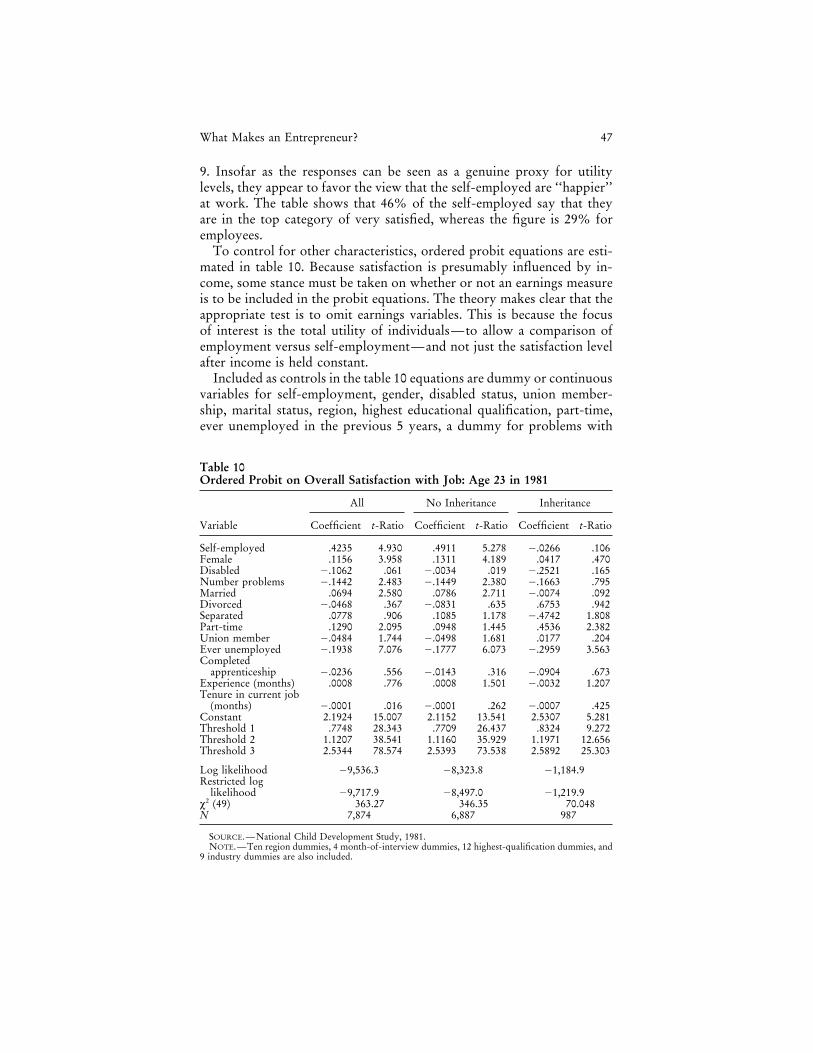
9. Insofar as the responses can be seen as a genuine proxy for utilitylevels, they appear to favor the view that the self-employed are ‘‘happier’’at work. The table shows that 46% of the self-employed say that theyare in the top category of very satisfied, whereas the figure is 29% foremployees.
To control for other characteristics, ordered probit equations are esti-mated in table 10. Because satisfaction is presumably influenced by in-come, some stance must be taken on whether or not an earnings measureis to be included in the probit equations. The theory makes clear that theappropriate test is to omit earnings variables. This is because the focusof interest is the total utility of individuals—to allow a comparison ofemployment versus self-employment—and not just the satisfaction levelafter income is held constant.
Included as controls in the table 10 equations are dummy or continuousvariables for self-employment, gender, disabled status, union member-ship, marital status, region, highest educational qualification, part-time,ever unemployed in the previous 5 years, a dummy for problems with
Table 10Ordered Probit on Overall Satisfaction with Job: Age 23 in 1981
All No Inheritance Inheritance
Variable Coefficient t-Ratio Coefficient t-Ratio Coefficient t-Ratio
Self-employed .4235 4.930 .4911 5.278 0.0266 .106Female .1156 3.958 .1311 4.189 .0417 .470Disabled 0.1062 .061 0.0034 .019 0.2521 .165Number problems 0.1442 2.483 0.1449 2.380 0.1663 .795Married .0694 2.580 .0786 2.711 0.0074 .092Divorced 0.0468 .367 0.0831 .635 .6753 .942Separated .0778 .906 .1085 1.178 0.4742 1.808Part-time .1290 2.095 .0948 1.445 .4536 2.382Union member 0.0484 1.744 0.0498 1.681 .0177 .204Ever unemployed 0.1938 7.076 0.1777 6.073 0.2959 3.563Completed
apprenticeship 0.0236 .556 0.0143 .316 0.0904 .673Experience (months) .0008 .776 .0008 1.501 0.0032 1.207Tenure in current job
(months) 0.0001 .016 0.0001 .262 0.0007 .425Constant 2.1924 15.007 2.1152 13.541 2.5307 5.281Threshold 1 .7748 28.343 .7709 26.437 .8324 9.272Threshold 2 1.1207 38.541 1.1160 35.929 1.1971 12.656Threshold 3 2.5344 78.574 2.5393 73.538 2.5892 25.303
Log likelihood 09,536.3 08,323.8 01,184.9Restricted log
likelihood 09,717.9 08,497.0 01,219.9x2 (49) 363.27 346.35 70.048N 7,874 6,887 987
SOURCE.—National Child Development Study, 1981.NOTE.—Ten region dummies, 4 month-of-interview dummies, 12 highest-qualification dummies, and
9 industry dummies are also included.
/ 9e0e$$ja14 11-17-97 13:11:40 laeca UC: Labor Econ
48 Blanchflower/Oswald
arithmetic, months of experience, and job tenure. Month-of-interviewdummies are included. A set of industry dummies are also included intable 10. It is apparent that the self-employment dummy variable is sig-nificant. It was so in all specifications, including those with few controlvariables. Consistent with the cross-tabulations presented in table 9, self-employment has a positive effect on reported satisfaction levels (one thatis quantitatively large) . As the equations exclude income measures, theself-employment variables are not capturing merely the nonmonetaryreturn to being one’s own boss but, rather, a mixture of money and otherthings. Given the paucity of work with data like these, the other controlsmay also be of interest. Women are more satisfied; married people arealso more satisfied. Those who have been unemployed are less satisfied.Union members are marginally less content: this replicates the main find-ing of the earlier literature of Freeman (1978) and Borjas (1979) . Lowqualifications (in results not reported) and part-time work are also posi-tively associated with satisfaction—perhaps reflecting the low-aspirationeffects discussed in Clark and Oswald (1996) .
As an experiment into the effects of access to capital, the data weresplit into two subsamples. The second set of columns of table 10 isestimated with data on the 6,887 people who reported themselves ashaving received no inheritance or gift of money or goods exceeding £500.The third set of columns of table 10 gives estimates for the subsample of987 people who had received this kind of inheritance or gift. There isevidence that the self-employment dummy variable has little effect in thegroup who inherited; the dummy even goes negative. Such evidence mightbe taken to be consistent with the idea that those with capital—throughan inheritance—are more able to enter the self-employment sector anddrive down the rents available there. This argument can only be suggestivebut indicates an area where further research might be fruitful.
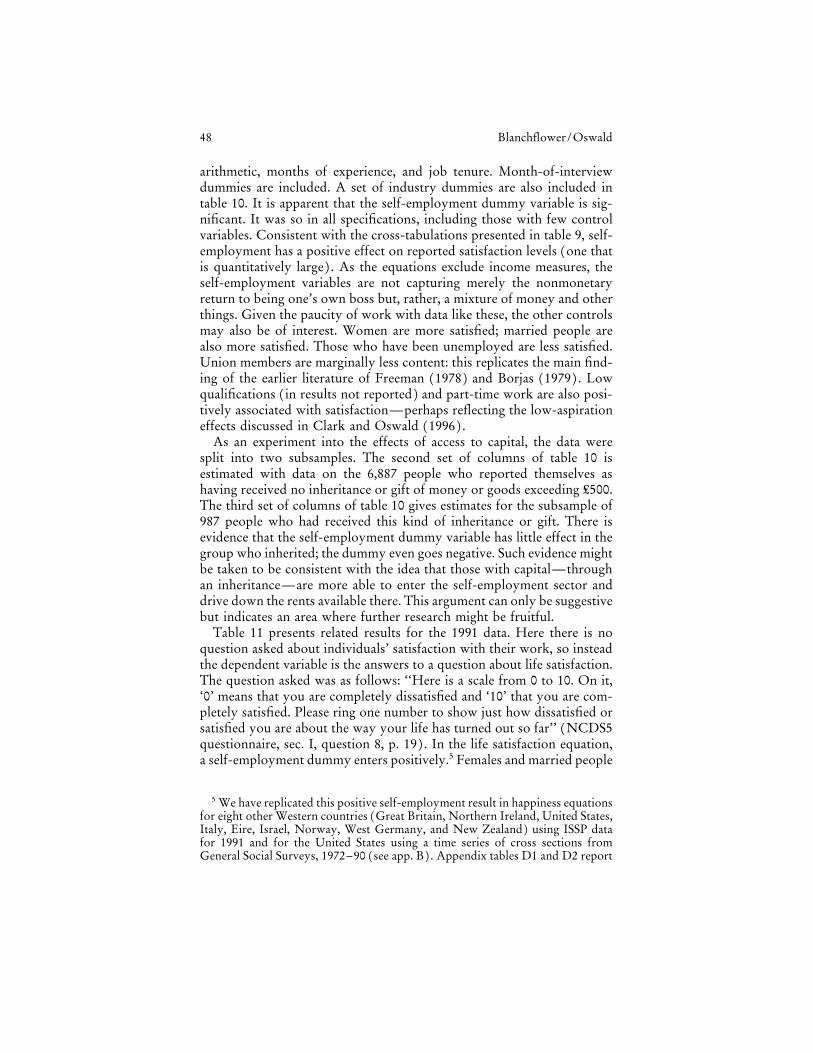
Table 11 presents related results for the 1991 data. Here there is noquestion asked about individuals’ satisfaction with their work, so insteadthe dependent variable is the answers to a question about life satisfaction.The question asked was as follows: ‘‘Here is a scale from 0 to 10. On it,‘0’ means that you are completely dissatisfied and ‘10’ that you are com-pletely satisfied. Please ring one number to show just how dissatisfied orsatisfied you are about the way your life has turned out so far’’ (NCDS5questionnaire, sec. I, question 8, p. 19) . In the life satisfaction equation,a self-employment dummy enters positively.5 Females and married people
5 We have replicated this positive self-employment result in happiness equationsfor eight other Western countries (Great Britain, Northern Ireland, United States,Italy, Eire, Israel, Norway, West Germany, and New Zealand) using ISSP datafor 1991 and for the United States using a time series of cross sections fromGeneral Social Surveys, 1972–90 (see app. B). Appendix tables D1 and D2 report
/ 9e0e$$ja14 11-17-97 13:11:40 laeca UC: Labor Econ
49What Makes an Entrepreneur?
Table 11Life-Satisfaction Equation: Age 33 in 1991
(1) (2) (3) (4) (5) (6)
Self-employed .1101 .1015 .1091 .1114 .1089 .1068(2.16) (2.00) (2.15) (2.18) (2.19) (2.11)
Female .0861 .1049 .1096 .0971 .0961 .1026(2.43) (3.05) (3.18) (2.74) (2.71) (2.95)
Ever married . . . 1.1187 1.1180 1.1132 1.0989 1.0998(25.62) (25.52) (25.26) (24.81) (25.30)
Union member . . . .0995 .1085 .0911 .0816 .0929(2.74) (2.98) (2.48) (2.20) (2.55)
Race dummies . . . . . . 7 7 7 7Qualification
dummies . . . . . . . . . 11 11 11Region dummies . . . . . . . . . . . . 10 10Health dummies . . . . . . . . . . . . . . . 4Constant 7.3385 6.3630 6.3624 6.3096 6.3943 6.8966
(133.12) (94.97) (94.65) (71.87) (56.11) (59.84)
RV 2 .0009 .0739 .0745 .0773 .0790 .1240F 4.78 168.16 61.85 32.04 22.75 32.40N 8,442 8,385 8,318 8,153 8,113 8,046
SOURCE.—National Child Development Study, 1991.NOTE.— t-statistics are in parentheses. The dependent variable is ‘‘satisfaction with the way life has
turned out.’’ It is scored from a minimum of zero to a maximum of ten. This is an OLS regression.Means of life satisfaction: self-employed 7.561 and employees 7.464.
are significantly more satisfied. The union dummy here enters positively,suggesting that such people are happier even if (as in the earlier table 10)they may be less satisfied with their job. It is difficult to know what tomake of this difference. Columns 1–6 build up to a specification includingpersonal and regional variables. The finding that the self-employed arehappier appears to be robust.
These results provide some evidence that entrepreneurs get higher util-ity than conventional employees. One caveat should be borne in mindwhen interpreting this study’s findings. The use of satisfaction and happi-ness data to proxy utility levels is unconventional in economics research.It may be that reported satisfaction levels are subject to important biases.For example, self-employed people may be intrinsically more optimisticand cheerful than others, or may feel psychologically compelled, becausetheir business is in their own hands, to answer in the way they do.Nevertheless, at this juncture a more straightforward interpretation ofthe data is that the self-employed really are happier.
the exact questions asked, the distribution of responses, and ordered probitsequations for happiness. In both cases, self-employment has a significant positiveeffect. Clark and Oswald (1994) , using a medical measure of psychiatric health,uncover a somewhat different result, namely, that the self-employed are morehighly stressed than are employees.
/ 9e0e$$ja14 11-17-97 13:11:40 laeca UC: Labor Econ
50 Blanchflower/Oswald
VII. Conclusions
The forces that affect the supply of entrepreneurship are widely viewedas important but poorly understood. We use survey and microecono-metric methods to study a simple class of entrepreneurs, namely, individu-als who run their own businesses. We draw upon data from the NationalChild Development Study, the British Social Attitude Surveys, the Inter-national Social Survey Programme, the U.S. General Social Surveys, andthe National Survey of the Self-Employed.
The empirical results are consistent with the hypothesis that entrepre-neurs face finance and liquidity constraints. In an ideal world, this wouldbe studied by constructing a laboratory or field experiment. In such anexperiment, the behavior of a group of individuals who are randomlygiven capital would be compared with the behavior of people in a controlgroup who are given nothing. Such an approach is probably not feasiblein a subject like economics. However, a natural experiment in the samespirit is generated by the fact that some individuals receive inheritancesand gifts.
In the first part of the article, a theoretical model was constructed inwhich capital-constrained individuals choose between employment andself-employment. The main idea is a simple one. It is that entrepreneurialprojects are, by their nature, difficult for bankers to assess probabilis-tically. Hence, those bankers are likely to require collateral, and that inturn may hold back potential entrepreneurs. Consistent with this, theempirical analysis produces four main conclusions.
1. The receipt of an inheritance or gift seems to increase a typicalindividual’s probability, ceteris paribus, of being self-employed. Thisemerges from NCDS data. It is not an estimate of the effect of capitalavailability upon transitions into self-employment6 but, rather—and per-haps more relevant to policy—an estimate of the lasting effect upon thestock of people running their own businesses. The inheritance effect isfound both at age 23 and at age 33. It is especially large among theyounger group (perhaps because older people have other ways to acquirecapital) .
2. Consistent with the model developed, ISSP data reveal that surpris-ingly large numbers of people in the industrialized countries say theywould prefer to be self-employed, and NCDS data demonstrate that thosewho are self-employed report themselves as more satisfied, ceteris paribus,
6 The usual reason that economists favor studies of transitions is because across-section typically does not provide data on the timing of events. This reasonis inapplicable here: table 2 gives estimates using inheritances/gifts that werereceived well before self-employment.
/ 9e0e$$ja14 11-17-97 13:11:40 laeca UC: Labor Econ
51What Makes an Entrepreneur?
than employees. Complementary international evidence about the happi-ness of the self-employed is reported in appendix D.
3. Faced with the question, ‘‘Why did you not become self-employed?’’the most common survey response given by a random sample of workersin the BSA survey was to cite shortage of capital and money.
4. The NSS data indicate that most small businesses were begun notwith bank loans but with own or family money, that individual entrepre-neurs felt they had needed most help with finance, and that the singlebiggest concern of potential entrepreneurs was with where to obtaincapital.7
When this research began, a key motivation was to study the impactof psychological traits on entrepreneurship. The NCDS data series is wellsuited to this task, because it records the outcome of psychological teststhat were done during childhood. In practice, however, only one clearcorrelation could be found. Although the effect is quantitatively small,those who were anxious for acceptance (when children) were less likelyto run their own businesses at age 33. Using the variables available here,psychology apparently does not play a key role in determining whobecomes an entrepreneur.
Appendix AProofs
Proofs of Propositions 1 and 2These are immediate from differentiation of equation 2.
Proof of Proposition 3It cannot be the case that p (k*) / iõ w, because entrepreneurs would
leave for the wage sector, which pays w. Thus, either marginal entrepre-neurial utility, p (k*) / i, is equal to w, or, because people are held backby capital constraints, it exceeds it. As p (k ) is a decreasing function—itis an array of decreasingly desirable projects—all other entrepreneursearn higher profit than the one operating the marginal project. Hence, allbut the marginal entrepreneur receives strictly more utility than regularworkers, and the marginal entrepreneur gets no less utility than regularworkers.
Proof of Proposition 4The sum of entrepreneurs’ utilities is given by
*k*
0[p (k ) / i ]dk, (A1)
and average entrepreneurial utility by
7 However, it should be recorded that in recent work Cressy (1996) reaches adifferent conclusion.
/ 9e0e$$ja14 11-17-97 13:11:40 laeca UC: Labor Econ
52 Blanchflower/Oswald
*k*
0[p (k ) / i ]dk
bZ. (A2)
Each worker in the wage sector gets utility equal to the wage w. Thereare P 0 bZ individuals working in that sector. This is because the supplyof entrepreneurs is constrained to be the product of b ( those with entre-preneurial vision) and Z ( those with capital) .
Assuming that the equilibrium is one where there is an aggregate shortageof individuals with capital, free entry does not eliminate the difference inreturns to the marginal entrepreneur between the wage sector and the entre-preneurial sector. Let the average utility gap between the entrepreneurialsector and the wage sector be denoted £. It is given algebraically by
v Å*bZ
0[p (k ) / i ]dk
bZ0 f * (P 0 bZ ), (A3)
where the latter term is the marginal product of labor in the wage sector.A rise in Z , the total number of individuals with sufficient capital to runtheir own business, increases the numbers setting up enterprises. Thisdrives down the marginal entrepreneurial return and, by inducing workersto leave the wage sector, raises the marginal product of labor there. Hencethe utility difference, v, changes by
ÌvÌZ
Å 1Z
[p (k*)/ i ]0 1bZ 2 *
bZ
0[p (k )/ i ]dk/ b f 9 (P0 bZ ). (A4)
The third of these three terms is unambiguously negative, by the concavityof the production function, so to establish the proposition it is sufficientto show that the first two terms sum to a negative number. Informallythis can be seen from the fact that the sum of these two terms equals oneover Z multiplied by the difference between the marginal entrepreneur’sreturn and the average entrepreneur’s return. A more formal proof canbe produced by using a mean value theorem.
Appendix B
Further Data Sources
1. British Social Attitudes Survey Series, 1983–89
This series of surveys, core-funded by the Sainsbury Family Trusts,was designed to chart movements in a wide range of social attitudesin Britain. The data derive from annual cross-sectional surveys from arepresentative sample of adults aged 18 or over living in private house-holds in Great Britain whose addresses were on the electoral register.
/ 9e0e$$ja14 11-17-97 13:11:40 laeca UC: Labor Econ

53What Makes an Entrepreneur?
The first three surveys involved around 1,800 adults; the numbers wereincreased to 3,000 in 1986. The sampling in each year involved a stratifiedmultistage design with four separate stages of selection. For further detailsof the survey designs, nonresponses, etc., see Jowell, Witherspoon, andBrook, British Social Attitudes, 1983, 1984, 1985, 1986, 1987, 1989, 1990.
2. National Survey of the Self-Employed, 1987In February and March 1987 the British Department of Employment
commissioned a nationally representative sample of 12,000 British adults.Interviews were then conducted with three subgroups drawn from thisinitial sample: past, present, and future self-employed. In this article, wefocus on the latter two groups. They were selected according to thefollowing criteria: (1) current self-employed—adults who had becomeself-employed in the previous 4 years, 1983–87, were still self-employed,and had fewer than six employees (243 interviews) ; and (2) potentialself-employed—adults who said they were ‘‘seriously intending’’ to takeup self-employment in the next 12 months (139 interviews) .
3. The International Social Survey Programme, 1989 and 1991The International Social Survey Programme (ISSP) is a voluntary
grouping of study teams (11 in 1989 and 13 in 1991) , each of whichundertakes to run a short, annual self-completion survey containing thesame set of questions in each country. The surveys are probability-basednational samples of adults. The topics change from year to year, with aview to replication every 5 years or so. Surveys are currently availablefor the years 1985–91.
4. The U.S. General Social Surveys, 1972–90The General Social Surveys (GSS) have been conducted by the National
Opinion Research Center at the University of Chicago for the years1972–90. There were no surveys in 1979 and 1981. Each survey is anindependently drawn sample of English-speaking persons 18 years of ageor over, living in noninstitutional arrangements within the United States.
/ 9e0e$$ja14 11-17-97 13:11:40 laeca UC: Labor Econ
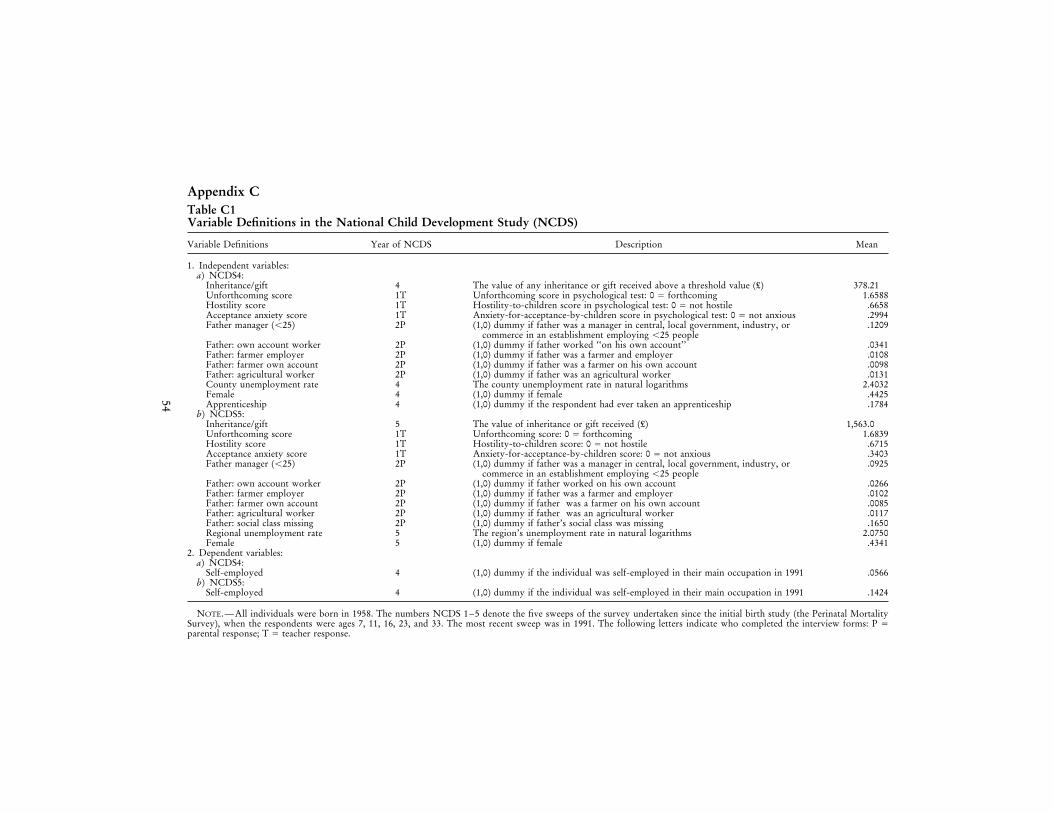
Appendix CTable C1Variable Definitions in the National Child Development Study (NCDS)
Variable Definitions Year of NCDS Description Mean
1. Independent variables:a) NCDS4:
Inheritance/gift 4 The value of any inheritance or gift received above a threshold value (£) 378.21Unforthcoming score 1T Unforthcoming score in psychological test: 0 Å forthcoming 1.6588Hostility score 1T Hostility-to-children score in psychological test: 0 Å not hostile .6658Acceptance anxiety score 1T Anxiety-for-acceptance-by-children score in psychological test: 0 Å not anxious .2994Father manager (õ25) 2P (1,0) dummy if father was a manager in central, local government, industry, or .1209
commerce in an establishment employing õ25 peopleFather: own account worker 2P (1,0) dummy if father worked ‘‘on his own account’’ .0341Father: farmer employer 2P (1,0) dummy if father was a farmer and employer .0108Father: farmer own account 2P (1,0) dummy if father was a farmer on his own account .0098Father: agricultural worker 2P (1,0) dummy if father was an agricultural worker .0131County unemployment rate 4 The county unemployment rate in natural logarithms 2.4032Female 4 (1,0) dummy if female .4425Apprenticeship 4 (1,0) dummy if the respondent had ever taken an apprenticeship .1784
b) NCDS5:Inheritance/gift 5 The value of inheritance or gift received (£) 1,563.0Unforthcoming score 1T Unforthcoming score: 0 Å forthcoming 1.6839Hostility score 1T Hostility-to-children score: 0 Å not hostile .6715Acceptance anxiety score 1T Anxiety-for-acceptance-by-children score: 0 Å not anxious .3403Father manager (õ25) 2P (1,0) dummy if father was a manager in central, local government, industry, or .0925
commerce in an establishment employing õ25 peopleFather: own account worker 2P (1,0) dummy if father worked on his own account .0266Father: farmer employer 2P (1,0) dummy if father was a farmer and employer .0102Father: farmer own account 2P (1,0) dummy if father was a farmer on his own account .0085Father: agricultural worker 2P (1,0) dummy if father was an agricultural worker .0117Father: social class missing 2P (1,0) dummy if father’s social class was missing .1650Regional unemployment rate 5 The region’s unemployment rate in natural logarithms 2.0750Female 5 (1,0) dummy if female .4341
2. Dependent variables:a) NCDS4:
Self-employed 4 (1,0) dummy if the individual was self-employed in their main occupation in 1991 .0566b) NCDS5:
Self-employed 4 (1,0) dummy if the individual was self-employed in their main occupation in 1991 .1424
NOTE.—All individuals were born in 1958. The numbers NCDS 1–5 denote the five sweeps of the survey undertaken since the initial birth study (the Perinatal MortalitySurvey), when the respondents were ages 7, 11, 16, 23, and 33. The most recent sweep was in 1991. The following letters indicate who completed the interview forms: P Åparental response; T Å teacher response.
54
/9e0e$$ja1411-17-97
13:11:40laeca
UC
:L
aborE
con
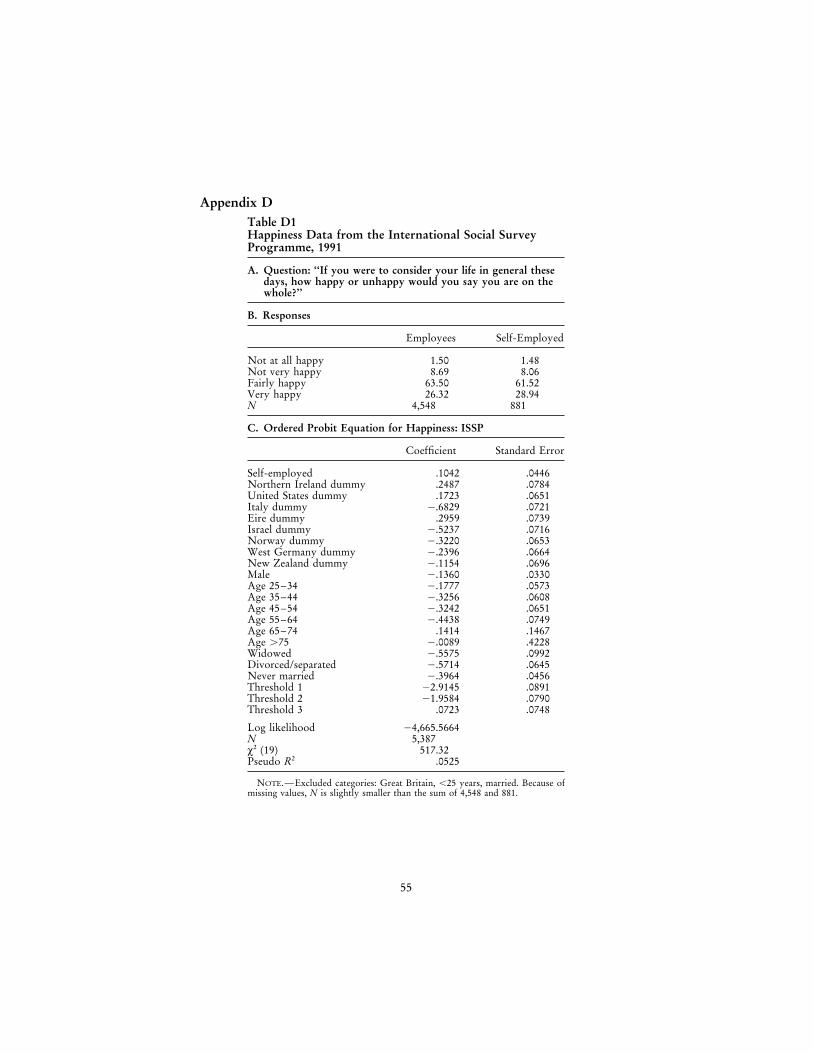
Appendix DTable D1Happiness Data from the International Social SurveyProgramme, 1991
A. Question: ‘‘If you were to consider your life in general thesedays, how happy or unhappy would you say you are on thewhole?’’
B. Responses
Employees Self-Employed
Not at all happy 1.50 1.48Not very happy 8.69 8.06Fairly happy 63.50 61.52Very happy 26.32 28.94N 4,548 881
C. Ordered Probit Equation for Happiness: ISSP
Coefficient Standard Error
Self-employed .1042 .0446Northern Ireland dummy .2487 .0784United States dummy .1723 .0651Italy dummy 0.6829 .0721Eire dummy .2959 .0739Israel dummy 0.5237 .0716Norway dummy 0.3220 .0653West Germany dummy 0.2396 .0664New Zealand dummy 0.1154 .0696Male 0.1360 .0330Age 25–34 0.1777 .0573Age 35–44 0.3256 .0608Age 45–54 0.3242 .0651Age 55–64 0.4438 .0749Age 65–74 .1414 .1467Age ú75 0.0089 .4228Widowed 0.5575 .0992Divorced/separated 0.5714 .0645Never married 0.3964 .0456Threshold 1 02.9145 .0891Threshold 2 01.9584 .0790Threshold 3 .0723 .0748
Log likelihood 04,665.5664N 5,387x2 (19) 517.32Pseudo R2 .0525
NOTE.—Excluded categories: Great Britain, õ25 years, married. Because ofmissing values, N is slightly smaller than the sum of 4,548 and 881.
55
/ 9e0e$$ja14 11-17-97 13:11:40 laeca UC: Labor Econ

Table D2Happiness Data from the U.S. General Social Surveys,1972–90
A. Question: ‘‘Taken all together, how would you say things arethese days—would you say that you are very happy, prettyhappy, or not too happy?’’
B. Responses
Employees Self-Employed
Not too happy 10.64 8.77Pretty happy 57.85 53.50Very happy 31.52 37.72N 13,238 1,983
C. Ordered Probit Equation for Happiness: GSS
Coefficient Standard Error
Self-employed .0729 .0285Male 0.1230 .0194Age 0.0216 .0046Age squared .0002 .0000Married .3669 .0279Widowed 0.2843 .0570Divorced 0.1444 .0385Separated 0.2203 .0561Ever unemployed last 5 years 0.1900 .0312Black 0.3253 .0293Other nonwhite 0.0067 .0677Years of schooling .0282 .0033Threshold 1 01.0829 .1108Threshold 2 .7158 .1107
Log likelihood 013,749.05N 15,221x2 (36) 1,034.08Pseudo R2 .0369
NOTE.—Equation also includes 8 region dummies and 16 year dummies. Excludedcategories are single and white.
Appendix ETable E1Gift/Inheritance Equations at Age 23 (NCDS4)
OLS, Tobit,Employed OLS, All Employed Tobit, All
(1) (2) (3) (4)
Male 98.0 80.2 839.9 851.5(1.40) (1.36) (1.99) (2.29)
Married 165.0 174.1 2,994.3 3,055.7(2.32) (2.97) (6.83) (8.02)
Mother only dead 428.5 281.5 3,713.4 2,924.4(2.14) (1.88) (3.48) (3.37)
Father only dead 276.6 237.3 3,645.7 3,183.9(2.15) (2.43) (5.15) (5.52)
Both dead 3,707.6 2,494.6 7,124.2 5,977.8(6.89) (6.60) (3.04) (3.31)
/ 9e0e$$ja14 11-17-97 13:11:40 laeca UC: Labor Econ
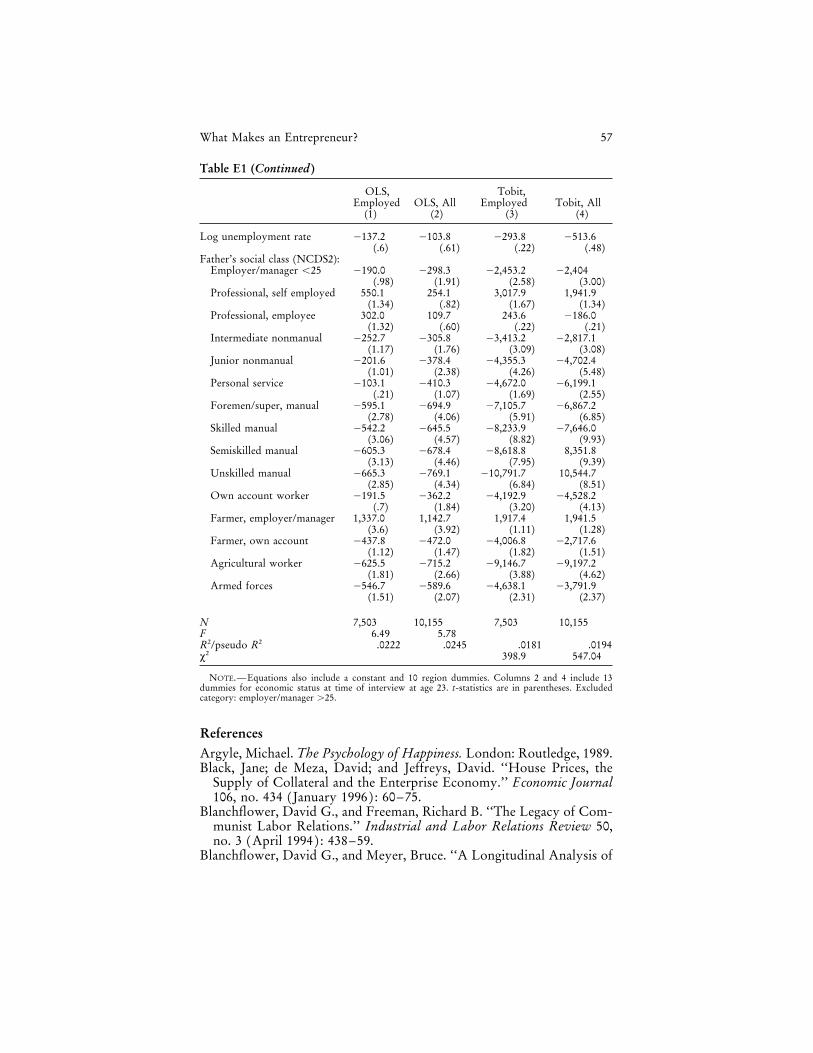
57What Makes an Entrepreneur?
Table E1 (Continued )
OLS, Tobit,Employed OLS, All Employed Tobit, All
(1) (2) (3) (4)
Log unemployment rate 0137.2 0103.8 0293.8 0513.6(.6) (.61) (.22) (.48)
Father’s social class (NCDS2):Employer/manager õ25 0190.0 0298.3 02,453.2 02,404
(.98) (1.91) (2.58) (3.00)Professional, self employed 550.1 254.1 3,017.9 1,941.9
(1.34) (.82) (1.67) (1.34)Professional, employee 302.0 109.7 243.6 0186.0
(1.32) (.60) (.22) (.21)Intermediate nonmanual 0252.7 0305.8 03,413.2 02,817.1
(1.17) (1.76) (3.09) (3.08)Junior nonmanual 0201.6 0378.4 04,355.3 04,702.4
(1.01) (2.38) (4.26) (5.48)Personal service 0103.1 0410.3 04,672.0 06,199.1
(.21) (1.07) (1.69) (2.55)Foremen/super, manual 0595.1 0694.9 07,105.7 06,867.2
(2.78) (4.06) (5.91) (6.85)Skilled manual 0542.2 0645.5 08,233.9 07,646.0
(3.06) (4.57) (8.82) (9.93)Semiskilled manual 0605.3 0678.4 08,618.8 8,351.8
(3.13) (4.46) (7.95) (9.39)Unskilled manual 0665.3 0769.1 010,791.7 10,544.7
(2.85) (4.34) (6.84) (8.51)Own account worker 0191.5 0362.2 04,192.9 04,528.2
(.7) (1.84) (3.20) (4.13)Farmer, employer/manager 1,337.0 1,142.7 1,917.4 1,941.5
(3.6) (3.92) (1.11) (1.28)Farmer, own account 0437.8 0472.0 04,006.8 02,717.6
(1.12) (1.47) (1.82) (1.51)Agricultural worker 0625.5 0715.2 09,146.7 09,197.2
(1.81) (2.66) (3.88) (4.62)Armed forces 0546.7 0589.6 04,638.1 03,791.9
(1.51) (2.07) (2.31) (2.37)
N 7,503 10,155 7,503 10,155F 6.49 5.78R2/pseudo R2 .0222 .0245 .0181 .0194x2 398.9 547.04
NOTE.—Equations also include a constant and 10 region dummies. Columns 2 and 4 include 13dummies for economic status at time of interview at age 23. t-statistics are in parentheses. Excludedcategory: employer/manager ú25.
ReferencesArgyle, Michael. The Psychology of Happiness. London: Routledge, 1989.Black, Jane; de Meza, David; and Jeffreys, David. ‘‘House Prices, the
Supply of Collateral and the Enterprise Economy.’’ Economic Journal106, no. 434 (January 1996) : 60–75.
Blanchflower, David G., and Freeman, Richard B. ‘‘The Legacy of Com-munist Labor Relations.’’ Industrial and Labor Relations Review 50,no. 3 (April 1994) : 438–59.
Blanchflower, David G., and Meyer, Bruce. ‘‘A Longitudinal Analysis of
/ 9e0e$$ja14 11-17-97 13:11:40 laeca UC: Labor Econ
58 Blanchflower/Oswald
the Young Self-Employed in Australia and the United States.’’ SmallBusiness Economics 6 (February 1994) : 1–20.
Blanchflower, David G., and Oswald, Andrew J. ‘‘Self-Employment andthe Enterprise Culture.’’ In British Social Attitudes: The 1990 Report,edited by R. Jowell, S. Witherspoon, and L. Brook, Aldershot: GowerPress, 1990. (a )
. ‘‘What Makes a Young Entrepreneur?’’ Working Paper 3252.Cambridge, MA, National Bureau of Economic Research, 1990. (b )
Blau, David. ‘‘A Time-Series Analysis of Self-Employment in the UnitedStates.’’ Journal of Political Economy 95 (June 1987) : 445–67.
Borjas, George J. ‘‘Job Satisfaction, Wages and Unions.’’ Journal of Hu-man Resources 14 (Winter 1979) : 21–40.
Borjas, George J., and Bronars, Stephen. ‘‘Consumer Discrimination andSelf-Employment.’’ Journal of Political Economy 97 (June 1989) : 581–605.
Casson, Mark C. ‘‘Entrepreneurship: A Model of Risky Innovation underCapital Constraints.’’ DP Discussion Paper no. 235. Reading: Univer-sity of Reading, 1990.
Clark, Andrew E., and Oswald, Andrew J. ‘‘Satisfaction and ComparisonIncome.’’ Journal of Public Economics 61 (1996) : 359–81.
. ‘‘Unhappiness and Unemployment.’’ Economic Journal 104 (May1994): 648–59.
Cox, Donald. ‘‘Motives for Private Income Transfers.’’ Journal of Politi-cal Economy 95 (June 1987) : 508–46.
Cressy, Robert. ‘‘Are Startups Debt-Rationed?’’ Economic Journal 106,no. 438 (September 1996) : 1253–70.
De Witt, Gerrit, and Van Winden, Frans A. ‘‘An Empirical Analysis ofSelf-Employment in the Netherlands.’’ Economics Letters 32 (January1990) : 97–100.
Elias, Peter, and Blanchflower, David G. The Occupations, Earnings andWork Histories of Young Adults: Who Gets the Good Jobs? ResearchPaper no. 68. London: Department of Employment, 1989.
Evans, David, and Jovanovic, Boyan. ‘‘An Estimated Model of Entrepre-neurial Choice under Liquidity Constraints.’’ Journal of Political Econ-omy 97 (August 1989) : 808–27.
Evans, David, and Leighton, Linda. ‘‘Some Empirical Aspects of Entre-preneurship.’’ American Economic Review 79 (June 1989) : 519–35.
Freeman, Richard B. ‘‘Job Satisfaction as an Economic Variable.’’ Ameri-can Economic Review, Papers and Proceedings 68 (May 1978):135–41.
Fuchs, Victor. ‘‘Self-Employment and Labor Force Participation of OlderMales.’’ Journal of Human Resources 17 (Fall 1982) : 339–57.
Goffee, Robert, and Scase, Richard, eds. Entrepreneurship in Europe: TheSocial Processes. London: Croom Helm, 1987.
Grossman, Gene. ‘‘International Trade, Foreign Investment and the For-mation of the Entrepreneurial Class.’’ American Economic Review 74(September 1984) : 605–14.
Hamermesh, Daniel S. ‘‘Economic Aspects of Job Satisfaction.’’ In Essays
/ 9e0e$$ja14 11-17-97 13:11:40 laeca UC: Labor Econ
59What Makes an Entrepreneur?
in Labor Market Analysis, edited by O. Ashenfelter and Wallace Oates.New York: Wiley, 1977.
Holmes, Thomas J., and Schmitz, James A. ‘‘A Theory of Entrepreneur-ship and Its Application to the Study of Business Transfers.’’ Journalof Political Economy 89 (April 1990) : 265–94.
. ‘‘Measuring Small Business Dynamics When Owners and TheirBusinesses Can Be Separately Identified.’’ Working paper. Madison:University of Wisconsin—Madison, 1991.
Holtz-Eakin, Douglas; Joulfaian, David; and Rosen, Harvey S. ‘‘Entrepre-neurial Decisions and Liquidity Constraints.’’ Rand Journal of Eco-nomics 25 (Summer 1994) : 334–47. (a )
. ‘‘Sticking It Out: Entrepreneurial Survival and Liquidity Con-straints.’’ Journal of Political Economy 102 (February 1994) : 53–75.(b )
Jowell, Roger; Witherspoon, S.; and Brook, L. British Social Attitudes:The 7th Report. Aldershot: Gower, 1990.
Kanbur, S. M. Ravi. ‘‘Entrepreneurial Risk Taking, Inequality, and PublicPolicy: An Application of Inequality Decomposition Analysis to theGeneral Equilibrium Effects of Progressive Taxation.’’ Journal of Polit-ical Economy 90 (February 1982) : 1–21.
Kihlstrom, Richard E., and Laffont, Jean-Jacques. ‘‘A General Equilib-rium Entrepreneurial Theory of Firm Formation Based on Risk Aver-sion.’’ Journal of Political Economy 87 (August 1979) : 719–848.
Kirzner, Israel M. Competition and Entrepreneurship. Chicago: Univer-sity of Chicago Press, 1973.
Knight, Frank H. Risk, Uncertainty and Profit. New York: HoughtonMifflin, 1921.
Lentz, Bernard F., and Laband, David N. ‘‘Entrepreneurial Success andOccupational Inheritance among Proprietors.’’ Canadian Journal ofEconomics 23 (August 1990) : 563–79.
Lindh, Thomas, and Ohlsson, Henry. ‘‘Self-Employment and Self-Fi-nancing.’’ Economic Journal 106, no. 439 (November 1994) : 1515–26.
Meng, Ronald. ‘‘The Relationship between Unions and Job Satisfaction.’’Applied Economics 22 (December 1990) : 1635–48.
Meyer, Bruce. ‘‘Why Are There so Few Black Entrepreneurs?’’ WorkingPaper no. 3537. Cambridge, MA: National Bureau of Economic Re-search, 1990.
Miller, Paul. ‘‘Trade Unions and Job Satisfaction.’’ Australian EconomicPapers 66 (December 1990) : 226–48.
Organization for Economic Cooperation and Development. ‘‘Self-Em-ployment in OECD Countries.’’ OECD Economic Outlook (Septem-ber 1986) : 43–65.
Pickles, A. R., and O’Farrell, P. N. ‘‘An Analysis of Entrepreneurial Be-havior from Male Work Histories.’’ Regional Studies 21 (June 1987) :425–44.
Rees, Hedley, and Shah, Anup. ‘‘An Empirical Analysis of Self-Employ-ment in the UK.’’ Journal of Applied Econometrics 1 (January 1986) :95–108.
/ 9e0e$$ja14 11-17-97 13:11:40 laeca UC: Labor Econ
60 Blanchflower/Oswald
Reid, Gavin C. ‘‘Analysing Rankings, with an Application to the Financ-ing of Small Entrepreneurial Firms.’’ Economic Journal 100, suppl.(March 1990): 200–205.
Reid, Gavin C., and Jacobsen, L. R. The Small Entrepreneurial Firm.Aberdeen: Aberdeen University Press, 1988.
Rosen, Sherwin. ‘‘Economics and Entrepreneurs.’’ In Entrepreneurship,edited by Joshua Ronen. Lexington, MA: Lexington Books, 1983.
Schumpeter, Joseph A. Business Cycles: A Theoretical, Historical andStatistical Analysis of the Capitalist Process. 2 vols. New York:McGraw-Hill, 1939.
Schwochau, Susan. ‘‘Union Effects on Job Attitudes.’’ Industrial andLabor Relations Review 40 (January 1987) : 209–24.
Shorrocks, Anthony F. ‘‘Wealth Holdings and Entrepreneurial Activity.’’In Modelling the Accumulation and Distribution of Wealth, edited byD. Kessler and A. Masson. Oxford: Clarendon Press, 1988.
Warr, Peter B., ed. Psychology at Work. Harmondsworth: Penguin, 1985.Wilhelm, Mark. ‘‘Inheritance and Labor Earnings.’’ Working paper. Col-
lege Park: Pennsylvania State University, 1991.
/ 9e0e$$ja14 11-17-97 13:11:40 laeca UC: Labor Econ