what makes an...
TRANSCRIPT

What Makes an Employer-Entrepreneur?*
Marco Caliendo Frank M. Fossen† Alexander S. Kritikos
Potsdam University University of Nevada, Reno DIW Berlin
PRELIMINARY VERSION – November 15, 2017
Abstract:
Why do increasing numbers of entrepreneurs remain solo while less of them start hiring
employees and grow? And which characteristics help entrepreneurs to remain an employer? A
better understanding of what makes an employer-entrepreneur is of high interest as the policy
debate on entrepreneurship centers on start-ups that create jobs and have growth potential.
Using household panel data, we analyze the full dynamics of transitions between the labor-
market states of solo- and employer-entrepreneurship, paid employment and non-employment,
taking personality traits into explicit consideration. We distinguish between direct entry into
employer-entrepreneurship and a stepwise entry via solo-entrepreneurship and find important
differences. Using various proxies for entrepreneurial abilities, we observe that those who have
better abilities are more likely to hire immediately. Concerning entrepreneurial survival, our
results show that higher entrepreneurial abilities generally also have a positive influence, but
very high levels of risk tolerance and trust in others have opposing effects. Overall, we reveal
that personality traits matter more for survival than for entry into employer-entrepreneurship.
JEL classification: J22, J23, L26.
Keywords: Employer, entrepreneurship, business creation, firm exit, personality.
* Acknowledgement: We thank Matt Ross and participants at the 2017 Annual Conference of the Western
Economic Association International in San Diego, CA, for valuable comments. † Corresponding author, address: University of Nevada, Reno, Department of Economics, 1664 N. Virginia Street,
Reno, NV 89557-0030, U.S.A., email: [email protected].

1
1 Introduction
During the last two decades, in many industrialized economies the number of entrepreneurs
grew substantially. In Germany for instance, we observe a steady increase from about 3 million
self-employed individuals in 1991 to 4.4 million in 2011 when self-employment peaked (Mai
and Marder-Puch, 2013). However, separating out the employer-entrepreneurs, those who hire
others in their business (from here on also ‘employers’) from the solo-entrepreneurs (non-
employers) shows that most of the increase went into solo-entrepreneurship. This group nearly
doubled during this period (from about 1.35 to 2.5 million) while the number of employers grew
by only 15 percent (from 1.65 to 1.9 million). Without doubt, it is important that so many
individuals create jobs for themselves when they became non-employers. However, employers
exhibit higher growth ambitions, are more likely to be innovators, and certainly have a stronger
impact on the economy when they create jobs for others (Haltiwanger et al., 2013).
Recent research has started to discuss whether there are two paths of becoming an
employer: some individuals create larger businesses from the beginning where they hire or plan
to hire from day one. Others choose a different strategy and remain non-employers for a certain
amount of time—for instance to experiment with entrepreneurship (Manso, 2016). After such
an interim period, mostly within the first three years after start-up (Fairlie and Miranda, 2017),
some of them decide to hire as well.
Three crucial questions arise from these recent developments: why do most entrepreneurs
stay solo while only a minority hires employees and grows—what kind of characteristics help
them to become an employer? Given the two paths of hiring, do those who start right away with
larger entities differ substantially from those who make the detour as solo-entrepreneurs before
they hire their first employee? And what kind of observable characteristics help entrepreneurs
to remain in business? A better understanding of what makes an employer who successfully

2
remains in the market is of high interest, as the policy debate on entrepreneurship centers more
and more on those who create jobs and have growth potential.
Recent research has been concentrating on the first question regarding the characteristics
of those individuals who hire their first employees. Among the individual factors,
entrepreneurial abilities (Burke et al., 2000, 2002), gender (Burke et al., 2002, Fairlie and
Miranda, 2017), work experience (Cowling et al., 2004), the previous employment status
(Andersson and Wadensjo, 2007), and financial assets (Henley, 2005) influence the probability
of hiring first employees. Moreover, Fairlie and Miranda (2017) and Astebro and Tag (2016)
show that there are high correlations between the legal form of the founded entity, namely
incorporated versus unincorporated businesses (where the former could be interpreted as a
further signal of entrepreneurial ability) and the hiring probability. Coad et al. (2017)
demonstrate that non-employers realize increasing sales in the year before they start hiring.
While these papers have identified various relevant individual and business
characteristics,1 less evidence exists so far on the question whether and how the personality of
these individuals influences the decision to hire a first employee. Earlier research emphasizes
that the human personality systematically affects other entrepreneurial decisions (Zhao and
Seibert, 2006), in particular entrepreneurial entry (see inter alia Vereshchagina and Hopenhayn
2009, Caliendo et al., 2009, 2014), survival in entrepreneurship (Ciavarella et al., 2004,
Caliendo et al., 2010, 2014), and entrepreneurial income (Hamilton et al., 2014, Levine and
Rubinstein, 2017). We build upon this literature to analyze whether the personality also matters
in first hiring decisions.
Moreover, previous research remains silent so far regarding the question whether the path
towards the first employee matters. Instead, the hiring decision is either analyzed by pooling all
data (e.g., Henley, 2004) or by explicitly focusing on those who come from a non-employer
1 Other papers investigate the influence of institutional factors on the hiring probability (see inter alia Carroll et
al., 2000, or Millan et al., 2013).

3
position (e.g., Coad et al., 2017). However, as we will show in this paper, it is important to
explicitly differentiate between direct transitions from paid employment to employer-
entrepreneurship and indirect entries via solo-entrepreneurship.
Finally yet importantly, creating firms and hiring employees has a more lasting impact on
the economy the longer employers are able to keep their salaried workers, or in other words,
when the employer-business becomes sustainable. Therefore, we will identify—to the best of
our knowledge for the first time—which individual characteristics influence the ability to
survive as an employer.
This paper thus examines three research questions: How individual characteristics
including personality traits influence the ability of entrepreneurs to hire workers, what
differences exist between the two hiring paths, and which individual characteristics support
employers to remain in their state. To answer these questions, we analyze the full dynamics of
transitions between the potential labor-market states of solo- and employer-entrepreneurship,
paid employment and non-employment. By making use of the German Socio-economic Panel
(SOEP), a rich dataset that includes demographics, employment information and personality
characteristics, we conduct a comprehensive analysis of individual factors important for
employer-entrepreneurship that include—beside personality characteristics—human and
financial capital, previous income, and unemployment experience.
Our results show that individuals who have more favorable abilities are more likely to hire
immediately. Concerning entrepreneurial survival, our results show that higher entrepreneurial
abilities generally also have a positive influence, but very high levels of risk tolerance and trust
in others have opposing effects. Overall, we reveal that personality traits matter more for
survival than for entry into employer-entrepreneurship.
The remainder of the paper is organized as follows. Section 2 reviews related research.
Section 3 presents the data and summary statistics. In Section 4, we describe our empirical

4
strategy, and Section 5 provides the estimation results. Section 6 discusses the findings and
concludes.
2 Literature and Contributions
2.1 Hiring First Employees
A large body of literature discusses individual determinants of entrepreneurial entry and
survival from a more general point of view without distinguishing between employers and non-
employers. From previous research, we know for instance that males, middle-aged individuals
and individuals with higher levels of education, with more financial capital, more work
experience in the same industry and with self-employed parents have a higher probability of
entering entrepreneurship. We further know that personality traits play a crucial role on the
entry decision. Among the so-called Big Five traits, high scores in openness and extraversion
increase the probability of entry into entrepreneurship, and additionally, while having controlled
for the Big Five, high scores in risk tolerance, locus of control, and trust (Caliendo et al., 2014).
We also know what determines survival in entrepreneurship. Middle-aged, male individuals
with higher education and prior work experience remain self-employed with a higher
probability. It is helpful for them as well, when they have medium levels in risk tolerance and
when they score low in the Big Five factor agreeableness and high in the Big Five factor
conscientiousness (Ciavarella et al., 2004; Caliendo et al., 2014).
Far less is known about what makes an employer. Hurst and Pugsley (2011) document that
most nascent entrepreneurs have no intention to grow, but policymakers are more interested in
entrepreneurs who create jobs. It is also unclear which of the variables mentioned above unfold
the same or a different influence when we differentiate between the two paths of becoming an
employer.

5
Among the few papers that address this issue, three factors are highlighted of being
important for becoming an employer: entrepreneurial abilities, capital constraints, and work
experience.
Entrepreneurial abilities are one central factor that might lead to particular hiring patterns
(Burke et al., 2002). Those who have better abilities are more likely to hire immediately when
opening a business than those with lower entrepreneurial abilities, among them maybe also
those who may experiment as non-employers with entrepreneurship at first play.
Entrepreneurial abilities per se are unobservable, but there are some proxies that can be used to
capture their effects on the hiring decision. Accordingly, the hiring decision should be positively
related to the education level (Fairlie and Miranda, 2017), self-employed parents (Coad et al.,
2017), as well as to non-cognitive traits (Zhao and Seibert, 2006). Moreover, as earlier research
points to positive correlations between the previous income in an employed position and
entrepreneurial ability (Hamilton, 2000, Astebro and Chen, 2014), this correlation further
allows us to expect that entrepreneurial abilities, thus, the decision to hire immediately after
start-up should also be positively correlated with previous income.
The empirical evidence is however not fully consistent with these hypotheses. Henley
(2005), who uses British household data and presents a first comprehensive analysis, but
without differentiating between entry paths, finds indeed that some of the above listed proxies
for entrepreneurial abilities influence the hiring decision in the expected way: entrepreneurs
whose parents were self-employed hire with higher probability,2 as do individuals with higher
education levels. Coad et al. (2017), who use Danish data and explicitly focus only on those
who decide to make a transition from a non-employer to an employer, find such an influence
only for higher education levels, while they cannot confirm the intergenerational link. Fairlie
and Miranda (2017), who use US data and study the determinants of entrepreneurs hiring their
2 Similarly Lechmann and Wunder (2017) report that having self-employed parents positively influences the
probability of becoming an employer.

6
first employee from a non-employer position as well, do not even find any evidence that higher
education levels positively influence the hiring decision.
As for non-cognitive traits, we are not aware of any empirical evidence with respect to
their influence on the hiring decision. We may expect that the same personality traits that have
been shown to affect the entrepreneurial entry in general should also influence the decision to
hire immediately once businesses are opened. These traits are high scores in openness to
experience and extraversion among the Big Five traits, as well as high scores in risk tolerance,
internal locus of control and trust (see Caliendo et al., 2012, 2014). We expect extraversion to
be similarly important for those who want to become employers as they have to interact with
different kinds of other individuals, like employees, business partners, investors and others
(Zhao and Seibert, 2006). Moreover, entrepreneurs who plan for larger units might more often
explore novel ideas (Schumpeter, 1942) which again should be positively correlated with higher
scores in the Big Five factor ‘openness in experience’.3 As for risk aversion and trust to others,
it is intuitively clear that starting to run a larger entity with employees is much riskier than being
a solo-entrepreneur, while at the same time this requires a minimum amount of trust in the
willingness of the freshly hired employees to support the new venture. This is why higher risk
tolerance and higher scores in trust should also increase the probability of an immediate hiring
process. Similarly, a more internal locus of control, which means that individuals believe that
their own actions will determine the later outcomes of their ventures (Rotter, 1966), may
increase the probability of starting to hire immediately, as well.
Capital constraints: Holtz-Eakin et al. (1994) and Blanchflower and Oswald (1998) show
that the access to capital positively influences the decision to become self-employed in general.
The lack of capital may constrain those who aim to create larger businesses even further. Indeed
Burke et al. (2000) as well as Henley (2004) find that having equity positively influences the
3 The combination of these two Big Five factors extraversion and openness for experience corresponds to the
higher order personality trait or meta-trait plasticity (see Digman, 1997, and DeYoung et al., 2002).

7
generation of further jobs in a newly ventured firm. Outcomes again differ when the focus is
turned to those who start hiring from a non-employer position. Coad et al. (2017) observe no
significant influence of capital for this group while they reveal that the income in the previous
year of a non-employer increases the hiring probability. The results of Fairlie and Miranda
(2017), who focus on previous year’s business assets and revenues, are consistent with the latter
finding: Their business variables unfold the same positive influence on the probability of hiring
the first employee as higher incomes in the previous year.
Work experience: the own work experience might affect hiring decisions as well.
Individuals with more years of work experience may better know the markets they aim to enter
when coming from an employed position. Therefore, they might make the decision of hiring
right away with a higher probability than individuals with no or a limited amount of work
experience and those coming out of unemployment. Hence, the decision to hire a first employee
right at the beginning of an entrepreneurial career should be positively related to work
experience and negatively to unemployment experience. Earlier research points in this direction
for those who gathered a certain amount of work experience (Cowling et al., 2004). Concerning
the previous labor market status, there is some evidence that individuals coming out of
unemployment hire with lower probability (Caliendo et al., 2015; Coad et al., 2017). Another
variable—the age of the entrepreneur—is a valuable proxy for work experience when
controlling for time spent in unemployment. Results from using the age variable similarly show
that middle-aged individuals do not only enter into entrepreneurship with higher probability,
but also start the hiring process more often (Henley, 2004).
The entry paths into employer-entrepreneurship: The diverging empirical evidence in
particular on entrepreneurial abilities and on capital constraints points to the importance of
differentiating between the two paths of becoming an employer. We argue that the initial choice
of starting as an employer hiring right away versus starting as solo-entrepreneur and potentially
hiring later are largely driven by entrepreneurial abilities. Therefore, we expect that all variables

8
used as proxies to capture these abilities (such as education, self-employed parents or
personality traits) unfold a stronger effect on those who transition directly to employer-
entrepreneurship without using solo-entrepreneurship as a stepping-stone.
The wealth level may also influence the timing of the hiring decision in different ways.
Provided that creating larger businesses and, thus, hiring from the start needs a minimum
amount of own financial capital, either for using it as direct financing source or for providing
collateral, we expect that access to capital might be instrumental for the decision of hiring right
away. Those who aim to create larger businesses but face capital constraints may circumvent
this limitation by starting as non-employers. After having earned a certain amount of income,
they may then replace the missing access to capital by earning a sufficient amount of income as
a non-employer and then become employers as well (see also Coad et al., 2017).
2.2 Surviving as Employer
Entrepreneurs unfold real impact on the economy when they remain employers and employ
their salaried workers for a significant time. Therefore, in addition to the analysis of the hiring
decision we will also investigate what characterizes a sustainable employer. We define higher
sustainability as continuously being an employer for a larger number of years. We use the three
factors that are considered important for becoming an employer, entrepreneurial abilities,
capital constraints, and work experience, to form expectations about their relevance for survival
in employer-entrepreneurship as well.
Entrepreneurial abilities: We expect that two of the proxies used for entrepreneurial
abilities, i.e. higher educated individuals as well as individuals who had self-employed parents,
should work in the same direction. Individuals holding these characteristics should not only be
more likely to hire a first employee, but also be more able to run these larger businesses.
Empirical evidence on survival in entrepreneurship in general (without the distinction between
employers and non-employers) is consistent with these expectation (Caliendo et al., 2014).

9
In contrast, prior research analyzing how personality traits influence entrepreneurial
decision making in general shows that different characteristics influence entrepreneurial
survival in comparison to entrepreneurial entry (Caliendo et al., 2014). In line with this research,
we expect that the Big Five factors that might influence entry into employer-entrepreneurship
(i.e. extraversion and openness for experience) will not affect survival in employer-
entrepreneurship. It can be argued that creativity might be essential for starting but not for
running a business. Similarly, extraversion might be an important trait for employers in the
beginning of an entrepreneurial venture when they have to assign tasks and responsibilities,
build teams, and persuade investors, but its influence on entrepreneurial survival should fade
away over time once the business is established. The three other factors could become key for
survival. Low levels of agreeableness might improve bargaining abilities of entrepreneurs. High
levels of conscientiousness may particularly help individuals to be well organized and
methodical. Low levels of neuroticism may enable them to manage stress and uncertainty, when
they act as employers in this unstructured environment with uncertain outcomes (Zhao and
Seibert, 2006).4 As to the empirical evidence of the Big Five factors on entry and survival,
Ciavarella et al. (2004) and Caliendo et al. (2014) confirm the diverging influences of the Big
Five factors, at least when all kinds of entrepreneurs are jointly examined.
Further personality characteristics, namely risk tolerance, internal locus of control and
trust, may also influence the decision making of employers, but may unfold diverging effects
on entry and survival. A high level of trust in others should be vital for the decision to hire the
first employee, but this variable is expected to unfold no further influence once employers have
jumped this hurdle. With respect to risk attitude, previous research derived the hypotheses of
4 The three Big-Five factors agreeableness, conscientiousness and emotional stability (the reverse of neuroticism)
nearly correspond to the second meta-trait stability, as defined by Digman (1997) and DeYoung et al. (2002).
However, there is one inconsistency between the meta-trait stability and the influence of the Big Five traits on
survival. The factor agreeableness positively enters into the meta-trait stability. However, it positively influences
entrepreneurial survival in its negative attribute, i.e. low levels of agreeableness increase the probability of
entrepreneurial survival.

10
an inverse U-shaped influence of risk tolerance on entrepreneurial survival (Caliendo et al.,
2010). We expect that this relationship should hold in particular when entrepreneurs do employ
others in their business. Very risk averse employers are likely to run projects that are too small
to keep their employer businesses worthwhile, whereas very risk tolerant employers may risk
with higher probability the failing of their businesses at a scale large enough to make recovery
impossible (e.g., bankruptcy). As a consequence, among all employers, those with low or high
risk tolerance may leave this status with higher probability than employers whose risk tolerance
falls within the medium range. Last but not least, an internal locus of control is expected to be
the only personality characteristic unfolding the same influence on entry into and survival in
employer-entrepreneurship. The belief that the own actions will determine the future outcomes
of the own venture is essential for employers who took on the responsibility to employ others
to steer their employer businesses through changing business conditions.
Missing access to financial capital may constrain the decision to grow and thus to hire
first employees. Once larger businesses have been established, capital constraints should not be
a limiting factor anymore for survival.5 Empirical evidence about the survival of all
entrepreneurs (employers and non-employers) at least shows that capital income does not unfold
any influence on business survival (Caliendo et al., 2014).
In contrast, the previous employment status may well have an impact on survival as an
employer. We expect a negative effect for those who were coming from unemployment and a
positive effect for those coming from paid employment (Fairlie and Fossen, 2017).
Entrepreneurs who gathered work experience in the same industry might better know the
markets they enter, thus allowing them as employers to better adjust the size of their firms to
the existing needs in the market. Individuals who experienced unemployment prior to their step
into entrepreneurship might not only be less likely to hire workers, but also survive with lower
5 Nonetheless, when businesses aim to grow further, access to capital might again become a limiting factor.

11
probability as employers because they might lack this kind of market knowledge. While the
empirical evidence on survival as employers is scarce with respect to prior unemployment as
well, the negative influence of unemployment exposure and the positive influence of work
experience find support when these variables are analyzed without a differentiation between the
two classes of entrepreneurs (Caliendo et al., 2014).
2.3 Research Questions
The inconsistent empirical findings on what kind of characteristics influence the decision of
individuals to start hiring others in their newly started businesses points to the issue that the
path of becoming an employer matters. Therefore, in this paper we examine how the three
factors, entrepreneurial abilities, capital constraints, and work experience, influence the hiring
decision. We will further investigate whether there are significant differences when we compare
employers who hire right at the start of their businesses with individuals hiring from prior solo-
entrepreneurship. As we argue that individuals with high entrepreneurial abilities will more
often hire immediately, we expect that entrepreneurial abilities will unfold a stronger influence
on those who hire from the start. We add further characteristics measuring entrepreneurial
abilities, which have not been analyzed so far, and examine how in particular non-cognitive
characteristics such as personality traits influence the hiring decision of both types of
entrepreneurs. We also explore to what extent capital constraints unfold differing influences on
the two entry paths into employer-entrepreneurship. On top of that, we will investigate which
of the three main factors influencing the decision of becoming an employer affect the
sustainability of employer businesses. This is of crucial importance as the policy debate is
revolving around the question of what kind of start-ups create sustainable jobs for others. While
earlier studies only investigated entrepreneurial survival without differentiating between non-
employers and employers, we aim to reveal which individual characteristics unfold positive or
negative influences on survival in employer-entrepreneurship.

12
3 Data and Descriptive Results
3.1 Data
For our analysis we use the German Socio-economic Panel (SOEP), a representative annual
household panel survey for Germany (Wagner et al., 2007). We use the waves of 2005-12 to
estimate our transition models. The waves 2003-04 are additionally used to measure some of
the personality variables, and 2013 to identify transitions between 2012 and 2013. Respondents
who indicate that their primary labor activity is self-employment are asked whether they have
no, 1-9, or 10 or more employees. We label respondents in the first category as solo-
entrepreneurs and those with at least one employee as employer-entrepreneurs. In our sample
we only include individuals aged between 19-59 and exclude individuals working for a self-
employed family member, farmers, as well as persons in civil service, the military, or in
education because these persons might be restricted in their occupational choices. Our final
sample without missing values in the variables used in the main model consists of 42,099
person-year observations (32,472 paid employees, 5470 non-employed persons, 2108 solo-
entrepreneurs and 2049 employer-entrepreneurs).
The SOEP includes short versions of established psychological inventories of personality
characteristics in several waves. This allows us to analyze the influence of a comprehensive set
of personality traits in a large representative sample. In inventories of the Big Five, locus of
control and trust constructs, the respondents are asked how much they agree with different
statements about themselves (on 7-point Likert scales). Fifteen items assess the Big Five
personality traits (three items for each trait), ten items measure the locus of control, and three
questions elicit how much one is inclined to trust others. The personality constructs are obtained
by averaging the scores from the respective items; factor analysis confirms the validity of the
constructs (see Caliendo et al. 2014, for details). Risk aversion is measured in repeated survey
waves by a single question about the general willingness to take risks on an 11-point scale.

13
Alternatively, to the Big Five we also use the two meta-traits plasticity and stability. We
compute the plasticity score by taking the average over the two Big Five traits openness to
experience and extraversion and the stability score by averaging over the other three Big Five
traits conscientiousness, agreeableness, and emotional stability, which is the reverse of
neuroticism. As another alternative, we test the one-dimensional entrepreneurship-prone
personality profile suggested by Obschonka et al. (2013). Following these authors, we construct
each individual’s distance from a statistical entrepreneurial reference profile, which is
characterized by the highest possible value in openness, extraversion, and conscientiousness,
and the lowest possible value in agreeableness and neuroticism.
Since the personality characteristics are not elicited every year, we use these variables for
subsequent observation years of the same individual as well when no more recent measure is
available. By only imputing forward, i.e., only using values measured in the past, we avoid
potential reverse causality issues. For the regressions we standardize all personality variables
to facilitate interpretation of the coefficients, except risk tolerance, because this variable enters
our model in quadratic form. Table A1 in the Appendix offers descriptions of the socio-
demographic variables used in this analysis.
3.2 Summary Statistics
Table 1 provides a transition matrix showing the numbers of observations that switch from one
employment state to another between the survey interviews in two subsequent years. Individuals
counted on the diagonal remain in their current state. The matrix reveals that year-to-year
transitions occur between all states, including, for example, direct transitions from paid
employment to employer-entrepreneurship. About 56% of all transitions to employer-
entrepreneurship origin from solo-entrepreneurship, 37% from paid employment and 7% from
non-employment. This highlights the importance of a joint analysis of all possible transitions.

14
Descriptive statistics by employment states appear in Table 2. We test for equal means in
the subsamples of solo-entrepreneurs versus paid employees as well as employers versus solo-
entrepreneurs. The groups of employers and paid employees differ significantly from solo-
entrepreneurs in many characteristics.
Socio-economic variables and employment experience: The share of women among
employers is only 27%, whereas gender is almost balanced among solo-entrepreneurs.
Concerning human capital, employers have received more formal education than solo-
entrepreneurs, who again are better educated then paid employees. The likelihood of having
had an entrepreneurial father at the age of 15 years also decreases when we turn from employers
to solo-entrepreneurs and then to paid employees. The parents of both types of entrepreneurs
received as well more education than those of paid employees. Entrepreneurs are on average
older than employees are. We should also point out that more employers are affected by
disability than solo-entrepreneurs. Prior unemployment exposure in years is highest among
solo-entrepreneurs and lowest among employers.
Personality: Employer-entrepreneurs have a more internal locus of control and exhibit a
larger willingness to take risks than solo-entrepreneurs, who in turn score higher in these
characteristics than employees. Interestingly, solo-entrepreneurs score higher than employers
in Big-Five characteristics that are associated with a personality leaning towards entrepreneurial
entry: Non-employer are more open to experience6 and more extraverted than employers (and
both score higher than employees). In contrast, employers score lower in agreeableness and
higher in conscientiousness than solo-employers, which indicates that employers have a
personality that supports entrepreneurial survival. This is consistent with the observation that
employers have been entrepreneurs for longer time than solo-entrepreneurs on average. Paid
employees fall in between the two types of entrepreneurs concerning conscientiousness and
6 Solo-entrepreneurs score almost half a standard deviation higher in openness to experience than the full sample
average.

15
agreeableness. Interestingly, non-employers score highest in the meta-trait plasticity, followed
by employers and paid employees, while for the other meta trait, stability, employers score
higher than the other employment groups.
Business and income characteristics: Employers differ from solo-entrepreneurs in their
choice of industry. There are for instance significantly more employers in the trade sector while
solo-entrepreneurs dominate the public and personal services. On average, employers have been
continuously self-employed for 2.3 more years than solo-entrepreneurs, but paid employees
have spent even more years in paid employment. Employers also have significantly higher
capital and labor income in comparison to the other groups while solo-entrepreneurs realize
higher capital but lower labor income than employees.
These descriptive associations might be partially due to feedback effects of the current
employment status on the variables of interest. In our econometric estimations that are
following, we avoid reverse causality by estimating the effects, ceteris paribus, of the individual
characteristics measured before a transition occurs on the probability of switching to another
labor market state.
4 Empirical Methodology
We model employment transitions in a random utility framework. We distinguish between four
employment states: Solo-entrepreneurship (se), employer-entrepreneurship (ee), paid
employment (pe), and non-employment (ne). We jointly estimate discrete time competing risk
models of all possible transitions between these states with two types of unobserved
entrepreneurial ability based on individual panel data.
We assume that a person i, who is currently in employment state 𝑗𝜖𝐽 = {𝑠𝑒, 𝑒𝑒, 𝑝𝑒, 𝑛𝑒} in
period t, perceives that he or she would derive the following utility 𝑈𝑗𝑘 in the state k in the future
period t+1:
𝑈𝑗𝑘(𝑥𝑖𝑡, 𝑑𝑖𝑡) = 𝛽𝑗𝑘′ 𝑥𝑖𝑡 + 𝜑𝑗𝑘(𝑑𝑖𝑡) + 𝜈𝑖𝑘 + 𝜀𝑖𝑡𝑗𝑘, (1)

16
where xit is a vector of individual characteristics and 𝜑𝑗𝑘(𝑑𝑖𝑡) is a flexible function of the
duration dit in the current state. We assume that the parameters jk of the characteristics xit as
well as the duration effects may vary both across the destination state and the current state. This
means that the covariates may shift tastes for the alternatives, and these effects may be different
depending on the current state.
The random part of utility consists of an individual and destination-state specific
component 𝜈𝑖𝑘 and a remaining time-varying error term 𝜀𝑖𝑡𝑗𝑘. Specifically, since we focus on
entrepreneurship, we model two types of unobserved time-invariant individual entrepreneurial
ability or preference. The random variable 𝜈𝑖,𝑠𝑒 is relevant for any transitions into solo-
entrepreneurship and 𝜈𝑖,𝑒𝑒 for any transitions into employer-entrepreneurship of individual i,
regardless of the current state and time period. The two random effects are allowed to be
correlated. We do not model further random effects in our main estimations (i.e., 𝜈𝑖,𝑝𝑒 = 𝜈𝑖,𝑛𝑒 =
0). In a robustness check, we included a third unrestricted and correlated random effect for
transitions into paid employment (𝜈𝑖,𝑝𝑒) and obtained very similar results, but the computation
time was substantially longer.
The probability of transition from state j to k conditional on the duration in the current state
𝑑𝑖𝑡 and the covariates xit equals the probability that perceived utility in state k exceeds utility in
all other states l including the current state j. Let transitionit 𝜖𝐽 denote a discrete variable
indicating the choice of the destination state that is observed in t+1. If transitionit = j, there is
no change in employment states between t and t+1, otherwise we observe a transition. With the
standard assumption of type I extreme value disturbed error terms itjk (McFadden, 1974), we
obtain a mixed multinomial logit (MNL) model for each current state. The probability of a
transition (or of staying) conditional on xit and dit, i.e. the hazard rate, is
𝑃𝑟𝑜𝑏(𝑡𝑟𝑎𝑛𝑠𝑖𝑡𝑖𝑜𝑛𝑖𝑡 = 𝑘|𝑥𝑖𝑡 , 𝑑𝑖𝑡, 𝑗) = 𝑃𝑟𝑜𝑏(𝑈𝑗𝑘(𝑥𝑖𝑡, 𝑑𝑖𝑡) > 𝑈𝑗𝑙(𝑥𝑖𝑡, 𝑑𝑖𝑡) 𝑓𝑜𝑟 𝑎𝑙𝑙 𝑙 ≠ 𝑘)
=𝑒
𝛽𝑗𝑘′𝑥𝑖𝑡+𝜑𝑗𝑘(𝑑𝑖𝑡)+𝜈𝑖𝑘
∑ 𝑒𝛽𝑗𝑙′𝑥𝑖𝑡+𝜑𝑗𝑙(𝑑𝑖𝑡)+𝜈𝑖𝑙
𝑙𝜖𝐽
. (2)

17
We choose the current state as the base category, i.e. we normalize 𝛽𝑗𝑗 = 0 and 𝜑𝑗𝑗(𝑑𝑖𝑡) = 0,
so we write for the transition probabilities
𝑃𝑟𝑜𝑏(𝑡𝑟𝑎𝑛𝑠𝑖𝑡𝑖𝑜𝑛𝑖𝑡 = 𝑘|𝑥𝑖𝑡, 𝑑𝑖𝑡, 𝑗) =𝑒
𝛽𝑗𝑘′𝑥𝑖𝑡+𝜑𝑗𝑘(𝑑𝑖𝑡)+𝜈𝑖𝑘
1+∑ 𝑒𝛽𝑗𝑙′𝑥𝑖𝑡+𝜑𝑗𝑙(𝑑𝑖𝑡) +𝜈𝑖𝑙
𝑙≠𝑗
𝑓𝑜𝑟 𝑘 ≠ 𝑗 (3)
and for the probabilities of remaining in the current state
𝑃𝑟𝑜𝑏(𝑡𝑟𝑎𝑛𝑠𝑖𝑡𝑖𝑜𝑛𝑖𝑡 = 𝑗|𝑥𝑖𝑡 , 𝑑𝑖𝑡, 𝑗) = 1 − ∑ 𝑃𝑟𝑜𝑏(𝑡𝑟𝑎𝑛𝑠𝑖𝑡𝑖𝑜𝑛𝑖𝑡 = 𝑙|𝑥𝑖𝑡, 𝑑𝑖𝑡, 𝑗)𝑙≠𝑗 . (4)
The twelve transitions (four original states times three potential destination states) are estimated
jointly using the Maximum Likelihood Method.
By modelling two types of potentially correlated unobserved entrepreneurial ability 𝜈𝑖,𝑠𝑒
and 𝜈𝑖,𝑒𝑒, we achieve three desirable properties of our empirical model. First, we do not rely on
the Independence of Irrelevant Alternatives Assumption necessary for the standard MNL
model. Second, we link all transitions into solo-entrepreneurship and employer-
entrepreneurship across the original states and thereby the four different MNL models that we
estimate jointly. Third, we make use of the panel dimension and link observations of the same
individual at different times, which is particularly relevant for serial entrepreneurship.
We model the baseline hazard functions 𝜑𝑗𝑘(𝑑𝑖𝑡) flexibly as third degree polynomials of
the duration in the current state. The rationale is that the probability of switching from one
employment state to another may change with tenure in the current state. For example, the
likelihood of a transition from solo-entrepreneurship to employer-entrepreneurship may
decrease over time due to habituation of working alone, or it may increase due to the expansion
of relevant experience and networks. By conditioning on our flexible specification of the
baseline hazards, the model of the transition probabilities, estimated on the panel data in person-
period format, can equivalently be written as a general survival model (cf. Jenkins, 1995;
Caliendo et al., 2010). We use annual data because the covariates are not available at a higher
frequency. By employing the discrete time competing hazards model, we account for state
dependence and avoid survivorship bias. Our approach consistently accounts for right-censored

18
spells, as all survival models do, and also of left-censored spells, because retrospective
employment history information in our data allow us to recover the duration of employment
spells even in cases when the spell already started before the first survey interview of a person.
As explanatory variables, we include a rich set of socio-economic variables, in particular,
gender, education levels, labor market histories, parental entrepreneurship, capital income as an
indicator of wealth, and measures of personality characteristics. All the variables, including the
personality scores, are measured before potential transitions occur, which prevents issues of
reverse causality.7
5 Econometric Results
5.1 Entries into Employer-entrepreneurship
Table 3 provides the central results of our joint estimation of the transition model. Tables 4-5
present some important extensions of the estimated model. We report multiplicative effects on
odds ratios. Thus, values larger (smaller) than 1 indicate that a higher value in an explanatory
variable increases (decreases) the probability of the transition at hand (relative to not making
any transition, the base category). Stars indicate that differences from 1 (no effect) are
significant. Estimates for transitions from and to non-employment, which are not the focus of
this paper, appear in Table A2 in the Appendix. For brevity, we also omit from Table 3 the
polynomials of the duration in the current state, the year dummies, and variables insignificant
in all columns.
In the discussion of our estimation results, we first focus on transitions from paid
employment directly to employer-entrepreneurship (column 2) and compare with transitions
from paid employment to solo-entrepreneurship (column 1). Starting with proxies for
7 Nieβ and Biemann (2014) emphasize the importance of using antecedent measures of risk propensity in predicting
self-employment entry and survival.
19
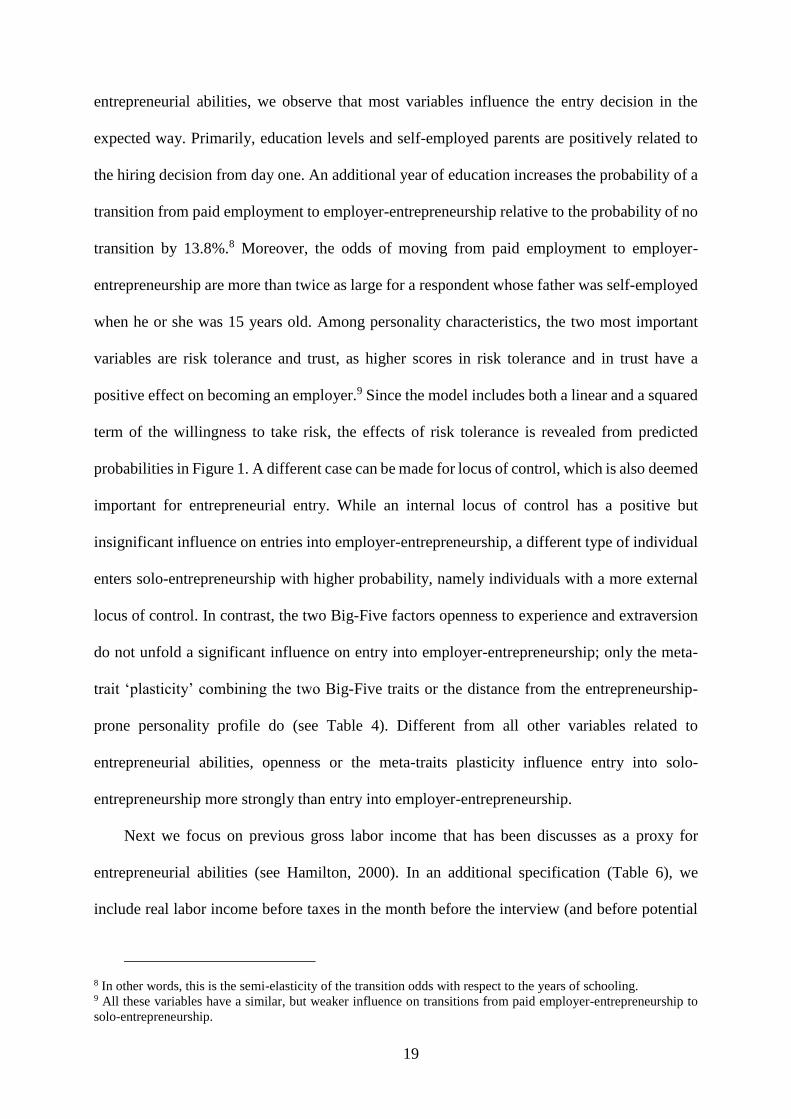
entrepreneurial abilities, we observe that most variables influence the entry decision in the
expected way. Primarily, education levels and self-employed parents are positively related to
the hiring decision from day one. An additional year of education increases the probability of a
transition from paid employment to employer-entrepreneurship relative to the probability of no
transition by 13.8%.8 Moreover, the odds of moving from paid employment to employer-
entrepreneurship are more than twice as large for a respondent whose father was self-employed
when he or she was 15 years old. Among personality characteristics, the two most important
variables are risk tolerance and trust, as higher scores in risk tolerance and in trust have a
positive effect on becoming an employer.9 Since the model includes both a linear and a squared
term of the willingness to take risk, the effects of risk tolerance is revealed from predicted
probabilities in Figure 1. A different case can be made for locus of control, which is also deemed
important for entrepreneurial entry. While an internal locus of control has a positive but
insignificant influence on entries into employer-entrepreneurship, a different type of individual
enters solo-entrepreneurship with higher probability, namely individuals with a more external
locus of control. In contrast, the two Big-Five factors openness to experience and extraversion
do not unfold a significant influence on entry into employer-entrepreneurship; only the meta-
trait ‘plasticity’ combining the two Big-Five traits or the distance from the entrepreneurship-
prone personality profile do (see Table 4). Different from all other variables related to
entrepreneurial abilities, openness or the meta-traits plasticity influence entry into solo-
entrepreneurship more strongly than entry into employer-entrepreneurship.
Next we focus on previous gross labor income that has been discusses as a proxy for
entrepreneurial abilities (see Hamilton, 2000). In an additional specification (Table 6), we
include real labor income before taxes in the month before the interview (and before potential
8 In other words, this is the semi-elasticity of the transition odds with respect to the years of schooling. 9 All these variables have a similar, but weaker influence on transitions from paid employer-entrepreneurship to
solo-entrepreneurship.

20
transitions occur) in 1000 euro in prices of 2005. In case of paid employment, our income
measure is gross wage and salary income; in case of entrepreneurship, business profits that
accrue to the entrepreneur; in case of non-employment, labor income is zero.10 As Table 5 now
reveals, we observe that this variable has a significantly positive effect on entries into employer-
entrepreneurship while it is much smaller and insignificant for entries into solo-
entrepreneurship, supporting the hypothesis that the more able entrepreneurs start hiring
immediately during their start-up period.11
Turning to capital constraints and work experience in Table 3, both influence entry into
employer-entrepreneurship mostly as expected in Section 2.1. There is positive influence of
capital income on starting larger entrepreneurial activities, i.e. hiring others in the firm from the
beginning, while this variable does not influence entry into solo-entrepreneurship. As to work
and unemployment experience, we observe employer-entrepreneurship is chosen with higher
probability when the individuals had less unemployment exposure. Age can be interpreted as a
proxy for work experience in our model (because we control for the time spent in
unemployment) and reveals an important effect. Figure 4 shows an only slightly higher
probability of middle-aged individuals to enter into employer-entrepreneurship, but individuals
from all ages switch to employer-entrepreneurship with similar probabilities. In stark contrast,
entry into solo-entrepreneurship is strongly dominated by younger and older individuals.
Finally, it is worth looking at the influence of typical socio-demographic characteristics.
Men create larger businesses with employees with higher probability (confirming earlier
findings), while entries into solo-entrepreneurship do not differ significantly by gender. The
opposite is true for the number of children. This variable does not influence entries into
employer-entrepreneurship while it positively affects entries into solo-entrepreneurship.
10 We do not include labor income in the main specification (Table 4) because of potential endogeneity concerns
that might arise despite the fact that we measure income before transitions. 11 Another interpretation is that higher income relaxes credit constraints that may be a barrier to hiring employees.

21
5.2 Differences in the Entry Path
To examine whether the path towards employer-entrepreneurship matters, we compare the
estimation results for transitions from paid employment directly to employer-entrepreneurship
discussed above with our results for transitions from solo- to employer-entrepreneurship. Table
3 (Columns 2 and 4) presents the main results and Tables 4-5 the extensions.
Most of the variables that influence the direct entry into employer-entrepreneurship unfold
a weaker or no influence when analyzing the transitions from solo- to employer-
entrepreneurship. For instance, nearly all proxies used to cover entrepreneurial abilities (i.e.
education, self-employed parents, and most personality characteristics, such as the Big Five,
the meta-trait plasticity, or the specific personality characteristics trust and locus of control)
have no significant influence. Only for risk attitudes, we observe an effect: among all solo-
entrepreneurs the more risk tolerant individuals have a higher probability of deciding to become
employers (Figure 2), which is similar to the effect of risk tolerance on the transition from paid
employment to employer-entrepreneurship.
This is not to say that employers coming from solo-entrepreneurship lack entrepreneurial
abilities: for many of the ability variables we observe that they are already at work when the
individuals self-select into solo-entrepreneurship (Table 3, Column 1). Still, those who make
the transition to employer-entrepreneurship directly from paid employment have higher
entrepreneurial abilities than those who become solo-entrepreneurs first. Proxies for these
abilities with the exception of risk attitudes do not drive the selection out of solo- into employer-
entrepreneurship.
Similarly, capital income also does not influence entry from solo- into employer-
entrepreneurship. Instead, Table 5 reveals that income success as a solo-entrepreneur supports
this selection, while non-employers with low incomes switch to paid employment with higher
probability. Thus, confirming previous research (Coad et al., 2017; Fairlie and Miranda, 2017),
we also observe that a higher income in the previous year as a non-employer increases the hiring

22
probability. Only unemployment exposure and work experience unfold similar effects among
non-employers and paid employees: prior unemployment exposure decreases the probability of
becoming an employer-entrepreneur for both groups. Concerning age (again interpreted as a
proxy for work experience), Figure 5 shows a significantly higher probability of middle-aged
individuals to enter into employer-entrepreneurship out of solo-entrepreneurship. Age effects
on the transition from paid employment to employer-entrepreneurship are similar (Figure 4),
although the age coefficients are not individually significant in this case. The age effects on
becoming an employer are important to note as entry into solo-entrepreneurship from paid
employment is strongly dominated by younger and older individuals (Figure 4). Last but not
least, among solo-entrepreneurs, men still start hiring with higher probability then women.
5.3 Survival as Employer
In the final part of our analysis, we examine which of those factors that drive entry into
employer-entrepreneurship also influence the survival as an employer (Columns 5 and 6 of
Table 3, 4 and 5). We reveal that the two main measures of entrepreneurial abilities beyond
personality characteristics, namely human capital (measured by years of formal education), and
having self-employed parents also increase the probability of remaining an employer, i.e. they
reduce the hazard of exiting from this state. An additional year of schooling for instance
decreases the annual odds of losing all employees, while remaining an entrepreneur, by 11%
(=1-0.89).
Regarding personality characteristics, we expected that Big Five factors different from
those that influenced entry into employer-entrepreneurship affect survival in employer-
entrepreneurship. Indeed, conscientiousness and agreeableness unfold the influences we
expected, i.e. employer-entrepreneurs are more likely to remain in this state when they are more
conscientious and less agreeable. Openness for experience and extraversion (which
significantly influence entry only when combined to the meta-trait plasticity) remain

23
insignificant. When not controlling for further personality characteristics (Table 4), more
emotionally stable individuals (those with low scores in neuroticism) remain employer-
entrepreneurs with higher probability. Concerning the additional specific personality traits,
most expectations find support as well. At least when not controlling for the Big Five, higher
scores in internal locus of control increase the survival probability of employers (Table 3). More
importantly, the transition from employer-entrepreneurship to paid employment is significantly
more likely at both the low and high ends of the risk tolerance distribution (Figure 3),
confirming previous findings (Caliendo et al., 2010, 2014), but revealing that this effect is
particularly relevant for employers. Finally, against expectations, trust also unfolds an influence
on survival: the more trustful individuals leave this employment form behind them with higher
probability, returning more often to paid employment.
Access to financial capital is no limiting factor for remaining an employer, as expected; it
does not unfold any influence on survival of employer businesses.12 However, the previous
year’s income from the position as an employer affects the future firm size. Employers who
have realized low incomes in this status more often decide to return to solo self-employment.
Turning to previous unemployment exposure and work experience and to the question
whether these variables still affect survival as an employer, we observe two main results.
Against expectations, those who had spent more time in unemployment do not shut down their
businesses with higher probability. In contrast to this, the age variable (capturing previous labor
market experience) impacts survival in employer-entrepreneurship: employers at a middle age
are less likely to switch to paid employment than younger or older employers (Figure 6).
We also investigate the influence of demographic characteristics. Most importantly, while
female individuals enter employer-entrepreneurship with lower probability, gender does not
make any difference with regard to survival, i.e. female employers remain in this status with a
12 Still, limited access to financial capital might inhibit business growth. However, this important question is
beyond the scope of our analysis. See Evans and Jovanovic (1989) for research in this direction.

24
similar probability as their male counterparts. In contrast to this, the number of children unfolds
an influence on survival. Employers with more children remain with higher probability in an
employer position while those with less children more often return to solo-entrepreneurship.
The effect of a migration background is interesting as well: If the employer or one of his/her
parents were born outside Germany or do not have a German citizenship, the employer is less
likely to switch to paid employment. A disability seems to make sustaining entrepreneurship
more difficult: both solo- and employer-entrepreneurs with disabilities shut down their firms
more often and return to an employed position.
Finally yet importantly, the entry path into employer-entrepreneurship also matters for
survival. As Figure 6 shows, employers exhibit a strong tendency to revert to the employment
status they had before becoming an employer. Those who came from paid employment return
more often to a employment when they end their career as an employer, while those who started
hiring as a solo-entrepreneur return more often to solo-entrepreneurship when they lay off their
employees.
5.4 Further Specifications
One of our main variables capturing entrepreneurial abilities, namely education years, might be
endogenous in our estimation model if unobserved ability is correlated with education and has
a direct effect on the transition probabilities we investigate. To address this potential concern,
we use an instrumental variables approach in a robustness check. We use parental education
(two dummy variables indicating whether the father and the mother obtained the secondary
school degree “Abitur” that qualifies for university entrance in Germany) as instruments for
own education. Although the use of parental education as an instrument for education is not
without critique, Hoogerheide et al. (2012) conclude from Bayesian analysis using the SOEP
that the potential bias introduced by using father’s education as an instrument for schooling in
a wage regression is typically within an acceptable range. We implement a control function

25
approach (Wooldridge, 2014), i.e., we first regress the years of education variable on mother’s
and father’s education along with the explanatory variables and then include the residual as an
additional explanatory variable in our competing risks model. The estimated effects of the
education variable become larger, but remain qualitatively the same (see Table A3 in the
Appendix). Given validity of the instruments, this indicates that the estimated education effects
are not driven by omitted variable bias.
6 Discussion and Conclusion
We analyze individual factors that drive the decision of becoming an employer-entrepreneur
and those that drive survival in employer-entrepreneurship. Our empirical results based on the
German Socio-economic panel (SOEP) are consistent with the hypothesis that individuals who
have better entrepreneurial abilities are more likely to hire and to remain an employer.
Separating these abilities into a cognitive part (covered by education levels and parental
experience as entrepreneurs) and a non-cognitive part (covered by personality traits), we
observe that the cognitive part has straightforward effects on entry and survival. The two
variables play a key positive role on both decisions, starting as an employer and remaining an
employer.
In contrast to this, the influence of the non-cognitive part of entrepreneurial abilities on
these two decisions is more nuanced. We reveal that, with the exception of an internal locus of
control, no other personality trait affects the entry decision and survival in the same way.
Among the Big Five traits, three of them (conscientiousness, agreeableness and neuroticism)
influence survival, whereas the other to factors (extraversion and openness to experience),
which combine to the meta-trait plasticity, influence entry.
The influence of two further more specific personality characteristics that particularly
matter in employer dynamics is even more complicated. While entry into entrepreneurship
becomes more probable the higher individuals score in risk tolerance and the propensity to trust

26
others, both variables unfold a differing influence on survival as an employer. Individuals exit
from employer-entrepreneurship with higher probability when they have low or high risk
tolerance, thus employers with a medium level of risk tolerance survive the longest time.
Employers are also more likely to exit employer-entrepreneurship the higher they score in trust,
which contrasts with the positive influence on entry. Overall, these results reveal that the
personality of an individual not only plays a key role for the decision to become an employer,
but even more importantly for the success as an employer.
Our results also clarify why many employers give up their employer-businesses after some
time: among other reasons, some personality characteristics, such as very high scores in risk
tolerance and trust that drive the selection into employer-entrepreneurship, later drive the same
individuals out of employer-entrepreneurship. In this respect, we also reveal that personality, in
particular when looking at its influence on survival in employer-entrepreneurship, plays a
stronger role compared to its general influence on survival as an entrepreneur when we do not
distinguish between non-employers and employers (see Caliendo et al., 2014).
Besides entrepreneurial abilities, we further reveal that other variables also play a crucial
role for becoming an employer. Having access to financial capital is important for those who
hire right away, and similarly higher earnings as a solo-entrepreneur for those who hire
subsequently. We also show that prior exposure to unemployment has a negative influence on
the entry probability, and work experience (measured by age while controlling for
unemployment periods) affects survival in employer-entrepreneurship in that the middle-aged
exit less frequently.
Finally, we compare the two most important entry paths into employer-entrepreneurship,
those who transition from an employed position directly into employer-entrepreneurship, and
those who start as solo-entrepreneurs before they make their first hire. On the one hand, we
show that those with higher entrepreneurial abilities more often hire immediately. On the other
hand, we reveal that almost none of the factors that drive the hiring decision of those who hire

27
right away influences the hiring decision of those hire out of solo-entrepreneurship. Most of
these factors unfold either (a weaker) influence already when these individuals self-select into
solo-entrepreneurship, thus partially explaining the inconsistent results of earlier research. For
example, individuals with higher levels of education are more likely to become an entrepreneur,
be it an employer or a solo-entrepreneur, but among all solo-entrepreneurs, education has no
further bite in explaining a transition to an employer.
Overall, our empirical analysis produces four main conclusions:
1. Entrepreneurial abilities drive the decision to hire others.
2. The two entry paths into employer-entrepreneurship greatly differ. Those who have
higher entrepreneurial abilities hire immediately, whereas those who aim to experiment with
entrepreneurship, for instance because they are uncertain about their abilities, hire after
spending a certain amount of time in solo-entrepreneurship.
3. Capital constraints play a role for the entry decision into employer-entrepreneurship.
Those who lack financial capital at entry into entrepreneurship aim to realize a sufficient amount
of income as a solo-entrepreneur before they start hiring.
4. Personality is an important factor in explaining the hiring decision. Personality traits
play an even stronger role in their influence on survival in employer-entrepreneurship than in
their influence on survival in entrepreneurship in general. In this respect, it is important to note
that most personality traits unfold either a differing influence on hiring first employees and on
keeping them or even an opposing influence. Some characteristics such as very high risk
tolerance or trust in others are responsible for the selection into employer-entrepreneurship, but
also for the selection out of this employment form.
This research raises further questions that future research should address. For example,
comparisons with other countries could shed more light on how labor market and business
regulations, social security and tax systems, and other institutions moderate the influence of
individual characteristics on the dynamics of employer-entrepreneurship.

28
References
Andersson, P., and Wadensjo, E. (2007). Do the unemployed become successful entrepreneurs?
International Journal of Manpower, 28(7), 604–626.
Åstebro, Thomas, and Jing Chen (2014). The entrepreneurial earnings puzzle: Mismeasurement
or real? Journal of Business Venturing, 29, 88-105.
Åstebro, Thomas, and Joacim Tag (2016). Entrepreneurs and Job Creation. IFN Working Paper
1059. Available at SSRN: http://ssrn.com/abstract=2576044.
Burke, A. E., FitzRoy, F. R., and Nolan, M. A. (2000). When less is more: Distinguishing
between entrepreneurial choice and performance. Oxford Bulletin of Economics and
Statistics, 62(5), 565–587.
Burke, A. E., Fitzroy, F. R., and Nolan, M. A. (2002). Self-employment wealth and job creation:
The roles of gender, non-pecuniary motivation and entrepreneurial ability. Small Business
Economics, 19, 255–270.
Caliendo, Marco, Frank M. Fossen, and Alexander S. Kritikos (2009). Risk Attitudes of Nascent
Entrepreneurs: New Evidence from an Experimentally Validated Survey, Small Business
Economics 32(2), 153-167.
Caliendo, Marco, Frank M. Fossen, and Alexander S. Kritikos (2010). The Impact of Risk
Attitudes on Entrepreneurial Survival. Journal of Economic Behavior and Organization 76,
45-63.
Caliendo, Marco, Frank M. Fossen, and Alexander S. Kritikos (2012). Trust, Positive
Reciprocity, and Negative Reciprocity: Do These Traits Impact Entrepreneurial Dynamics?
Journal of Economic Psychology 33(2), 394-409.
Caliendo, Marco, Frank M. Fossen, and Alexander S. Kritikos (2014). Personality
Characteristics and the Decisions to Become and Stay Self-employed. Small Business
Economics 42, 787–814.
Caliendo, Marco, Jens Hogenacker, Steffen Künn, and Frank Wiessner (2015). Subsidized
Start-Ups out of Unemployment: A Comparison to Regular Business Start-ups. Small
Business Economics 45, 165-190.
Carroll, R., Holtz-Eakin, D., Rider, M., and Rosen, H. S. (2000). Income taxes and
entrepreneurs’ use of labor. Journal of Labor Economics, 18(2), 324–351.
Ciavarella, M.A., A.K. Buchholtz, C.M. Riordan, R.D. Gatewood, and G.S. Stokes (2004). The
Big Five and Venture Survival: Is There a Linkage? Journal of Business Venturing 19, 465-
483.

29
Coad, Alex, Kristian Nielsen and Bram Timmermans (2017). My First Employee: an Empirical
Investigation. Small Business Economics 48, 25-45.
Cowling, M., Taylor, M., and Mitchell, P. (2004). Job creators. Manchester School, 72(5), 601–
617.
DeYoung, C.G., Peterson, J.B., and Higgins, D.M. (2002). Higher-order factors of the Big Five
predict conformity: Are there neuroses of health? Personality and Individual Differences,
33, 533–552.
Digman, J.M. (1997). Higher-Order Factors of the Big Five. Journal of Personality and Social
Psychology 73(6), 1246-1256.
Evans, D.S., and Jovanovic, B. (1989): An estimated model of entrepreneurial choice under
liquidity constraints. Journal of Political Economy 97 (4), 808–827.
Fairlie, Robert W., and Frank M. Fossen (2017). Opportunity versus Necessity
Entrepreneurship: Two Components of Business Creation. Stanford Institute for Economic
Policy Research Discussion Paper 17-014.
Fairlie, Robert W., and Javier Miranda (2017). Taking the Leap: The Determinants of
Entrepreneurs Hiring their First Employee. Journal of Economics and Management
Strategy 26(1), 3-34.
Haltiwanger, John, Ron S. Jarmin and Javier Miranda (2013): Who Creates Jobs? Small versus
Large versus Young, Review of Economics and Statistics, 95(2), 347-361.
Hamilton, Barton H. (2000). Does Entrepreneurship Pay? An Empirical Analysis of the Returns
to Self-Employment. Journal of Political Economy, 108, 604-631.
Hamilton, Barton H., Nicholas Papageorge and Nidhi Pande (2014). The Right Stuff?
Personality and Entrepreneurship. Disc. Paper.
Henley, A. (2005). Job creation by the self-employed: The roles of entrepreneurial and financial
capital. Small Business Economics, 25, 175–196.
Holtz-Eakin, D., D. Joulfaian and H.S. Rosen (1994). Entrepreneurial Decisions and Liquidity
Constraints. Rand Journal of Economics, 25, 334-347.
Hoogerheide, Lennart, Joern H. Block, and Roy Thurik (2012). Family Background Variables
as Instruments for Education in Income Regressions: A Bayesian Analysis. Economics of
Education Review 31, 515–523.
Hurst, Erik, and Benjamin W. Pugsley (2011). What Do Small Businesses Do? Brookings
Papers on Economic Activity 2011(2), 73-142.
Jenkins, Stephen P. (1995). Easy Estimation Methods for Discrete-time Duration Models.
Oxford Bulletin of Economics and Statistics 57, 129-138.

30
Lechmann, Daniel S.J., and Christoph Wunder (2017). The dynamics of solo self-employment:
persistence and transition to employership. Labor Economics in press.
Levine, Ross and Yona Rubinstein (2017). Smart and Illicit: Who Becomes an Entrepreneur
and Does it Pay? Quarterly Journal of Economics, 132(2), 963–1018.
Mai, Christoph-Martin and Katharina Marder-Puch (2013). Selbständigkeit in Deutschland,
Statistisches Bundesamt, Wiesbaden.
Manso, G. (2016). Experimentation and the Returns to Entrepreneurship. Review of Financial
Studies, 29(9), 2319–2340.
Millan, A., J.-M. Millan, C. Roman, and A. van Stel (2013). How does employment protection
legislation influence hiring and firing decisions by the smallest firms? Economics Letters,
121, 444–448.
Nieβ, Christiane, and Torsten Biemann (2014). The Role of Risk Propensity in Predicting Self-
Employment. Journal of Applied Psychology 99(5), 1000-1009.
Obschonka, M., E. Schmitt-Rodermund, R.K. Silbereisen, S.D. Gosling, and J. Potter (2013).
The regional distribution and correlates of an entrepreneurship-prone personality profile in
the United States, Germany, and the United Kingdom: a socioecological perspective.
Journal of Personality and Social Psychology, 105(1), 104-122.
Rotter, J.B. (1966). Generalized expectancies for internal versus external control of
reinforcement. Psychological Monographs, 80(1), 1-2.
Schumpeter, J.A. (1942). Capitalism, Socialism and Democracy. NY: Harper.
Vereshchagina, G. and H.A. Hopenhayn (2009). Risk Taking by Entrepreneurs. American
Economic Review 99(5), 1808-1830.
Wagner, Gert G., Joachim R. Frick, and Jürgen Schupp (2007). The German Socio-Economic
Panel Study (SOEP). Scope, Evolution and Enhancements. Journal of Applied Social
Science Studies 127(1), 139-170.
Wooldridge, Jeffrey M. (2014). Quasi-maximum Likelihood Estimation and Testing for
Nonlinear Models with Endogenous Explanatory Variables. Journal of Econometrics 182,
226-234.
Zhao, H. and S.E. Seibert (2006). The Big Five Personality Dimensions and Entrepreneurial
Status: A Meta-Analytical Review. Journal of Applied Psychology 91(2), 259-271.

31
Tables
Table 1: Matrix of transitions between employment and entrepreneurship states
Columns: state in t+1
Rows: state in t (1) (2) (3) (4) Total
(1) Non-employment Obs. 4,043 1,280 121 26 5,470
% 73.9 23.4 2.2 0.5 100.0
(2) Paid employment Obs. 1,257 30,937 144 134 32,472
% 3.9 95.3 0.4 0.4 100.0
(3) Solo-entrepreneurship Obs. 83 149 1,670 206 2,108
% 3.9 7.1 79.2 9.8 100.0
(4) Employer-entrepreneurship Obs. 33 88 192 1,736 2,049
% 1.6 4.3 9.4 84.7 100.0
Total Obs. 5,416 32,454 2,127 2,102 42,099
Notes: The transition matrix shows the numbers of observations in our estimation sample that switch from one
employment status to another one between the survey interviews in two subsequent years. Observations on the
diagonal remain in the current state.
Source: Authors’ calculations based on SOEP, 2005-2012.

32
Table 2: Sample means by employment state and equal means test by entrepreneur type
t-tests of equal means
(p-values)
Non-
employed
Paid
employees
Solo-
entrepren-
eurs
Employer-
entrepre-
neurs
Solo-entr.
vs. paid
employees
Employers
vs. solo-
entrepren.
Socio-economic variables:
female 0.782 0.505 0.489 0.269 0.146 0.000
education years 12.018 12.689 13.797 14.307 0.000 0.000
married 0.774 0.694 0.667 0.708 0.009 0.005
no. of children 0.975 0.615 0.581 0.736 0.094 0.000
age 42.853 42.978 45.247 45.416 0.000 0.495
unemploym. exp. 2.058 0.568 0.819 0.289 0.000 0.000
migration backgr. 0.184 0.134 0.129 0.114 0.512 0.131
disability degree 3.801 2.828 1.008 1.980 0.000 0.000
east 0.245 0.246 0.243 0.208 0.761 0.007
father’s education 0.109 0.114 0.237 0.209 0.000 0.032
mother’s education 0.060 0.053 0.129 0.115 0.000 0.182
father entrepreneur 0.071 0.070 0.126 0.196 0.000 0.000
Personality:
openness 4.479 4.428 5.037 4.754 0.000 0.000
conscientiousness 5.862 5.971 5.908 6.028 0.001 0.000
extraversion 4.778 4.818 5.099 5.028 0.000 0.044
agreeableness 5.465 5.359 5.399 5.234 0.064 0.000
neuroticism 4.165 3.803 3.747 3.558 0.036 0.000
risk tolerance 4.236 4.581 5.393 5.663 0.000 0.000
int. locus of control 27.277 28.874 29.669 31.502 0.000 0.000
trust 2.263 2.353 2.501 2.426 0.000 0.000
plasticity 9.256 9.245 10.135 9.782 0.000 0.000
stability 15.164 15.527 15.558 15.703 0.488 0.022
distance from
entrep.-prone profile 13.509 12.943 12.096 11.982 0.000 0.143
Industry:
construction 0.000 0.051 0.075 0.134 0.000 0.000
trade 0.000 0.126 0.094 0.165 0.000 0.000
business services 0.000 0.076 0.206 0.214 0.000 0.558
public & pers. serv. 0.000 0.290 0.315 0.213 0.014 0.000
Income and tenure:
capital income 0.000 2.554 2.298 5.558 0.000 0.000
gross labor income 2.711 2.569 7.020 17.221 0.000 0.000
duration 5.098 12.383 5.678 8.367 0.000 0.000
Observation years 5470 32,472 2108 2049
Notes: Unweighted means by employment state in the estimation sample. The personality variables (except risk
tolerance) were standardized in the full sample. The last two columns shows p-values of tests of equal means
between solo-entrepreneurs and paid employees or employer-entrepreneurs, respectively. Three variables not
used in the main analysis (labor income, father’s and mother’s education) are based on fewer observations
because of missing values. Section 3.1 defines the personality variables and Table A1 in the Appendix the socio-
demographic variable.
Source: Authors’ calculations based on SOEP, 2005-2012 (with some variable values from 2003/04).

33
Table 3: Effects on transition probabilities between employment and entrepreneurship states
Transition from
paid employment to solo-entrepreneurship to employer-entrep. to
solo-
entrep.
employer-
entrep.
paid
employm.
employer-
entrep.
paid
employm.
solo-
entrep.
Female 0.8510 0.3392*** 1.2336 0.4191*** 1.1958 0.7967
(0.1874) (0.0826) (0.2873) (0.1193) (0.3751) (0.2301)
education years 1.1123*** 1.1383*** 1.0136 0.9882 0.9924 0.8917**
(0.0431) (0.0541) (0.0330) (0.0426) (0.0474) (0.0436)
no. of children 1.2923** 0.8569 1.2294* 0.8399 1.0957 0.7470**
(0.1431) (0.1108) (0.1305) (0.1096) (0.1696) (0.0982)
age 0.8401* 1.0986 0.8262** 1.2718* 0.7431** 1.0108
(0.0779) (0.1220) (0.0774) (0.1611) (0.0924) (0.1531)
age sq. 1.0023** 0.9989 1.0018 0.9968** 1.0034** 0.9999
(0.0011) (0.0013) (0.0011) (0.0015) (0.0014) (0.0017)
unemploym. exp. 1.0766 0.8108** 1.0724 0.6489*** 0.7847 1.2522
(0.0742) (0.0785) (0.0624) (0.0938) (0.1701) (0.1992)
migration backgr. 1.5061 0.6882 1.1098 0.8193 0.3759** 0.5572
(0.3775) (0.2259) (0.2735) (0.2650) (0.1792) (0.2392)
disability degree 0.9978 0.9996 1.0363*** 1.0283 1.0201** 0.9754
(0.0080) (0.0098) (0.0093) (0.0177) (0.0082) (0.0161)
father entrepreneur 1.7934** 2.3586*** 0.7716 1.4215 0.4955* 0.9779
(0.5136) (0.6436) (0.2203) (0.4673) (0.2083) (0.3083)
capital income 1.0009 1.0082*** 1.0000 1.0016 1.0010 0.9990
(0.0028) (0.0020) (0.0027) (0.0023) (0.0007) (0.0038)
openness 1.6503*** 1.1309 0.9879 0.9637 1.0515 1.1238
(0.1817) (0.1329) (0.1041) (0.1247) (0.1595) (0.1399)
conscientiousness 0.8941 1.1407 0.9691 1.1721 0.7698* 0.8847
(0.0930) (0.1385) (0.0907) (0.1388) (0.1085) (0.0972)
agreeableness 0.9881 1.0439 0.9915 0.9444 1.2537 1.2432*
(0.1033) (0.1152) (0.0849) (0.1068) (0.1833) (0.1529)
risk tolerance 0.8493 0.7661 0.8651 0.7835 0.6740* 1.1858
(0.1441) (0.1249) (0.1323) (0.1439) (0.1413) (0.2303)
risk tolerance sq. 1.0339** 1.0399** 1.0118 1.0312* 1.0401** 0.9843
(0.0165) (0.0160) (0.0151) (0.0180) (0.0194) (0.0168)
int. locus of control 0.8471* 1.0931 0.8546 0.9066 1.1022 0.8252
(0.0838) (0.1310) (0.0834) (0.1066) (0.1634) (0.1009)
trust 1.1186 1.2815** 0.9454 1.1003 1.2577* 1.1049
(0.1180) (0.1497) (0.0786) (0.1313) (0.1643) (0.1233)
construction 2.1183* 2.6891*** 1.0168 2.7292** 0.6211 0.8691
(0.8373) (0.9753) (0.4179) (1.2156) (0.3419) (0.3252)
trade 1.5830 2.4017*** 1.6014 1.8245* 1.2752 0.5895
(0.4862) (0.7155) (0.5456) (0.6515) (0.4686) (0.2198)
business services 1.8416** 1.2875 1.1127 1.5266 0.6561 1.0417
(0.5533) (0.4480) (0.3112) (0.4445) (0.2638) (0.3674)
public & pers. serv. 1.5355* 0.8754 0.9489 0.8260 0.4147** 1.1503
(0.3651) (0.2483) (0.2550) (0.2716) (0.1698) (0.3759)
Variance of latent 10.249*** 9.8641*** 9.8641*** 10.249***
ability (4.6536) (6.1173) (6.1173) (4.6536)
Notes: Jointly estimated competing risk models of transition probabilities. Odds rations reported. Values larger
(smaller) than 1 indicate that a variable increases (decreases) the probability of the transition at hand in comparison
to remaining in the current state. Transitions from and to non-employment are shown in Table A2 in the Appendix.
Insignificant control variables not shown: married, eastern Germany, extraversion, neuroticism. Further controls
not shown: duration in the current state (polynomial of third degree), year dummies. The model accounts for two
types of latent entrepreneurial ability for solo-entrepreneurship and employer-entrepreneurship with estimated
covariance 1.0404 (std.-err.: 0.2949). Log-likelihood=-11,713. N=42,099. */**/***: Odds ratio significantly
different from 1 at the 10%/5%/1% level based on cluster robust standard errors. Source: Authors’ calculations
based on SOEP, 2005-2012 (with some variable values from 2003/04).

34
Table 4: Effects on transition probabilities–With alternative sets of personality variables
Transition from
paid employment to solo-entrepreneurship to employer-entrep. to
solo-
entrep.
employer-
entrep.
paid
employm.
employer-
entrep.
paid
employm.
solo-
entrep.
Big 5 model:
openness 1.7324*** 1.1942 0.9948 1.0145 1.0561 1.1326
(0.1878) (0.1442) (0.1016) (0.1304) (0.1514) (0.1373)
conscientiousness 0.8813 1.1285 0.9670 1.1807 0.7535** 0.8553
(0.0903) (0.1318) (0.0847) (0.1393) (0.1032) (0.0928)
extraversion 1.1047 1.1220 0.8830 1.1839 1.0032 1.0286
(0.1148) (0.1228) (0.0828) (0.1571) (0.1283) (0.1182)
agreeableness 0.9438 1.0476 0.9882 0.9160 1.3164* 1.2294*
(0.0981) (0.1162) (0.0841) (0.1048) (0.1958) (0.1503)
neuroticism 0.9689 1.0584 1.0321 1.0463 1.0084 1.2196*
(0.0890) (0.1005) (0.0911) (0.1207) (0.1413) (0.1382)
2 meta-traits model:
plasticity 1.6970*** 1.2799** 0.8886 1.1563 1.0709 1.1571
(0.1805) (0.1427) (0.0892) (0.1554) (0.1526) (0.1406)
stability 0.9018 1.0629 0.9500 1.0212 0.9789 0.8925
(0.0872) (0.1050) (0.0886) (0.1136) (0.1212) (0.0934)
Profile model:
dist. from entrep.- 0.6989*** 0.8177** 1.1301 0.8377 1.1341 1.1364
prone profile (0.0620) (0.0814) (0.1059) (0.1044) (0.1697) (0.1452)
Specific traits:
risk tolerance 0.8934 0.7649* 0.8977 0.7814 0.6870* 1.2524
(0.1525) (0.1238) (0.1345) (0.1413) (0.1342) (0.2465)
risk tolerance sq. 1.0325** 1.0400*** 1.0079 1.0321* 1.0378** 0.9791
(0.0164) (0.0158) (0.0147) (0.0177) (0.0184) (0.0171)
int. locus of control 0.8702 1.1191 0.8329** 0.9443 1.0606 0.7973*
(0.0829) (0.1325) (0.0762) (0.1065) (0.1420) (0.0932)
trust 1.1257 1.2405* 0.9500 1.0540 1.3145** 1.0825
(0.1189) (0.1414) (0.0792) (0.1212) (0.1773) (0.1216)
Notes: Competing risk models of transition probabilities. The Big 5 model, 2 meta-traits model, entrepreneurship-
prone personality profile model, and specific traits model are estimated separately. The first three specifications do
not include the more specific personality variables (willingness to take risks, locus of control, and trust) and the
fourth only includes these, but not the more general traits. For each of the four specifications, all transitions are
estimated jointly. Odds rations reported. Transitions from and to non-employment are not shown for brevity. The
control variables are the same as in the main estimation (Table 3). The models account for two types of latent
entrepreneurial ability for solo-entrepreneurship and employer-entrepreneurship. N=42,099. */**/***: Odds ratio
significantly different from 1 at the 10%/5%/1% level based on cluster robust standard errors. Source: Authors’
calculations based on SOEP, 2005-2012 (with some variable values from 2003/04).

35
Table 5: Effects on transition probabilities–Including previous monthly labor income
Transition from
paid employment to solo-entrepreneurship to employer-entrep. to
solo-
entrep.
employer-
entrep.
paid
employm.
employer-
entrep.
paid
employm.
solo-
entrep.
gross labor income 1.0086 1.0684** 0.8809** 1.1708*** 0.9533 0.8388**
(0.0661) (0.0347) (0.0496) (0.0646) (0.0383) (0.0574)
Further control var. Yes Yes Yes Yes Yes Yes
Variance of latent 11.815*** 8.6837*** 8.6837*** 11.815***
ability (6.0644) (5.6183) (5.6183) (6.0644)
Notes: Jointly estimated competing risk models of transition probabilities. This specification includes labor income
in the month before the interview as an additional explanatory variable. Odds rations reported. Transitions from and
to non-employment are not shown for brevity. The other control variables are the same as in the main estimation
(Table 3). The model accounts for two types of latent entrepreneurial ability for solo-entrepreneurship and
employer-entrepreneurship with estimated covariance 0.7962 (std.-err.: 0.2338). Log-likelihood=-10,751.
N=39,260. */**/***: Odds ratio significantly different from 1 at the 10%/5%/1% level based on cluster robust
standard errors. Source: Authors’ calculations based on SOEP, 2005-2012 (with some variable values from
2003/04).
Table 6: Effects on transition probabilities–Including the prior employment status
Transition from
paid employment to solo-entrepreneurship to employer-entrep. to
solo-
entrep.
employer-
entrep.
paid
employm.
employer-
entrep.
paid
employm.
solo-
entrep.
prev. non-employed 0.7690 0.8371 0.8225 0.7135 4.5638** 1.9344
(0.1815) (0.2550) (0.2477) (0.2566) (2.9470) (0.9330)
prev. paid employee 1.4250 0.6959 7.1682*** 0.5999
(0.4116) (0.2263) (2.9701) (0.1975)
prev. solo-entrep. 5.8307*** 3.8879*** 1.1270 2.4054***
(1.6332) (1.5038) (0.6044) (0.7647)
prev. employer-ent. 2.3036* 24.892*** 0.3754*** 2.1545***
(1.0959) (6.7744) (0.1368) (0.6402)
Further control var. Yes Yes Yes Yes Yes Yes
Variance of latent 2.5315*** 1.3273 1.9874* 2.5315***
Ability (0.7200) (0.2733) (0.7619) (0.7200)
Notes: Jointly estimated competing risk models of transition probabilities. This specification includes dummy
variables indicating the employment state before the current employment spell. Odds rations reported. Transitions
from and to non-employment are not shown for brevity. The control variables are the same as in the main estimation
(Table 3). The model accounts for two types of latent entrepreneurial ability for solo-entrepreneurship and employer-
entrepreneurship with estimated covariance 1.3273 (std.-err.: 0.2733). Log-likelihood=-11,450. N=42,099.
*/**/***: Odds ratio significantly different from 1 at the 10%/5%/1% level based on cluster robust standard errors.
Source: Authors’ calculations based on SOEP, 2005-2012 (with some variable values from 2003/04).

36
Table 7: Summary of hypotheses and estimation results concerning employers
Entry from paid
employment
Entry from solo-
entrepreneurship
Exit from employer-
entrepreneurship
Hypo-
theses Results
Hypo-
theses Results
Hypo-
theses Resulst
Extraversion + (+) +/0 0 0 0
Openness to experience + (+) +/0 0 0 0
Conscientiousness 0 0 0 0 - -
Agreeableness 0 0 0 0 + +
Neuroticism 0 0 0 0 + +
Internal locus of control + 0 +/0 0 - -
Risk tolerance + + +/0 + U-shape U-shape
Trust + + +/0 0 0 +
Education levels + + +/0 0 - -
Self-employed parents + + +/0 0 - -
Age Inv U (Inv U) Inv U Inv U U-shape U-shape
Capital income + + 0 0 0 0
Unemployment exp. - - - - + 0
Previous income + + + + - -
Note: Hypotheses and Results in italics are consistent with previous research. The hypothesis on the
positive influence of ‘extraversion’ and ‘openness for experience’ on entry into employer-
entrepreneurship finds only support when jointly measured by the meta-trait ‘plasticity’.
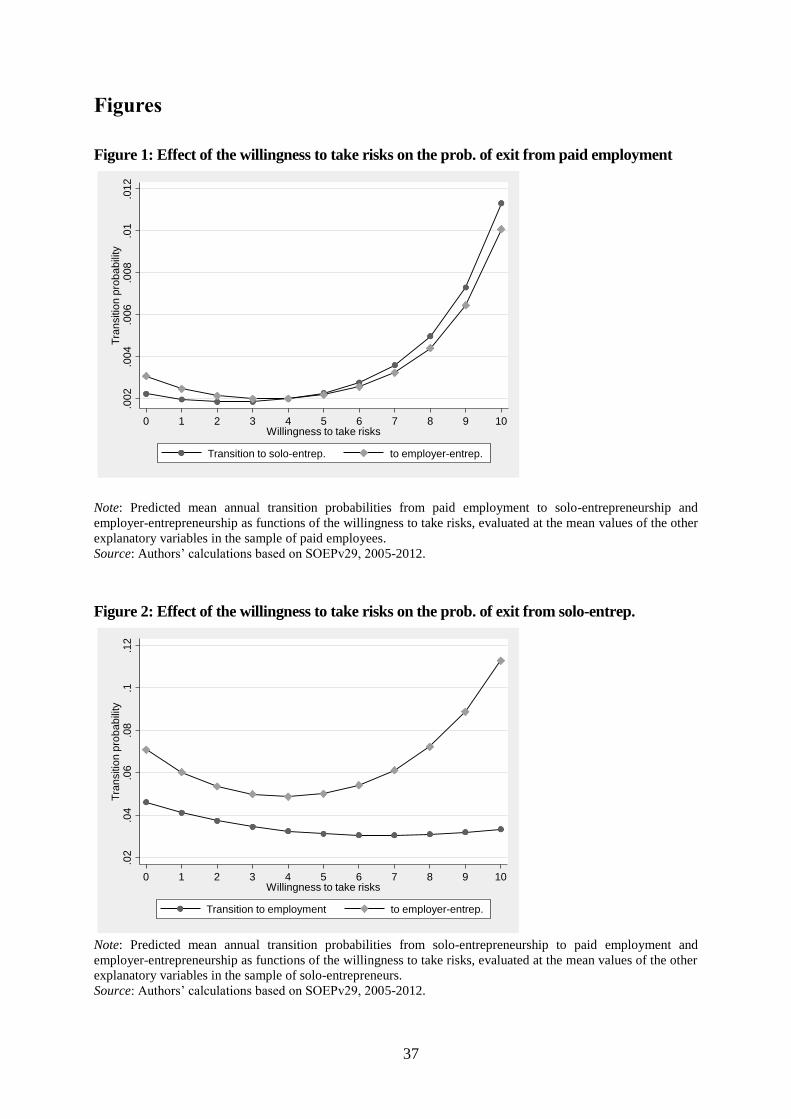
37
Figures
Figure 1: Effect of the willingness to take risks on the prob. of exit from paid employment
Note: Predicted mean annual transition probabilities from paid employment to solo-entrepreneurship and
employer-entrepreneurship as functions of the willingness to take risks, evaluated at the mean values of the other
explanatory variables in the sample of paid employees.
Source: Authors’ calculations based on SOEPv29, 2005-2012.
Figure 2: Effect of the willingness to take risks on the prob. of exit from solo-entrep.
Note: Predicted mean annual transition probabilities from solo-entrepreneurship to paid employment and
employer-entrepreneurship as functions of the willingness to take risks, evaluated at the mean values of the other
explanatory variables in the sample of solo-entrepreneurs.
Source: Authors’ calculations based on SOEPv29, 2005-2012.
.002
.004
.006
.008
.01
.012
Tra
nsitio
n p
rob
ab
ility
0 1 2 3 4 5 6 7 8 9 10Willingness to take risks
Transition to solo-entrep. to employer-entrep.
.02
.04
.06
.08
.1.1
2T
ran
sitio
n p
rob
ab
ility
0 1 2 3 4 5 6 7 8 9 10Willingness to take risks
Transition to employment to employer-entrep.

38
Figure 3: Effect of the willingness to take risks on the prob. of exit from employer-entrep.
Note: Predicted mean annual transition probabilities from employer-entrepreneurship to paid employment and
solo-entrepreneurship as functions of the willingness to take risks, evaluated at the mean values of the other
explanatory variables in the sample of employer-entrepreneurs.
Source: Authors’ calculations based on SOEPv29, 2005-2012.
Figure 4: Effect of age on the probability of exit from paid employment
Note: Predicted mean annual transition probabilities from paid employment to solo-entrepreneurship and
employer-entrepreneurship as functions of age, evaluated at the mean values of the other explanatory variables in
the sample of paid employees.
Source: Authors’ calculations based on SOEPv29, 2005-2012.
0.0
2.0
4.0
6.0
8.1
Tra
nsitio
n p
rob
ab
ility
0 1 2 3 4 5 6 7 8 9 10Willingness to take risks
Transition to employment to solo-entrep.
.001
.002
.003
.004
.005
Tra
nsitio
n p
rob
ab
ility
20 30 40 50 60Age
Transition to solo-entrep. to employer-entrep.

39
Figure 5: Effect of age on the probability of exit from solo-entrepreneurship
Note: Predicted mean annual transition probabilities from solo-entrepreneurship to paid employment and
employer-entrepreneurship as functions of age, evaluated at the mean values of the other explanatory variables in
the sample of solo-entrepreneurs.
Source: Authors’ calculations based on SOEPv29, 2005-2012.
Figure 6: Effect of age on the probability of exit from employer-entrepreneurship
Note: Predicted mean annual transition probabilities from employer-entrepreneurship to paid employment and
solo-entrepreneurship as functions of age, evaluated at the mean values of the other explanatory variables in the
sample of employer-entrepreneurs.
Source: Authors’ calculations based on SOEPv29, 2005-2012.
0.0
5.1
.15
.2T
ran
sitio
n p
rob
ab
ility
20 30 40 50 60Age
Transition to employment to employer-entrep.
0.0
2.0
4.0
6.0
8.1
Tra
nsitio
n p
rob
ab
ility
20 30 40 50 60Age
Transition to employment to solo-entrep.

40
Appendix: Supplementary Tables
Table A1: Description of the socio-economic variables
Variable Definition
education years Calculated from the standard years of schooling required to obtain the highest degree
obtained by the respondent.
married Dummy for a married and not separated person.
no. of children Number of children under 17 in the household.
unemployment exp. Years of unemployment exposure.
migration background Born outside Germany or without German citizenship, or at least one parent was born
outside Germany or has no German citizenship.
disability degree Officially assessed and certified degree of disability.
east Dummy for a person living in the area of former East Germany or Berlin.
father’s education Dummy for a person whose father obtained a high school degree qualifying for
university entrance.
mother’s education Dummy for a person whose mother obtained a high school degree qualifying for
university entrance.
father entrepreneur Dummy for a person whose father was self-employed when the respondent was 15 years
old.
capital income Real income from interest, dividends and property rents before taxes in the previous year
in 1000 euro in prices of 2005. Some respondents report the exact amount of their
financial income, while others only indicate a range. For the latter respondents, we
impute the mean income of those who give the exact amount within this range.
gross labor income Real labor income before taxes in the month before the interview in 1000 euro in prices
of 2005.
duration Tenure in the current employment state (solo-entrepreneurship, employer-
entrepreneurship, paid employment, unemployment/non-participation). For left-censored
spells, we use the retrospectively elicited duration since the last job change.
Notes: Dummy variables equal 1 if the condition holds and 0 otherwise. The personality variables are explained
in Section 3.1.

41
Table A2: Effects on transition probabilities from and to non-employment
Transition from non-employment to Transition to non-employment from
paid
employm.
solo-
entrep.
employer-
entrep.
paid
employm.
solo-
entrep.
employer-
entrep.
female 0.6599*** 0.2849*** 0.2503** 1.9537*** 3.5406*** 6.6381***
(0.0630) (0.0810) (0.1499) (0.1482) (1.0131) (3.1584)
education years 1.0211 1.1899*** 0.9023 0.9786 0.9872 0.7687***
(0.0166) (0.0550) (0.0895) (0.0143) (0.0511) (0.0641)
married 0.8705 0.6803 0.5923 1.2490*** 1.0130 1.7350
(0.0808) (0.1949) (0.3490) (0.0997) (0.3118) (0.8118)
no. of children 0.8711*** 0.8425 0.6910 0.9217* 1.2805 1.0289
(0.0380) (0.1016) (0.2047) (0.0415) (0.1936) (0.2540)
age 1.1915*** 1.6729*** 1.9979** 0.7634*** 0.9645 0.8113
(0.0415) (0.2026) (0.5558) (0.0216) (0.1347) (0.1775)
age sq. 0.9974*** 0.9936*** 0.9913*** 1.0030*** 1.0004 1.0022
(0.0004) (0.0014) (0.0033) (0.0003) (0.0016) (0.0026)
unemploym. exp. 0.9671** 0.8720** 0.7481*** 1.2172*** 1.0079 1.8610***
(0.0150) (0.0514) (0.0819) (0.0173) (0.0593) (0.2772)
migration backgr. 0.8703 0.6429 2.5577* 1.1184 0.6454 0.5691
(0.0876) (0.2165) (1.3087) (0.0991) (0.2795) (0.3556)
disability degree 0.9949 0.9919 0.9555** 1.0027 1.0221* 0.9690
(0.0033) (0.0090) (0.0220) (0.0023) (0.0136) (0.0210)
east 1.3431*** 1.0760 1.0714 1.1291* 0.8812 0.4856
(0.1215) (0.3158) (0.6764) (0.0813) (0.2512) (0.2691)
father entrepreneur 1.0625 0.8602 3.6682** 0.8216 0.7729 1.6477
(0.1703) (0.3670) (2.4028) (0.1151) (0.3188) (0.9820)
openness 0.9500 1.3444** 0.9792 1.1154*** 0.8466 1.3113
(0.0394) (0.1872) (0.2188) (0.0399) (0.1224) (0.2925)
conscientiousness 1.1360*** 0.9212 0.8820 0.9874 1.0951 1.1723
(0.0469) (0.1116) (0.2302) (0.0340) (0.1353) (0.2599)
agreeableness 0.9602 1.2035 0.9024 1.0150 1.3319** 1.0462
(0.0399) (0.1480) (0.2120) (0.0369) (0.1673) (0.2452)
neuroticism 1.0166 1.0091 1.0638 1.0915*** 0.9291 0.8331
(0.0416) (0.1304) (0.2165) (0.0364) (0.1216) (0.2011)
risk tolerance 1.1858*** 1.0474 0.9915 0.9465 0.8930 1.4549
(0.0689) (0.1934) (0.2718) (0.0463) (0.1899) (0.5009)
risk tolerance sq. 0.9831*** 1.0155 1.0136 1.0056 1.0219 0.9777
(0.0063) (0.0177) (0.0265) (0.0052) (0.0207) (0.0300)
int. locus of control 1.0201 0.9485 1.4131 0.9357* 0.8309 0.7331
(0.0401) (0.1140) (0.3193) (0.0324) (0.1000) (0.1682)
trust 1.0343 1.1132 1.3251 0.9601 0.7656** 0.6719**
(0.0415) (0.1289) (0.3763) (0.0315) (0.0841) (0.1291)
construction 1.5440*** 0.6762 0.7594
(0.2015) (0.3324) (0.5542)
business services 0.8066* 0.4102** 0.4222
(0.1008) (0.1731) (0.3040)
public & pers. serv. 0.8110*** 0.3979*** 0.8505
(0.0633) (0.1234) (0.5743)
Variance of latent 10.249*** 9.8641***
ability (4.6536) (6.1173)
Notes: Jointly estimated competing risk models of transition probabilities. Odds rations reported. All other
transitions are shown in Table 3. Insignificant control variables not shown: capital income, extraversion, trade.
Further controls not shown: duration in the current state (polynomial of third degree), year dummies. In the
equation of transition from non-employment to employer-entrepreneurship we do not include year dummies
because this would predict some transitions perfectly. The model accounts for two types of latent entrepreneurial
ability for solo-entrepreneurship and employer-entrepreneurship with estimated covariance 1.0404 (std.-err.:
0.2949). Log-likelihood=-11,713. N=42,099. */**/***: Odds ratio significantly different from 1 at the
10%/5%/1% level based on cluster robust standard errors. Source: Authors’ calculations based on SOEP, 2005-
2012 (with some variables from 2003/04).

42
Table A3: Effects on transition prob. accounting for potential endogeneity of education
Transition from
paid employment to solo-entrepreneurship to employer-entrep. to
solo-
entrep.
employer-
entrep.
paid
employm.
employer-
entrep.
paid
employm.
solo-entrep.
reduced form resid. 0.5844*** 0.7197*** 0.8700 1.1456 0.9062 1.5189**
(0.1147) (0.0879) (0.1099) (0.1881) (0.1067) (0.2711)
female 0.9914 0.3451*** 1.3203 0.4738*** 1.2294 0.7321
(0.2244) (0.0898) (0.3026) (0.1359) (0.3963) (0.2235)
education years 1.7245*** 1.5132*** 1.1622 0.8750 1.0745 0.6662**
(0.3350) (0.1720) (0.1420) (0.1375) (0.0945) (0.1058)
no. of children 1.2577* 0.8790 1.2646** 0.8295 1.1403 0.7381**
(0.1504) (0.1159) (0.1416) (0.1136) (0.1802) (0.1049)
age 0.7869** 1.0488 0.8344* 1.3086** 0.7723** 1.0333
(0.0780) (0.1241) (0.0802) (0.1643) (0.0966) (0.1605)
age sq. 1.0030** 0.9994 1.0017 0.9966** 1.0029** 0.9997
(0.0012) (0.0014) (0.0011) (0.0015) (0.0014) (0.0018)
unemploym. exp. 1.2319** 0.8397 1.0324 0.6227*** 0.8551 1.2067
(0.1110) (0.0924) (0.0694) (0.1006) (0.1926) (0.2040)
migration backgr. 1.6546* 0.7789 1.0730 0.5891 0.4141* 0.6413
(0.4340) (0.2565) (0.2752) (0.1962) (0.1982) (0.2898)
disability degree 1.0015 1.0046 1.0369*** 1.0252 1.0218*** 0.9777
(0.0079) (0.0097) (0.0093) (0.0177) (0.0081) (0.0164)
east 0.5643* 0.6796 0.7558 0.9319 0.7709 0.9176
(0.1669) (0.1877) (0.1947) (0.2728) (0.2618) (0.2860)
father entrepreneur 1.3996 1.9582** 0.7585 1.8513* 0.4867* 1.1321
(0.4859) (0.5541) (0.2402) (0.6539) (0.2031) (0.3785)
capital income 0.9958 1.0056** 0.9997 1.0005 1.0008 0.9987
(0.0037) (0.0022) (0.0024) (0.0020) (0.0007) (0.0042)
openness 1.4204** 0.9717 0.9712 0.9947 1.0439 1.1744
(0.1985) (0.1234) (0.1131) (0.1381) (0.1613) (0.1535)
conscientiousness 1.0100 1.1956 1.0536 1.0941 0.8363 0.8710
(0.1203) (0.1547) (0.1222) (0.1647) (0.1243) (0.1021)
agreeableness 0.9989 0.9998 0.9308 1.0265 1.1588 1.2267
(0.1052) (0.1136) (0.0891) (0.1267) (0.1750) (0.1567)
risk tolerance 0.8110 0.7037** 0.9474 0.7433 0.6768* 1.2802
(0.1400) (0.1197) (0.1577) (0.1394) (0.1462) (0.2560)
risk tolerance sq. 1.0386** 1.0469*** 1.0030 1.0367** 1.0372* 0.9737
(0.0169) (0.0169) (0.0163) (0.0184) (0.0200) (0.0180)
int. locus of control 0.7608** 0.9955 0.8482 0.9699 1.0568 0.8654
(0.0818) (0.1291) (0.0864) (0.1123) (0.1584) (0.1139)
construction 3.0571*** 2.5600** 1.0262 2.6144** 0.5206 0.8891
(1.3150) (1.0079) (0.4490) (1.2105) (0.3149) (0.3590)
trade 2.1027** 2.7133*** 1.6036 1.8879* 1.3316 0.4529*
(0.7227) (0.8471) (0.5734) (0.6906) (0.4898) (0.1871)
business services 1.0869 0.8341 0.8847 1.9409* 0.4686* 2.3310
(0.4504) (0.3170) (0.2930) (0.7720) (0.2156) (1.2905)
public & pers. serv. 1.1673 0.6739 0.7988 1.0354 0.3362** 2.0461
(0.3062) (0.2072) (0.2391) (0.3786) (0.1541) (0.9393)
Variance of latent 12.412*** 7.6490*** 7.6490*** 12.4122***
ability (7.4970) (4.8988) (4.8988) (7.4970)
Notes: Jointly estimated competing risk models of transition probabilities. This specification accounts for potential
endogeneity of education using a control function approach. The reduced form residuals are from a regression of
education on the exogenous variables including father’s and mother’s secondary high school degree as excluded
instruments. Odds rations reported. Transitions from and to non-employment not shown for brevity. Insignificant
control variables not shown: married, extraversion, neuroticism, trust. Further control variables not shown: duration in
the current state (polynomial of third degree), year dummies. The model accounts for two types of latent entrepreneurial
ability for solo-entrepreneurship and employer-entrepreneurship with estimated covariance 0.8051 (std.-err.: 0.2348).
Log-likelihood=-10,981. N=39,559. This is less than in Table 3 due to missing values in parental education. */**/***:
Odds ratio significantly different from 1 at the 10%/5%/1% level based on cluster robust standard errors. Source:
Authors’ calculations based on SOEP, 2005-2012 (with some variable values from 2003/04).

43