what makes wealth grow? a wealth sensitive...
TRANSCRIPT

Journal of Financial Counseling and Planning Volume 25, Issue 1, 2014, 90-104.© 2014 Association for Financial Counseling and Planning Education®. All rights of reproduction in any form reserved
90
What Makes Wealth Grow? A Wealth Sensitive Financial Statement AnalysisIvan F. Beutler1
Wealth growth opportunities are difficult to observe using traditional financial statements. In this case study, an analysis using a wealth-sensitive balance sheet and income-expense statement is presented to help identify corrective adjustments that promote wealth growth. Adjustments involve the application of straightforward financial practices such as paying off debt, living within means, saving and investing 10% of earned income, re-investing all investment income, and converting excessive depreciating assets into wealth producing assets. The analysis also includes an estimate of the direction and magnitude of wealth growth change that is likely to occur from taking a set of proposed corrective adjustments.
Key Words: financial statements, wealth growth, consumer lifestyle
2013 AFCPE Outstanding Conference Paper1School of Family Life, Brigham Young University, 2048 JFSB, Provo UT 84602, (801) 422-6416, [email protected]
IntroductionWalking back to my office I couldn’t help feeling pleased. I was just returning from a wealth growth seminar presented by my upper division finance students. The students had done well; applying an integrated financial statement analysis, they had demonstrated how the Dover family could triple their annual rate of wealth accumulation in preparation for retirement. This was indeed a remarkable insight for the Dovers. Only ten years from retirement, these recommendations could dramatically change the landscape of their golden years. But the real pleasure I felt was for my students; their learning had increased. Their progress was especially meaningful considering that in the first week of class, when introduced to this case problem, their only recommendation for enhancing wealth growth was to invest part of the grocery money and the entire clothing budget to that end.
Wealth growth for retirement or other purposes has been an academic topic of interest for over a century. Family economic success was identified by Kinley (1911) in terms of five objectives: pursing maximum earnings and wealth, practicing efficient consumption, finding life satisfaction, reaching financial security, and accumulating wealth for retirement or for heirs. Since the time of Kinley, these objectives have been taught in one form or another (Muskie & Winter, 2004).
Monetary resources flow in and out of the household economy. Early in that economy life cycle savings out of
earned income is a primary source of wealth accumulation. As Israelsen (2010) has further observed, we do not control the stock market or the economy; instead the wealth we accumulate is most likely to be determined by how well our long term investment portfolio is funded; we must save and invest (Israelsen, 2010). In today’s high-tech world there is a great deal of information regarding wealth accumulation. However, much of it is misleading, biased, and self-serving. The information explosion accommodated through technology advances, with all of its advantages, has placed financial markets in flux and continuous transition. At a time like this, the basics of a sound financial foundation should not be overlooked. The role of savings, investing, and monitoring with information available in basic balance sheet and income-expense statements continues to be a valuable source of decision-information in the creation of wealth.
Nearly three decades ago, a colleague and I co-authored a paper on wealth growth within the context of the employed or wage earner household (Jenkins & Beutler, 1984). That early work was the catalyst for my enduring interest in the topic of wealth growth and how it occurs over a generation of family life. In that early paper, the sources and paths of household wealth accumulation were explained via algebraic equations. The approach illustrated here demonstrates how a given family’s wealth can grow and be enhanced through adherence to simple financial practices.
Journal of Financial Counseling and Planning Volume 25, Issue 1, 2014 91
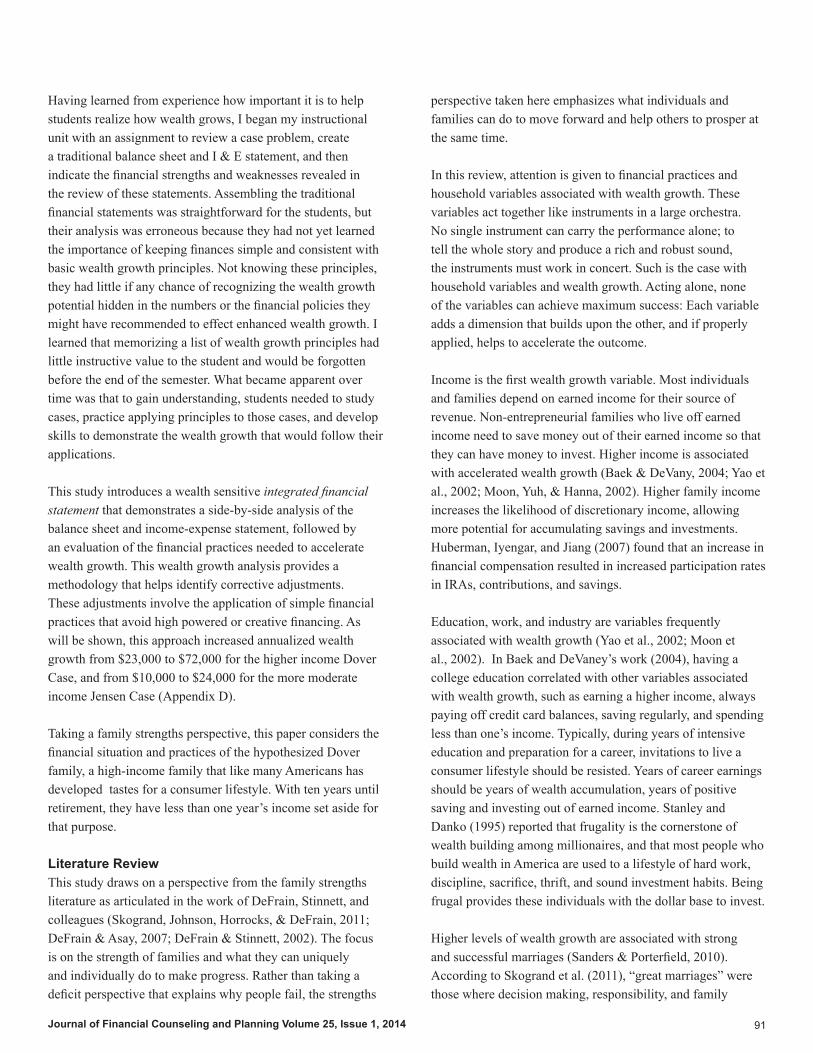
Having learned from experience how important it is to help students realize how wealth grows, I began my instructional unit with an assignment to review a case problem, create a traditional balance sheet and I & E statement, and then indicate the financial strengths and weaknesses revealed in the review of these statements. Assembling the traditional financial statements was straightforward for the students, but their analysis was erroneous because they had not yet learned the importance of keeping finances simple and consistent with basic wealth growth principles. Not knowing these principles, they had little if any chance of recognizing the wealth growth potential hidden in the numbers or the financial policies they might have recommended to effect enhanced wealth growth. I learned that memorizing a list of wealth growth principles had little instructive value to the student and would be forgotten before the end of the semester. What became apparent over time was that to gain understanding, students needed to study cases, practice applying principles to those cases, and develop skills to demonstrate the wealth growth that would follow their applications.
This study introduces a wealth sensitive integrated financial statement that demonstrates a side-by-side analysis of the balance sheet and income-expense statement, followed by an evaluation of the financial practices needed to accelerate wealth growth. This wealth growth analysis provides a methodology that helps identify corrective adjustments. These adjustments involve the application of simple financial practices that avoid high powered or creative financing. As will be shown, this approach increased annualized wealth growth from $23,000 to $72,000 for the higher income Dover Case, and from $10,000 to $24,000 for the more moderate income Jensen Case (Appendix D).
Taking a family strengths perspective, this paper considers the financial situation and practices of the hypothesized Dover family, a high-income family that like many Americans has developed tastes for a consumer lifestyle. With ten years until retirement, they have less than one year’s income set aside for that purpose.
Literature ReviewThis study draws on a perspective from the family strengths literature as articulated in the work of DeFrain, Stinnett, and colleagues (Skogrand, Johnson, Horrocks, & DeFrain, 2011; DeFrain & Asay, 2007; DeFrain & Stinnett, 2002). The focus is on the strength of families and what they can uniquely and individually do to make progress. Rather than taking a deficit perspective that explains why people fail, the strengths
perspective taken here emphasizes what individuals and families can do to move forward and help others to prosper at the same time.
In this review, attention is given to financial practices and household variables associated with wealth growth. These variables act together like instruments in a large orchestra. No single instrument can carry the performance alone; to tell the whole story and produce a rich and robust sound, the instruments must work in concert. Such is the case with household variables and wealth growth. Acting alone, none of the variables can achieve maximum success: Each variable adds a dimension that builds upon the other, and if properly applied, helps to accelerate the outcome.
Income is the first wealth growth variable. Most individuals and families depend on earned income for their source of revenue. Non-entrepreneurial families who live off earned income need to save money out of their earned income so that they can have money to invest. Higher income is associated with accelerated wealth growth (Baek & DeVany, 2004; Yao et al., 2002; Moon, Yuh, & Hanna, 2002). Higher family income increases the likelihood of discretionary income, allowing more potential for accumulating savings and investments. Huberman, Iyengar, and Jiang (2007) found that an increase in financial compensation resulted in increased participation rates in IRAs, contributions, and savings.
Education, work, and industry are variables frequently associated with wealth growth (Yao et al., 2002; Moon et al., 2002). In Baek and DeVaney’s work (2004), having a college education correlated with other variables associated with wealth growth, such as earning a higher income, always paying off credit card balances, saving regularly, and spending less than one’s income. Typically, during years of intensive education and preparation for a career, invitations to live a consumer lifestyle should be resisted. Years of career earnings should be years of wealth accumulation, years of positive saving and investing out of earned income. Stanley and Danko (1995) reported that frugality is the cornerstone of wealth building among millionaires, and that most people who build wealth in America are used to a lifestyle of hard work, discipline, sacrifice, thrift, and sound investment habits. Being frugal provides these individuals with the dollar base to invest.
Higher levels of wealth growth are associated with strong and successful marriages (Sanders & Porterfield, 2010). According to Skogrand et al. (2011), “great marriages” were those where decision making, responsibility, and family

Journal of Financial Counseling and Planning Volume 25, Issue 1, 201492
work were shared. Three themes with implications for wealth growth emerged from their data. First, for most couples, one partner acted as a manager, handling the day-to-day finances. This required trust and effective communication between spouses. Additional research indicates that couples with “great marriages” trust each other with money and are able to communicate effectively about financial matters, such as checking account management, investment decisions, and planning for retirement (McConocha & Tully, 2001; Stanley, Markman, & Whitton, 2002). A second finding from the Skogrand et al. study (2011) was that the couples had little or no debt or had a goal of paying off debt. Third, the couples lived within their means and were frugal.
Issues around money can be especially controversial. Tensions regarding budgeting and debt have been reported to lower marital satisfaction and wealth growth (Bryant, Taylor, Lincoln, Chatters, & Jackson, 2008). Olson and Olson-Sigg (2000) reported that debt was a top-five financial stumbling block in marriage in their study of over 21,000 couples. Consumer debt, such as automobile and credit card debt, is negatively related to marital satisfaction (Skogrand et al., 2005). Although financial education can help couples increase marital satisfaction, Muskie and Winter (2001) observed that only a minority of couples actually implemented the financial practices that improve couple relationships.
Debt is not only problematic in terms of wealth growth among married couples; it is also problematic among college students, not only in terms of wealth growth, but also other life choices that affect prosperity. In 2009, a survey among undergraduate college students found that 84% of the participants possessed one or more credit cards. More troubling in that report was that 82% of the students surveyed carried a credit card balance that averaged $3,173 (Sallie Mae, 2009). Keeping a credit card balance of more than $1,000 is associated with risky credit behavior and other unhealthy behaviors, such as eating poorly, abusing drugs and alcohol, engaging in unsafe sex, and reckless driving (Adams & Moore, 2007; Nelson, Lust, Story, & Ehlinger, 2008). Roberts and Jones (2001) found high credit card debt correlations with compulsive buying. Grable and Joo (2006) found that heavy credit card debt among college students was also associated with financial stress.
The above findings are in direct opposition to those that show a positive relationship between responsible financial behaviors, including prudent borrowing practices, and increased wealth, not only in terms of retirement earnings but also in life satisfaction and physical and emotional
well-being (Xiao, Barber, & Shim, 2008). In this regard, sound risk management methods have been deemed a high priority in managing family resources and in fostering stable family relationships (Garman & Forgue 2012). Likewise keeping finances simple and avoiding excessive debt has been observed as a way to reduce financial stress (Hibbert, Beutler, & Martin, 2004). Simplicity allows the family money manager to track more easily when the family has been living within its means, and how well an investment is really performing (Quinn, 2009).
Muskie and Winter’s (2004, 1999) qualitative work among Midwestern families observed surprising reliance on consumer debt. Participants in the study viewed debt as an ongoing, normal, and acceptable way to control the family’s financial situation; debt enabled continuity. To participants, even debt for nonessential “toys” seemed a perfectly logical thing. The feeling expressed was that “most people have a credit card that is never paid off.” Family money managers wanted flexibility and spontaneity rather than the constraints they perceived in a formal budgeting process. Consumer debt enhanced life satisfaction and allowed stability, ease, and comfort. Even when they could pay for it, families continued to use credit—justifying it by the sense of freedom it gave them. They viewed the practice as harmless and inexpensive: Why not borrow some money and have a little extra to do the things I’d like to do now?
In today’s complex financial arena, it is easy for families to feel that day-to-day decisions regarding consumer expenditures, savings, and debt have little influence on wealth growth because they are not professional money managers, but that is far from true. The purpose of this paper is to demonstrate a potential for increased wealth creation within a household through the use of a wealth sensitive integrated financial statement analysis that adopts the sound financial practices commonly espoused in family and personal finance literature. With the help of professionals, family money managers can be key players in the creation of wealth as they apply basic principles and practice them.
MethodologyIt is difficult to observe missed opportunities for wealth growth using traditional financial statements. To remedy these shortcomings, a wealth sensitive financial statement was created (Figure 1). The statement consists of two worksheets, a balance sheet, and an income and expense statement.

Journal of Financial Counseling and Planning Volume 25, Issue 1, 2014 93
Wealth Sensitive Balance SheetThe wealth sensitive balance sheet contains the same information as the traditional balance sheet, but the information is presented in a different format. As illustrated in Figure 1, the information for each sub-category of cash and near cash is entered on a single line as the asset amount, the debt amount, and the equity dollar amount, respectively, from left to right. The same pattern is continued for each of the remaining five balance sheet categories.
From a wealth creation perspective, the role of each asset class was labeled as follows: cash and near cash for transaction purposes, investment assets as wealth producing, home residence as wealth preserving, business assets as income producing, use assets as wealth depreciating, and consumer debt as wealth depleting. Viewed in this way, some obvious implications for making wealth grow became more apparent. For example, the advantage of conserving on the purchase of certain use assets and investing that amount, instead, in wealth producing assets was recognized as an obvious wealth creation strategy.
Wealth Sensitive Income and Expense Statement The wealth sensitive income and expense statement was arranged in three columns, by type and amount: Income was in the first (or left) column, expenses in the second column, and saving/investing in the third (or right) column. A second formatting difference is that earned income (e.g., salary & wages), the expenses paid out of earned income, and saving/investing out of earned income are listed in the top section of the I & E statement. Investment income (e.g., realized dividends, interest, or rental income), expenses paid out of investment income, and re-investment of realized investment income are listed in the second or bottom section.
With the I & E statement arranged as described above, saving and investing out of earned income provided a direct observation of how much earned income had contributed to wealth growth—a direct link to the balance sheet. Likewise, the formatting provided a direct observation of how much investment income had contributed to wealth growth—a second direct link to the balance sheet.
Figure 1. Wealth Sensitive Financial Statement—Illustrated
Balance sheet Work sheet 1 Income & expense statement
Assets Debt Equity to track changes in: Balance Sheet & Income-Expenses
Earned income Expenses Saving/invest
1. Cash & near cash…
Tranactions
2. Investment assets…
a. non tax deferred Earned income totals:
b. tax deferred (IRA, 401k) Income Expenses Save/invest
Wealth producing
3. Home asset…….…. Investment inc Expenses Net income
Wealth preserving
4. Business assets.. Investment income totals:
Income producing Income Expenses Reinvested
5. Use assets…….. Total inflow Expense outflow Save/invest
Wealth depreciating
6. Non- assets... Work sheet 2 debt management & notes
(consumer credit debt) Debt (yrly) Wealth growth
Wealth depleting pmts List Debt Int pd Princ pd Appreciation
Totals:
Assets Debt Equity Totals

Journal of Financial Counseling and Planning Volume 25, Issue 1, 201494
Worksheet 1 and 2Worksheet 1 was developed to track adjustments changes made in the balance sheet. Worksheet 2 was developed to track how debt adjustments in the balance sheet affected changes in the I & E statement, and to track annual appreciation or depreciation of listed assets on the balance sheet.
Dover wealth reviewA Dover wealth review was undertaken to identify actions that could be taken within the constraints of the Dover current financial situation, which would accelerate wealth growth toward financial preparation for retirement. Phase 1 of the review proceeded based on information in the Dover Case problem (Appendix A). The case problem consisted of a brief narrative describing the Dover family, some of their goals, and a summary table of relevant financial information. Much of that financial information was place in a traditional balance sheet and income-expense financial statement (Appendix B). Although the traditional financial statement was familiar, its format was not wealth sensitive and it did not provide the data needed for the wealth review. Therefore based on the Dover Case information, time value of money calculations were used to develop a Dover debt management and appreciation/depreciation data table (i.e. Dover data table) in Phase 1 of the review.
In phase 2, the Dover data table was integrated into a wealth sensitive financial statement that consisted of a balance sheet, dated December 31, 2001, and an I & E statement documenting cash flow during the previous 12 months (2001). This Dover wealth sensitive unadjusted financial statement was so labeled because it represented actual unadjusted financial data for the year 2001.
The unadjusted statement was then adjusted in phase 3 to become a Dover 2002 financial plan. This plan identified the way debts and assets would be managed to make wealth grow in the next 12 months, while maintaining living expenses at their 2001 level. Guidelines used in making these adjustments are contained in Appendix C, but noted here are two important guidelines that were used. First, during the adjustment process Dover resources were redistributed in ways that changed some balance sheet entries and increased others. These adjustments were always done in ways that kept Dover wealth constant. For example, one change was that investment assets were used to pay off rental home mortgage debt. Therefore, investment asset equity was reduced and rental home equity was increased keeping total equity or Dover net worth unchanged.
A second guideline involved the issue of timing. The previous 12 months of Dover finances were history, as documented in the Dover Case (dated December 31, 2001), and could not be changed. However, at the beginning of 2002 adjustments were made in the way assets were held; the effects of these changes were examined at the end of 2002. All adjustments kept Dover living expenses (food, clothing etc.) unchanged during the 12 months of 2002. This guideline was strictly adhered to throughout the analyses in this paper, ruling out the simplest example of potential wealth growth that might have otherwise been undertaken, increasing investment assets through a reduction in living expenses.
Phase 1: The Dover data table. A Dover debt management and appreciation/depreciation data table was developed, as shown below in Table 1. Note that the first section contains all Dover asset values, the stated interest rates and the principle outstanding on each debt. The data was current as of the day the Dover review was conducted (December 31, 2001, the same date as listed on their balance sheet), and the 2001 rates were accepted as a reasonable estimate of rates during the next 12 months.
The second section of the data table details information regarding Dover debt payments made over the course of the previous 12 months, broken out by principle and interest paid during 2001. Also shown is the rate and dollar amount of asset appreciation (positive numbers) or depreciation (negative numbers). This information for the year 2001 is repeated for the year 2002 based on the assumptions that the Dovers will continue debt payments on schedule “as agreed” and that 2001 appreciation/depreciation rates will continue in 2002.
Phase 2: Dover unadjusted wealth sensitive financial statement. This phase consisted of combining data from the Dover traditional statements (Appendix A) with data from the Dover data table (Table 1) into an integrated wealth sensitive format. However, since the data had not been adjusted to affect the dual goals of the review, it was labeled the Dover Unadjusted Financial Statement. The analysis was completed in a side-by-side landscape format but is shown below in a portrait orientation (Figures 2a and 2b).
A review of Figure 2 was conducted and the following observations were made: Checking ($2,000) and saving ($7,050) totaled $9,050 available for transaction purchases. Investment asset equity included MMMF ($30,124), a rental house ($63,606), and a 401k tax deferred bond fund ($130,000 equivalent to after-tax value of approximately $90,000).
Journal of Financial Counseling and Planning Volume 25, Issue 1, 2014 95
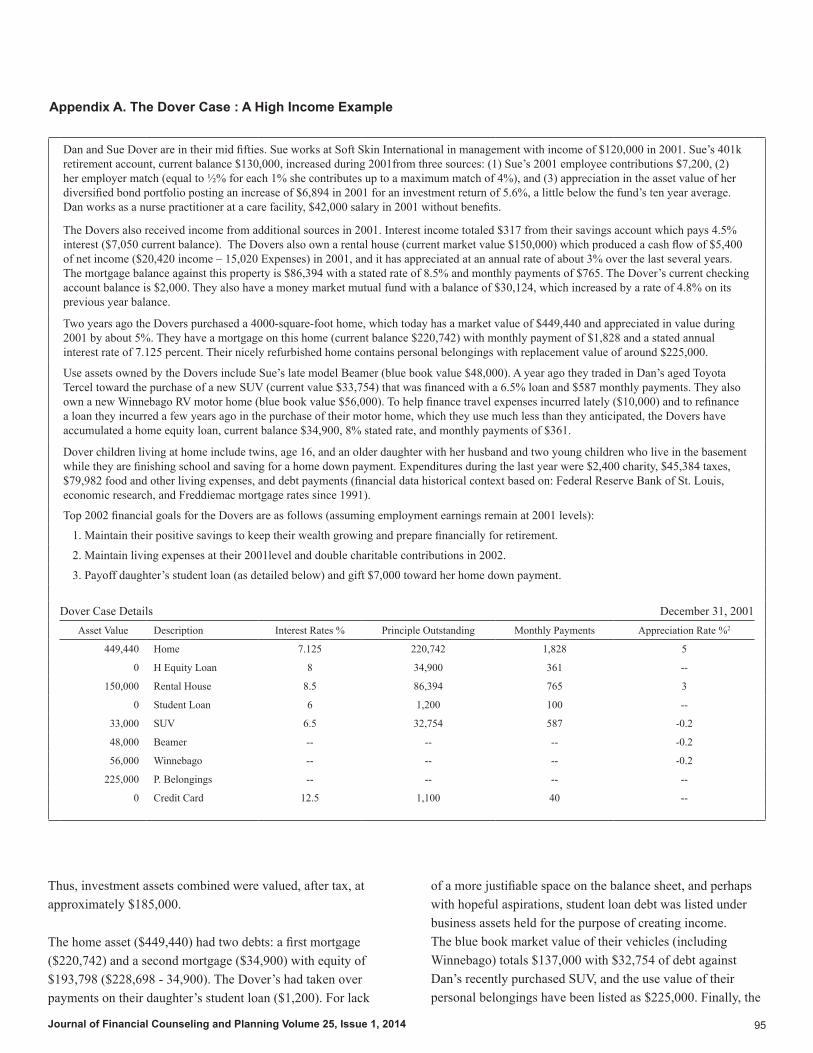
Appendix A. The Dover Case : A High Income Example
Dan and Sue Dover are in their mid fifties. Sue works at Soft Skin International in management with income of $120,000 in 2001. Sue’s 401k retirement account, current balance $130,000, increased during 2001from three sources: (1) Sue’s 2001 employee contributions $7,200, (2) her employer match (equal to ½% for each 1% she contributes up to a maximum match of 4%), and (3) appreciation in the asset value of her diversified bond portfolio posting an increase of $6,894 in 2001 for an investment return of 5.6%, a little below the fund’s ten year average. Dan works as a nurse practitioner at a care facility, $42,000 salary in 2001 without benefits.
The Dovers also received income from additional sources in 2001. Interest income totaled $317 from their savings account which pays 4.5% interest ($7,050 current balance). The Dovers also own a rental house (current market value $150,000) which produced a cash flow of $5,400 of net income ($20,420 income – 15,020 Expenses) in 2001, and it has appreciated at an annual rate of about 3% over the last several years. The mortgage balance against this property is $86,394 with a stated rate of 8.5% and monthly payments of $765. The Dover’s current checking account balance is $2,000. They also have a money market mutual fund with a balance of $30,124, which increased by a rate of 4.8% on its previous year balance.
Two years ago the Dovers purchased a 4000-square-foot home, which today has a market value of $449,440 and appreciated in value during 2001 by about 5%. They have a mortgage on this home (current balance $220,742) with monthly payment of $1,828 and a stated annual interest rate of 7.125 percent. Their nicely refurbished home contains personal belongings with replacement value of around $225,000.
Use assets owned by the Dovers include Sue’s late model Beamer (blue book value $48,000). A year ago they traded in Dan’s aged Toyota Tercel toward the purchase of a new SUV (current value $33,754) that was financed with a 6.5% loan and $587 monthly payments. They also own a new Winnebago RV motor home (blue book value $56,000). To help finance travel expenses incurred lately ($10,000) and to refinance a loan they incurred a few years ago in the purchase of their motor home, which they use much less than they anticipated, the Dovers have accumulated a home equity loan, current balance $34,900, 8% stated rate, and monthly payments of $361.
Dover children living at home include twins, age 16, and an older daughter with her husband and two young children who live in the basement while they are finishing school and saving for a home down payment. Expenditures during the last year were $2,400 charity, $45,384 taxes, $79,982 food and other living expenses, and debt payments (financial data historical context based on: Federal Reserve Bank of St. Louis, economic research, and Freddiemac mortgage rates since 1991).
Top 2002 financial goals for the Dovers are as follows (assuming employment earnings remain at 2001 levels):
1. Maintain their positive savings to keep their wealth growing and prepare financially for retirement.
2. Maintain living expenses at their 2001level and double charitable contributions in 2002.
3. Payoff daughter’s student loan (as detailed below) and gift $7,000 toward her home down payment.
Dover Case Details December 31, 2001Asset Value Description Interest Rates % Principle Outstanding Monthly Payments Appreciation Rate %2
449,440 Home 7.125 220,742 1,828 5
0 H Equity Loan 8 34,900 361 --
150,000 Rental House 8.5 86,394 765 3
0 Student Loan 6 1,200 100 --
33,000 SUV 6.5 32,754 587 -0.2
48,000 Beamer -- -- -- -0.2
56,000 Winnebago -- -- -- -0.2
225,000 P. Belongings -- -- -- --
0 Credit Card 12.5 1,100 40 --
Thus, investment assets combined were valued, after tax, at approximately $185,000.
The home asset ($449,440) had two debts: a first mortgage ($220,742) and a second mortgage ($34,900) with equity of $193,798 ($228,698 - 34,900). The Dover’s had taken over payments on their daughter’s student loan ($1,200). For lack
of a more justifiable space on the balance sheet, and perhaps with hopeful aspirations, student loan debt was listed under business assets held for the purpose of creating income. The blue book market value of their vehicles (including Winnebago) totals $137,000 with $32,754 of debt against Dan’s recently purchased SUV, and the use value of their personal belongings have been listed as $225,000. Finally, the

Journal of Financial Counseling and Planning Volume 25, Issue 1, 201496
Appendix B. Dover Traditional Financial Statements
Dover Traditional Balance SheetAssets Liabilities Dec 31,2001
Monetary assets Current liabilities
Cash 2,000.00 credit card 1,100.00
Checking 7,050.00 home equity loan 34,900.00
Investments
non tax deferred Long-term Liabilities
money mkt mutual fund 30,124.00 home mortgage 220,742.00
rental house 150,000.00 rental mortgage 86,394.00
Tax deferred SUV loan 32,754.00
401k bond fund 130,000.00 student loan 1,200.00
Housing Total liabilities 377,090.00
home residence 449,440.00
Vehicles
Beamer--Sue 48,000.00
SUV--Dan 33,000.00
Winnebago 56,000.00
Personal property
personal belongings 225,000.00
Total assets 1,130,614.00 Net worth 753,524.00
Dover Traditional Income and Expenditure StatementIncome Expenditures Jan 1 - Dec 31, 2001
Salary--Sue 120,000.00 Charity 2,400.00
Salary--Dan 42,000.00 Taxes-fed, state, loc 45,889.00
Rental house net income 5,400.00 Debt payments 34,992.00
Interest income 304.00 Additional living expense
MMMF increase 1,380.00 Food 15,680.00
Employer match 401k 3,600.00 Housing 11,884.00
Transportation 18,514.00
Health care 8,720.00
Clothing 7,876.00
Other 17,308.00
Total income 172,684.00 Total expenditures 163,263.00
Saving/investing 9421
Dover’s wealth-depleting credit card debt has been posted at a modest $1,100.
Strengths of the Dover end of year (December 31, 2001) balance sheet were observed as follows: Impressive total assets ($1,130,614), relatively modest total debt ($377,090), and considerable total equity ($753,524). In addition, based
on Dover income and expenses over the previous 12 months, strengths observed were: ample earned income ($160,000) and positive savings and investing ($9,317). These are, indeed, positive financial strengths to build on.
A critical review from a wealth growth point of view found the following: The Dovers are facing a financial disaster within

Journal of Financial Counseling and Planning Volume 25, Issue 1, 2014 97
Table 1. Dover Debt Management and Appreciation Data Table
` Previous 12 months-year 2001 Next 12 months-year 2002
Asset value
Asset/debt description
Interest rates
Principle balance
Pmt amounts monthly yearly
Principle paid
Interest paid
Appreciation Principle paid (p)
Interest paid (i)
Appreciation amountrate amt
449,440 Home 7.125 220,742 1,828 21,936 5,975 15,961 5% 21,402 6,415 15,521 22,472 0 H equity loan 8 34,900 361 4,332 1,475 2,857 -- -- 1,598 2,734 --
150,000 Rental house 8.5 86,394 765 9,180 1,755 7,425 3% 4,369 1,910 7,270 4,500 0 Student loan 6 1,200 100 1,200 1,092 108 -- -- 1160 40 --
33,000 SUV 6.5 32,754 587 7,044 4,746 2,298 (0.2) (8,250) 5,064 1,980 (6,600)48,000 Beamer -- -- -- -- -- (0.2) (12,000) -- -- (9,600)56,000 Winnebago -- -- -- -- -- (0.2) (14,000) (11,200)
225,000 P. belongings -- -- -- -- -- -- -- -- -- --Credit card 12.5 1,100 40 480 320 160 -- -- 363 117 --
30,124 MMMF -- -- -- -- -- -- 4.80% 1380 -- -- 6
130,000Bond fund 401k -- -- -- -- -- -- 5.60% 6,894 -- -- 7,280
1,121,564Totals -- 377,090 3,681 44,172 15,363 28,809 -- (205) 16,510 27,662 6,858
Appendix C. Methodology Guidelines in a Wealth Growth Review
General Recommendations
1. Give proper attention to education that leads to adequate income.
2. Be safety-minded, use appropriate risk management methods to forestall potential devastating losses.
Specific Recommendations
1. Consider using excess cash/near cash, non-tax deferred assets, or low priority use assets to pay off debt and invest the resulting freed-up perpetual cash flow toward wealth accumulating assets.
2. Conserve on wealth depreciating use assets; when timely, convert from wealth-depreciating to wealth-producing assets.
3. Consider refinancing a mortgage at more favorable terms.
4. Reinvest all net investment income.
5. Get a partial or full employer match (401k) when available.
6. Pay down debt on your home to less than 80% of its asset value to avoid mortgage insurance charges.
7. Save and invest 10% to 12% of earned income for the long haul.
8. Live within your means.Two general and eight specific guidelines were considered in the wealth growth review reported in this study. These guidelines were selected from the literature review and from reasoned conclusions established in extant personal finance literature. Education and career development that leads to earned income is the underlying engine of wealth accumulation in the employee or wage earning family. Likewise, proper risk management methods are essential in safeguarding whatever wealth is accumulated. When adequate income and proper risk management methods are in place, a particularly powerful move toward wealth accumulation is to identify a pool of mobile capital within the current balance sheet. This capital is typically obtained from excess cash/near cash, the timely sale of non-tax deferred investment assets, or the sale of use assets (those you no longer want to afford or have sufficient use for).
Once obtained, this pool of capital will typically be used to pay off expensive debts that can be paid in full. An exception would be the acceleration of mortgage payments to pay down the mortgage to 80% of the property value in order to eliminate mortgage insurance charges. When a debt is paid in full, the freed-up cash flow creates an income stream in the I & E statement. Freed-up cash flow can be achieved in other ways as well (e.g., by refinancing a mortgage at more favorable terms or by reinvesting realized investment income). As will be illustrated below, these income streams can be sizable and fruitful avenues for wealth accumulation.
Freed-up cash flow can be directed toward a variety of wealth accumulating guidelines, such as items 7 through 9 in the table above, or used to meet other priority family financial goals. Not at any time in this analysis were resources taken from the Dover’s living expenses or from their tax obligations to federal, state, or local governments to create a freed-up cash flow. However, if the Dovers were to reduce living expenses, that would also add to their wealth accumulation.

Journal of Financial Counseling and Planning Volume 25, Issue 1, 201498
Figure 2. Dover Wealth Sensitive Unadjusted Financial Statement (Beutler)
Unadjusted Unadjusted X0
Balance sheet Work Sheet
1
Income & expense statement
Dover, Dan & Sue December 31, 2001 Dover, Dan & Sue Jan-Dec 2001
Assets Debt Equity $ Earned income $ Expenses Saving / invest1. Cash & near cash 120,000 Sue salary 2,400 Charity
2,000 Checking 0 2,000 42,000 Dan salary 45,384 Taxes
7,050 Saving 0 7,050 79,982 Living exp (7,958) Discritionary sv/in
34,992 Debt pmts 7,200 Commited 401k
2. Investment assets 162,000 Total earn inc 162,758 Total liv exps (758) Save/invest
a. non tax deferred Invest income Invest expense Reinvestment
30,124 MMMF 30,124 20,420 Rental h exp 5,840 Rental expenses2
5,400
150,000 Rental house 86,394 63,606 0 Rental mortgage 9,180 (p+i)
304 Interest income 91 Tax on interest1 213
b. Tax deferred 1,380 MMMF increase 414 Tax on fund inc 966
130,000 401k Bond fund 0 130,000 3,600 Employer match 3,600
25,704 Total inv inc 15,525 Total invest exp 10,179 sav/inv
3. Home asset Total inflow Expense outflow Saving / invest
449,440 Home 220,742 H. Mortg 228,698 187,704 178,283 9,421
0 Home equity loan 34,900 (34,900)
Worksheet 2
4. Business assets Debt management and details for previous 12 months--2001
0 Student loan 1,200 (1,200) pmt (p+i) Debts listed Mrtg insur i=int pd p=princ pd Apprec./deprec.
21,936 Home mort -- 15,961 5,975 21,402
5. Use assets 4,332 H equity loan 2,857 1,475 --
48,000 Beamer--Sue 0 48,000 9,180 Rental mortgage -- 7,425 1,755 4,369
33,000 SUV--Dan 32,754 246 1,200 Student loan 108 1,092 --
56,000 Winebago 0 56,000 7,044 SUV 2,298 4,746 (8,250)
225,000 P. belongings 0 225,000 Beamer ---- (12,000)
Winnebago -- -- (14,000)
6. Non- assets 480 Credit card 160 320 --
0 Credit card debt 1,100 (1,100) Bond fund 6,894
Total assets Total debt Tot Equ 44,172 <Totals> 0 28,809 15,363 -1,585
1,130,614 377,090 753,524 1Next 12 months interest paid x 30% MTR 2Total debt pmt 44,172 includes 9,180 Rent h mortg pmt
A0= Appreciation during previous 12 months Xc = Current asset value r = Appreciation or depreciation rate Appreciation A0= Xc[r/(1+r)] Depreciation D0= Xc[r /(1-r)]
From a wealth growth perspective, four course corrections would be enormously helpful to the Dovers. First, they should keep finances simple and live within their means. Progress toward simplification could be made by paying off their home equity loan, Dan’s SUV auto loan, and credit card debt. This debt has allowed the Dovers to live beyond their means.
Second, the family should save and invest 10% of their earned income annually. This is a need shared by most—if not all—employee wage earning families. In recent years, the Dovers have persisted in living beyond their means by at least $10,000
the next ten years, when they retire. Their investment assets ($185,000 after tax value) will be sufficient to provide them with no more than an annual $10,000 of purchasing power for a period of 30 years from the point at which they retire, given 3% inflation per year (Israelsen, 2010). That $10,000 per year, plus social security, will not measure up well when compared to the $170,000 that their current lifestyle depends on, especially considering that without a change of course, they will continue to carry considerable outstanding debt.

Journal of Financial Counseling and Planning Volume 25, Issue 1, 2014 99
a year: last year with vacation travel and this year (2001) with a heavily financed SUV purchase. In order to make her 401k contribution ($7,200) and qualify for a partial employer match, Sue borrowed $7200 and an additional $758 to cover other expenses. Consumer debt financing allowed the Dovers to, essentially, hide this form of overspending from themselves.
The third course correction would be to reinvest as much of their net investment income as they can, working toward the ideal to invest all of it. Fourth, the family should conserve on use asset holding and invest the freed up dollars in wealth-producing assets. In phase 3, the specific effect of these corrections on Dover (2002) wealth growth will be demonstrated.
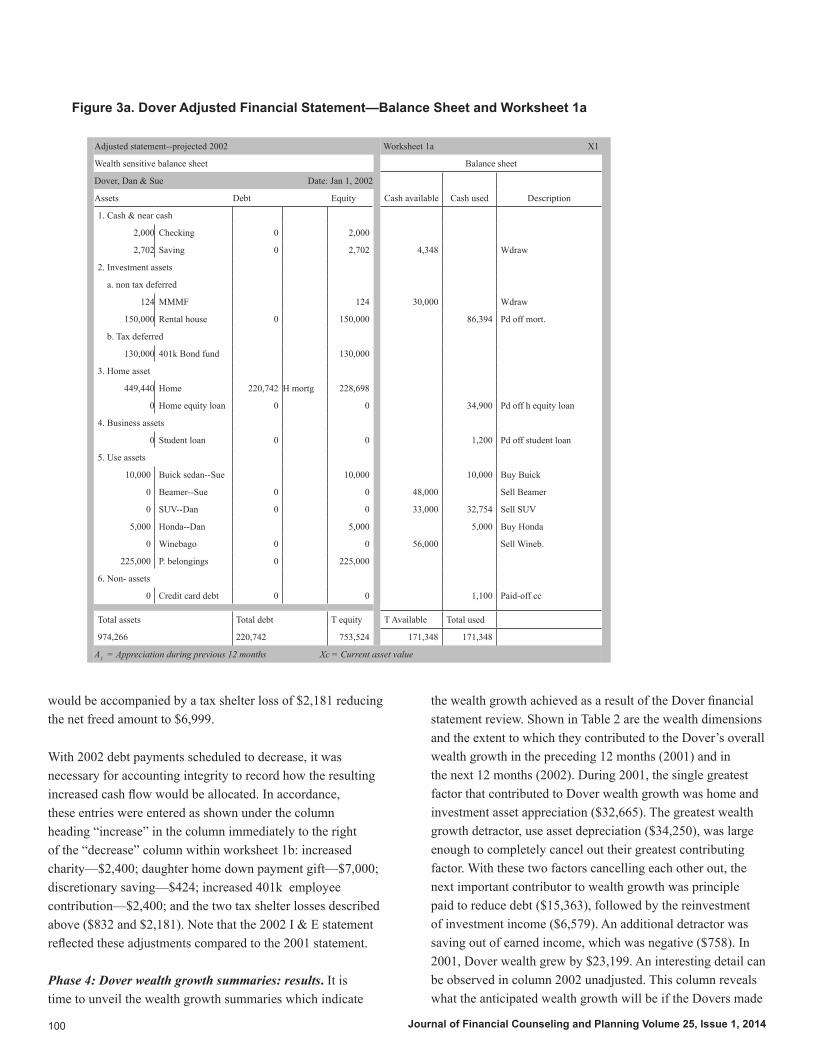
Phase 3: Dover adjusted financial statements—solution A. The first task in phase 3 was to identify capital in cash/near cash, non-tax-deferred investment assets, and use assets that could be accessed and used in more productive ways to simplify finances and accelerate Dover wealth growth. Tax-deferred investment assets were not considered for this purpose because they are taxed as current income upon withdrawal, plus an additional tax penalty would have been levied for early withdrawal. Choosing not to use a tax-deferred asset, it was demeaned appropriate to draw heavily on other forms of capital, as will be demonstrated next. But first a word to the wise: for a new comer to this exercise there is a tendency to reallocate less capital than is optimal. Through multiple renditions of this exercise, it became apparent that taking as much as was needed created the greatest wealth growth; the reach for capital in this section was deep. It would be important to help the Dovers recognize the dire nature of their situation.
Capital was taken from Dover near cash savings ($4,348) and from the non-tax-deferred MMMF ($30,000), as indicated in the left column of worksheet 1a, under the “cash available” heading (Figure 3a). Capital was also taken from the sale of Dover use assets: their Winnebago ($56,000), Sue’s Beamer ($48,000), and Dan’s SUV ($33,000).
Capital used was entered in the second column of worksheet 1 under the heading of “cash used.” Note that the capital was used to pay off debts until there were insufficient funds to pay off more debts. The following debts were paid in full: the rental house ($86,394), the home equity loan ($34,900), their daughter’s student loan ($1,200), Dan’s SUV auto loan (32,754), and the credit card ($1,100). More modest vehicles were also purchased for Dan (a $6,000 Honda) and for Sue (a
$10,000 Buick sedan)—exemplifying the great sacrifices that sometimes must be made in order to live within one’s means. In worksheet 1, all capital was accounted for by checking to see that total cash available ($171,348) equaled total cash used ($171,348), as shown at the bottom of worksheet 1 (Figure 3a). All adjustments described in this exercise were assumed to incur zero transaction costs.
This completes the balance sheet portion of the review process. Note that the first portion consisted of selling assets to pay off debt, not just pay it down. The result was that Dover net worth did not change; the value of total assets was reduced, but the value of total debt was reduced by the same amount. This was a second checkpoint to assure that the accounting had been completed correctly—net worth remained unchanged.
Part two of the phase 3 review consisted in accounting for changes in the Dover income and expenditure statement (Figure 3b statement, right side) that became necessary as a result of debts paid in full with balance sheet adjustments (Figure 3a. statement, left side). These “right side” changes were next entered on worksheet 2 (Figure 3b., bottom, right side) under the heading ‘Debt Management Detailed Notes.’ As indicated, the first mortgage payments on the Dover home for 2002 will total $21,936—($6,415) principle paid and ($15,521) interest paid. Also, based on the assumption here that rates of change in asset values during 2001 would be acceptable estimates for what to expect in the next 12 months, home appreciation was anticipated to be $22,472 in 2002.
The home equity loan was paid off on January 1, 2002 ($34,900) freeing up a perpetual cash flow equal to the eliminated debt payment (after tax $3,512 = 4,332–820). Rental house entries included (1) appreciation ($4,500), (2) debt paid-off (January 1, 2002, $86,394), and (3) freed-up perpetual cash flow (after tax $6,999 = 9,180 –2,181). The student loan, SUV, and credit card debts were paid off, which resulted in additional freed-up cash flows totaling $8,712 [1,200 + 7,044 + 480 - (12 tax shelter loss)]. This freed-up cash flow was then entered into worksheet 1b, adjacent to the 2002 Dover income and expenditure statement, and entered there as a decreased anticipated cash flow via less debt payments (i.e., compared to 2001, 2002 debt payments made out of earned income would be reduced by $13,056 while taxes would increase by $832 due to the corresponding lost tax shelter). Investment income would be increased through the reduction of (p+i) mortgage expenses on the rental house ($9,180). However, the freed-up cash from paying off this debt
Journal of Financial Counseling and Planning Volume 25, Issue 1, 2014100
Figure 3a. Dover Adjusted Financial Statement—Balance Sheet and Worksheet 1a
Adjusted statement--projected 2002 Worksheet 1a X1
Wealth sensitive balance sheet Balance sheet
Dover, Dan & Sue Date: Jan 1, 2002
Cash available Cash used DescriptionAssets Debt Equity
1. Cash & near cash
2,000 Checking 0 2,000
2,702 Saving 0 2,702 4,348 Wdraw
2. Investment assets
a. non tax deferred
124 MMMF 124 30,000 Wdraw
150,000 Rental house 0 150,000 86,394 Pd off mort.
b. Tax deferred
130,000 401k Bond fund 130,000
3. Home asset
449,440 Home 220,742 H mortg 228,698
0 Home equity loan 0 0 34,900 Pd off h equity loan
4. Business assets
0 Student loan 0 0 1,200 Pd off student loan
5. Use assets
10,000 Buick sedan--Sue 10,000 10,000 Buy Buick
0 Beamer--Sue 0 0 48,000 Sell Beamer
0 SUV--Dan 0 0 33,000 32,754 Sell SUV
5,000 Honda--Dan 5,000 5,000 Buy Honda
0 Winebago 0 0 56,000 Sell Wineb.
225,000 P. belongings 0 225,000
6. Non- assets
0 Credit card debt 0 0 1,100 Paid-off cc
Total assets Total debt T equity T Available Total used
974,266 220,742 753,524 171,348 171,348
A1 = Appreciation during previous 12 months Xc = Current asset value
would be accompanied by a tax shelter loss of $2,181 reducing the net freed amount to $6,999.
With 2002 debt payments scheduled to decrease, it was necessary for accounting integrity to record how the resulting increased cash flow would be allocated. In accordance, these entries were entered as shown under the column heading “increase” in the column immediately to the right of the “decrease” column within worksheet 1b: increased charity—$2,400; daughter home down payment gift—$7,000; discretionary saving—$424; increased 401k employee contribution—$2,400; and the two tax shelter losses described above ($832 and $2,181). Note that the 2002 I & E statement reflected these adjustments compared to the 2001 statement.
Phase 4: Dover wealth growth summaries: results. It is time to unveil the wealth growth summaries which indicate
the wealth growth achieved as a result of the Dover financial statement review. Shown in Table 2 are the wealth dimensions and the extent to which they contributed to the Dover’s overall wealth growth in the preceding 12 months (2001) and in the next 12 months (2002). During 2001, the single greatest factor that contributed to Dover wealth growth was home and investment asset appreciation ($32,665). The greatest wealth growth detractor, use asset depreciation ($34,250), was large enough to completely cancel out their greatest contributing factor. With these two factors cancelling each other out, the next important contributor to wealth growth was principle paid to reduce debt ($15,363), followed by the reinvestment of investment income ($6,579). An additional detractor was saving out of earned income, which was negative ($758). In 2001, Dover wealth grew by $23,199. An interesting detail can be observed in column 2002 unadjusted. This column reveals what the anticipated wealth growth will be if the Dovers made

Journal of Financial Counseling and Planning Volume 25, Issue 1, 2014 101
Figure 3b. Dover Adjusted Financial Statement—Income and Expenses, and Worksheets
Worksheet 1b Adjusted statement--projected 2002 X1Income & expense Wealth sensitive income & expense statement
Anticipated cash flow change Dover, Dan & Sue Jan-Dec 2002Description Decrease Increase $ Income $ Expenses Saving / invest
Up charity 2,400 120,000 Sue Salary 4,800 Charity
Up daughter gift 7,000 7,000 Daughter home gift
Lost tax shelter 832 42,000 Dan Salary 46,216 Taxes
79,982 Living expense
Less debt pmts 13,056 21,936 Debt pmts
Up save earn inc 424 (7,534)Discretionary sav/in
Up employee contribution 2,400 9,600Commited 401k 162,000 Total earned inc 159,934 Total liv expense 2,066 Sav/inv earned
Invest Income Invest Expense Reinvestment
Up red h net inc 6,999 20,420 Rental house inc 5,840 R house exp
12,399
Less debt pmt 9,180 0 Rental house 0 R house (p+i)
Up red h tax--shelter loss 2,181 0 Rental house 2,181 Tax shelter loss
122 Interest income 36 Tax on interest 86
6 MMMF increase 2 Tax fund income 4
4,800 Empler match 4,800
25,348 Total inv income 8,059 Total inv expense 17,289 Total sav/inv
Total cash freed up
Total cash allocated
Total inflow Expense outflow Saving / invest
22,236 22,236 187,348 167,993 19,355
Worksheet 2
Debt pd off today Lost tax Cash flow
Debt management and details anticipated for next 12 months--2002
pmt (p+i) Debts listed Mrtg insur i=int pd p=princ pd Apprec./deprec.
21,936 Home Mort -- 15,521 6,415 22,472
34,900 820 4,332 0 H Equity L 0 0 --
86,394 2,181 9,180 0 Rental House -- 0 0 4,500
12,000 12 1,200 0 Student Loan 0 0 --
Buick-Sue 0 0 (2,000)
32,754 7,044 SUV -- -- 0
Honda-Dan (1,000)
Winnebago -- --
1,100 480 0 Credit Card 0 0 --
Bond Fund 7,280
167,148 3,013 22,236 21,936 <Totals> 0 15,521 6,415 31,2521Next 12 months interest paid x 30% MTR 2Freed-up cash by paid off debt 3Total debt pmt 21,936 --Home mortg only remaining debt pmt
r = Appreciation or depreciation rate Appreciation A1= Xc (r) Depreciation D1 = Xc(r)
no adjustments except to discontinue their pattern of taking on new consumer debt each year. Making this adjustment, their projected wealth growth for 2002 would be $32,834, an increase of $9,635 from this single positive financial practice.
The next column in Table 2 (2002 Adjusted Solution A) reveals the impressive results that accompany the adjustments
recommended in the wealth growth review presented here. The greatest detractor to Dover wealth growth in 2001 was overcome in 2002 by shifting use asset depreciation from a negative $34,250 to a negative $3,000. The next most important factor was to more than double, in 2002, the amount of reinvested investment income. It grew from $6,579 in 2001 to $14,670 in 2002. In addition, the Dovers were able to

Journal of Financial Counseling and Planning Volume 25, Issue 1, 2014102
Table 2. Alternative Dover Financial Adjustments that Accelerated Wealth Growth
Year 2001 2002 2002 2002
Wealth Growth dimensions: Unadjusted Unadjusted Adjusted solution A Adjusted solution B
a) Financial goal met: increased charity 0 0 2,400 2,400
Home down payment gift--daughter 0 0 7,000 7,000
b) Saving/investing out of earned income (758) (758) (115) 19,346
c) Reinvested investment income 6,579 6,630 14,670 5,526
d) Employer match 3,600 3,600 4,800 4,800
e) Principle paid to reduce debt 15,363 16,510 6,415 1,910
f) Use asset depreciation (34,250) (27,400) (3,000) (3,000)
g) Home & investment asset appreciation 32,665 34,252 34,252 34,252 Total 23,199 32,834 66,422 72,234
meet all three of their new financial goals. They paid off the remaining balance on their daughter’s student loan, doubled their charitable contribution, and contributed $7,000 toward a home down payment for their daughter. The combined wealth review adjustments recommended for the Dover Case were estimated to increase Dover wealth creation by $25,795 annually; truly a much needed financial boost in their late season preparation for retirement.
Solution B, in the last column, is a “what if” kind of solution. The Dovers did not have enough capital to pay off their home mortgage instead of the rental house mortgage as in Solution A. Had they been able to pursue that course of action, Solution B could have been operable, producing an additional $5,000–$6,000 of wealth growth compared to Solution A.
Implications and DiscussionThis paper demonstrates the potential for the creation of wealth within a household through the use of a side-by-side review utilizing a wealth sensitive balance sheet and income and expenditure statement followed by adjustments that draw on financial variables and principles established in personal finance literature. In today’s complex financial arena, it is easy for families to feel that the day-to-day decisions made regarding consumer expenditures, savings, and debt have very little influence on their wealth growth. Certainly some stockbrokers and mutual fund managers would like to think themselves as the total creator of wealth growth, but that is far from true. This paper illustrates how an individual or family money manager, possibly assisted by a financial educator or planner, can be key players in the creation of wealth growth.
Many families are too casual about decisions that dramatically influence wealth growth, valuing satisfaction and comfort over frugality (Muskie & Winter, 1999). Financial decisions about saving and spending seem small while participation in consumer debt seems inexpensive. The only cost foreseen is the interest payment, and the delight of getting what one wants now far outweighs the price of credit, or so it seems. However, as demonstrated by the Dover case, decisions about incurring consumer debt, investment income spent and not reinvested, savings that never accrue, and not qualifying for an employer match on an IRA are decisions that do, in fact, have a great impact on wealth growth.
The Dover Case is an example of a high income family rather than an average American family. Appendix D presents the Jensen Case with median family income for a homeowner in 2001. As would be expected, their potential for accelerated wealth growth, as shown in the appendix, was a more modest $14,026 (2001 unadjusted wealth growth $10,769; 2002 adjustments and projected wealth growth equaled $24,795). As this example suggests, wealth creation potential is likely to be lower for a more moderate income family in comparison to a higher one. Nevertheless, through the application of basic financial policies and principles the wealth creation can be quite impressive.
Following Muskie and Winter’s (1999, 2004) in depth interviews with “average Americans families” (based on 1990 census: a family with one to three children, median income, and two adults, etc. living in the Great Plains region of the United States) who indicated that they liked the freedom of carrying an outstanding balance on their credit card because

Journal of Financial Counseling and Planning Volume 25, Issue 1, 2014 103
of the freedom it afforded, the authors were compelled to raise the question, “Should financial professionals continue to recommend the long-standing conservative practices regarding the avoidance of debt and the frugal use of resources, given that many we seek to assist seem to care more about ease, and being able to pay their bills in the short term?”
Each person or family will have to answer that question for themselves. But when they come asking, wouldn’t it be helpful if a financial professional ran their numbers to help them make an informed decision. What is the opportunity cost of carrying a persistent outstanding balance on a line of consumer credit? The analysis presented here indicates that in terms of lost wealth creation it is surely a lot more costly than a simple interest charge.
Individuals and families need help from educators and planners to implement financial policies and practices that result in adequate wealth growth toward a simple and sufficient financial future. Using the integrated financial statement analysis for recognizing what makes wealth grow is a technique recommended to professionals to illustrate and encourage families in their application of basic principles and practices that create wealth. It shouldn’t be lost on the reader that the wealth growth review presented here asked the Dovers to give up their consumer lifestyle in exchange for what Stanley and Danko (1995) documented as the lifestyle of The Millionaire Next Door!
ReferencesAdams, T., & Moore, M. (2007). High-risk health and credit
behavior among 18-25 year-old college students. Journal of American College Health, 56(2), 101-108.
Baek, E., & DeVaney, S.A. (2004). Assessing the baby boomers’ financial wellness using financial ratios and a subjective measure. Family and Consumer Sciences Research Journal, 32(4), 321-348.
Bryant, C., Taylor, R., Lincoln, K., Chatters, L., & Jackson, J. (2008). Marital satisfaction among African American and Black Caribbeans: Findings from the National Survey of American Life. Family Relations, 57, 239-253.
DeFrain, J., & Asay, S. (Eds.). (2007). Strong families around the world: The family strengths perspective. New York: Haworth.
DeFrain, J., & Stinnett, N. (2002). Family Strengths. In J.J. Ponzetti, et al. (Eds.). International encyclopedia of marriage and family (Vol. 2). New York: Macmillan Reference Group.
Federal Reserve Bank of St. Louis, economic research: http://
research.stlouisfed.org/fred2/ (Observations January 7, 2013).
Freddiemac mortgage rates since 1991l: http://www.freddiemac.com/pmms/pmms15.htm (Observations January 7, 2013).
Grable, J. E., & Joo, S. (2006). Student racial differences in credit card debt and financial behaviors and stress. College Student Journal, 40(2), 400-408.
Garman, E. T. & Forgue, R. E. (2012). Personal finance: Eleventh edition. Mason, Ohio: South-Western.
Hibbert, J.R., Beutler, I.F., & Martin, T.M., (2004). Financial prudence and next generation financial strain. Journal of Financial Counseling and Planning, 15(2), 51-59.
Huberman, G., Iyengar, S. S., Jiang, W. (2007). Defined contribution pension plans: Determinants of participation and contributions rates. Journal of Financial Services Research, 31, 1-32.
Israelsen, C. L. (2010). 7 Twelve: A diversified investment portfolio with a plan. New Jersey: John Wiley.
Jenkins, J.W., & Beutler, I.F. (1984). A definition of microeconomic saving in the context of household wealth growth, In K. P. Goebel (ed.), Consumer Responsibility/Corporate Responsibility, (pp. 24-30). American Council on Consumer Interests, 30th Annual Conference Proceedings.
Kinley, D. (1911). Aspects of economics of importance in household science. In M.J. Liston (Ed.). History of Family Economics Research: 1862-1962. A biographical, historical and analytical reference book (pp.90-92). Ames, IA: University Publication, Iowa State University.
McConocha, D., & Tully, S. (2001). Household money management: Recognizing nontraditional couples. Journal of Consumer Affairs, 27, 258-283.
Moon, S.J., Yuh, Y., & Hanna, S.D. (2002). Financial ratio analysis of Korean households. Family and Consumer Sciences Research Journal, 30(4), 496-525.
Muskie, G., & Winter, M. (1999). Cash flow management: A framework of daily family activities, Financial Counseling and Planning, 10(1), 2-13.
Muskie, G., & Winter, M. (2001). An in-depth look at family cash-flow management practices. Journal of Family and Economic Issues, 22, 353-372.
Muskie, G., & Winter, M. (2004). Personal financial management education: An Alternative paradigm, Journal of Financial Counseling and Planning, 15(2), 79-88.
Nelson, J.D., Lust, K., Story, M., and Ehlinger, E. (2008). Credit card debts, stress and key health risk behaviors among college students. American Journal of Health Promotion, 22(6), 400-412.

Journal of Financial Counseling and Planning Volume 25, Issue 1, 2014104
Olson, D.H., & Olson-Sigg, A. (2000). National Survey of Marital Strengths. Retrieved from https://www.prepare-enrich.com/pe_main_site_content/pdf/research/national survey.pdf
Quinn, J.B., (2009). Making the most of your money now. New York: Simon and Schuster.
Roberts, J.A., & Jones, E. (2001). Money attitudes, credit card use, and compulsive buying among American college students. Journal of Consumer Affairs, 35(2), 213-40.
Sallie Mae (2009). How undergraduate students use credit cards: Sallie Mae’s National Study of usage Rate and Trends 2009. Retrieved from http://www.salliemae.com/NR/rdonlyres/0BD600F1-9377-46EA-AB1F-6061FC763246/10744/SLMCredit Card usage Study41309Fianl2.pdf
Sanders, C.K., & Porterfield, S.L. (2010). The ownership society and women: Exploring female householders’ ability to accumulate assets. Journal of Family and Economic Issues, 31. Retrieved from http://www.springerlink.com/contnetj257775466502757/fulltext.pdf
Skogrand, L., Johnson A. C., Horrocks, A. M., and DeFrain, J. (2011). Financial management practices of couples with great marriages, Journal of Family and Economic Issues 32, 27-35.
Skogrand, L., Schramm, D.G., Marshall, J., & Lee, T.R. (2005). The effects of debt on newlyweds and implications for education. Journal of Extension, 43, Article 3RIB7. Retrieved from http://www.joe.org/joe/2005jun/index.shtmlchildhood and marriage
Stanley, T.J., & Danko, W.D. (1995). The millionaire next door. New York: Pocket Books.
Stanley, L.M., Markman, H. J., & Whitton, S.W. (2002). Communication, conflict, and commitment: Insights on the foundations of relationship success from a national survey. Family Process, 41, 659-675.
Yao, R., Hanna, D.S. & Montalto, C.P. (2002). Factors related to meeting the capital accumulation ration guideline. Financial Services Review, 11(2), 153-171.
Xiao, J.J., Barber, B., and Shim, S. (2008). Financial behavior of young adults: Role of parents. Paper presented at the annual conference of National Council on Family Relations, Little Rock, AR (November).
About the AuthorIvan F. Beutler is a Professor in the School of Family Life at Brigham Young University. The current paper was developed out of his long-time interest in helping individuals and families attain a simple and sufficient financial future. The focus of his previous research has been on principles of economy in
family life more recently applied to money attitudes, financial aspirations, and the economic socialization of children.