when or should ‘advanced’ laboratory testing be ‘routine’. dr john powell.pdf · when or...
TRANSCRIPT

When or should ‘advanced’ laboratory testing be ‘routine’
Dr John J M Powell Geolabs Ltd
7/11/2012 - Doha

‘Routine tests’ • Atterbergs • Particle size, density, specific gravity • Compaction, CBR • Shear box • Triaxial
– UU – CU
• Permeability • IL oedometers, Rowe cells • Ring shear

‘Routine tests’
• The profession often have trouble even getting these repeatable and of a consistent quality

Proficiency / Interlaboratory Comparison Testing Scheme
12
14
16
18
20
22
24
26
40 45 50 55 60 65 70
Co
ne
Pe
ne
trat
ion
(m
m)
Moisture Conent (%)
LAB 1
LAB 5
LAB 6
LAB 7
LAB 8
LAB 10
LAB 13
LAB 15
LAB 16
LAB 17
LAB 21
LAB 23
LAB 24
LAB 27
LAB 30
LAB 32
LAB 34
LAB 35
LAB 36

Proficiency / Interlaboratory Comparison Testing Scheme

Proficiency / Interlaboratory Comparison Testing Scheme
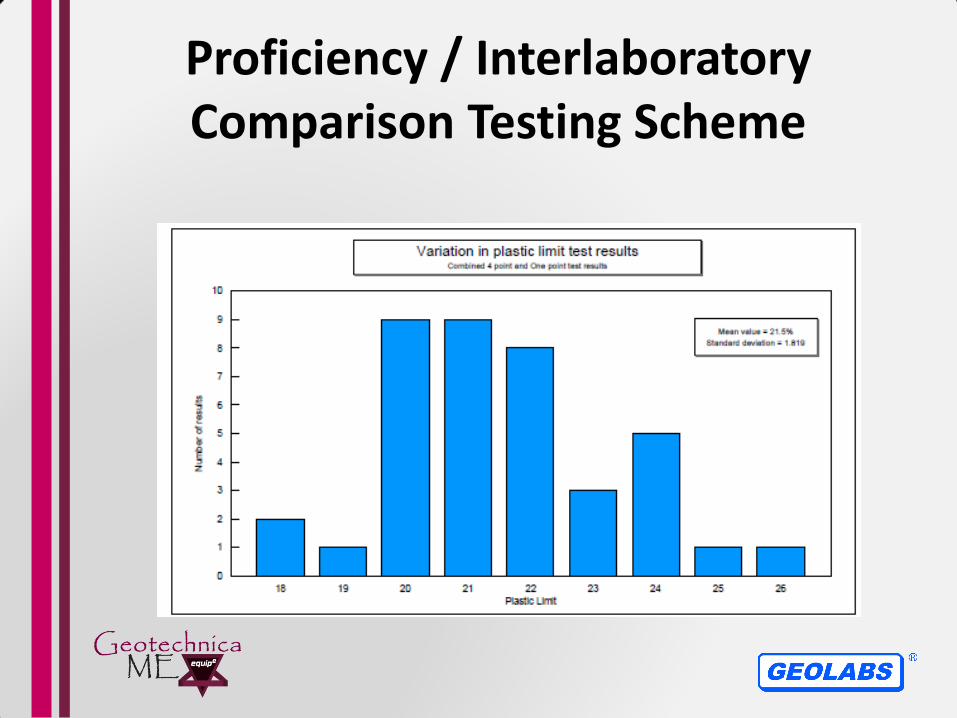
Proficiency / Interlaboratory Comparison Testing Scheme

Advanced Tests • Advanced triaxial, (a significant enhancement on the
standard effective stress capability); including features such as local axial and radial strain, mid height pwp, piezobenders and anisotropic stress control (CAU)
• Cyclic triaxial
• Cyclic and static simple shear
• Resonant column
• Don’t forget the CRS oedometer
• And more

But first
• So you want to get reliable parameters for your design using laboratory testing!
• So you need samples, but not just any old samples, they need to be representative in terms of structure and composition
• Sample Quality!

Eurocodes (love them hate them)
• Recognises the need for sample quality

Quality and QA • Quality in sampling
• Quality in transport and storage
• Quality in preparation and testing
• Quality in reporting
• Quality throughout!!
• All rely on Quality in equipment and personnel!!!

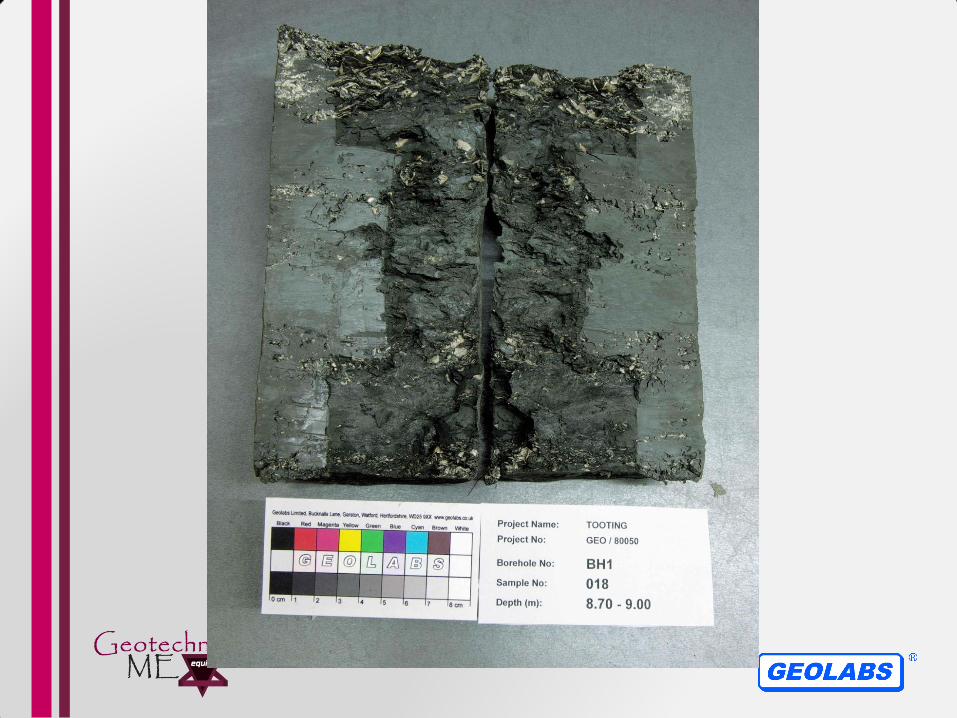
Samples

• Varying levels of disturbance!
Tube sampling
Sources of disturbance

Stages in sampling and preparing soil specimen for laboratory test

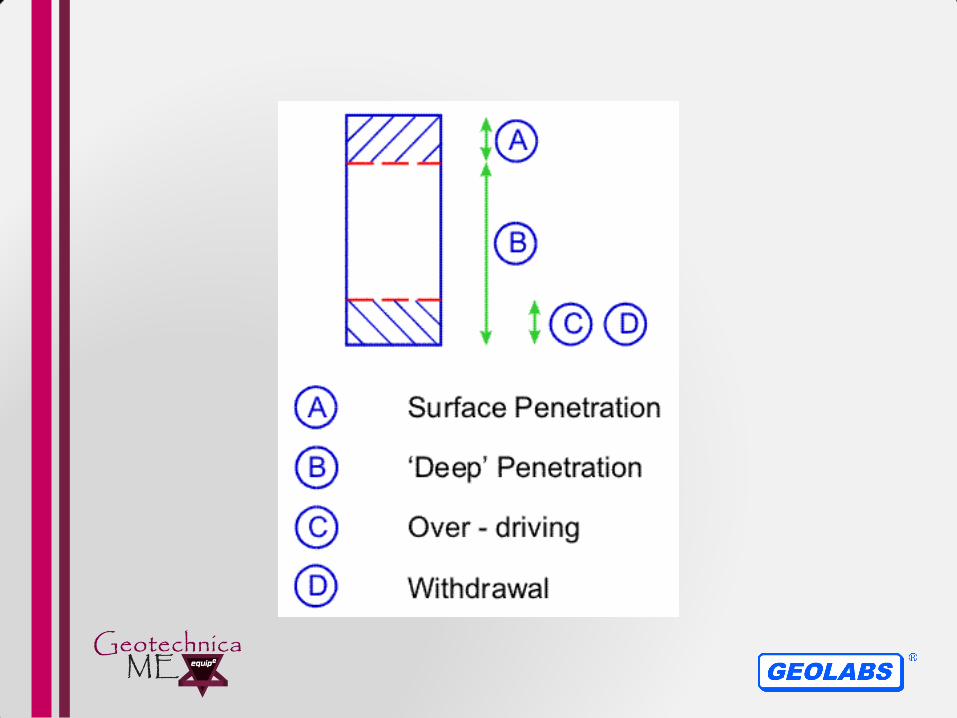
Sources of tube sampling disturbance
Open drive and piston

Plugging Jarring
Indentationfractures
Plugging Jarring Indentation fractures
Sources of tube sampling disturbance

Measured water content distributions across the diameter of tube samples of soft clay
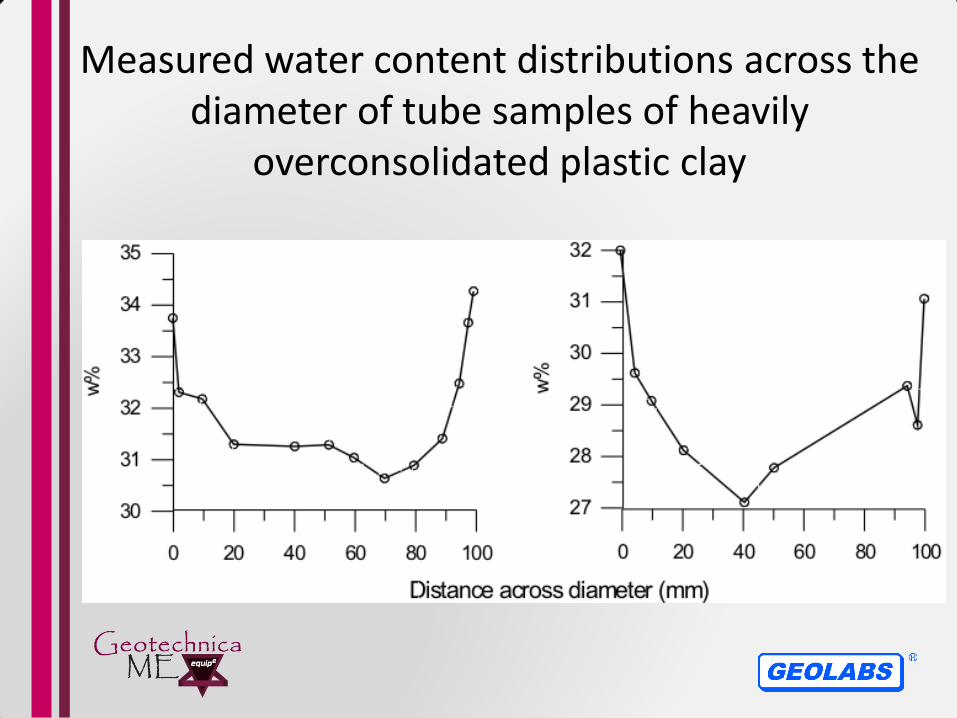
Measured water content distributions across the diameter of tube samples of heavily
overconsolidated plastic clay

Sampling effects in soft clays

Canadian Sherbrooke
block sampler -Rotation
Control vertical mopvement
Water or bentonite mud
Borehole 400 mm in diameter
Water or mud circulated at each cutting tool
Annular slot Cutting tool every 120 degr.
Block sample being carved out
No tube sampling strains!!

Block sampling with Sherbrooke
sampler
Block sample cleaned and wrapped in plastic cling film

• All natural clays have developed some structure
• Degree of structure can be assessed by comparing behaviour of an undisturbed sample to that of a remoulded clay (eg. in oedometer tests)
• Soil structure is a result of several processes including, but not limited to: secondary compression, thixotropy, cementation, cold welding between soil particles (ageing--)
• Effect of sample disturbance is to partly or fully break down the structure of the soil sample – parameters measured by lab tests may not be representative for in situ conditions
Effect of structure of natural clays
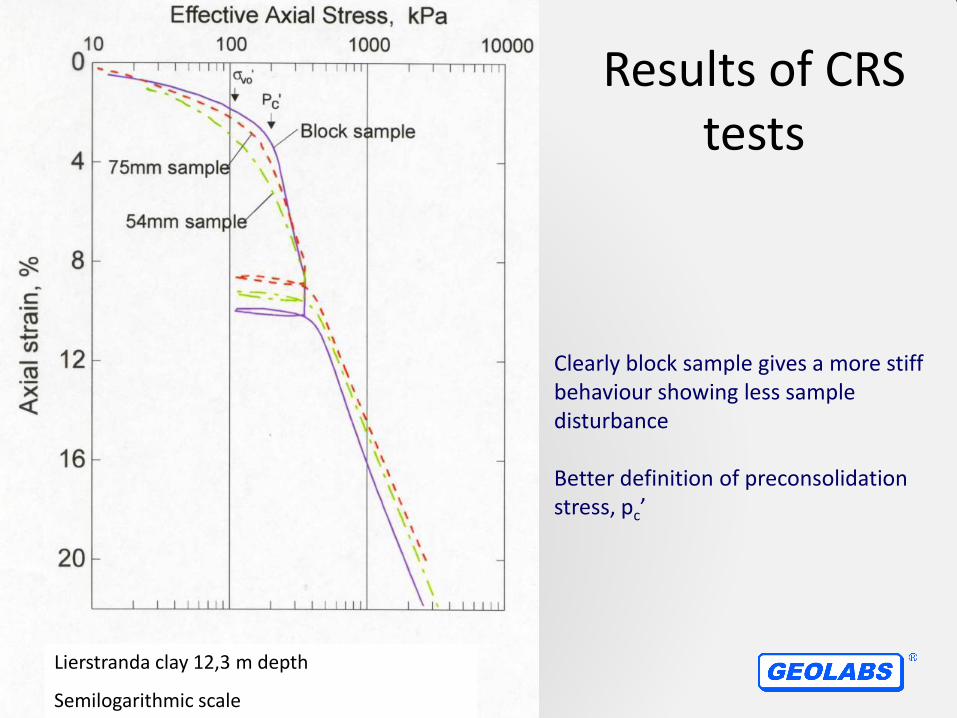
Results of CRS tests
Lierstranda clay 12,3 m depth
Semilogarithmic scale
Clearly block sample gives a more stiff behaviour showing less sample disturbance Better definition of preconsolidation stress, pc’

Comparison of IL and CRS Consolidation Data
Vertical Effective Stress 'v (kPa)
10 100 1000
Ve
rtic
al S
tra
in
v (
%)
0
10
20
30
(b)
Boston Blue Clay - Newbury
Depth = 7.3 m
w = 53%, PI = 21, LI = 1.4
'vo
CRS
IL 24 hr.
Better definition of preconsolidation stress, pc’, from CRS
Pc’

UU triaxial compression tests on Laval and piston samples. Bothkennar Clay
Strength and stiffness!!
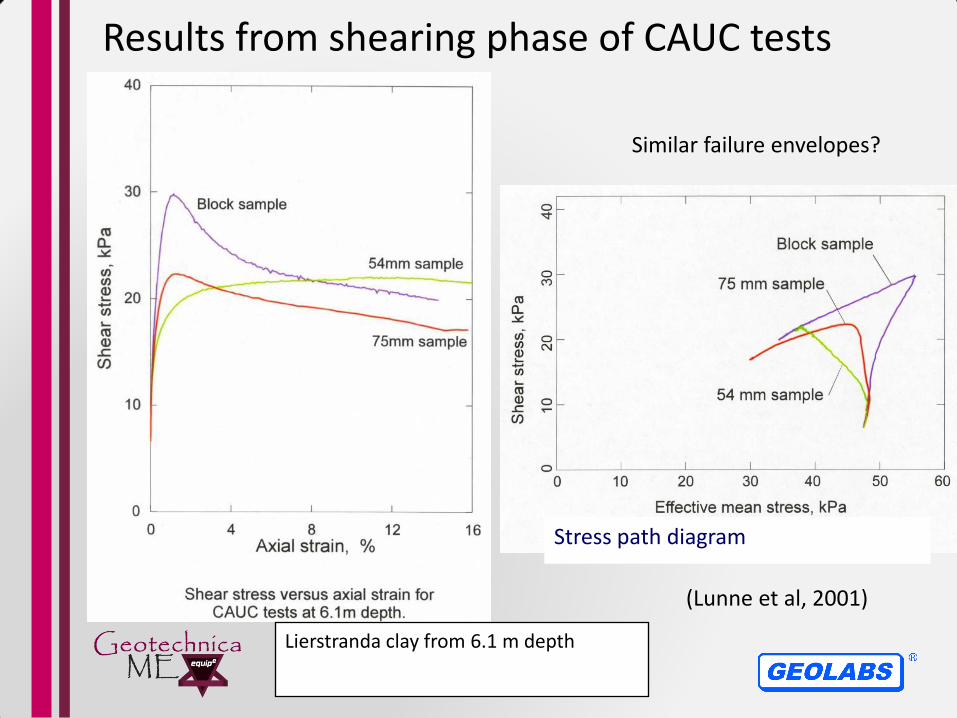
Results from shearing phase of CAUC tests
Lierstranda clay from 6.1 m depth
Stress path diagram
(Lunne et al, 2001)
Similar failure envelopes?

Sample tube geometries

Unconfined compression tests on Ariake Clay (Tanaka and Tanaka, 1999)
Axial strain (%)
0 2 4 6 8 10 12 14
Co
mp
res
siv
e S
tre
ss
(k
Pa
)
0
10
20
30
40
Shelby tube
ELE100
NGI54
Japanese Standard Piston
Sherbrooke
Laval
10m
Shelby tube ELE 100 NGI 54 Japanese standard piston Sherbrooke sampler Laval sampler
What are YOU trying to test??

Disturbance during specimen preparation Bothkennar Clay
Sampling effects in stiff clays

Stiff clays: distinction on
basis of unconsolidated
undrained triaxial compression
(-
)/2
ar
( ’+ ’)/2 a r
0
(-
)/2
ar
( ’+ ’)/2 a r
0(
-)/
2
a
r
( ’+ ’)/2 a r
0
Stiff Sandy ClaysC = f(w)u
Stiff Fissuredplastic ClaysC = f(p ’)u 0
Stiff Mediumplastic ClaysC = f(w , p ’)u 0
Conventional practice for sampling stiff plastic clays
• Shell and auger boring, dry hole, cased to cut off ground water entry
• Open drive tube sampling • Unconsolidated undrained triaxial compression tests
for stress-strain-strength Invariably large scatter in strength and stiffness
parameters variously attributed to: – fabric – sample disturbance – stress relief – sample size
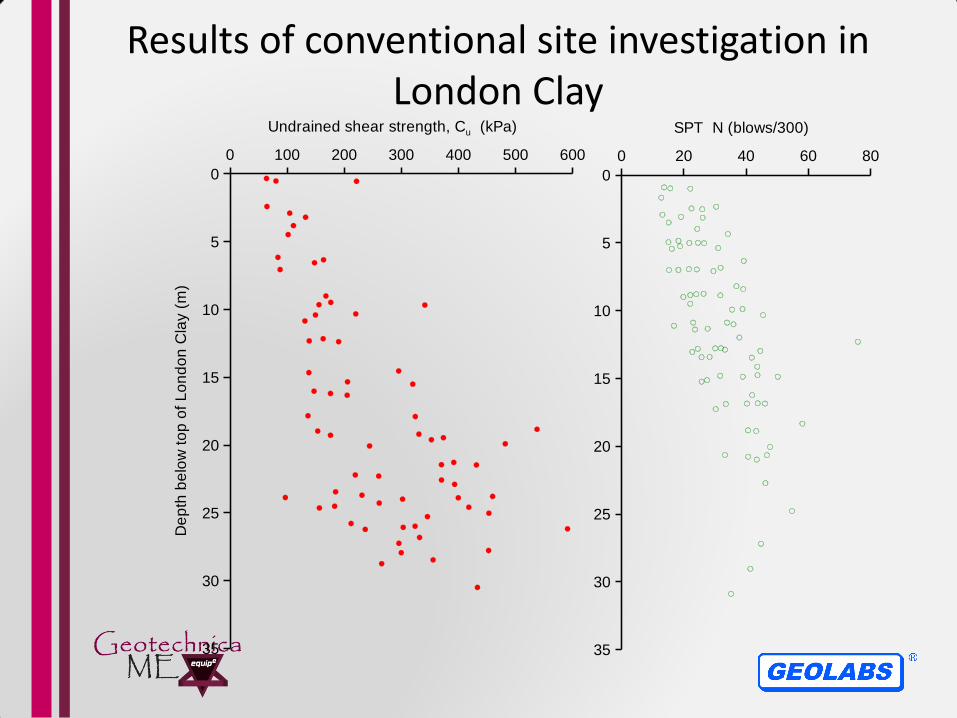
Results of conventional site investigation in London Clay
0 100 200 300 400 500 600
Undrained shear strength, Cu (kPa)
35
30
25
20
15
10
5
0D
ep
th b
elo
w t
op
of
Lo
nd
on
Cla
y (
m)
0 20 40 60 80
SPT N (blows/300)
35
30
25
20
15
10
5
0

Initial effective stresses in rotary cores and thin wall tube samples of London Clay
Probably between rotary foam and pushed
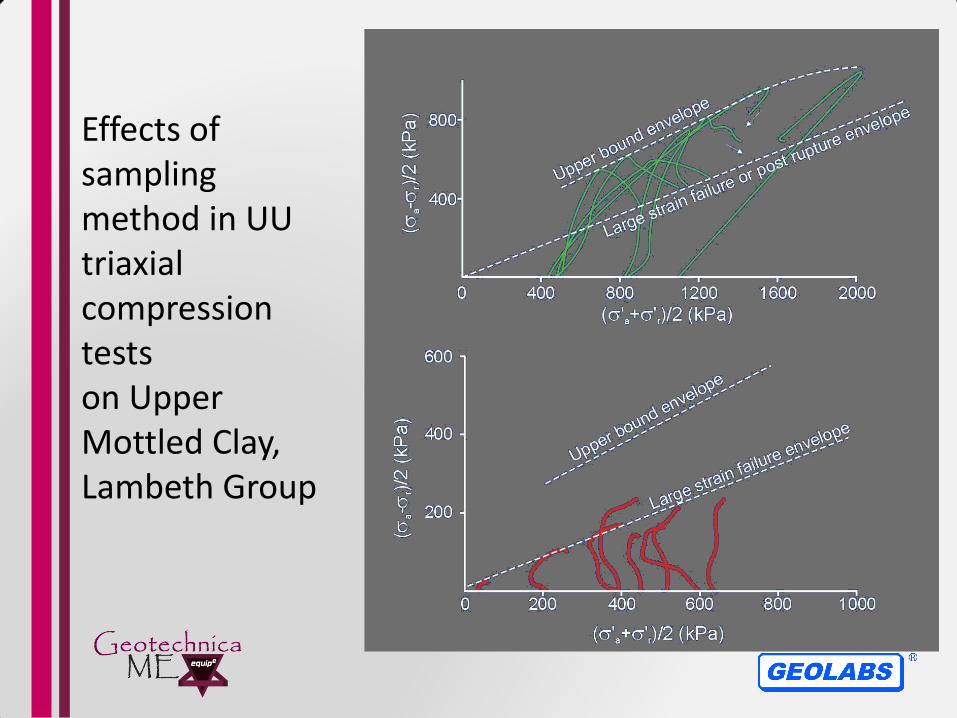
Effects of sampling method in UU triaxial compression tests on Upper Mottled Clay, Lambeth Group

Evaluation of sample quality
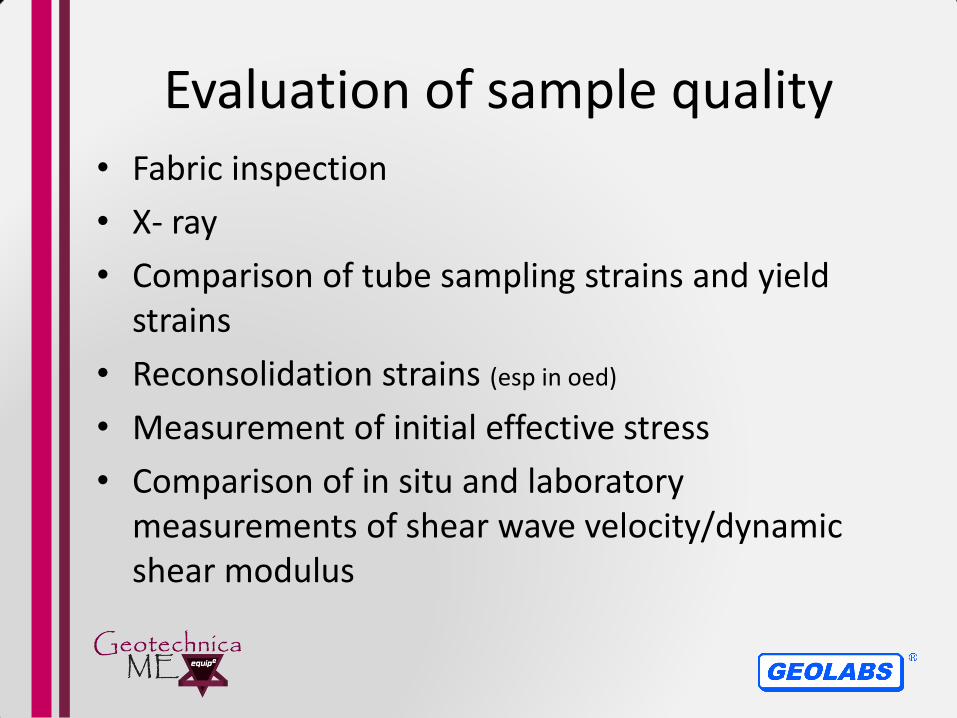
Evaluation of sample quality • Fabric inspection
• X- ray
• Comparison of tube sampling strains and yield strains
• Reconsolidation strains (esp in oed)
• Measurement of initial effective stress
• Comparison of in situ and laboratory measurements of shear wave velocity/dynamic shear modulus

How can we then reduce effects of sample disturbance?
• Use the best sampler possible for the project
• Careful sample handling and testing – recompression technique may to some extent “repair” the sample
• Trimming of sample to smaller diameter may help in some cases but can also damage sample if not undertaken with great care (tubing vs hand trimming).

Sample disturbance effects
Conclusions: • Sample disturbance(SD) can be very significant!
• Effect of SD is to partly or completely destroy structure
• SD has significant effects on deformation and strength characteristics as measured in oedometer and triaxial tests
• e/eo is a consistent measure of SD for soft clays
• SD effects can best be minimized by carefull choice of drilling and sampling methods
• Sample handling and consolidation techniques may reduce SD effects
In situ tests will also give essential input to choice of soil design parameters, but will not eliminate need for sampling and laboratory testing

• So we have good quality sample!

Advanced Tests • Advanced triaxial, (a significant enhancement on the
standard effective stress capability); including features such as local axial and radial strain, mid height pwp, piezobenders and anisotropic stress control (CAU)
• Cyclic triaxial
• Cyclic and static simple shear
• Resonant column
• Don’t forget the CRS oedometer
• And more

Shearing Tests
• we often have conflicting requirements of our tests:
Strength – need large strains with minimum restraint
while maintaining uniform stresses & strains in sample
Stiffness – need to apply and measure very small
stress/strain changes
• triaxial apparatus is fairly unique in its ability to
perform both functions

Triaxial Test Advantages
• drainage can be controlled
• complete stress state is known
(a, r, and U) and can be controlled
’ ’a ’r
’
Disadvantages:
• axi-symmetric loading – soil parameters depend on mode of loading
’a
’r ’r

Triaxial testing CAUC
The most basic and useful geotechnical test
0 4 8 12 16 20
Axial strain, a, %
0
10
20
30
40
50
Sh
ea
r s
tre
ss
,
= (
a
-r)
/2 k
Pa
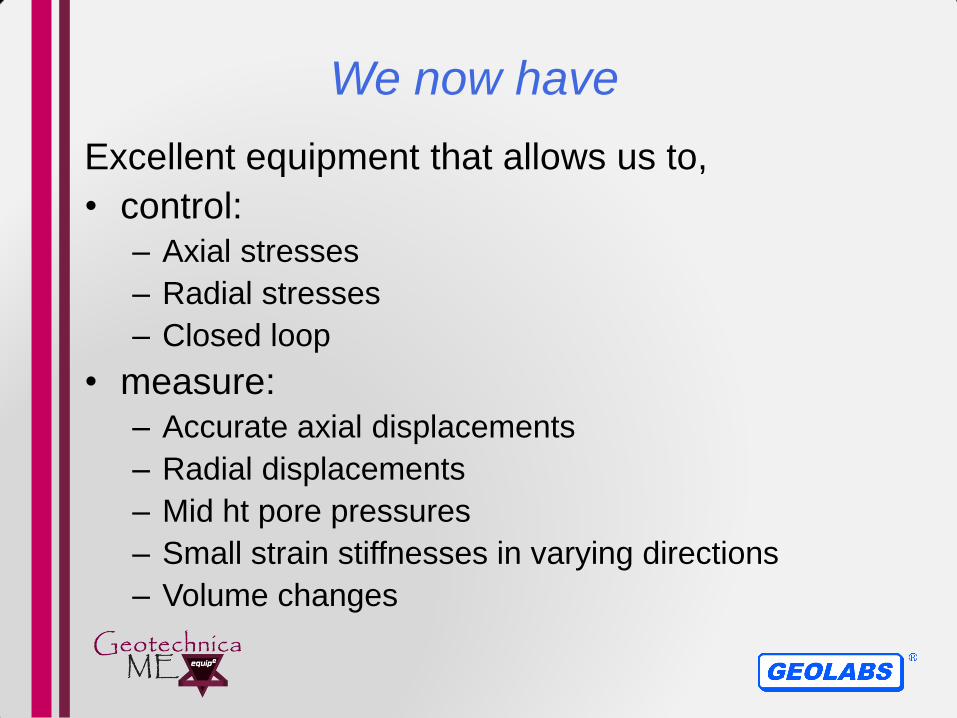
We now have
Excellent equipment that allows us to,
• control: – Axial stresses
– Radial stresses
– Closed loop
• measure: – Accurate axial displacements
– Radial displacements
– Mid ht pore pressures
– Small strain stiffnesses in varying directions
– Volume changes
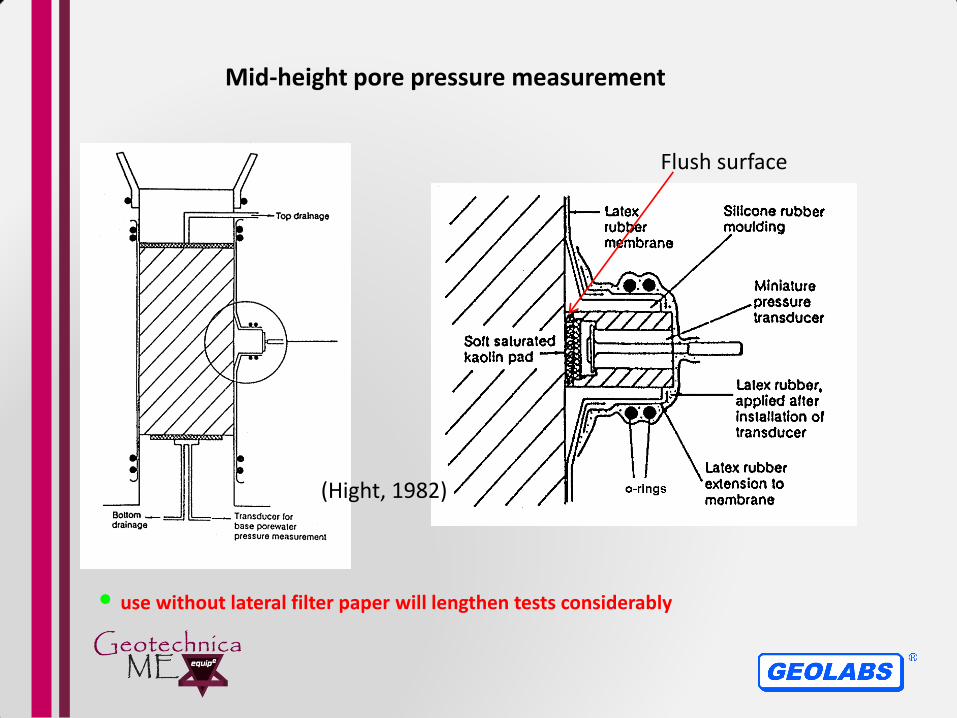
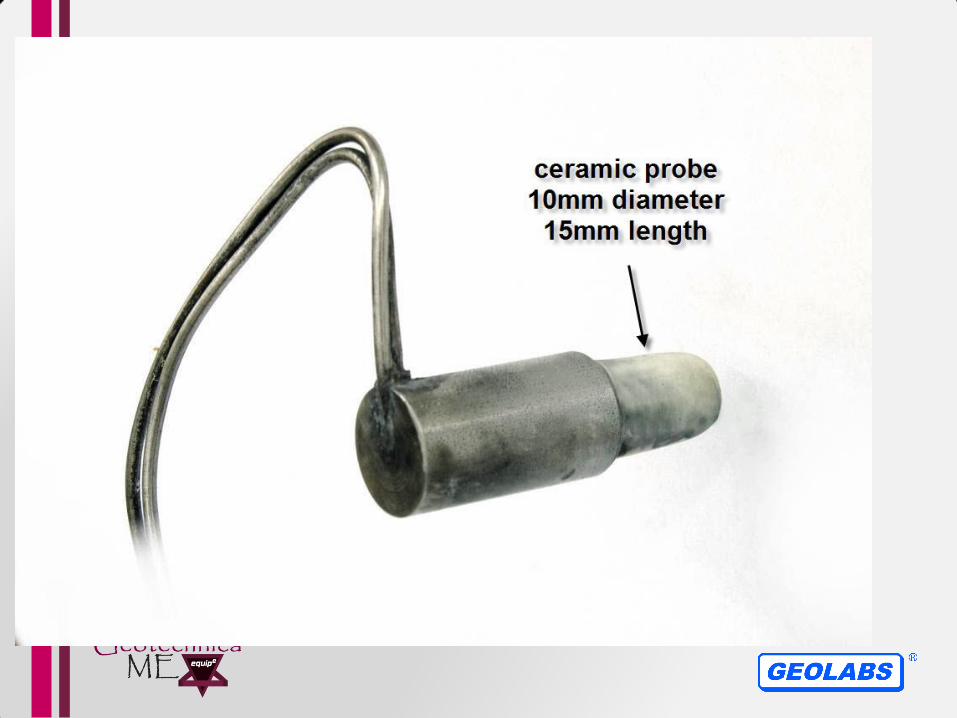
Mid-height pore pressure measurement
(Hight, 1982)
• use without lateral filter paper will lengthen tests considerably
Flush surface


Mid-height pore pressure measurement
(Hight, 1982)
Prebore hole and push in probe
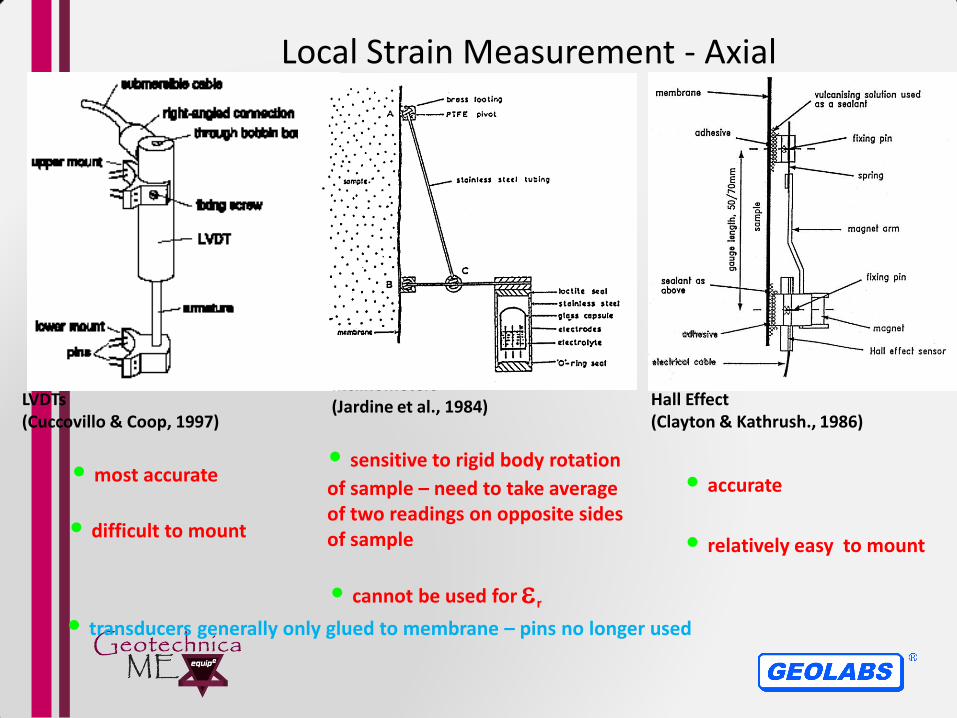
Local Strain Measurement - Axial
Hall Effect (Clayton & Kathrush., 1986)
LVDTs (Cuccovillo & Coop, 1997)
• most accurate
• difficult to mount
• transducers generally only glued to membrane – pins no longer used
Inclinometers (Jardine et al., 1984)
• sensitive to rigid body rotation
of sample – need to take average of two readings on opposite sides of sample
• cannot be used for r
• accurate
• relatively easy to mount


Resolution – 0.0003mm

LVDT-core
LVDT-body
Flexible wire
Fixing screw
Radial strain belt
Mount
Sample
Right-angle connection
Submersible cable
Local Strain Measurement - Radial
(Klotz & Coop, 2002)
• single LVDT version
or Hall effect
• double LVDT or Hall
effect version
- allows larger r
-difficult to mount
-BUT SPACE
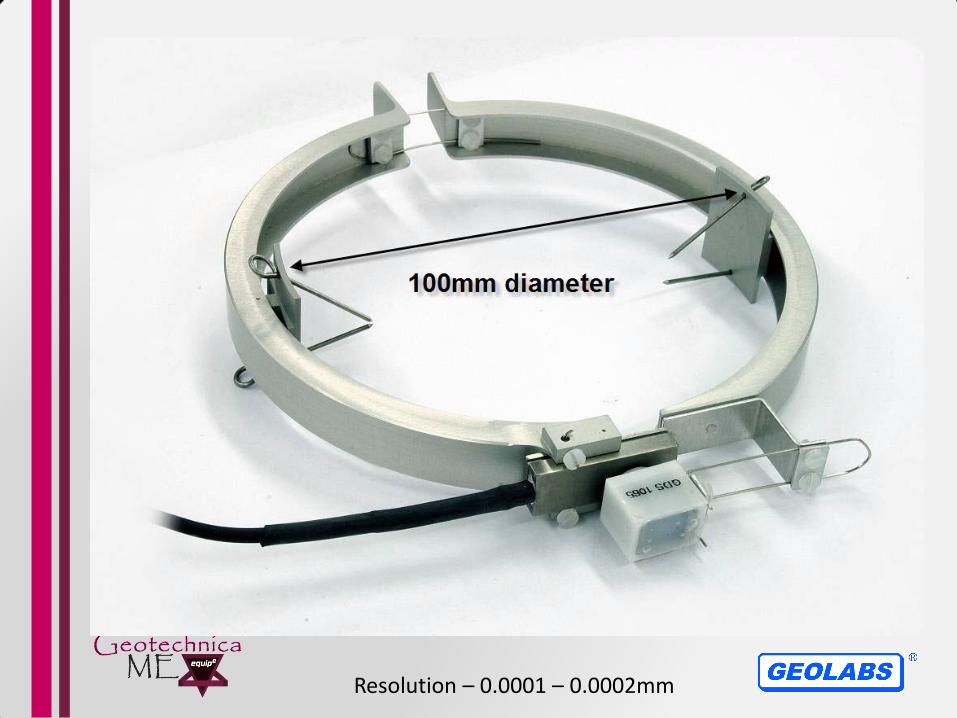
Resolution – 0.0001 – 0.0002mm


Bender Elements
shear plane wave travelling through an elastic isotropic or cross-anisotropic medium – measure elastic shear stiffness, G0
Input
Output
D
Piezoelectric Bender Elements Kramer (1996) (Dyvik & Madhus, 1985)
v = D/tarr
G0 = rv2
(r = mass density)
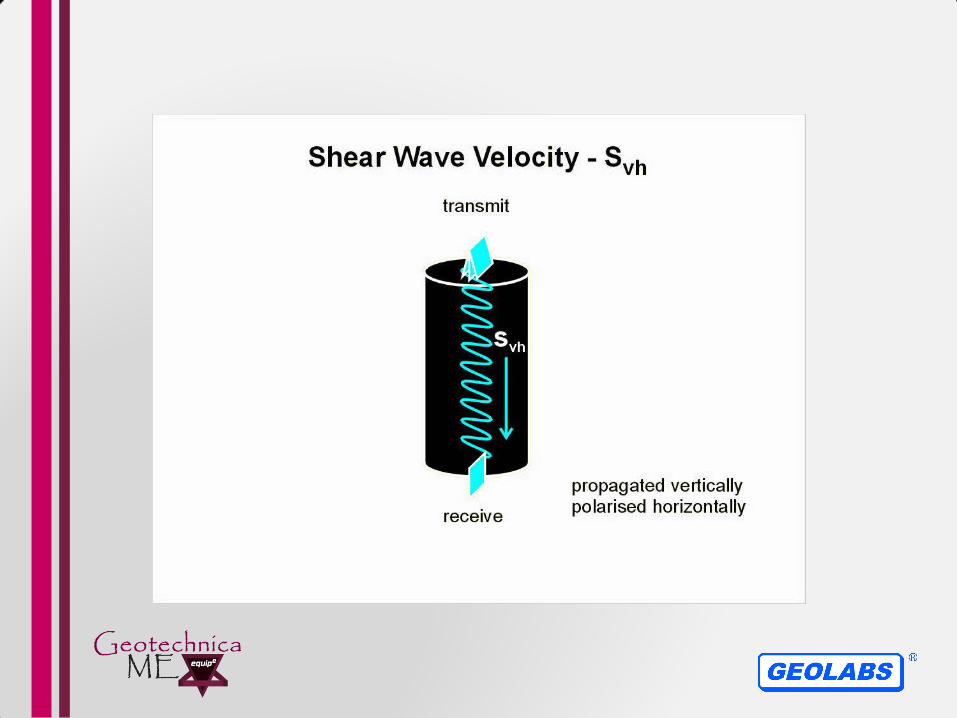


Lateral benders

Lateral benders

Piezobender trace

First Arrival
72
to 0.000333 sec
from 0.000050 sec
-10
-8
-6
-4
-2
0
2
4
6
8
10
-0.0005 0.0000 0.0005 0.0010 0.0015 0.0020
Ou
tpu
t
Time (seconds)
Shv

Control of triaxial tests: feedback loop
’a
’r ’r
triaxial transducer output (voltage)
computer data logger (analogue-digital conversion)
transducer output (digital)
controller
command
change of stress or strain
• automated control of tests much less common than data-logging
simple basic program
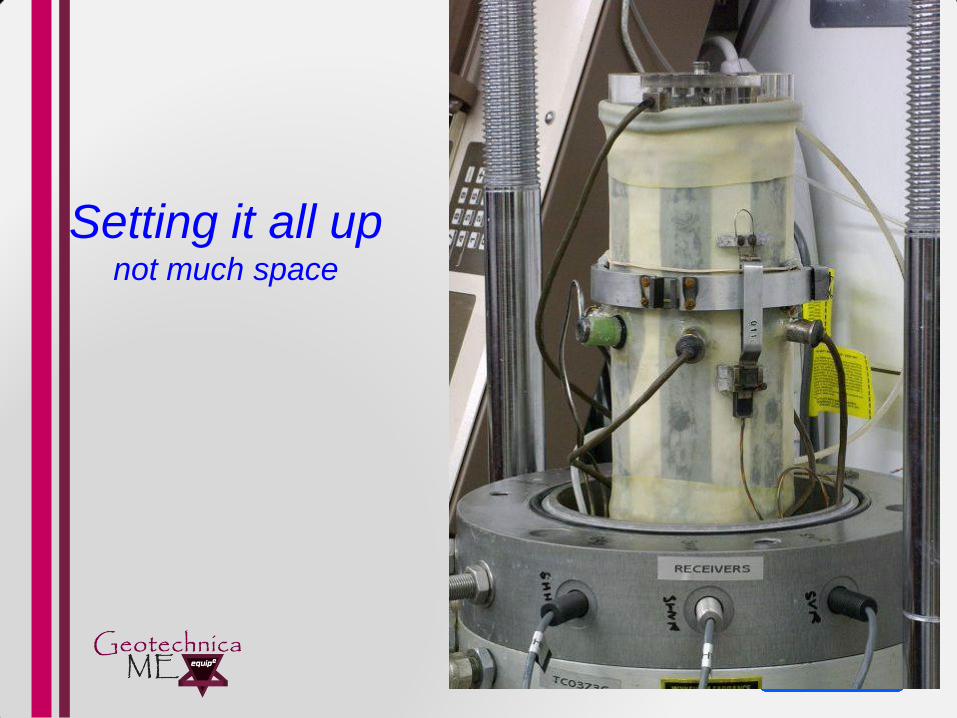
Setting it all up not much space

Setting it all up not much space

Larger cells more space, large strains
id 220mm (165)

•behaviour defined by the following parameters: E’v = vertical Young’s modulus E’H = horizontal Young’s modulus ’VH = Poisson’s ratio for influence of ’V on H
’HV = Poisson’s ratio for influence of ’H on V
’HH = Poisson’s ratio for influence of ’H1 on H2 or ’H2 on H1 GVH = shear modulus in vertical plane GHV = shear modulus in vertical plane GHH = shear modulus in horizontal plane
Anisotropy of Elastic Stiffnesses: Cross-Anisotropic Soil
5 independent parameters

0
0.05
0.1
0.15
0.2
0.25
0.3
0.35
0.4
0.45
0.5
-10 0 10 20 30 40 50 60 70 80 90 100
Str
ain
(%
)
Change in mid-plane effective stress (kPa)
local axial
external vol
local vol
Strains during a stage
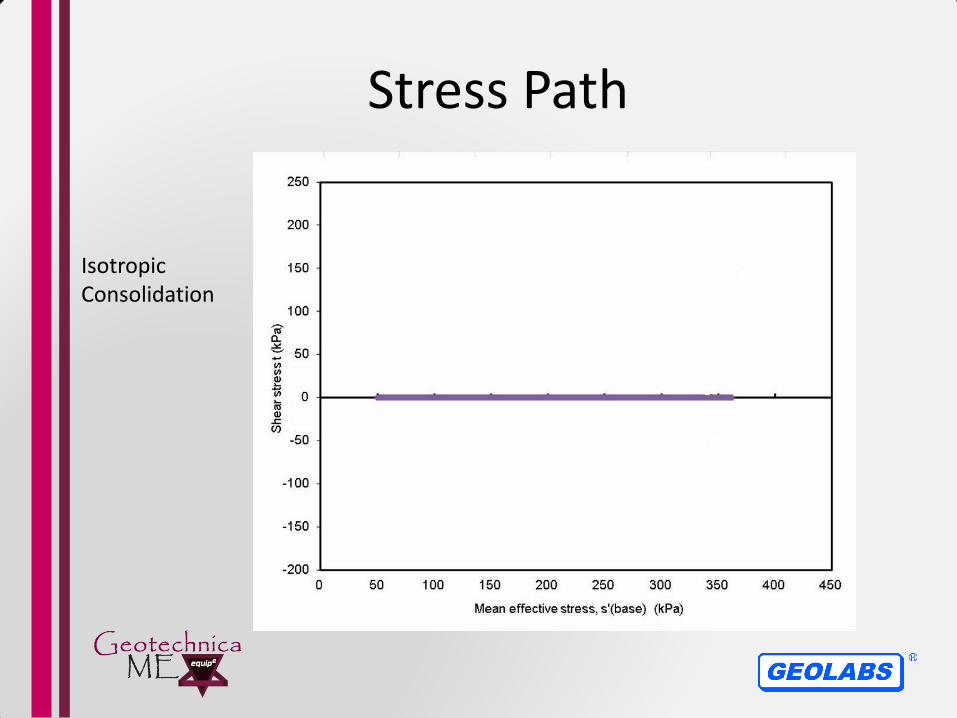
Stress Path
Isotropic Consolidation

Stress Path
Anisotropic Consolidation

Stress Path
2nd Anisotropic Consolidation

Stress Path
Shearing

-200
-150
-100
-50
0
50
100
150
0 50 100 150 200 250 300 350 400 450
Shear
str
ess t (
kP
a)
Mean effective stress, s' (kPa)
this stage
previous stages
aniso3
aniso2
aniso1
finish
start
Stress path of a test

Measurements allow for different orientations


0.0001 0.001 0.01 0.1 1 10
dynamic methods
local gauges
conventional soil testing
Shear strain s: %
Stif
fnes
s G
Typical strain ranges
Retaining walls
Foundations
Tunnels
Measurement of Stiffness
(Atkinson, 2000)

q’
a
Etan = dq/da
Esec = q/a
critical state
- gradient over odd number of points - No. of points in regression depends on No. of number data points recorded (use a fixed strain interval) - plot stiffness against strain at central point
q’
a
Etan = dq/da
calculation of tangent stiffnesses
0
20
40
60
80
100
120
0.0001 0.0010 0.0100
shear strain (%)
G (
MP
a)
• tangents always more scattered than
secant at small strains (also have more meaning) natural London clay (Gasparre, 2005)
secant
tangent
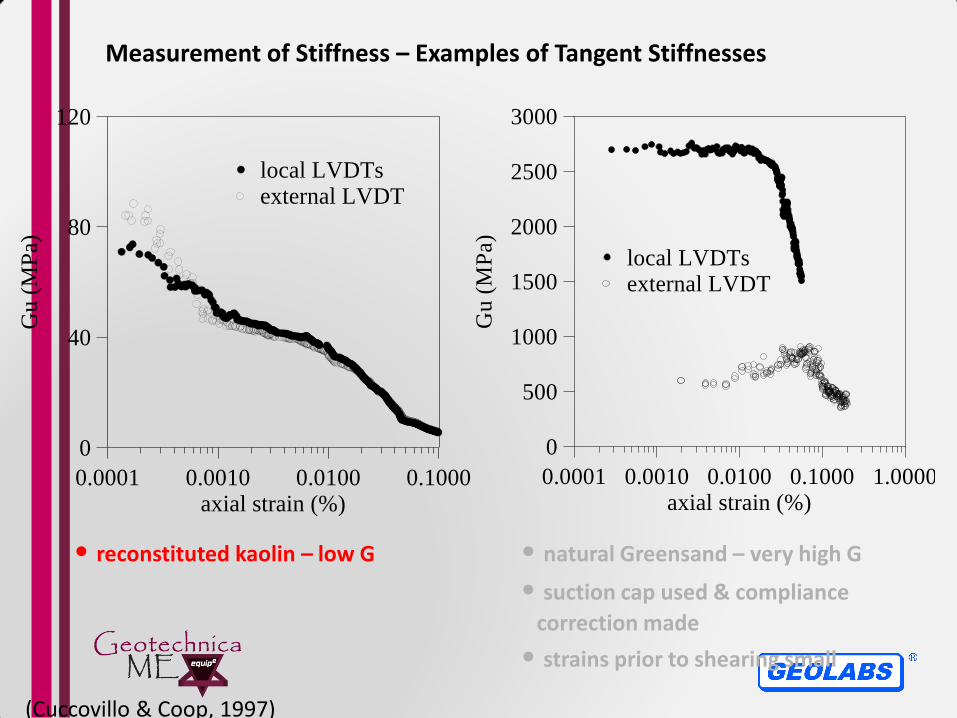
0.0001 0.0010 0.0100 0.1000 1.0000axial strain (%)
0
500
1000
1500
2000
2500
3000
Gu
(M
Pa)
local LVDTsexternal LVDT
• natural Greensand – very high G
• suction cap used & compliance
correction made
• strains prior to shearing small
• reconstituted kaolin – low G
0.0001 0.0010 0.0100 0.1000axial strain (%)
0
40
80
120
Gu
(M
Pa)
local LVDTsexternal LVDT
Measurement of Stiffness – Examples of Tangent Stiffnesses
(Cuccovillo & Coop, 1997)

0
100
200
300
400
500
600
700
-4 -3 -2 -1 0 1 2
Local secant
Young's
modulu
s (
MP
a)
log(local axial strain (%))
Stiffness, local and external

0
100
200
300
400
500
600
700
-4 -3 -2 -1 0 1 2
Local secant
Young's
modulu
s (
MP
a)
log(local axial strain (%))
Stiffness, local and external
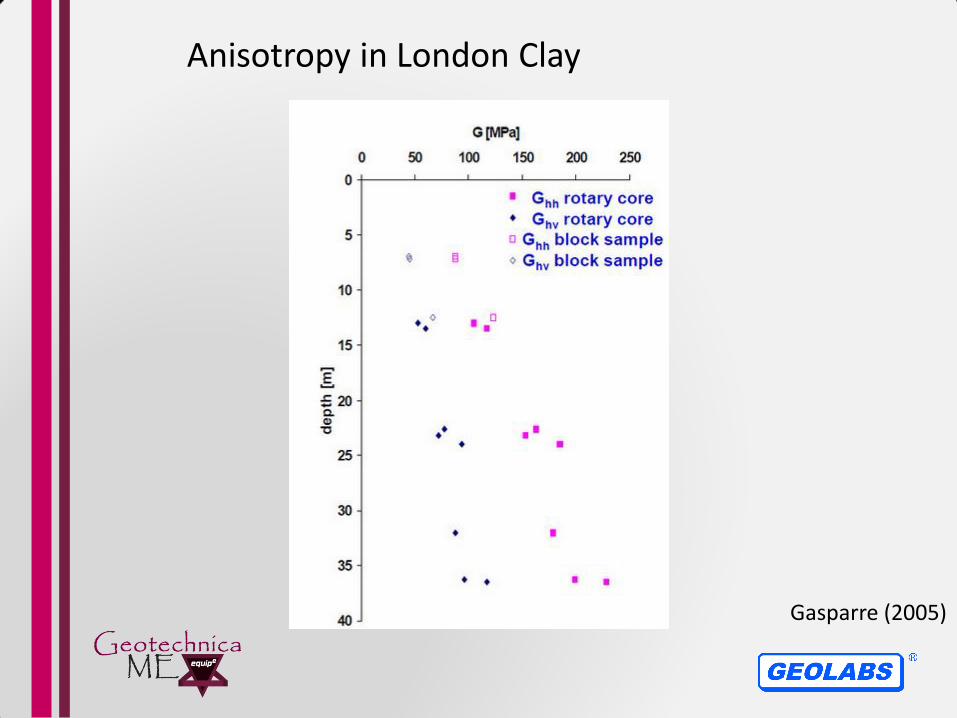
Anisotropy in London Clay
Gasparre (2005)

Sample quality assessment based on shear wave velocity

Using the equipment
for Poisson’s ratio and
small strain stiffness
of rock

Is it new or just commercially viable?
Where have we come in 25+yrs??

Summary
• there is much that can go wrong in conducting and interpreting tests
But it can be done
• we should conduct and interpret tests within a chosen and
appropriate theoretical framework
• level of complexity of tests should be appropriate to theoretical framework and design method
• You need to know what you are specifying and what can be realistically achieved, commercial vs research
• You need to have confidence is those performing the tests

Value for money

I must say - thanks
• I wish to acknowledge the help from
– David Hight
– Tom Lunne
– Matthew Coop
For some of the slides contained in this presentation

Conclusions!
• Rubbish in – Rubbish out!
• Quality in – Quality out (hopefully/possibly)

Conclusions!
• We now have a new level of testing available to us which I believe should be consider ‘routine (advanced) testing’ for use when projects warrant it and samples are of the right quality.
• Particularly relevant for modelling and in ‘serviceability’ situations

Available for consultancy
