who’s really - tvnz
TRANSCRIPT
Co-viewing:
Who’s really watching?
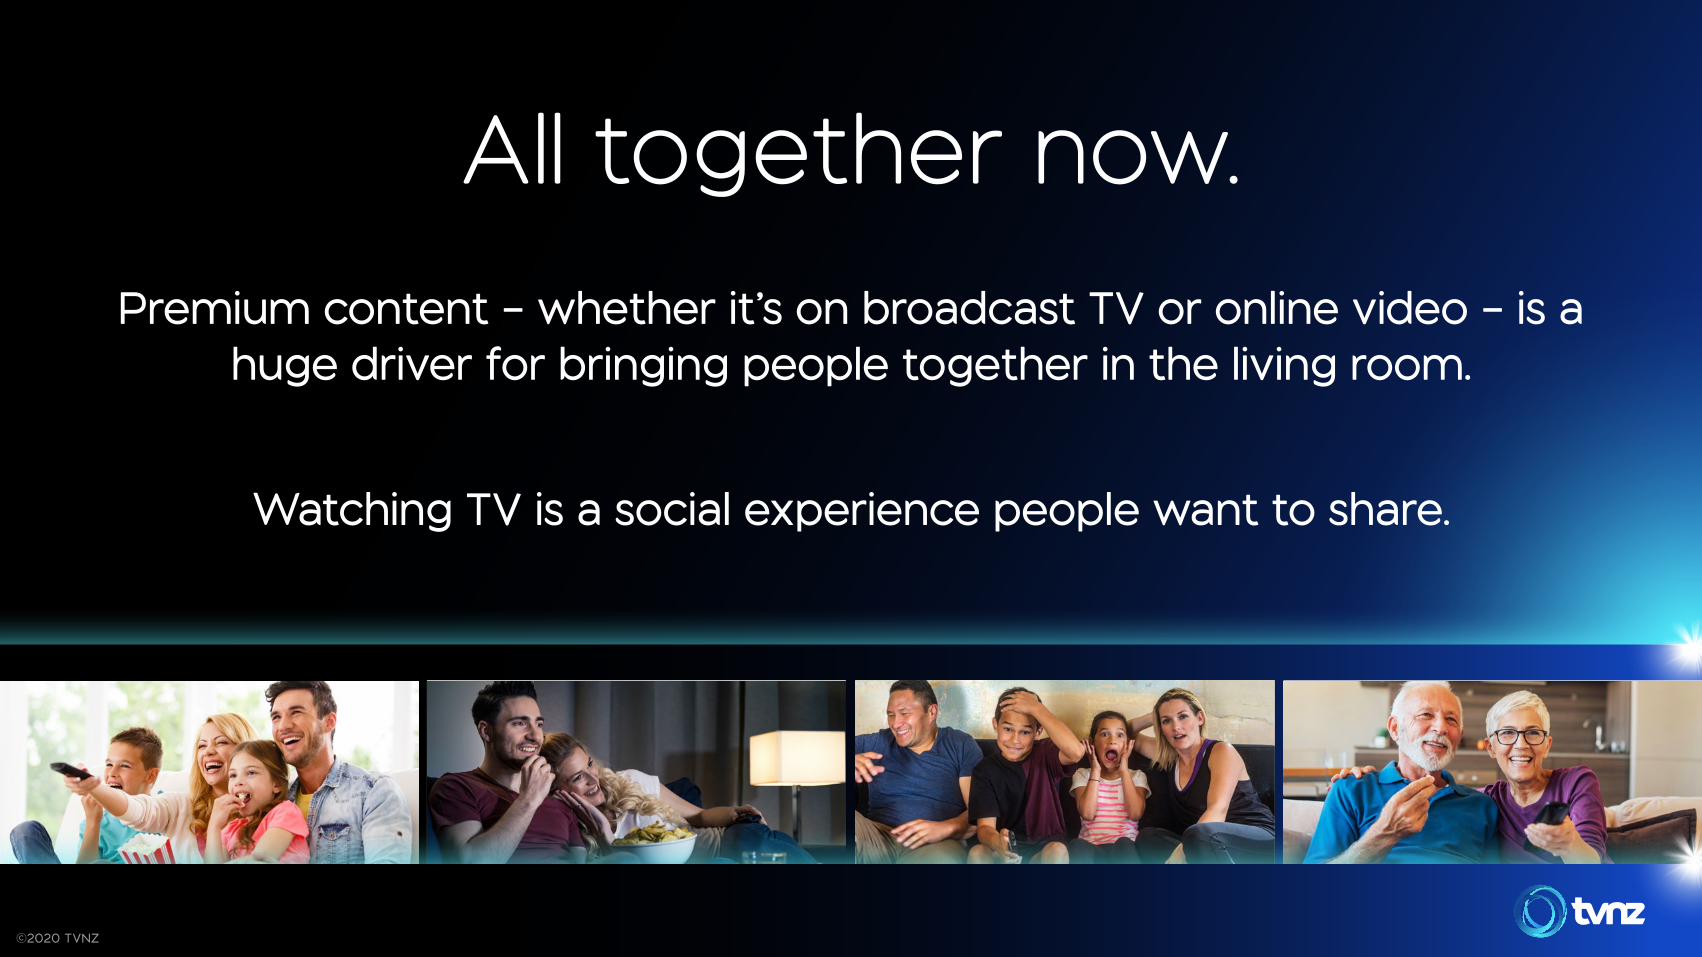
All together now.
©2020 TVNZ
Premium content – whether it’s on broadcast TV or online video – is a huge driver for bringing people together in the living room.
Watching TV is a social experience people want to share.
©2020 TVNZ

We were curious about this and wanted to dig deeper.
With the rise of Connected TV viewing, and the many ways viewers can watch video content, we wanted to know more about the occasions that drive co-viewing, in particular for online video.
We also know that one registered account on TVNZ OnDemand can often be used by more than one person, potentially having
a greater effect on the reach of a campaign.
So we did some research...
©2020 TVNZ

The research methodology
• Quantitative online survey
• 25 mins
• Users of online video platforms aged 15-60 years old
• Sample size n = 1,500
• Reporting a total of 3,554 occasions of online video viewing behaviour
• A greater effect on the reach of a campaign
A range of questioning techniques were implemented to maintain the quality of the data:
• Top down questioning approach when determining overall behaviour to prevent the summation of errors
• Incorporated cognitive interviewing principles to promote the accurate recall of viewing occasions from consumers’ memories
• Focus on occasions that occurred in the last week
• Logistic regression was used to determine the impact that different demographic and behavioural factors had on determining incidences of co-viewing
• The model’s results were also used to generate a second dataset that increased the reliability of the point estimates of by utilising the points relationship with similar occasions
• CHAID clustering was used to identify key breaks in the data and combinations where co-viewing was most likely
QuestionnaireSample Modelling
©2020 TVNZ
Source: Kantar Research 2019
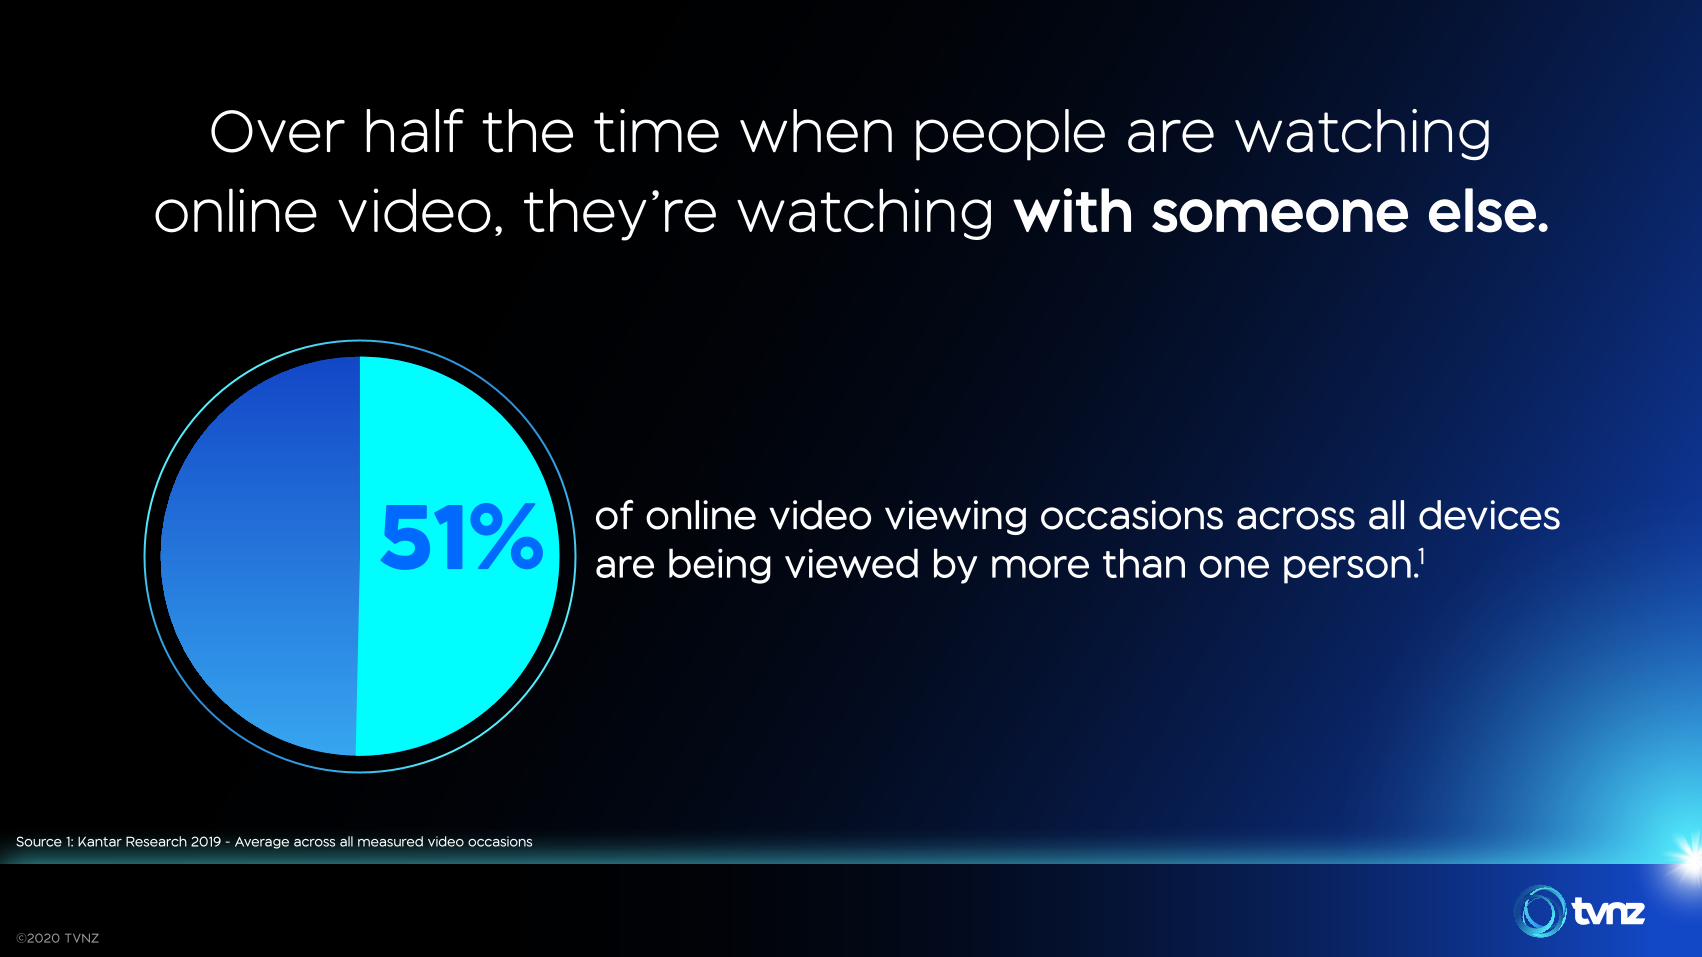
Over half the time when people are watching online video, they’re watching with someone else.
51% of online video viewing occasions across all devices are being viewed by more than one person.1
©2020 TVNZ
Source 1: Kantar Research 2019 - Average across all measured video occasions
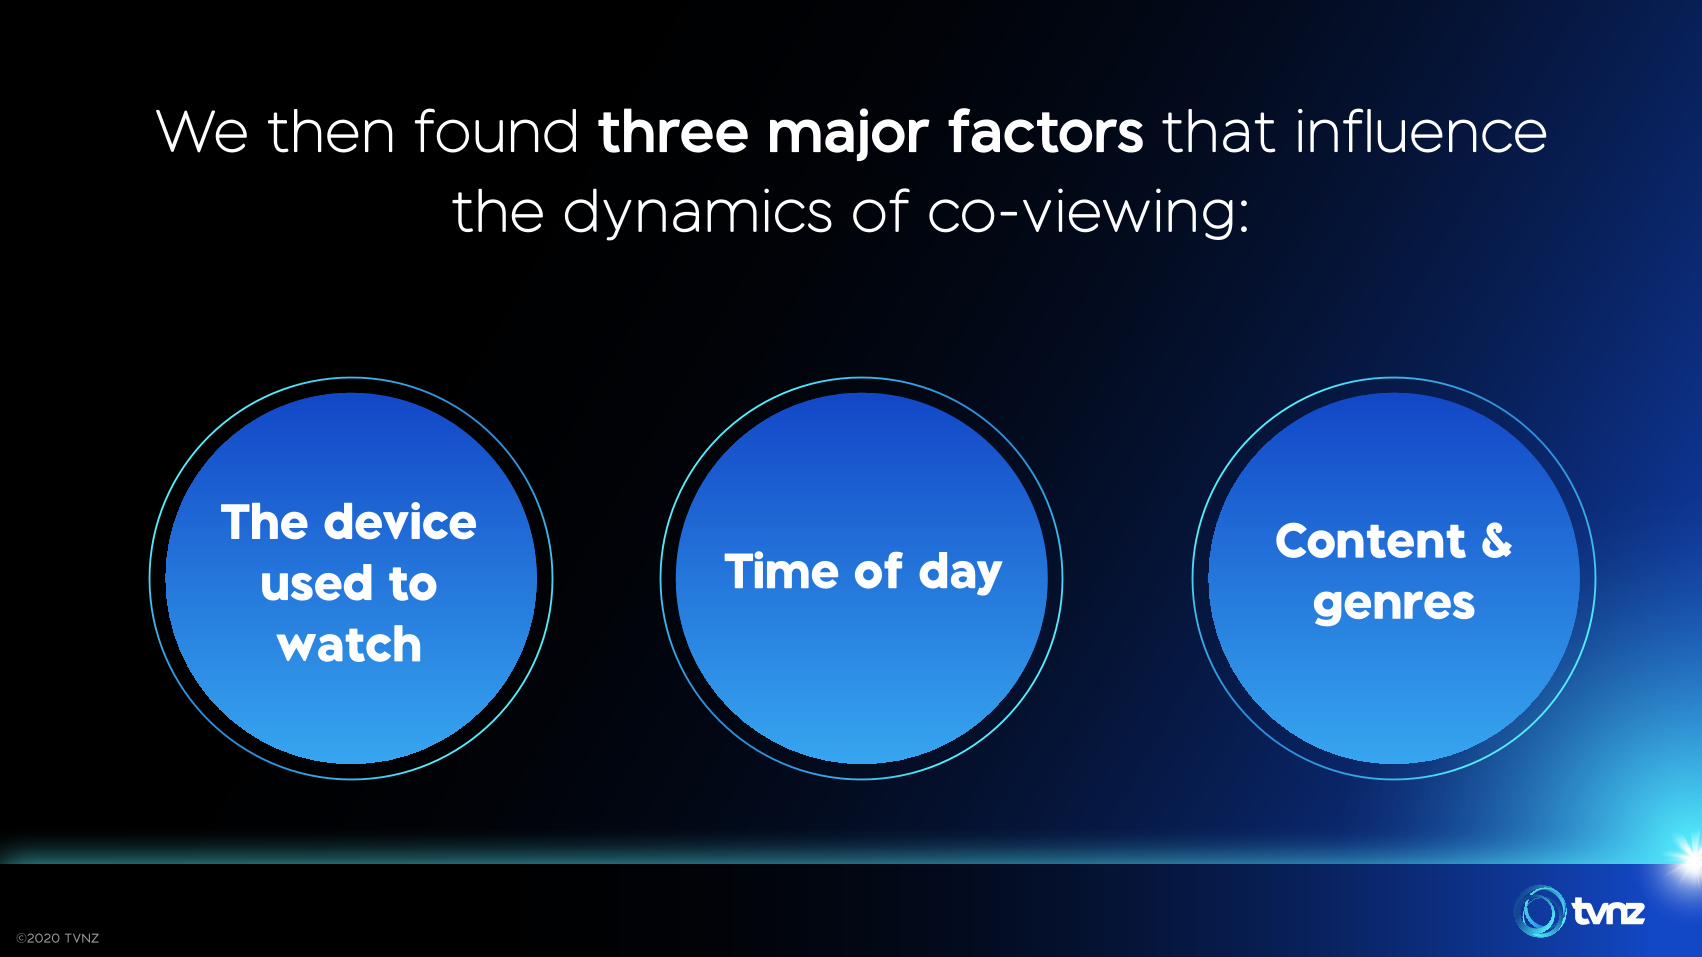
We then found three major factors that influence the dynamics of co-viewing:
The device used to watch
Time of dayContent &
genres
©2020 TVNZ
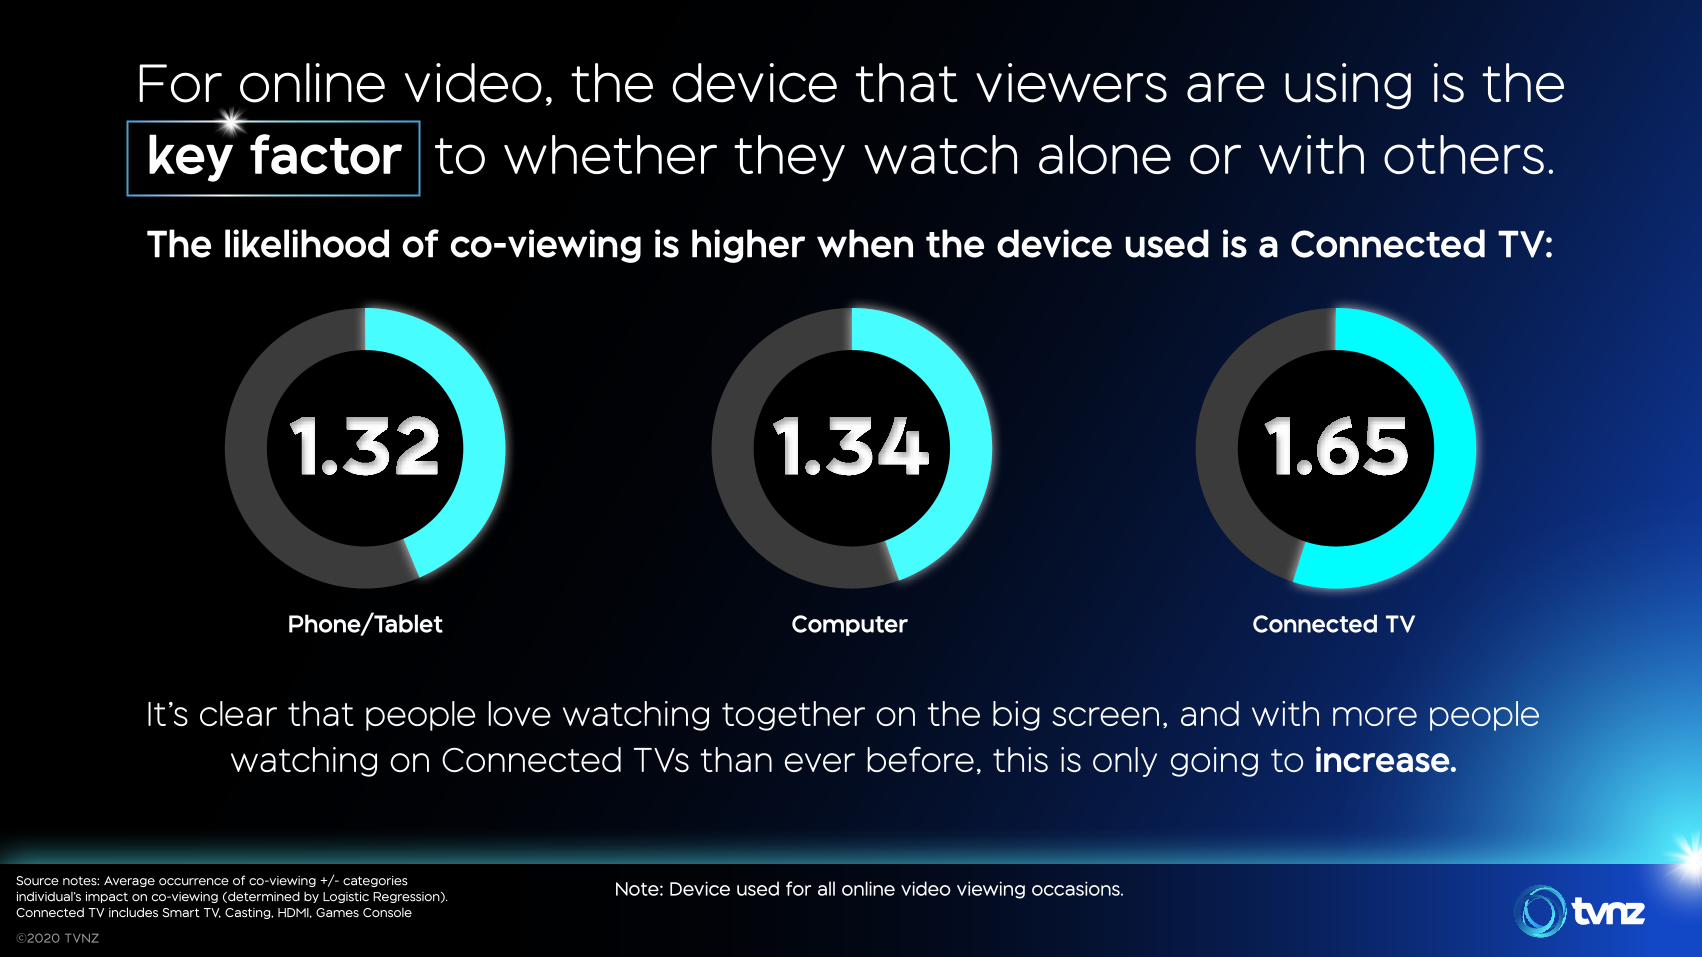
It’s clear that people love watching together on the big screen, and with more people watching on Connected TVs than ever before, this is only going to increase.
For online video, the device that viewers are using is the key factor to whether they watch alone or with others.
The likelihood of co-viewing is higher when the device used is a Connected TV:
Phone/Tablet Computer Connected TV
©2020 TVNZ
Source notes: Average occurrence of co-viewing +/- categories individual’s impact on co-viewing (determined by Logistic Regression). Connected TV includes Smart TV, Casting, HDMI, Games Console
Note: Device used for all online video viewing occasions.
1.32 1.34 1.65
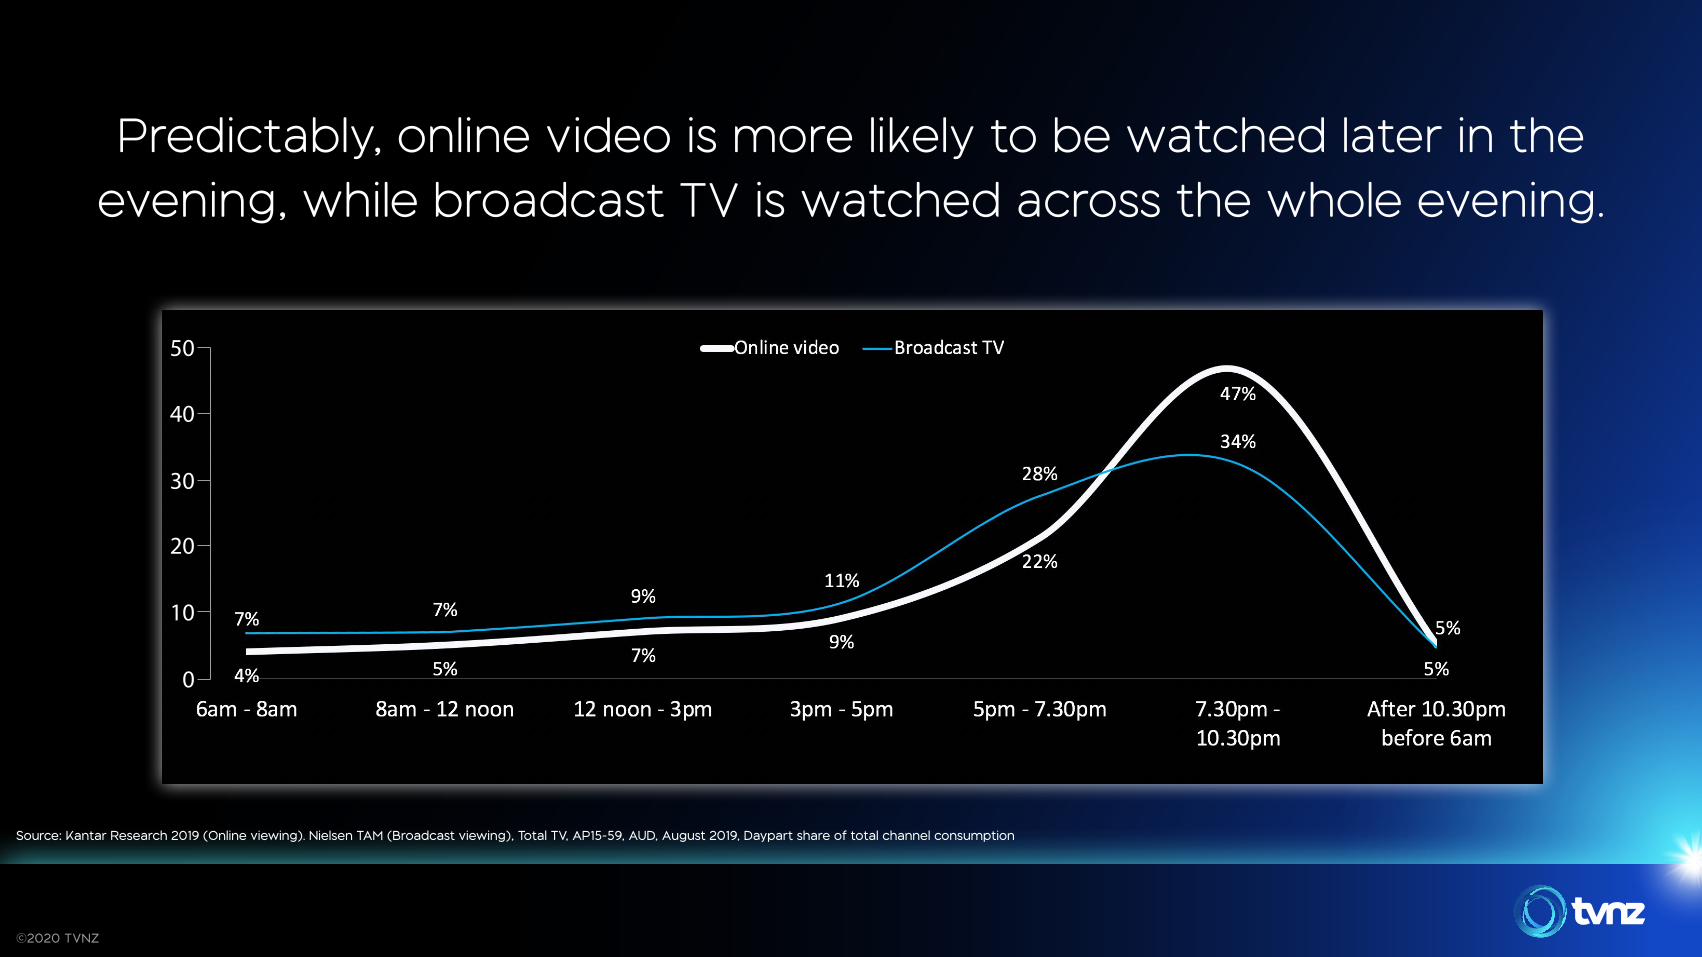
Predictably, online video is more likely to be watched later in the evening, while broadcast TV is watched across the whole evening.
©2020 TVNZ
Source: Kantar Research 2019 (Online viewing). Nielsen TAM (Broadcast viewing), Total TV, AP15-59, AUD, August 2019, Daypart share of total channel consumption
0
10
20
30
40
50
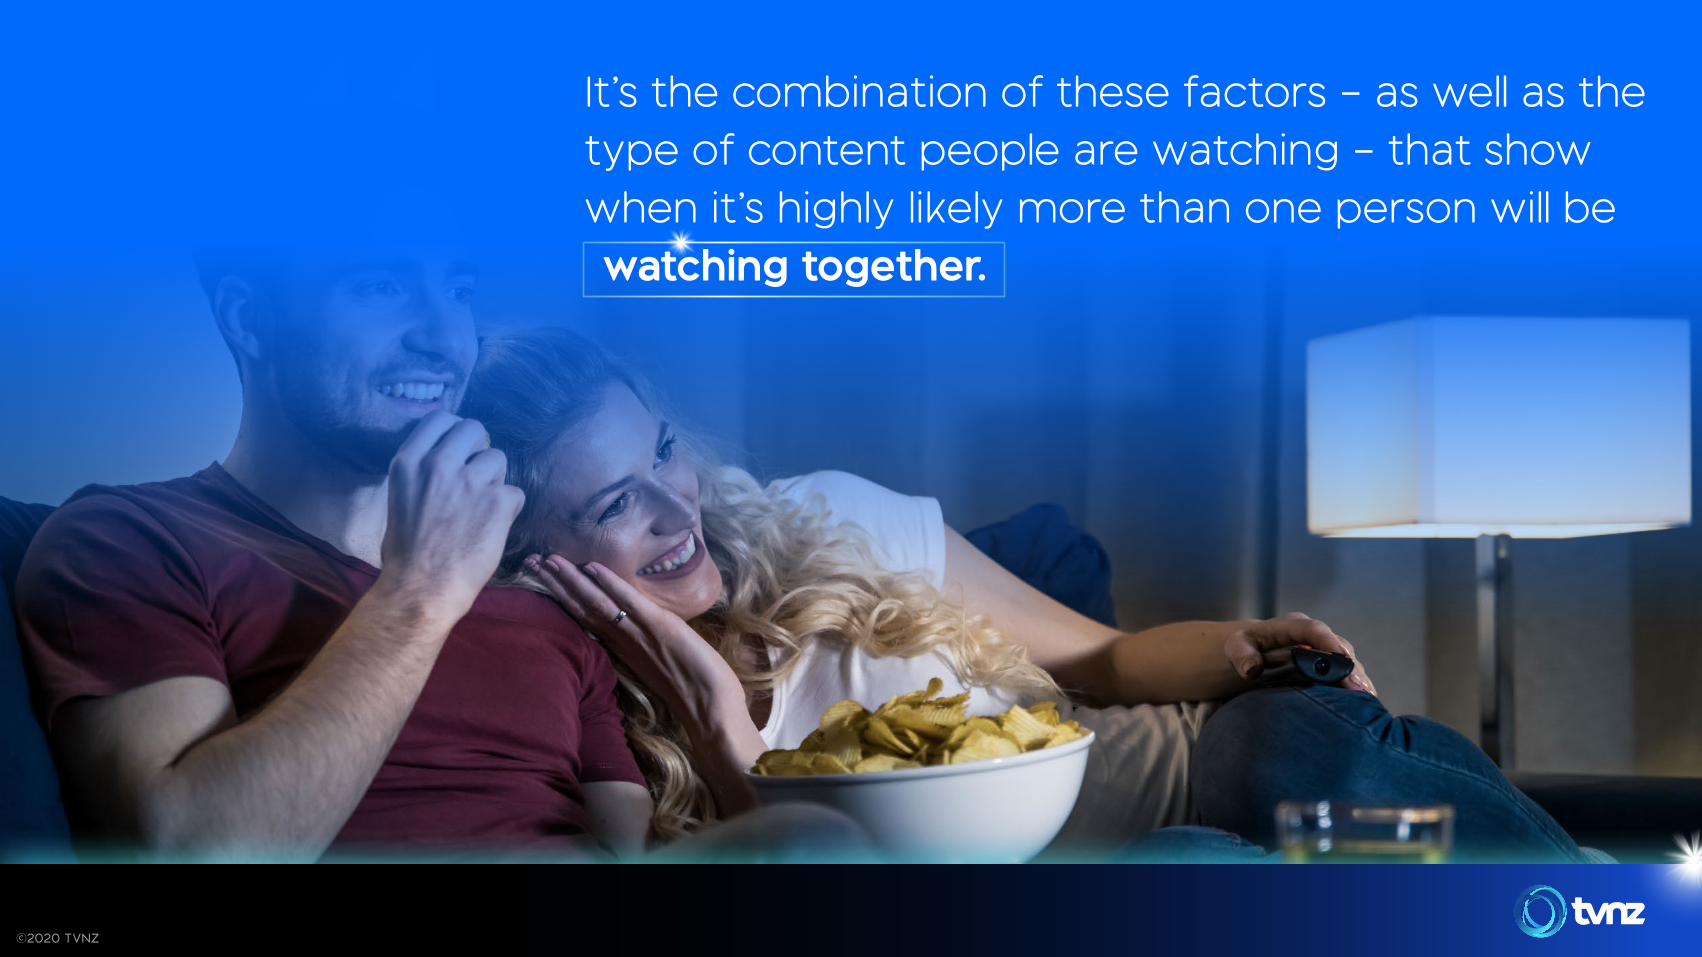
It’s the combination of these factors – as well as the type of content people are watching – that show when it’s highly likely more than one person will be watching together.
©2020 TVNZ

Great storytelling has always captivated us, and connecting through the shared experience of stories is ingrained in our social fabric.
We see this in the results below that show the likelihood of adults watching with another adult.
For example, when males aged
18-39 are co-viewing, 44% of
the people they co-view with are
females of a similar age and 12%
are males of a similar age.
Note: All online viewing occasions.
When targeting a specific demo
group, there is a 40-45% probability
that the person they are co-viewing
with is in the same age group but
the opposite gender.
©2020 TVNZ
12%
44%
Source: Kantar Research 2019
Male Female18-39
Less than 17
Less than 17
18-39
18-39
40-60
40-60
60+
60+
18-3940-60 40-60M
ale
Fem
ale
Co-v
iew
ing
Pers
on
44%
12%
Primary Person

More people watch together when you combine premium content and mass reach, with BVOD coming out
higher for co-viewing than other online video platforms.
1.63BVOD
1.47Subscription channel
1.42YouTube
©2020 TVNZ
NOTES: Average occurrence of co-viewing +/- categories individual’s impact on co-viewing (determined by Logistic Regression)
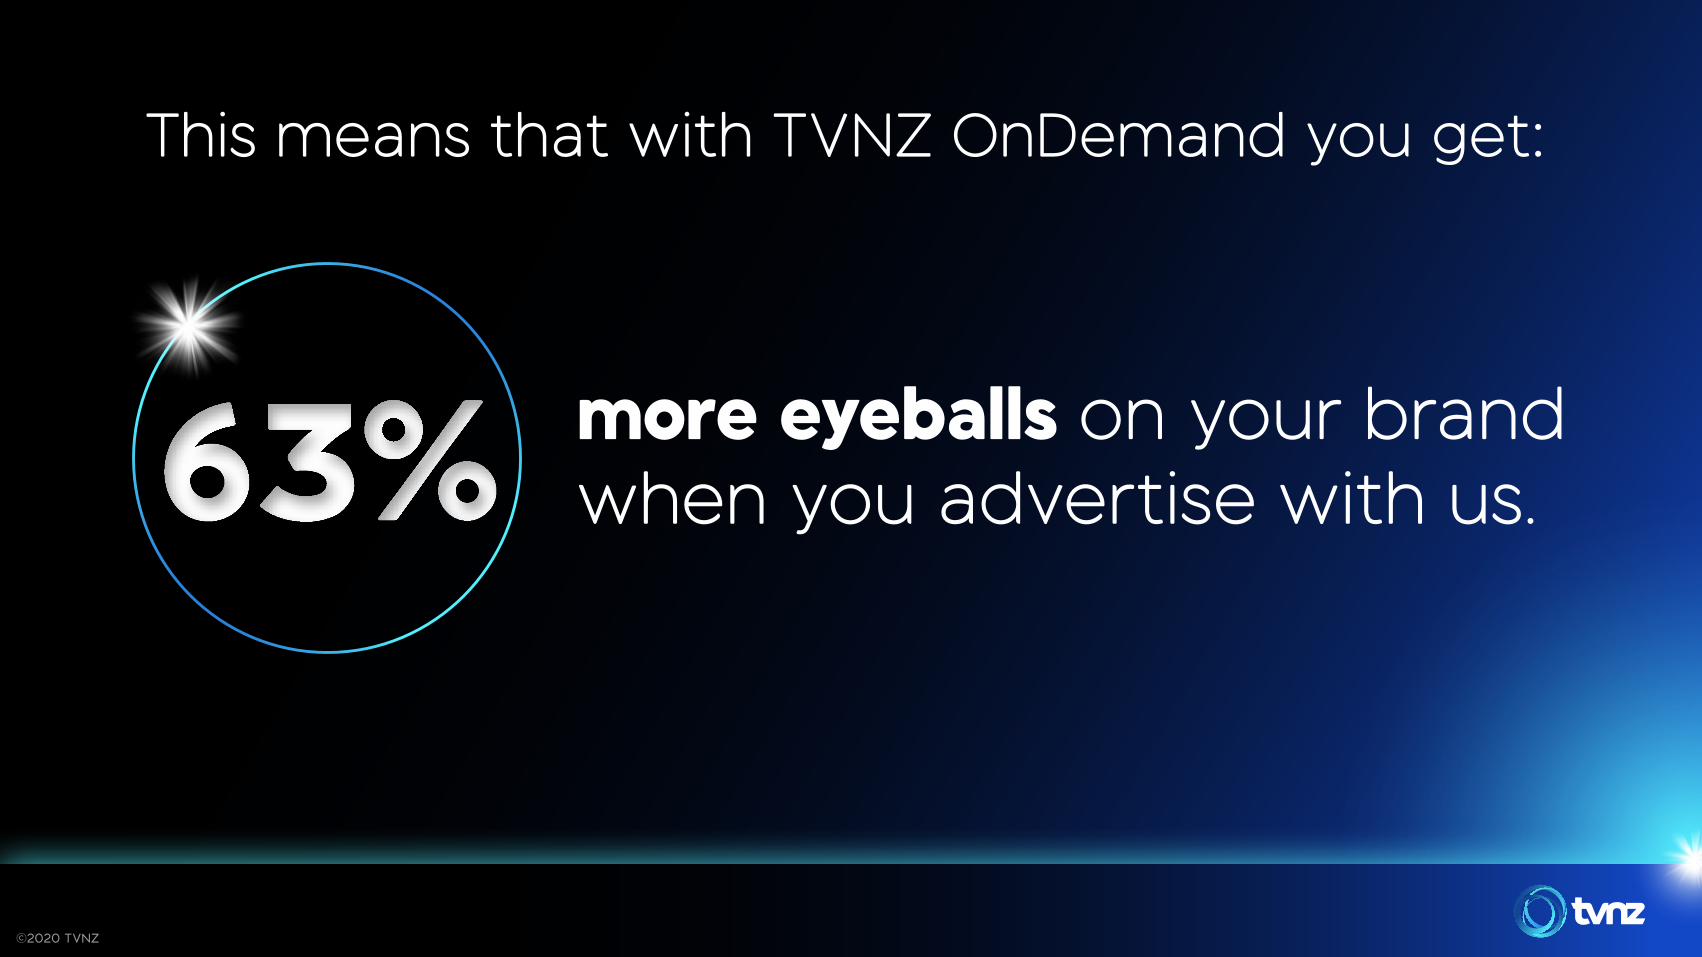
This means that with TVNZ OnDemand you get:
more eyeballs on your brand when you advertise with us.63%
©2020 TVNZ

TVNZ OnDemand is the biggest BVOD player in the market. Bigger audiences mean more chances for co-viewing occasions.
Weekly NZ BVOD Reach (Total Pop 10+)
TVNZ OnDemand
©2020 TVNZ
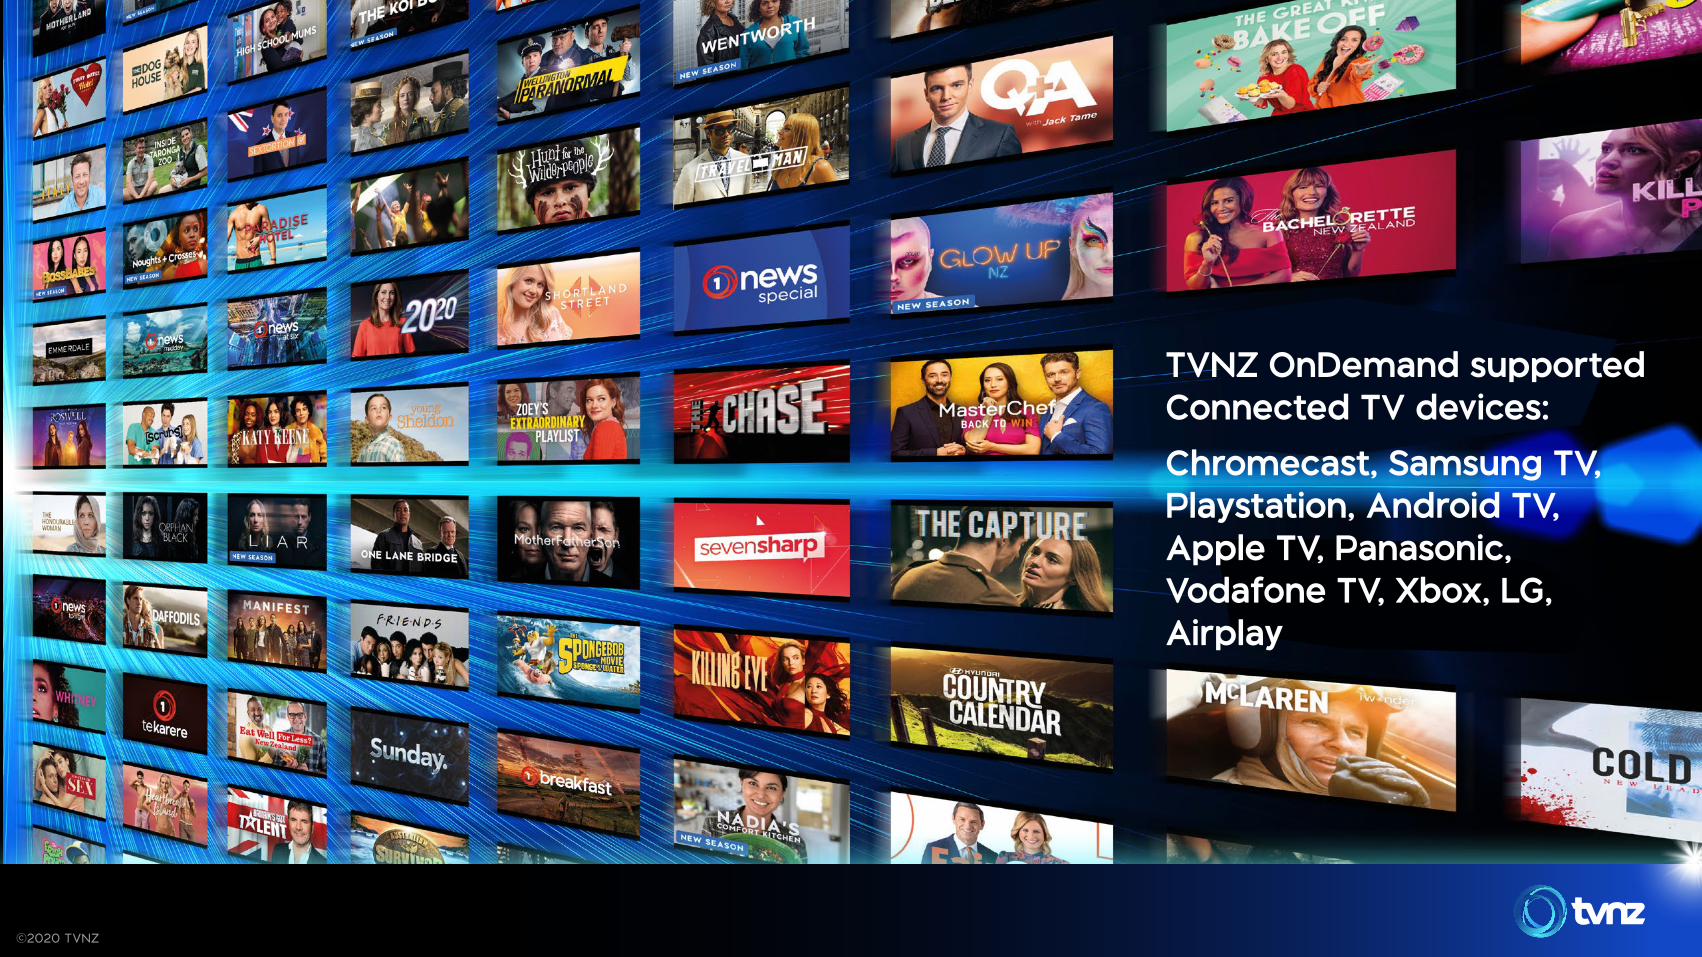
TVNZ OnDemand supported Connected TV devices: Chromecast, Samsung TV, Playstation, Android TV, Apple TV, Panasonic, Vodafone TV, Xbox, LG, Airplay
©2020 TVNZ
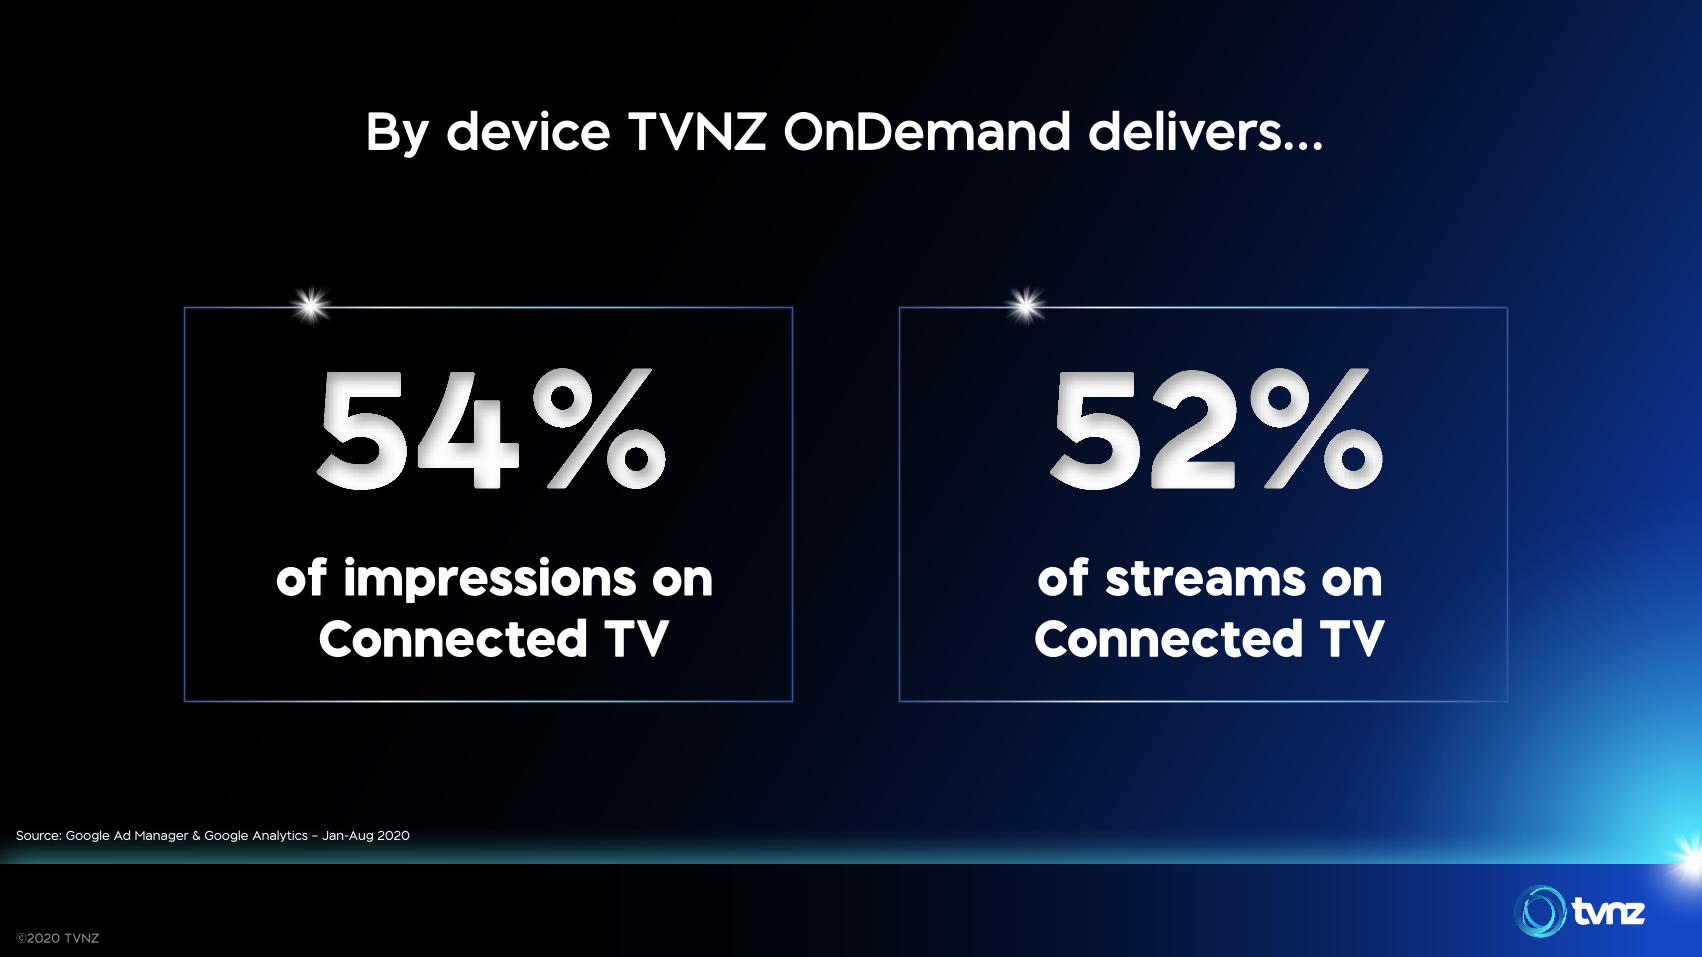
By device TVNZ OnDemand delivers…
of impressions on Connected TV
of streams on Connected TV
54% 52%
©2020 TVNZ
Source: Google Ad Manager & Google Analytics – Jan-Aug 2020
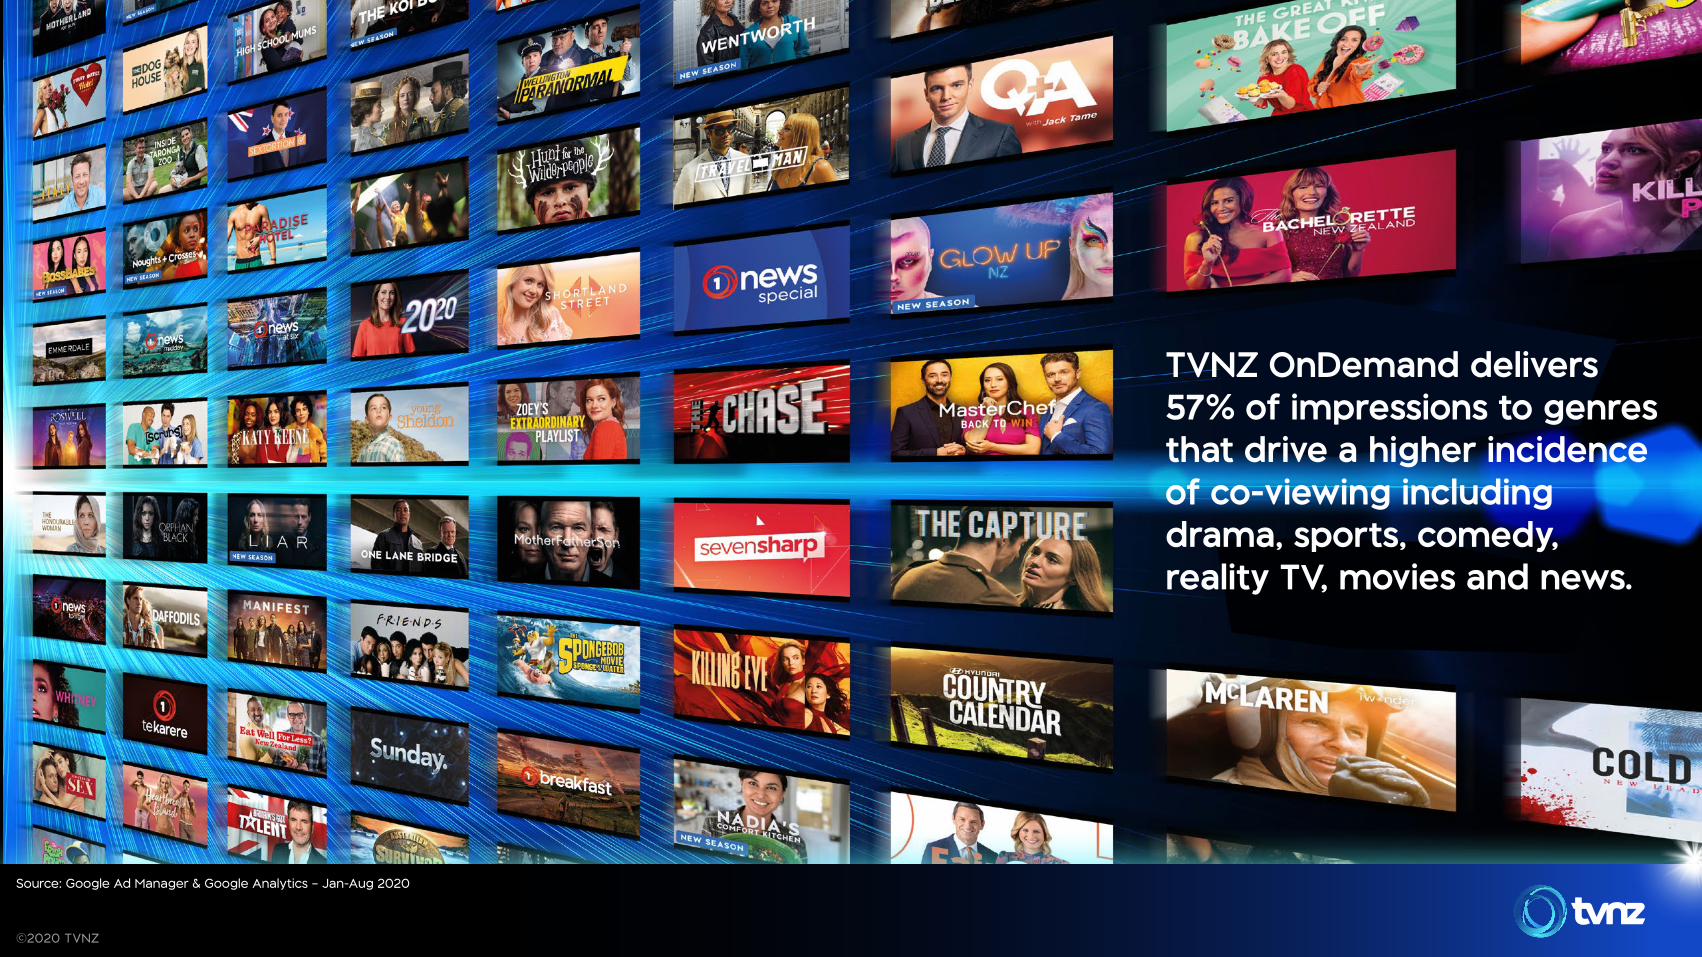
TVNZ OnDemand delivers 57% of impressions to genres that drive a higher incidence of co-viewing including drama, sports, comedy, reality TV, movies and news.
©2020 TVNZ
Source: Google Ad Manager & Google Analytics – Jan-Aug 2020
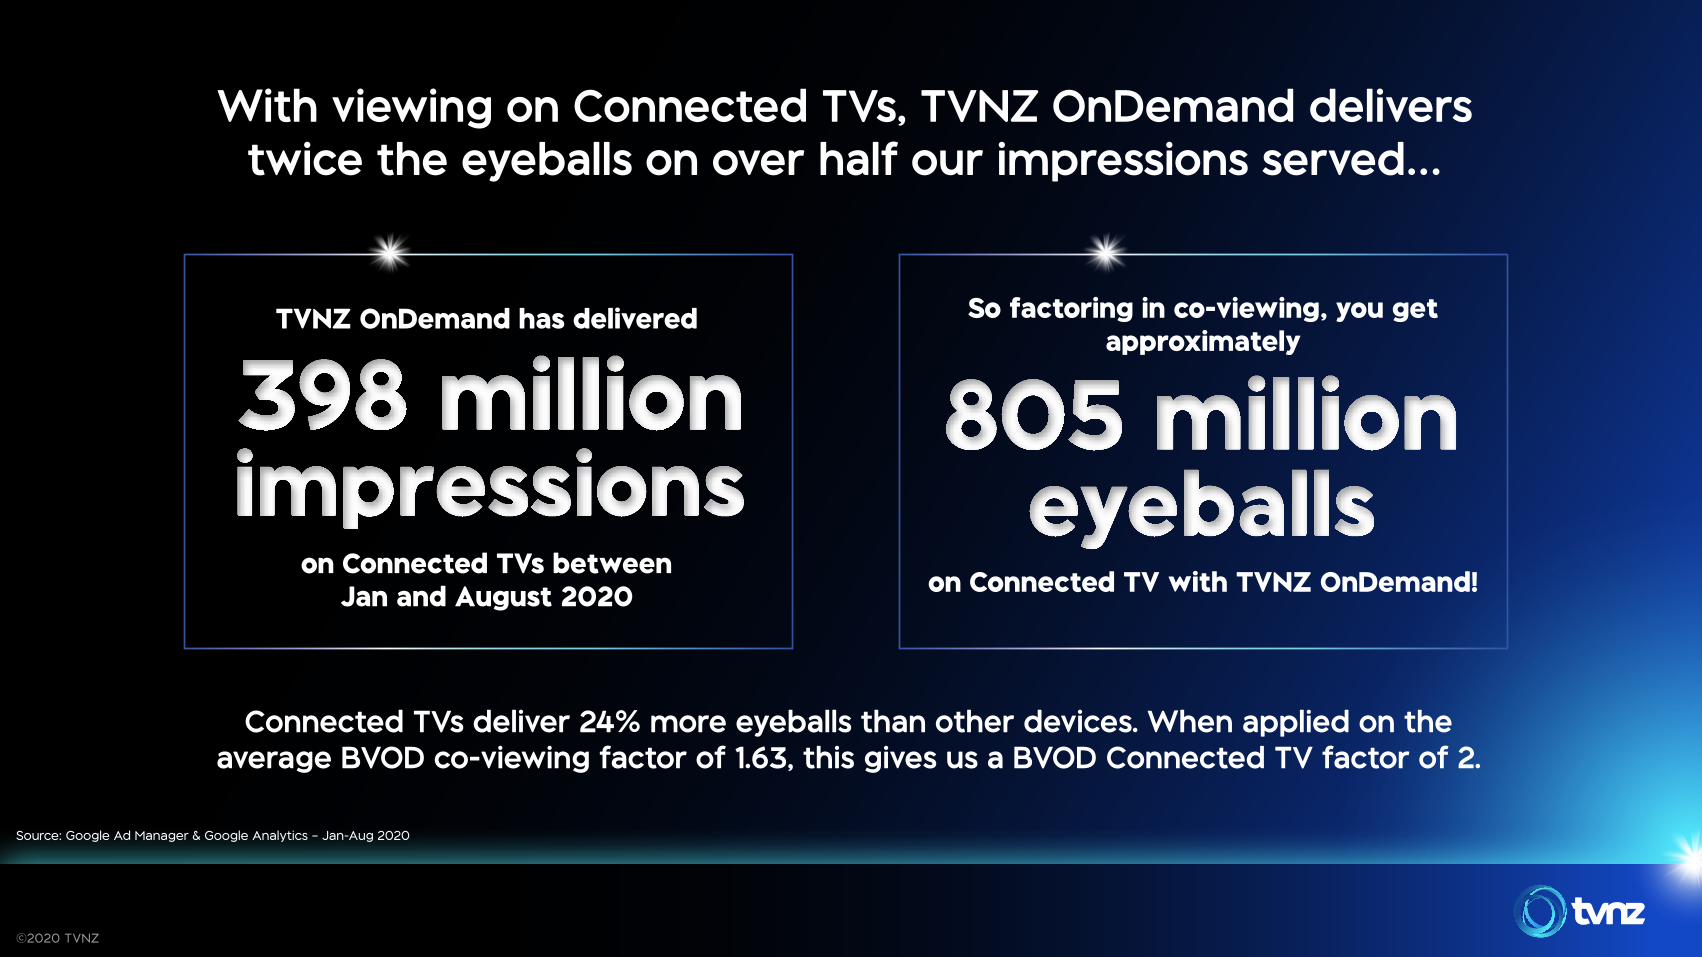
With viewing on Connected TVs, TVNZ OnDemand delivers twice the eyeballs on over half our impressions served…
Connected TVs deliver 24% more eyeballs than other devices. When applied on the average BVOD co-viewing factor of 1.63, this gives us a BVOD Connected TV factor of 2.
on Connected TVs between Jan and August 2020 on Connected TV with TVNZ OnDemand!
TVNZ OnDemand has delivered So factoring in co-viewing, you get approximately
398 million impressions
805 million eyeballs
©2020 TVNZ
Source: Google Ad Manager & Google Analytics – Jan-Aug 2020

Advertising on TVNZ OnDemand gives you the biggest online video platform with the
biggest opportunity for co-viewing:
More Connected TVs
More viewers
More content that people
love to watch together
More likely to have more than
one person watching
++ =
©2020 TVNZ