why do executives commit financial fraud? executive ... annual meetings... · executive perquisites...
TRANSCRIPT
1
Why do executives commit financial fraud? Executive perquisites and corporate
governance implications
Chia-Ying Chan
College of Management
Innovation Center for Big Data and Digital Convergence
Yuan Ze University, Taiwan.
Email: [email protected]
Phone: +886 (0)34638800 ext.2670
Hsiangping Tsai
College of Management
Yuan Ze University, Taiwan.
Email: [email protected]
Phone: +886 (0)34638800 ext.2672
Kuo-An Li
College of Management
Yuan Ze University, Taiwan.
Email: [email protected]
Phone: +886 (0)34638800 ext.6195-3624
January 12, 2015
JEL Classification: G3, G18, G38
Key word: Perquisites, Executive compensation, CEO pay slice (CPS), Financial fraud

2
Why do executives commit financial fraud? Executive perquisites and corporate
governance implications
Abstract
This paper examines whether executive perquisites, CEO pay slice, and monitoring
power forces are crucial factors in explaining the likelihood of executives committing
financial fraud.
The issuance and disclosure of executive perquisites has been scrutinized in recent years,
with the role of perks widely debated among market participants, scholars, and government
regulators. While some support the incentive alignment views, others contend that lavish
perks may be harmful to firm value. Although recent studies have confirmed the positive
association between the likelihood of fraud within a firm and equity incentive schemes,
studies have yet to examine whether different executive perquisites affect the likelihood of
fraud differently. Given the discussion on the effects of perquisites, fraud within the firm
serves as a natural experiment in defining the effect of executive perquisites. This serves as
the main motivation of the current study.
This study contributes to the literature by hand-collecting both AAER fraud cases from
the SEC and details on executive perquisites from firm proxy statements. Empirical studies on
perquisites are scarce. This study advances such empirical investigation by exploring the
association between different types of executive perquisites and their linkage with the
likelihood of financial fraud. Overall, our results suggest that granting financial and severance
perks to CEOs (and top executives), giving lower power to CEOs, and maintaining an
adequate level of monitoring power might help to alleviate executive commission of financial
fraud.
JEL Classification: G3, G18, G38
Key words: Perquisites, Executive compensation, CEO pay slice (CPS), Financial fraud

3
INTRODUCTION
Over the past decade financial debacles in large US firms such as Enron and World Com
not only damaged shareholder welfare, but have also drawn attention from regulators and
scholars searching for the causes of these events. The scandals spurred a series of legislative
policy reforms including the 2003 SOX Act, the 2004 FAS123R equity incentive scheme fair
valuation model, and the 2006 SEC compensation disclosure rule reforms. In March of 2009,
looking back on the scandals, former Federal Reserve Chairman Ben Bernanke observed that
"supervisors must pay close attention to compensation practices that can create mismatches
between the rewards and risks borne by institutions or their managers.”
Based on agency problem theory, Jensen and Meckling (1976) suggest that executive
compensation aligns the interests of firm executives with firm performance, and hence
maximizes the performance of the firm. Their view has been supported by a number of
empirical studies, including Brickley, Bhagat, and Lease (1985), Smith and Stulz (1985),
Yermack (1995), Mehran (1995), Core and Guay (1999), Morgan and Poulsen (2001), Hanlon,
Rajgopal, and Shevlin (2003), Hillgeist (2003) and Frye (2004). However, Burns and Kedia
(2006), Denis, Hanouna, and Sarin (2006), Bruner, McKee, and Santore (2008), Peng and
Röell (2008), Johnson, Ryan Jr., and Tian (2009), Feng, Ge, Luo, and Shevlin (2011) have
contended that the likelihood of fraud is significantly linked to the executive compensation
scheme. The majority of scholars argue that executive compensation plans may not only be
unsuccessful in aligning the interests of executives with their firms, but may also tempt
executives to commit financial fraud. Theoretical arguments and empirical findings suggest
that executives may commit crimes such as financial fraud or accounting manipulation when
the personal utility from the fraud surpasses the stimulation effect from the executive
compensation scheme. Researchers have expressed concern that executive compensation may

4
misalign interests between agents and principals, destroying firm value.1
The aforementioned studies have proposed that stock options are more likely to be linked
with fraud than other compensation components, because executives can obtain higher
personal benefits by exercising vested options when market stock prices have peaked. Bruns
and Kedia (2006) noted that “incentives from options encourage aggressive accounting
practices that result in a restatement”. However, perquisites, an important form of
compensation, have been neglected in the discussion of impacts of executive compensation on
fraud.
The issuance and disclosure of executive perquisites have been widely debated among
market participants, scholars, and government regulators. Perquisites by their nature have
three major differences from other forms of compensation. First, executive perquisites
typically do not take the form of regular pay. A standard executive compensation package
contains regular items such as cash compensation, and various forms of equity incentives, but
not necessarily perks. An executive could have generous salary and options, but may not
enjoy an extra package of perks. Second, unlike other compensation components which have
a clear definition for calculating and reporting, perks are diverse and difficult to quantify.
Following Andrews, Linn, and Yi (2009) and Grinstein, Weinbaum, and Yehuda (2011), using
firm annual proxy statements, we collect and identify data on perks such as service perks,
entertainment perks, home and family perks and financial perks, which are more personal
benefits and may not be directly linked with the market performance of the firm. These
different types of perquisites may affect the incentive alignments between executives and
1 Carl Levin, U.S. Senator and the Chairman of the Permanent Subcommittee on Investigations, indicated in a letter to the Secretary of the U.S. Department of the Treasury, Henry Paulson, on October 20th, 2008 that: “It is unacceptable for financial institutions that have generated billions of dollars in losses, damaged the U.S. economy, and accepted a taxpayer bailout, to maintain past levels of compensation. For each financial institution that accepts taxpayer dollars, the Treasury should require it to detail its compensation plans publicly, prevent the payment of bonuses or severance payments, and require use of taxpayer dollars to get credit flowing again. Please describe your Department’s plans and timetable for obtaining compensation data from each of the financial institutions receiving taxpayer funds, issuing appropriate compensation standards, and requiring compliance with those standards.”

5
shareholders. Third, prior to the December 2006 SEC compensation disclosure reform, firms
were required to report executive perks in a footnote of the summary compensation table
when the perks exceeded a certain high threshold.2 Scholars, market participants, and the
SEC later recognized firm executives may also receive different forms of perquisites, which
lead the SEC to introduce the Executive Compensation and Related Person Disclosure reform
at the end of 2006. Under the new SEC compensation disclosure rule, the Summary
Compensation Table in the firms’ proxy statement has a new format, which requires firms to
explicitly list each type and amount of perquisite in a separate section. Hence, unlike the
enforcement of reporting of other forms of executive compensation, whether firms have
issued and reported executive perks affects the firm’s information transparency and
governance quality. In sum, the distinctions between perquisites and other forms of
compensation has implications for the principal-agent relationship. Elucidating these
implications is the main motivation of our study.
Both scholars and regulators have argued that lavish perks can lead to fraud.4
Recent studies on the role of executive perquisites have generated two views. Yermack
(2006), Andrews, Linn, and Yi (2009) and Grinstein, Weinbaum, and Yehuda (2011) all find
significant negative short-term abnormal returns when firms disclose perquisites to the public.
Faulkender, Kadyrzhanova, Prabhala, and Senbet (2010) reviewed the positive and negative
aspects of executive compensation. They argue that lavish compensation payments such as
stock options may induce managers to manipulate financial statements, leading to financial
debacles, after the dot com bubble and the 2008 financial crisis.
Conversely, studies by Rosen (2000), Rajan and Wulf (2006), and Marino and
2 The amended disclosure rule in 2006 lowered the perquisite disclosure reporting threshold. Under the previous rule, perks valued above $50,000 and 25% of total perks should be reported in proxy statements. Under the new rule, firms must disclose aggregate values of perks exceeding $10,000, and any perks worth $25,000 or 10% of the total perk amount. 4 USA Today on 25th of April, 2012, also reported that “the perk remains pervasive among regional bank and financial firms.”

6
Z´abojn´ık (2008) show that higher amounts of perks are associated with better governance
quality and more efficient productivity. Rajan and Wulf (2006) discuss the association
between perks and productivity, private benefit, status, and taxes. They suggest that perks and
salary are “mutually reinforcing” incentive schemes. Rosen (2000) contends that perquisites
to some extent provide motivation and enhance productivity. Marino and Z´abojn´ık (2008)
suggest that perquisites serve the functions of consumption complementarities and
productivity enhancement, especially when the production process is more uncertain.
Although recent studies have confirmed the positive association between likelihood of
fraud and equity incentive schemes, no study has investigated whether differing executive
perquisites have different effects on the likelihood of fraud. Occurrences of fraud within firms
may serve as a natural experiment for clarifying the role of executive perquisites. The need
for such research is a key motivation of the current study.
This study contributes to the literature by hand-collecting AAER fraud cases from the
SEC and executive perquisite details from firm proxy statements. The scarcity of empirical
studies on perquisites may be the result of poor data availability in ready-for-purchase
databases. This study thus advances empirical investigations by evaluating the association
between different types of executive perquisites and their linkage with the likelihood of
financial fraud. This study follows the concepts of Andrews, Linn, and Yi (2009) and
Grinstein, Weinbaum, and Yehuda (2011) and classifies perks into five main types, based on
their content and purpose. This study postulates that various types of perks (such as legal
services perks and financial perks) may generate different empirical results. In particular, we
investigate whether the CEO Pay Slice (CPS), a Dummy of no analysts following a firm, and
a Dummy of low institutional ownership may act as a type of monitoring enhancement or
monitoring distortion, in the association between perquisites and the likelihood of fraud.
These monitoring variables, which we believe are important, have been neglected in empirical
studies related to fraud.

7
Our empirical finding generated results contrary to those of previous literature which
found a positive association between fraud likelihood and executive options. We show that
there is a significant negative relation between perks and the likelihood of financial fraud.
Moreover, not disclosing perks is positively related to the likelihood of financial fraud. Our
empirical results are consistent with the propositions of Fama (1980), Rajan and Wulf (2006),
and Marino and Z´abojn´ık (2008), who argued that offering perks may be helpful for firms in
designing optimal compensation contracts for firm executives.
Our main findings are summarized as follows. First, we show that firms in which fraud
occurred reported smaller amounts of perks to CEOs/top executives than matched firms.
Second, the likelihood of firms experiencing fraud is higher if there is no perk offering, if the
CEO pay slice is larger, and if the monitoring power is relatively weak (no analysts following
or low level of institutional ownership). Conversely, a firm is more likely to experience fraud
if it is under high pressure to show short-term performance to monitors. This pressure is
measured by the number of analysts following and the percentage of aggregate institutional
shareholding. Such evidence of monitoring indicates that either no monitoring or too much
pressure from monitors may induce fraud. In sum, we show that CEO/top executives
committed fraud because they had a lower level of financial and severance perks, and were
granted more power. Finally, the effect of CEO perquisites is more pronounced than that of
the top five executives perquisites. This is unsurprising given the CEO’s primary role in firm
decisions.
The remainder of this study is organized as follows: Section 2 presents the literature
review and hypotheses. Section 3 presents data selection and Section 4 covers methodology.
The empirical results and analysis are presented in Section 5. Finally in section 6 the
conclusions are drawn.
PREVIOUS LITERATURE, BACKGROUND AND HYPOTHESES
8
Executive Compensation and Financial Fraud
Although Jensen and Meckling (1976) suggest that executive compensation packages
align the interests of managers and firms, Becker (1968) earlier argued that the “agent” might
commit a crime when the utility of crime payoff exceeds the “disutility” of being caught in
the process. Recently, Becker’s point of view has been supported by Johnson, Ryan Jr., and
Tian (2009).
Several theoretical studies highlight how executive equity-based compensation may
induce managerial fraud. For instance, Goldman and Slezak (2006) and Bruner, McKee, and
Santore (2008) show that equity-based incentive schemes exhibit a tradeoff between
enhancing manager productive efforts and increasing managerial incentive to redirect firm
resources to misreport performance or to commit fraud. Goldman and Slezak (2006) further
analyze the regulatory changes of the Sarbanes-Oxley Act and show that policies aimed at
reducing manipulation can actually induce manipulation. In addition, Chesney and Gibson
(2008) present a continuous-time real options’ pricing model, and find that managers who are
offered stock options have a higher incentive to commit fraud than those who are offered
common stocks.
A few studies have empirically examined the relation between executive compensation
and firm fraud. To identify a sample of fraud firms, scholars have studied firms subject to
class action lawsuits (Denis, Hanouna, and Sarin, 2006; Peng and Röell, 2008), fraud firms
from AAER reports (Erickson, Hanlon, and Maydew, 2006; Johnson, Ryan Jr., and Tian,
2009), and firms that restate their financial reports due to accounting irregularities (Burns and
Kedia, 2006).
The main findings indicate that executives’ stock option incentive is positively associated
with lawsuits, fraud events identified from AAER reports, and the restatement of financial
reports. Denis, Hanouna, and Sarin (2006) also show this positive relation is stronger for
firms with high outside blockholders and institutional ownership. Johnson, Ryan Jr., and Tian

9
(2009) provide further evidence that, during fraud periods, executives receive more total
compensation, increase their exercised amount of vested options, and sell more unrestricted
shares. The only exception is Erickson, Hanlon, and Maydew (2006), who find no evidence of
a relationship between executive compensation and fraud, and no significant stock selling or
options exercising behavior from fraudulent managers during the fraud period.
The majority of previous studies provide both theoretical or empirical support of the
positive relationship between executive compensation (equity-based in particular) and the
likelihood of managerial fraud. These findings indicate that executives may commit fraud
when the personal utility gained from the fraud surpasses the stimulation effect from the
executive compensation scheme. However, previous studies have explored executive equity
incentives and the likelihood of financial fraud without accounting for the impact of other
forms of executive compensation. Given the importance of executive perquisites for firms,
policymakers, market participants, and scholars, there is an urgent need to further investigate
their impact.
CEO/Executive Perquisite (Perks) and Financial Fraud
The agency theory of Jensen and Meckling (1976) and Grossman and Hart (1980)
suggests that firm executives attempt to extract firm resources through perk consumption.
Thus, perquisites are an agency cost to firm shareholders. Empirical studies by Yermack
(2006), Andrews, Linn, and Yi (2009) and Grinstein, Weinbaum, and Yehuda (2009), all
provide support for this view. Yermack (2006) examines CEO use of corporate jets and golf
club memberships for personal purposes between 1993 and 2005. He found a negative market
reaction around the announcement of perquisite consumption. Both Andrews, Linn, and Yi
(2009) and Grinstein, Weinbaum, and Yehuda (2011) investigated the determinants of perks
after the 2006 reforms to the disclosure rule by applying proxy statements in 2006-2007. Both
studies confirmed that perks are associated with high and free cash flow, lower growth

10
opportunities, negative market reactions, and weaker corporate governance. Ferdinand, Cheng,
and Leung (2011) examined the relationship between perks and share market prices in China,
finding a negative relationship between the amount of perks offered and the informativeness
of the underlying share price. The findings of these studies support the agency view of Jensen
and Meckling (1976).
Another stream of literature considers perquisites as enhancing incentive effects or
production efficiency. Fama (1980) argues that perks should be a part of optimal
compensation contracts and serve as a motivational tool to enhance firm value. Rajan and
Wulf (2006) view perks as having the ability to stimulate managers and possibly eliminate
agency problems. They surveyed senior executives of firms between 1986 and 1999 and
found that offering perks improved the productivity of senior managers. Marino and
Z´abojn´ık (2008) suggest that perquisites complements work efforts and should associated
with better corporate governance. They conclude that “It is always optimal to provide perks
free of charge.” (Page 567) Ranjen and Wulf (2006) also contend that perks could motivate
executives through provision of private benefits, status, and tax savings. Voßmerba ̈umer
(2013) investigates the issue of the tax treatment of workplace benefits (i.e. perks at work).
They argue that personal benefits at work enhance the utility of work, and when these benefits
are complimentary, the taxes incurred from the treatment should be at the expense of the
employer. Two studies examining perk issues in China both find that perks enhance incentives
and work efficiency (Adithipyangkul et al., 2011; Su and Liang, 2013).
Hence, studies of perks have generated inconclusive and conflicting results on their
effects. Though disclosure of perks results in a negative short term market response in studies
regarding perks as an agency cost, researchers also find that perks enhance operating
performance, suggesting that perks can be motivators. In this study, we postulate that these
views may not be contradictory. When market participants and media are critical of disclosed
perks, the short term abnormal returns may be significantly negative after perk offering

11
announcements. However, scholars have shown that perks can enhance productivity
efficiency and internal governance quality. From this perspective, we argue that perquisites
enhance quality of governance and complement the incentive alignment between executives
(agent) and shareholders (principal). No previous study highlights the relationship between
perquisites and financial fraud. This study is the first to use financial fraud as an experiment
to assess the incentive and governance roles of executive perquisites.
We hand-collected data regarding perquisites offered to firm executives prior to the fraud
period, for both fraud firms and control firms. If, as Rajan and Wulf (2006), Marino and
Z´abojn´ık (2008), and Vobmerbaurmer (2013) claim, the offering of perquisites provides
complements to incentive schemes and enhances work efficiency, then the likelihood that
CEOs (or executives) will commit financial fraud may be lower, since they have already been
enjoying the precautionary benefits offered by their employer.
This study finds that the majority of financial fraud found in AAER reports involves
financial restatements and/or the inflating of statements. This indicates that a positive relation
may exist between equity based (such as options) compensation and the likelihood of
financial fraud, which may occur are a result of managerial attempts to inflate financial
performance and, more specifically, as a result of a manager's efforts to enhance his or her
chance of exercising options. Nevertheless, if firms have the capacity to offer different forms
of perquisites to their executives, the likelihood of committing fraud may be alleviated, since
the executives have already realized an extra amount of compensation. Therefore, perquisites
have a different impact than equity options on the likelihood of financial fraud. We thus
hypothesize:
Hypothesis 1: There is a negative relationship between the reported perquisites in proxy
statements and the likelihood of fraud.

12
Corporate Governance and Financial Fraud
Previous studies of the occurrence of fraud highlight executive compensation and
corporate governance as the two major reasons why managers might commit fraud. In this
paper we argue that these two crucial reasons are not mutually exclusive. Yermack (2006) and
Andrews, Linn, and Yi (2009) believe that corporate governance is associated with the
distribution of perquisites, while other scholars claim that corporate governance is related to
fraud, lawsuits, or earnings management, as seen in Agrawal and Chadha (2005), Persons
(2006), Basu, Hwang, Mitsudome, and Weintrop (2007), Harris (2008), Cornett, Marcus, and
Tehranian (2008), and Cornett, McNutt, and Tehranian (2009). In a theoretical model
constructed by Marino and Z´abojn´ık (2008), better corporate governance quality is
positively related to the amount of perquisites offered. This is logical given the role of perks
as an incentive scheme. If they have sufficient perks, firm executives may not put extra effort
into extracting resources from the firm and their intention to commit the fraud would be lower.
Managerial consumption of perquisites is not a form of compensation tied to the market
performance of the shares, unlike stock options or access to restricted stocks. Thus, managers
who are offered large amounts of stock options may have greater intention to inflate the firm’s
financial statement, while perks may not have that effect.
Agrawal and Chadha (2005) examine incidents of firms restating and corporate
governance in the U.S. between 2000 and 2001. They find that a firm has a lower probability
of earnings restatement when there is an independent director with financial expertise.
Persons (2006) investigates several lawsuits involving "fraud" firms between 1992 and 2000,
which were collected from events reported in The Wall Street Journal. She concludes that
fraud firms have higher CEO turnover during the fraud period, and managers involved in
fraudulent activities may prefer to reduce cash compensation. In addition, she also found that
CEO changes occurred in fraud firms when the CEO was not the board chairman and the
CEO had only been on the board for a short time. Basu, Hwang, Mitsudome, and Weintrop

13
(2007) find weak corporate governance associated with executive compensation in Japan.
Cornett, Marcus, and Tehranian (2008) examine the cause of earnings management in S&P
100 firms in the U.S. between 1994 and 2003. They found that, after controlling for the
magnitude of earnings management, corporate governance variables had become substantially
more important than executive compensation. However, we argue some of the key variables
for important governance factors in the association between executive perquisites and the
likelihood of financial fraud have not been taken into account in previous research.
Bebchuk, Cremers, and Peyer (2011) proposed CEO pay slice (CPS) as an indicator of
agency cost, finding that CEOs with higher pay than the top five executives in the firm have a
higher opportunity to extract more rent from the firm. As a consequence, they may have a
higher likelihood of association with financial fraud. Lewellyn and Muller-Kahile (2012)
confirm that CEO power is positively linked to firms’ risk-taking behavior. Liu and Jiraporn
(2010) find that in order to escape from the monitoring of debt holders, firms pay higher at
issue yield-spreads for newly issued bonds. Jiraporn, Chintrakarn, and Liu (2012) contend
that firms with high CEO pay slice (CPS) attempt to maintain significantly low leverage level
in order to escape from the supervision of debt holders. These findings all show that powerful
CEOs are associated with more severe agency problems, in turn leading to value decreasing
decisions and poorer outcomes. In this paper, we argue that CPS serves as an important
internal governance proxy. Linked with the amount of compensation and corporate
governance, this proxy has been neglected in the literature on financial fraud and
compensation. Based on studies of the agency cost role of CPS, we hypothesize that:
Hypothesis 2: Firms with higher CPS have a higher likelihood of experiencing financial
fraud.

14
Moreover, we also propose that firms that lack monitoring are more likely to experience
financial fraud. Two important monitor proxies have been neglected in the literature on
financial fraud and compensation: analysts following, and institutional investors.
Researchers have explored the monitoring role of analysts and institutional investors in
many different corporate behaviors. Ayers and Freeman (2003) show that security prices
reflect future earnings earlier for firms closely followed by analysts and firms with high
institutional shareholding than for neglected firms. Yu (2008) shows that analyst coverage
helps constrain earnings management, indicating that analysts serve as external monitors of
managers. Sabri and Labégorre (2008) show that analysts are more likely to follow firms with
pyramidal control structures and firms with a larger deviation between ownership and control.
Their results support the contention that the minority shareholders of such firms consider the
information service provided by analysts to be valuable since such shareholders face a higher
likelihood of being expropriated. Dyck, Morse, and Zingales (2010) document that auditors
and analysts, two agents of equity holders, jointly detected 24% (but not the majority) of the
fraud cases in their study. Derrien and Kecskés (2013) use a sample of broker closures and
broker mergers to show that a decrease in analyst coverage causes a decrease in a firm’s
investment and financing activities by 1.9% and 2.0% of total assets in comparison to similar
firms that did not losing an analyst, indicating losing an analyst results in greater information
asymmetry and higher capital costs.
However, Barua, Legoria, and Moffitt (2006) find that firms manage earnings to meet
analyst forecasts, indicating having analysts following a firm may create incentives (or
pressure) for firms to conduct earnings management to achieve the benchmark set by analysts.
He and Tian (2013) show that analyst coverage hinders firm investment in long-term
innovative projects, consistent with the hypothesis that managers are under too much pressure
from analysts to meet short-term goals.

15
For institutional investors, using data of forced CEO turnover, Parrino, Sias, and Starks
(2003) show that aggregated institution shareholding and the number of institutional investors
declines in the year prior to the event, indicating that institutional investors vote with their
feet if they are dissatisfied with the management. Hartzell and Starks (2003) find that
institutional ownership is positively associated with the pay for performance sensitivity of a
firm’s executive compensation, supporting the monitoring role of institutional ownership in
mitigating the agency problem between shareholders and managers. Elyasiani and Jia (2010)
report a positive relationship between stable institutional ownership and firm performance,
consistent with the hypothesis that stable institutional investors play an effective monitoring
role. Burns, Kedia, and Lipson (2010) show that aggregate institutional ownership is
positively linked to the likelihood and magnitude of corporate financial misreporting.
However, Bushee (1998) shows that managers are under great pressure to reverse earnings
declines by reducing R&D expenses when institutional investors with short investment
horizons have a high level of ownership. Burns, Kedia, and Lipson (2010) find that the
severity and the likelihood of financial misreporting increase with the aggregate institutional
ownership. This effect is mainly attributed to ownership by institutions with short investment
horizons (i.e. with little incentive to monitor), but it is offset by the concentration of holdings
by these institutions (i.e. greater incentive to monitor).
Empirical literature on analyst coverage and institutional ownership suggests that they
serve as proxies of monitoring power, but results are not conclusive. However, in extreme
cases, corporate governance quality may become distorted. Too many analysts following
and/or over-concentrated institutional ownership may put pressure on firm executives,
inducing them to commit financial fraud. By the same token, if a firm has few analysts
following it or low institutional ownership, monitoring would be poor, and the likelihood of
financial fraud would rise. Therefore, we posit that the level of analysts following and

16
institutional ownership are both important proxies of monitoring power. In addition to the
absolute number of analysts following and the level of institutional investors, we further
define two dummy variables as the proxies of insufficient monitoring, including firms without
analysts following (Dummy of no analysts following =1) and firms with low institutional
ownership (Dummy of low institutional holding =1) to examine the effect of these conditions
on the firms in our sample. Based on the discussions above, we hypothesize:
Hypothesis 3: Firms with low (no) analysts following and lower institutional ownership have
a higher likelihood of committing financial fraud. However, too much coverage or
concentrated institutional ownership may also induce the same problems.
DATA
The sample of the firms accused of accounting or auditing fraud was obtained from the
SEC’s AAER (Accounting and Auditing Enforcement Release) database. Following Erickson,
Hanlon, and Maydew (2006), firms with alleged violations of SEC laws and accounting
provisions were selected from AAER data. To be eligible for inclusion in the sample, firms
must be publicly listed and data must be available from Compustat, the Center for Research in
Securities Prices (CRSP), EDGAR-pro’s proxy statements, and 10-K.
CEO/Executive perquisite data were hand collected from the firm’s proxy statements
between -3 and -1 years prior to the occurrence of fraud for both fraud firms and their
matched firms. Other compensation variables, such as stock options, salary, and bonuses,
were also collected from the firm’s proxy statements. All the Accounting variables were
downloaded from the Compustat database. Analyst information and institutional ownership
data were downloaded from the I/B/E/S and 13F databases, respectively.
We also create a list of non-fraud firms as control firms which are matched by size and
industry (2-digit SIC codes) in the year prior to the fraud. In total, 74 firm pairs are

17
successfully matched with the full data of top executive compensation, perks, and total assets
in the matching year.
Table 1 Panel A shows a sample of 10 fraud firms and the reason they were accused of
fraud by the SEC. These cases spread over different industries, with cases of fraud including
overstating earnings, violation of GAAP, failed to have effective internal controls, and filing
materially false financial statements. Panel B of Table 1 demonstrates the perk disclosure and
types of perks granted to CEOs by the fraud firms and their matched firms. Only 4 out of 10
fraud firms have disclosed perks, while 7 out of 10 matched samples have disclosed perks,
and all ten have issued financial perks. From Table 1, the negative correlation between issuing
perks and financial fraud can be seen, to a certain degree confirming hypothesis 1.
Table 2 presents the distribution of the AAER fraud cases. Panel A shows that 44% were
restatement cases and 21% issued false financial reports, Panel B lists the year of the fraud
occurrence from 1996 to 2007, and Panel C presents the allocation of these events by industry
(1-digit SIC code).
Insert Table 1 about here
Insert Table 2 about here
METHODOLOGY
Uinvariate Tests
We first conduct the univariate comparisons between the fraud firms and the matched
firms on CEO/executive perks and compensation, corporate governance variables, and firm
characteristics. T-tests and Z-tests are applied to examine the significant differences in means
and medians, respectively.
The Logistic Model on the Likelihood of Fraud

18
Second, the following logistic regression is performed to examine the likelihood of
fraud in relation to Perks, Executive compensation, Corporate Governance, and the controlled
Accounting Variables. The model is constructed as follows by taking data -3 to -1 years prior
to the year of the fraud, as indicated in the AAER report:
it
itititit
ControlinvestorsnalinstitutioanalystsbyMonitoring
CPSonCompensatiPerksFraud
54
3210
& (1)
The following section describes the main variables we use in the model. Appendix A
provides details on variable definitions and source of information.
Fraud:
If Fraud =1, the company has been accused of fraud; if Fraud=0, the company has not
been accused of fraud.
CEO/Executive Perk Variables & Compensation Variables:
Following the concept of Andrews, Linn, and Yi (2009) and Grinstien, Weinbaum, and
Yehuda (2011), CEO and executive perquisites are classified into five categories: (1)
entertainment perks; (2) home and family perks; (3) service perks; (4) financial and severance
perks; and (5) other perks, such as airplane, car and local transportation, medical and health
benefits, and administrative privileges such as the use of a secretary or personal IT support,
and communication expenses.
We then calculate the dollar amount of perks a firm grants to its CEO/ top 5 executives
using the 4 main categories and the total amount of perks. The formulas for perk variables are
as follows:
Total amount of perks
= Entertainment Perks + Home & family Perks + Service Perks+ Financial and Severance

19
Perks + Other Perks (2)
Entertainment Perks =Club Payments+ Vacation Expenses+ Other Personal Benefits;
Home and Family Perks = Personal/Home Security+ Housing Allowances+ Relocation;
Services Perks = Legal Fees+ Financial and Tax Planning Service+ Tax Reimbursements;
Financial and Severance Perks= Financial Perks+ Severance Perks;
We also calculate the total compensation, cash based compensation, and equality based
compensation for CEOs and top 5 executives. We follow the definition of TDC1 in
ExecuComp to calculate the total compensation. Cash based compensation is the aggregated
dollar amount of salary and bonus. Equity based compensation is the aggregated dollar
amount of stock awards and option awards. All relevant information was also obtained from
Proxy Statements.
In addition, we create a measure for a firm’s transparency of perk disclosure by
identifying whether a firm discloses the value of the perks it grants to its CEO/top executives.
A dummy of no perk disclosure is set to 1 if there is no disclosure of perks in a year; 0
otherwise. In the empirical analysis, we examine the effects of perk disclosure, total amount
of perks, and the four main categories of perks given to the CEO and top five executives,
respectively. In each model, we also include the cash based compensation and equity based
compensations of the CEO and top five executives as explanatory variables.
Corporate Governance Variables:
The corporate governance practices we examine include internal and external forces.
For the internal factor, we follow Bebchuk, Cremers, and Peyer (2011) and use CEO pay slice
(CPS) as a proxy for CEO power, which indicates the agency problem of the firm. The
external factors are the monitoring power represented by analysts and institutional investors.
Using hand collected total compensation information of CEOs and top five executives,
we calculate CEO pay slice (CPS) as the share of CEO total compensation to the top five

20
executive total compensation. We calculate total compensation using the definition of TDC1
in ExecuComp.
This paper relies on information of analysts following and institutional ownership to
measure the extent of monitoring power. Two dummy variables are used as proxies for a low
level of monitoring. First, a dummy of no analysts following equals 1 if no analysts provide
earnings forecast information in a year; 0 otherwise. In an unreported test, we also use analyst
recommendation information to form this dummy variable, and the results are qualitatively
the same. Second, a dummy of low level of institutional shareholding is set to 1 if there is no
institutional shareholding reported in 13F; 0 otherwise. According to Thomson-Reuters,
institutional managers with $100 million or more in Assets under management are required to
file a 13F report. Hence, we assume a firm has a low level of institutional shareholding if it
has no shareholding information in a 13F. Further, we calculate two additional variables to
measure the outside monitoring forces: (1) the number of analysts following in a year and (2)
the ratio of aggregate institutional shareholding to a firm’s outstanding shares in the 4th
quarter.
Accounting and Performance Variables:
The accounting variables for this study are: total assets, market capitalization, leverage,
ROAs, annual stock returns (value-adjusted), and market to book ratio. Altman’s Z score is
also calculated to represent a firm’s liquidity proxy.
The Proportional Hazard Survival Model on the Probability of Fraud
The proportional hazard survival model, introduced by Cox (1972), is also adopted in this
study to enhance the robustness of the empirical results of the Logit regression. Cox’s (1972)
hazard model has several advantages. First, in a hazard model, the risk of bankruptcy changes
over time, since the health of any firm is a function of both its age and its most recent

21
financial data. That said, the probability of bankruptcy assigned to a firm using a
single-period model does not vary with time. The hazard model resolves this particular
drawback associated with single-period models by explicitly accounting for time. Second, a
hazard model incorporates time-varying covariates, or explanatory variables, that also change
over time. Unlike single-period models, the hazard model can incorporate macroeconomic
variables that are identical for all firms at a given point in time. Third, hazard models can also
account for potential duration dependence, or the possibility that firm age might be an
important explanatory variable. Accordingly, hazard models provide more efficient
out-of-sample forecasts when the data are either updated or extended. Several researchers
have adopted the linear probability and discrete-choice models, such as the Logit and Probit
model (Meyer and Pifer, 1970). However, Ohlson (1980) and Tam and Kiang (1992) have
proposed applying the neural-net approach to bank failure predictions.
Moreover, the hazard model can be regarded as a binary Logit model that integrates each
firm year as a separate observation. A simple hazard model proposed by Shumway (2001)
incorporates both accounting ratios and market-driven variables to produce out-of-sample
forecasts that are more accurate than single-period models.
Survival Analysis
The time point of financial distress occurrence is defined as T, which is a discrete
random variable T, where T t,....,3,2,1 . The probability density of financial distress
occurrence is defined as );,( xtf . Hence, the survival function of the firm is defined as:
tj
xtTPxjfxtS );|();,(1);,( , (3)
which indicates the probability of no financial distress occurrences before time T.
In addition, the hazard function is defined as

22
);,|();,(
);,();,(
xtTtTP
xtS
xtfxt
(4)
to indicate the probability of financial distress occurrences at time T.
From the survival function and the hazard function the MLE estimation can be derived:
);,();,(1
n
ii
Yii xtSxtL i
(5)
where iY is a dummy Variable; iY =1 is used for distressed firms; iY =0 is used for
non-distressed firms; and X is a time-varying dependent variable.
Shumway (2001) considered the discrete survival model as a multivariate Logit model:
i
i
tji
Yii
n
i
xjFxtFL );,(1);,(1
(6)
where F(t,x;θ) has a upper limit equal to 1; it is not a decreasing cumulative distribution
function but related to time. Therefore, Shumway used to replace F(t,x;θ), making MLE
estimate of the discrete survival function become:
n
i tji
Yii
i
i xjxtL1
);,(1);,(
and
itj
ixjxtS );,(1);,( . (7)
From (6) and (7) we can see that the discrete survival model is equivalent to the
multivariate Logit model. However, Shumway neglected the survival probability of the
sample firms at time it . This paper further modifies the Logit model such that the MLE
estimate of the survival model becomes:

23
n
i tjit
Yiti
Yiti
i
ii xjxtxtL1
1 );,(1;,(1);,( . (8)
(8) takes into consideration the probability of financial distress occurrence at
ii tttt 及 for the sample firms. The hazard function );,( xt under the discrete survival
model is a Logit model:
)(
)(
1);,(
x
x
e
ext
; ( , )
This can be considered to be an accelerated failure-time model (Lancaster 1990).
EMPIRICAL RESULTS AND ANALYSIS
Results of Uinvariate Tests
Table 3 Panel A presents the univariate comparisons of CEO compensation and perks,
corporate governance variables, and firm characteristics between the fraud group and the
matched firms. T-tests and Z-tests are applied to examine the significant differences in means
and medians, respectively. We can see that the fraud firms have a significantly lower amount
of CEO total perks (36.41 thousand for fraud firms and 82.44 thousand for the matched firms)
than matched firms. Further, CEOs in the matched firms received higher financial and
severance perks (8.32 thousands for the fraud firms and 56.08 thousands for the matched
firms). In fact, the amount of financial perquisites is around 23% of the total amount of
perquisites (8.32/36.41) for fraud firms, but in the matched firms, the total amount of
perquisites has a much higher proportion of financial perquisites (56.08/82.44=68%). In
addition, the top five executives in the matched firms also received a higher amount of
perquisites (237.5 thousands for the matched firms and 128.59 thousands for the fraud firms).
Interestingly, both the CEO and the top five executives received a higher amount of the equity

24
based compensation in the fraud firms than the matched firms (0.58 million for fraud firms'
CEOs and 0.32 million for the matched firms' CEOs; 1.26 million for the fraud firms'
executives and 0.79 million for the matched firms' executives). This preliminary result
confirms our first hypothesis that there is a negative relationship between the reported
perquisites in proxy statements and the likelihood of fraud. The fact that firms offer a higher
amount of perquisites may imply an effective incentive scheme, which hence should limit the
desire to commit financial fraud. Conversely, there is a higher likelihood of financial fraud in
the firms that offer a higher amount of equity based (restricted stocks and options)
compensation, which is consistent with previous studies.
The univariate analysis further demonstrates that CEOs in the fraud firms obtained a
higher CEO Pay Slice (CPS) in comparison to the matched firm CEOs (37% to 33%),
indicating that CEOs in fraud firms were given more power than CEOs in the matched firms.
There are also more fraud firms that did not have an analyst following them than matched
firms (44% to 36%). In addition, a significantly higher percentage of fraud firms had a lower
level of institutional holding than matched firms (33% compared to 25%). The results of the
corporate governance variables show that fraud firms experience severe agency problems, as
assessed by the CPS introduced by Bebchuk, Cremers, and Peyer (2011). Furthermore, firms
with weaker external monitoring (measured by dummies of no analysts following and low
level of institutional ownership) are also positively linked to fraud. These findings confirm
our second hypothesis that Firms with higher CPS have a higher likelihood of committing
financial fraud.
Furthermore, the results of dummies of no analysts following and low institutional
ownership both show that the probability that fraud firms either have no analysts following or
low institutional ownership is significantly higher than that of matched firms (0.44 to 0. 36 for
the dummy of no analysts following; 0.33 to 0.25 for the dummy of low institutional
ownership). This finding confirms our hypothesis 3, that Firms with lower (no) analysts
25
following and institutional ownership have a higher likelihood of committing financial
fraud.
Panel B of Table 3 reports the results of the univariate analysis for the 56 AAER reports,
which specify the person who committed the fraud. Although the guilty party has been named
in 56 of the fraud cases in our sample, the person who committed the fraud is not necessarily
the CEO or one of the top five executives. This not only demonstrates that the fraud may not
have been committed by a specific person, but also, to some extent, it represents a high
likelihood of agency problems. Overall, the results are consistent with Panel A of Table 3,
which shows that CEOs and executives in matched firms received a higher amount of
perquisites (total amount of perks and financial and severance perks), while CEOs and
executives in fraud firms received a higher amount of equity based compensation. Moreover,
the CPS is higher for fraud firms.
Insert Table 3 about here
Results of Logit and Survival Models
Examining CEO Perquisites
Panel A of Table 4 presents results from the Logit model for the likelihood of fraud
associated with CEO perquisites, compensation, and corporate governance. The dummy of no
perk disclosure is positively linked with fraud (0.47), indicating that firms that are less
transparent in perquisite disclosure exhibit a certain degree of agency problem and are more
likely to experience fraud. Both the total amount of perquisites and the amount of financial
perks are significantly and negatively related to the likelihood of fraud (-0.04 and -0.10),
which not only confirms the fact that fraud firms could not afford to offer too many
perquisites to their CEOs, but also validates hypothesis 1. Furthermore, the coefficient of CPS
is significantly and positively associated with the likelihood of financial fraud (1.91, 2.16,

26
2.28, 2.04), which shows that CEOs in fraud firms are able to extract more rent than those in
matched firms. This also verifies our argument that firms with weaker corporate governance
are more likely to be linked to frauds. Finally, variables representing a low level of monitoring
(i.e., the dummies of no analysts following and low institutional ownership) are both
positively associated with the likelihood of frauds (i.e. 0.86 and 0.88 for model 1.), which also
validates our hypothesis that firms with weaker external monitoring have a higher likelihood
of financial fraud, once again confirming hypothesis 2.
Panel B of Table 4 shows the results of the Survival model for CEO perquisites and
frauds. There is a negative association between CEO total perks/CEO financial and severance
perks and the likelihood of a fraud (-0.03, -0.06 respectively). Interestingly, for those firms
that have analysts following, the greater the amount of analysts following, the higher the
probability of committing financial fraud. This result confirms hypothesis 3.
Insert Table 4 about here
Table 5 presents results of Logit and Survival model by classifying CEO perquisites
items into No Disclosure/offering Dummy (=1) for Dummies of No CEO total perks,
entertainment perks, home and family perks, service perks, and financial and severance perks,
instead of applying the log of the perquisite amount as in previous tables. Results show that
dummies of No CEO total perks and No CEO financial and severance perks are positively
linked with the likelihood of firm experiencing fraud (0.50 and 0.70 for model (3)).
Nevertheless, there is a positive relation between the offering of service perks and fraud. This
finding is consistent with Table 4 and hypothesis 1. The Service perks variable is defined as
the sum of legal fees, tax services, and tax reimbursement to firm CEO. The payment of
service perks may imply that the firm’s CEO may engage in lawsuits, or is offered a large
salary (resulting in large tax payments) This resembles an ex-post disbursement for the CEO’s
27
legal cases and regulation compensation, rather than an ex-ante feature of an incentive scheme.
Therefore, there is no contradiction in a CEO paying high legal fees or having to make large
tax payments and a positive link with the likelihood of financial fraud. Panel B of Table 5
shows the dummy of no total perks (0.33, 0.20) is positive and significant, while the no
financial perks dummy is also positive and significant (0.57, 0.49), which again supports the
argument that perquisites are a positive incentive tool.
Insert Table 5 about here
Examining Top 5 Executive Perquisites
Panels A and B of Table 6 present the results of the Logit and Survival models between
the top 5 executive perquisites and financial fraud, respectively. The results of the Logit
model in Panel A again confirm that there is a positive relation between no perk disclosure
and the likelihood of financial fraud (0.51). Furthermore, there is a negative relation between
executive total perks and the likelihood of committing fraud (-0.04). Our empirical findings
also show that there is positive relation between executive equity based compensation and the
likelihood of financial fraud (0.05). Finally, CPS is also positively related to the likelihood of
financial fraud (1.71, 1.73, 1.82, 1.76). We also find that there is a positive association
between the dummy of no institutional ownership/dummy of no analysts following, and the
likelihood of financial fraud (0.87 and 0.80 for Model (1)). Again, these results confirm
hypothesis 3.
Second, the relationship between institutional shareholding and the likelihood of
financial fraud is positive. We contend that the reason is as stated in hypothesis 3, that Firms
with lower (no) analysts following and institutional ownership have a higher likelihood of
committing financial fraud. However, too much coverage or concentrated institutional
ownership may also induce the same problems.
In general, the results of the association between CEO/Executive perks and the

28
likelihood of financial fraud in Tables 4-6 confirm our hypotheses 1 throughout 3. However,
the association between CEO perquisites and the likelihood of fraud is more pronounced. This
is plausible since firm CEOs are generally believed to have higher decision making power
than other executives.
Insert Table 6 about here
CEO Perquisites vs. Top 5 Executive Perquisites
In Table 7 we put both CEO and executive perquisites into the same regressions and a
significant and negative relation between CEO financial and severance perks and frauds
(-0.10, -0.07) was still observed. Furthermore, a positive relationship was discovered between
CPS and institutional holding, while the dummies of no analysts following and low
institutional holding remained significantly positive (2.72, 1.43, 0.95, and 0.81), indicating
that our previous empirical findings are robust.
Insert Table 7 about here
The 56 firms with disclosure of fraud executive name and their matching firms
In Panels A and B of Table 8, we further conduct a robustness test by only including those
frauds we are able to identify, such as a person’s name in the AAER report, even though the
person named may not necessarily be the CEO or one of the top five executives. Again, we
find that, in addition to our previous findings, there is a positive relation between CEO
services perks and the likelihood of financial fraud (0.12, 0.27) in the Logit model. Our
definition of Services Perks here is the sum of legal, financial, and tax services fees and tax
reimbursement. We infer that this positive relationship may be due to the amount that a firm
pays for the legal fees of firm executives who exhibit a positive sign of no perks disclosed and

29
a negative sign of more financial perks being linked with the likelihood of committing to
fraud (0.71 and -0.16 for model 1), which confirms hypothesis 1. The positive sign of the
dummy of low institutional investor ownership again confirms hypothesis 3. Furthermore,
results of the Panel B in Table 8 again confirm the negative sign of CEO financial perks.
Insert Table 8 about here
Methodological issue 1: collinearity between corporate governance and perk variables
There is a concern that corporate governance and perks may be related. We conduct the
following two-stage regressions to address this concern. The first stage runs a regression of
corporate governance variables on perks, treating the residual perks as unrelated to corporate
governance variables. The second stage then incorporates the residual perks into the original
model to see whether the results of perks remain.
First stage regression:
it
itit
ititit
ngshareholdialInstitutioofRatio
followinganalystofNumberownershipnalinstitutiolowofDummy
followinganalystnoofDummyCPSPerks
5
43
210
(9)
Second stage regression:
it
itititit
ControlinvestorsnalinstitutioanalystsbyMonitoring
CPSonCompensatiperkssidualFraud
54
3210
&
Re
(10)
To further enhance the robustness of the empirical analysis, in Panel A of Table 9 we first
attempt to extract the residual of CEO perks regressed on key components of governance
variables, to avoid the collinearity between corporate governance and perk variables.
Residuals from Panel A regressions are then put into the Logistic model in Panel B. The
results of Panel B are consistent with the above findings, again showing a negative relation

30
between total perks/CEO financial and severance perks and fraud likelihood (-0.04 and -0.09).
The empirical findings of the Survival Model in stage two also exhibit the same results
(Residual Log CEO total perks=-0.03, Residual Log CEO financial & severance perks=-0.06).
This finding is consistent with hypothesis 1. Further, the empirical results for the CPS are
again positive, which is consistent with hypothesis 2. Finally, the positive signs of the dummy
of no analysts and the dummy of low institutional ownership confirms hypothesis 3.
Insert Table 9 about here
Methodological issue 2: possible endogeneity issue
It is also possible that perks and the likelihood of firms committing financial fraud could
be simultaneously determined. Hence, we conduct another two-stage regression to address
this issue. The first stage runs a regression on determinants of perks to obtain the predicted
value of perks. The second stage then incorporates the predicted perks into the original model
to see whether the results of perks remain.
First stage regression:
it
ititit
investorsnalinstitutioanalystsbyMonitoring
CPSiablesaccountingePerformancPerks
&
var&
3
210 (11)
Second stage regression:
itit
ititit
ControlinvestorsnalinstitutioanalystsbyMonitoringCPS
onCompensatiPerksedictedFraud
543
210
&
Pr
(12)
In Table 10, a two stage regression is conducted by first estimating the determinants of
perquisite amounts. In the second stage, the predicted amount of perquisites is embedded into
the Logit and the Survival regression to examine the association between the likelihood of
fraud and the predicted amount of perks. Again, negative signs are obtained for predicted
31
amount of total perks and financial perks (-0.35 and -0.84), which confirms hypothesis 1.
Further, positive signs for CPS are again generated for all models, which is consistent with
hypothesis 2. Finally, the dummy of no analysts following and higher amount of institutional
ownership are associated with the likelihood of fraud, which to a certain extent, is consistent
with our hypothesis 3. Results in Panel C of Table 10 also exhibited similar findings.
Insert Table 10 about here
CONCLUSION
This paper investigates whether executive perquisites and several important agency cost
and monitoring power indicators are crucial factors in explaining the likelihood financial
fraud occurring at a firm. The literature on the role and impact of these benefits are
inconclusive, as some scholars argue that perquisites represent executives attempting to
consume firm resources for personal benefits, while others contend that perks optimize
compensation design. By analyzing the American Accounting and Enforcement Report issued
by the SEC, where firms are accused of committing financial fraud, we investigate the role of
perquisites and their association with the likelihood of financial fraud.
We show that a firm is more likely to experience fraud if it offers a smaller amount of
perks to CEOs/top executives than matched firms. This effect is especially strong in the case
of financial and severance perks. Our finding helps alleviate concerns from relevant
stakeholders such as policy makers and market participants that CEO/executive perquisites
may be harmful to firm value. In fact perquisites serve as a complement to firm executives
and hence have a positive impact on compensation contracts. This finding echoes previous
research on the incentive role of perks by Fama (1980), Rajan and Wulf (2006) and Marino
and Z´abojn´ık (2008). Our empirical results also demonstrate a different outcome than
previous research on the linkage between equity incentive schemes and the likelihood of

32
financial fraud. We infer that this is due to the differing nature of stock options and perks.
Though market participants and scholars are aware that excess equity compensation may
induce higher likelihood of financial fraud such as inflated earnings or earnings restatements,
perquisites appear to be more than purely agency costs. Instead, they appear to have a positive
incentive effect. With the increasing disclosure transparency in perquisite reporting, we
believe our study helps to advance understanding of the function of this particular form of
executive compensation for policy makers, scholars, and investors.
Furthermore, our results also contribute to the understanding of the some crucial
governance and monitoring factors in association with the likelihood of fraud. The internal
governance quality is assessed by a measure of CEO power- CEO pay slice (CPS). According
to our empirical results, the likelihood of financial fraud is higher when a firm exhibits a
higher potential agency cost (CPS). Furthermore, firms with no analysts following and low
institutional ownership also have a higher likelihood of committing financial fraud. Overall,
our results suggest that granting financial and severance perks to CEOs (and top executives),
giving lower power to CEOs, and maintaining adequate level of monitoring power might help
to alleviate problems of financial fraud.

33
References
Adithipyangkul, Pattarin, Ilan Alon, and Tianyu Zhang (2011), “Executive perks:
Compensation and corporate performance in China,” Asia Pacific Journal of
Management, 28(2), 401-425.
Agrawal, Anup and Sahiba Chadha (2005), “Corporate Governance and Accounting Scandals,”
Journal of Law and Economics, 48 (2), 371-406.
Altman, Edward I. (1968) “Discriminant Analysis and the Prediction of Corporate
Bankruptcy,” The Journal of Finance 23 (4), 589-609.
Andrews, Angela, Scott C. Linn, and Han Yi (2009), “Corporate Governance and Executive
Perquisites: Evidence from the New SEC Disclosure Rules,” Unpublished working
paper, Wayne State University.
Ayers, Benjamin C., and Robert N. Freeman (2003), “Evidence that Analyst Following and
Institutional Ownership Accelerate the Pricing of Future Earnings,” Review of
Accounting Studies, 8, 47-67.
Barua, Abhijit, Joseph Legoria, and Jacquelyn Sue Moffitt (2006), “Accruals Management to
Achieve Earnings Benchmarks: A Comparison of Pre-managed Profit and Loss Firms,”
Journal of Business Finance & Accounting, 33(5) & (6), 653-670.
Basu, Sudipta, Lee-Seok Hwang, Toshiaki Mitsudome, and Joseph Weintrop (2007),
“Corporate Governance, Top Executive Compensation and Firm Performance in Japan,”
Pacific-Basin Finance Journal, 15, 56-79.
Bebchuk, Lucian Arye, K.J. Martijn Cremers, and Urs C. Peyer (2011), “The CEO Pay Slice,”
Journal of Financial Economics, 102, 199-221.
Becker, Gary S. (1968), “Crime and Punishment: an Economic Approach,” Journal of
Political Economy, 76, 169-217.
Boubaker, Sabri and Florence Labégorre (2008), “Ownership Structure, Corporate
Governance and Analyst Following: A Study of French Listed Firms, Journal of
Banking & Finance, 32, 961-976.
Brickley, James A., Sanjai Bhagat, and Ronald C. Lease (1985), “The Impact of Long-Range
Managerial Compensation Plans on Shareholder Wealth,” Journal of Accounting and
Economics, 7, 115-29.
Bruner, David, Michael McKee, and Rudy Santore (2008), “Hand in the Cookie Jar: An
Experimental Investigation of Equity-Based Compensation and Managerial Fraud,”
Southern Economic Journal, 75(1), 261-278.
Burns, Natasha and Simi Kedia (2006), “The Impact of Performance-based Compensation on
Misreporting” Journal of Financial Economics, 79, 35-67.
Burns, Natasha, Simi Kedia, and Marc Lipson (2010), “Institutional Ownership and
Monitoring: Evidence from Financial Misreporting,” Journal of Corporate Finance, 16,
443-455.
34
Bushee, B. (1998), “The Influence of Institutional Investors on Myopic R&D Investment
Behavior,” The Accounting Review, 73(3), 305-333.
Chesney, Marc and Rajna Gibson (2008), “Stock Options and Managers' Incentives to Cheat,”
Review of Derivatives Research, 11, 41-59.
Core, John and Wayne Guay (1999), “The Use Equity Grants to Manage Optimal Equity
Incentive Levels,” Journal of Accounting and Economics, 28, 151-184.
Core, John E., Wayne Guay, and David F. Larcker (2008), “The Power of the Pen and
Executive Compensation,” Journal of Financial Economics, 88, 1-25.
Cornett, Marcia Millon, Alan J. Marcus, and Hassan Tehranian (2008), “Corporate
Governance and Pay-for-performance: The Impact of Earnings Management,” Journal
of Financial Economics, 87, 357-373.
Cornett, Marcia Millon, Jamie John McNutt, and Hassan Tehranian (2009), “Corporate
Governance and Earnings Management at Large U.S. Bank Holding Companies,”
Journal of Corporate Finance, 15, 412-430.
Cox, D. R. (1972), “Regression Models and Life-tables,” Journal of the Royal Statistical
Society, Series B, 34, 187-220.
Denis, David J., Paul Hanouna, and Atulya Sarin (2006), “Is There a Dark Side to Incentive
Compensation?” Journal of Corporate Finance, 12, 467-488.
Derrien, François and Ambrus Kecskés (2013), “The Real Effects of Financial Shocks:
Evidence from Exogenous Changes in Analyst Coverage,” Journal of Finance, 68(4),
1407-1440.
Dyck, Alexander, Adair Morse, and Luigi Zingales (2010), “Who Blows the Whistle on
Corporate Fraud?” Journal of Finance 65, 2213-2253.
Elyasiani, Elyas and Jingyu Jia (2010), “Distribution of Institutional Ownership and
Corporate Firm Performance,” Journal of Banking & Finance, 34, 606-620.
Erickson, Merle, Michelle Hanlon, and Edward L. Maydew (2006), “Is There a Link between
Executive Equity Incentives and Accounting Fraud?” Journal of Accounting Research,
44.
Fama, Eugene F. (1980), “Agency Problems and the Theory of the Firm,” The Journal of
Political Economy, 88, 288-307.
Faulkender, Michael, Dalida Kadyrzhanova, N. Prabhala, and Lemma Senbet (2010),
“Executive Compensation: An Overview of Research on Corporate Practices and
Proposed Reforms,” Journal of Applied Corpoarte Finance, 22, 107-108.
Ferdinand, A. Gul, Louis T.W. Cheng, and T.Y. Leung (2011), “Perks and the Informativeness
of Stock Prices in the Chinese Market,” Journal of Corporate Finance, 17, 1410–1429.
Feng, Mei, Weili Ge, Shuqing Luo, and Terry Shevlin (2011), “Why do CFOs Become
Involved in Material Accounting Manipulations?” Journal of Accounting and
Economics, 51, 21–36.

35
Frye, Melissa B. (2004), “Equity-based Compensation for Employees: Firm Performance and
Determinants,” Journal of Financial Research, 27, 31-54.
Goldman, Eitan and Steve L. Slezak (2006), “An Equilibrium Model of Incentive Contracts in
the Presence of Information Manipulation,” Journal of Financial Economics, 80,
603-626.
Grinstein, Yaniv, David Weinbaum, and Nir Yehuda (2011), “The Economic Consequences of
Perk Disclosure,” Unpublished working paper, Cornell University. Johnson School
Research Paper Series #06-11.
Grossman, Sanford J. and Oliver D. Hart (1980), “Takeover Bids, the Free-Rider Problem,
and the Theory of the Corporation,” The Bell Journal of Economics, 11, 42–64.
Hanlon, Michelle, Shivaram Rajgopal, and Terry Shevlin (2003), “Are Executive Stock
Options Associated with Future Earnings?” Journal of Accounting and Economics, 36,
3-43.
Harris, Jared D. (2008), “Financial Misrepresentation: Antecedents and Performance Effects,”
Business & Society, 47-3, 390-401.
Hartzell, Jay C. and Laura T. Starks (2003), “Institutional Investors and Executive
Compensation,” Journal of Finance, 58(6), 2351-2374.
He, Jie (Jack) and Xuan Tian (2013), “The Dark Side of Analyst Coverage: The Case of
Innovation,” Journal of Financial Economics, 109, 856-878.
Hillgeist, Stephen A. and Fernando Peñalva (2003), “Stock Option Incentives and Firm
Performance,” Unpublished working paper, Northwestern University.
Jensen, Michael C. and Willian H. Meckling (1976), “The Theory of the Firm: Managerial
Behavior, Agency Costs and Ownership Structure,” Journal of Financial Economics, 3,
305-360.
Jiraporn, Pornsit, Pandej Chintrakarn, and Yixin Liu (2012), “Capital Structure, CEO
Dominance, and Corporate Performance,” Journal of Financial Service Research, 42,
139-158.
Johnson, Shane A., Harley E. Ryan Jr., and Yisong S. Tian (2009), “Managerial Incentives and
Corporate Fraud: The Source of Incentives Matter,” Review of Finance, 13, 115-145.
Lewellyn, Krista B. and Maureen I. Muller-Kahle (2012), “CEO Power and Risk Taking:
Evidence from the Subprime Lending Industry,” Corporate Governance: An
International Review, 20, 289-307.
Liu, Yixin and Pornsit Jiraporn (2010), “The Effect of CEO Power on Bond Ratings and
Yields,” Journal of Empirical Finance, 17, 744-762.
Marino, Anthony M. and Ján Zábojník (2008), “Work-Related Perks, Agency Problems, and
Optimal Incentive Contracts,” The RAND Journal of Economics, 39(2), 565-585.
Mehran, Hamid (1995), “Executive Compensation Structure, Ownership, and Firm
Performance,” Journal of Financial Economics, 38, 163-184.

36
Meyer, Paul A. and Howard W. Pifer (1970), “Prediction of Bank Failures,” Journal of
Finance, 25, 853-68.
Morgan, Angela G. and Annette B. Poulsen (2001), “Linking Pay to Performance-
Compensation Proposals in the S&P 500,” Journal of Financial Economics, 62,
489-523.
Ohlson, James A., (1980), “Financial Ratios and the Probabilistic Prediction of Bankruptcy,”
Journal of Accounting Research, 18, 109-31.
Parrino, Robert, Richard W. Sias, and Laura T. Starks (2003), “Voting With Their Feet:
Institutional Ownership Changes around Forced CEO Turnover,” Journal of Financial
Economics, 68, 3-46.
Peng, Lin and Ailsa Röell (2008), “Executive Pay and Shareholder Litigation,” Review of
Finance, 12, 141-184.
Persons, Obeua S. (2006), “The Effects of Fraud and Lawsuit Revelation on U.S. Executive
Turnover and Compensation,” Journal of Business Ethics, 64, 405-419.
Rajan, Raghuram G. and Julie Wulf (2006), “Are Perks Purely Managerial Excess?” Journal
of Financial Economics, 79, 1-33.
Rosen, S. (2000), ” Does the Compensation of Pay Matter?” In W.T. Alpert and S.A.
Woodbury, eds., Employee Benefits and Labor Markets in Canada and the United States.
Kalamazoo, Mich.: W.E. Upjohn Institute for Employment Research.
Shumway, Tyler (2001), “Forecasting Bankruptcy More Accurately: A Sample Hazard Model,”
The Journal of Business, 74, 101-24.
Smith, Clifford W. and Rene M. Stulz (1985), “The Determinants of Firms' Hedging Policies,”
The Journal of Financial and Quantitative Analysis, 20, 391-405.
Su, De-gui and Tong-ying Liang (2013), “Perks, Research and Development Intensity and
Corporate Performance,” Management Science and Engineering (ICMSE), 877 – 882.
Tam, Kar Yan and Melody Y. Kiang (1992), “Managerial Applications of Neural Networks:
The Case of Bank,” Management Science, 38, 926-47.
Voßmerba ̈umer, Jan (2013), “Incentive Effects and the Income Tax Treatment of
Employer-provided Workplace Benefits,” Review of Managerial Science, 7(1), 61-84.
Yermack, David (1995), “Do Corporations Award CEO Stock Options Effectively?” Journal
of Financial Economics, 39, 237-269.
Yermack, David (2006), “Flights of Fancy: Corporate Jets, CEO Perquisites, and Inferior
Shareholder Returns”, Journal of Financial Economics 80, 211-242.
Yu, Fang (2008), “Analyst Coverage and Earnings Management,” Journal of Financial
Economics, 88, 245-271.

37
Appendix A. Variable definitions and data sources
Variables Definition and source of information
CEO and Top 5 Executive Perks Dummy of no perk disclosure We manually check a firm's proxy statement to see whether firms report perks. This variable is set to 1 if a
firm does not report or grant perks; 0 otherwise. Data source: Proxy Statements from SEC website.
CEO total perks /
Top5EXE total perks ($000s)
The aggregated dollar amount of the following 5 types of perks a firm grants to its CEO/top 5 executives: (1) entertainment perks, (2) home & family perks, (3) service perks, (4) financial & severance perks, (5) other perks, such as airplane, car & local transportation, medical & health benefits, and administrative privileges such as the use of secretary or personal IT support, or communication expenses. Data source: Hand-collected from proxy statements.
CEO entertainment perks/ Top5EXE entertainment perks($000s)
The aggregated dollar amount of perks a firm grants to its CEO/top 5 executives for entertainment expenses and personal benefits, including club payments, vacation expenses, and other personal benefits. Data source: Hand-collected from proxy statement.
CEO home & family perks / Top5EXE home & family perks ($000s)
The aggregated dollar amount of perks related to home & family a firm grants to its CEO/top 5 executives, such as personal and home security, housing allowance, and moving and relocation expenses. Data source: Hand-collected from proxy statements.
CEO service perks/ Top5EXE service perks ($000s)
The aggregated dollar amount of perks a firm offers as payments for its CEO/top 5 executives on legal fees, services on financial & tax planning, and tax reimbursements. Data source: Hand-collected from proxy statements.
CEO financial & severance perks / Top5EXE financial & severance perks ($000s)
The aggregated dollar amount of financial & severance perks a firm offers as payments for its CEO/top 5 executives. Financial perks include personal loans & interest payments, donation and gifts to a charity /other entities, or a discretionary cash allowance for an executive. Severance perks include any payment the firm promises to pay an executive when the employment relationship terminates. Data source: Hand-collected from proxy statements.
CEO & Top 5 Executive Compensation CEO total compensation (TDC1) /Top5EXE total compensation (TDC1) ($mil)
We follow the definition of TDC1 in ExecuComp to calculate this variable. TDC1 includes salary, bonus, stock awards, option awards, long-term incentive plans, and other annual compensation such as perquisites and other personal benefits (including termination or change-in-control payments, 401K plans, etc). Data source: Hand-collected from proxy statements.
CEO cash based compensation / Top5EXE cash based compensation ($mil)
The aggregated dollar amount of salary and bonus a firm grants its CEO/top 5 executives. Data source: Hand-collected from proxy statements.

38
Variables Definition and source of information
CEO equity based compensation / Top5EXE equity based compensation ($mil)
The aggregated dollar amount of stock awards and option awards a firm grants its CEO/ top 5 executives. Data source: Hand-collected from proxy statements.
Corporate Governance CEO pay slice (CPS) Following Bebchuk, Cremers, and Peyer (2011), CPS is the fraction of the total compensation (TDC1) to the
group of top five executives that goes to a CEO. Data source: Hand-collected from proxy statements.
Dummy of no analysts following This variable is set to 1 if no analysts provide earnings forecast information in a year; 0 otherwise. Data source: IBES.
Dummy of low institutional ownership This variable is set to 1 if there is no institutional shareholding reported in 13F; 0 otherwise. According to the Thomson-Reuters, institutional managers with $100 million or more in Assets under management are required to file a 13F report. Hence, we assume a firm has low level of institutional shareholding if it has no shareholding information in its 13F. Data source: 13F.
Number of analysts following The number of analysts providing earnings forecasts for a firm in a year. Data source: IBES.
Institutional share holding at Q4 The ratio of aggregate institutional shareholding to a firm’s outstanding shares in the 4th quarter. Data source: 13F.
Performance & Accounting Information Z_SCORE The Altman’s (1968) Z score = 0.012*Working Capital/Total Assets + 0.014* Retained Earnings/Total Assets
+ 0.033*Earnings Before Interest and Taxes/Total Assets + 0.006*Market Value of Equity/Book Value of Total Liabilities + 0.999*Sales/Total Assets. Data source: Compustat.
ROA Return on Assets = Net Income/Total Assets. Data source: Compustat.
Tobin's q Tobin’s Q = (Total Assets - Stockholder's Equity + Common Shares Outstanding*Price)/Total Assets. Data source: Compustat.
One-year stock returns - value adj. We use monthly stock return data to calculate the value-weighted one-year stock return. Data source: CRSP.
Total assets ($ bn) Total assets of a firm, obtained from Compustat.
Market value of equity ($ bn) Use the following formula: Common Shares Outstanding * Price. Data source: Compustat.
Market to book value Use the following formula: (Common Shares Outstanding * Price)/Total Common Equity. Data source: Compustat.

39
Table 1 Examples of Fraud Firms and Perks Granted to CEOs Panel A presents 10 firms which were found guilty of financial fraud. For each firm, we report the fraud year, and the description of the fraud, obtained from the SEC’s Accounting and Auditing Enforcement Release (AAER) reports. Panel B shows type of perks granted to CEOs for these 10 fraud firms and their matching firms in the year prior to the fraud, collected from the proxy statements. Following Andrews, Linn, and Yi (2009) and Grinstein, Weinbaum, and Yehuda (2011), we identify whether firms disclose perks and also group perks into 4 main types, including entertainment perks, home and family perks, services perks, and financial and severance perks.
Panel A. Fraud firm examples
Company Name SIC Code Fraud Year Fraud Description from SEC AAER
AEROSONIC CORP 3812 1999-2002 Create fraudulent inventory entries and improper revenue recognition, in violation of GAAP
ANICOM INC 5063 1998-2000 Improper earnings management techniques that inflated Anicom's revenues
ASHLAND INC 5160 1999-2001 Ashland materially understated its environmental reserve and overstated its net income in annual and quarterly reports filed from 1999 to 2001.
CARDINAL HEALTH INC 5122 2000-2004 Fraudulent earnings and revenue management scheme to inflate Cardinal's publicly reported operating revenue, earnings and growth trends
CON-WAY INC 4210 2000-2003 Involves Con-way's violations of the books and records, and internal control provisions of the Foreign Corrupt Practices Act (FCPA)
DYNEGY INC 1311 2001 Engaged in securities fraud in connection with its disclosures and accounting for Alpha
HBO & CO 7373 1997-1998 Recognize revenue on transactions that failed to comply with GAAP
INTEGRATED ELECTRICAL SVCS 1731 2003-2004 Failed to properly disclose material loss contingencies related to its accounts receivable
MCAFEE INC 7372 1998-2000 Financial fraud/overstated its revenues and earnings
NETOPIA INC 3576 2002-2004 Engaged in actions that resulted in Netopia filing materially false financial statements
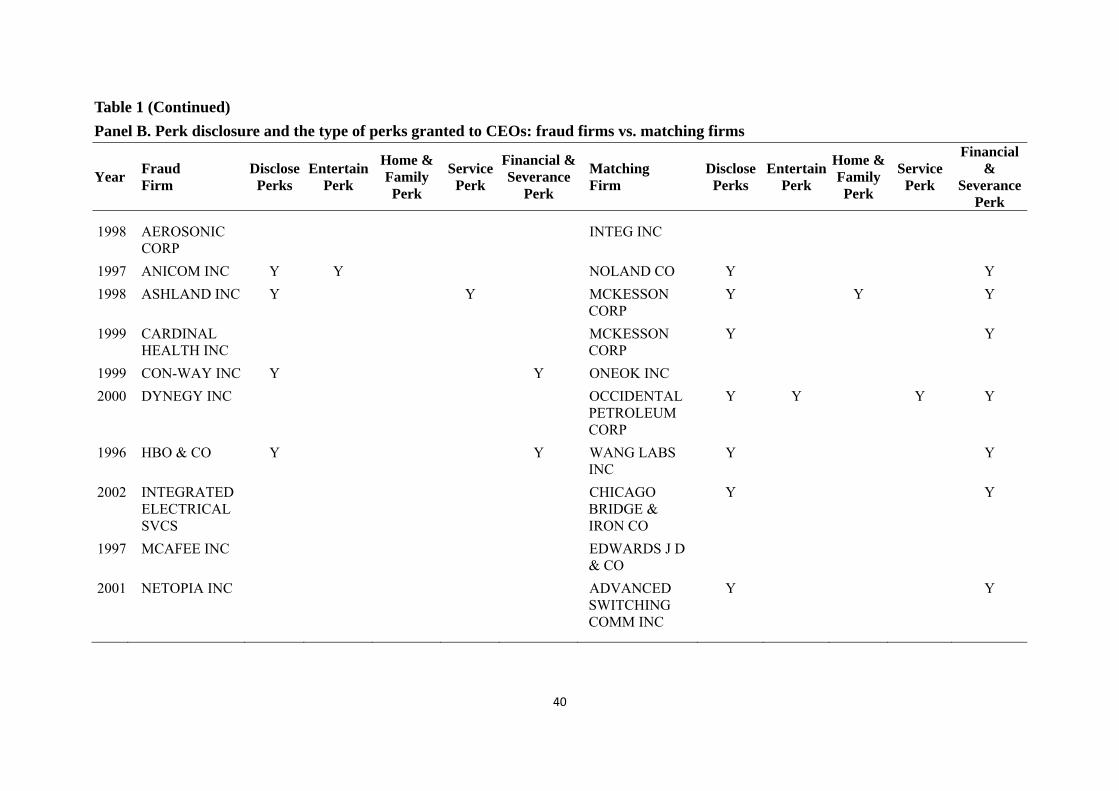
40
Table 1 (Continued)
Panel B. Perk disclosure and the type of perks granted to CEOs: fraud firms vs. matching firms
Year Fraud Firm
Disclose Perks
Entertain Perk
Home & Family Perk
Service Perk
Financial & Severance
Perk
Matching Firm
Disclose Perks
Entertain Perk
Home &Family Perk
Service Perk
Financial &
Severance Perk
1998 AEROSONIC CORP
INTEG INC
1997 ANICOM INC Y Y NOLAND CO Y Y
1998 ASHLAND INC Y Y MCKESSON CORP
Y Y Y
1999 CARDINAL HEALTH INC
MCKESSON CORP
Y Y
1999 CON-WAY INC Y Y ONEOK INC
2000 DYNEGY INC OCCIDENTAL PETROLEUM CORP
Y Y Y Y
1996 HBO & CO Y Y WANG LABS INC
Y Y
2002 INTEGRATED ELECTRICAL SVCS
CHICAGO BRIDGE & IRON CO
Y Y
1997 MCAFEE INC EDWARDS J D & CO
2001 NETOPIA INC ADVANCED SWITCHING COMM INC
Y Y
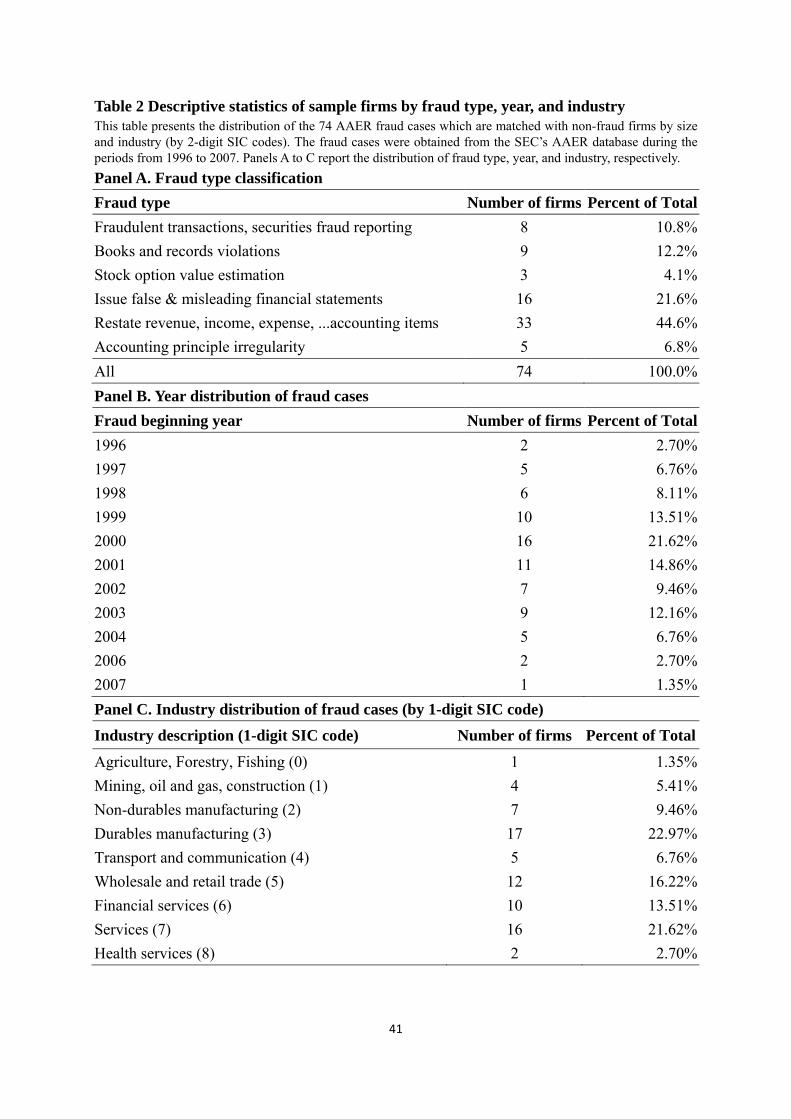
41
Table 2 Descriptive statistics of sample firms by fraud type, year, and industry This table presents the distribution of the 74 AAER fraud cases which are matched with non-fraud firms by size and industry (by 2-digit SIC codes). The fraud cases were obtained from the SEC’s AAER database during the periods from 1996 to 2007. Panels A to C report the distribution of fraud type, year, and industry, respectively.
Panel A. Fraud type classification
Fraud type Number of firms Percent of Total
Fraudulent transactions, securities fraud reporting 8 10.8%
Books and records violations 9 12.2%
Stock option value estimation 3 4.1%
Issue false & misleading financial statements 16 21.6%
Restate revenue, income, expense, ...accounting items 33 44.6%
Accounting principle irregularity 5 6.8%
All 74 100.0%
Panel B. Year distribution of fraud cases
Fraud beginning year Number of firms Percent of Total
1996 2 2.70%
1997 5 6.76%
1998 6 8.11%
1999 10 13.51%
2000 16 21.62%
2001 11 14.86%
2002 7 9.46%
2003 9 12.16%
2004 5 6.76%
2006 2 2.70%
2007 1 1.35%
Panel C. Industry distribution of fraud cases (by 1-digit SIC code)
Industry description (1-digit SIC code) Number of firms Percent of Total
Agriculture, Forestry, Fishing (0) 1 1.35%
Mining, oil and gas, construction (1) 4 5.41%
Non-durables manufacturing (2) 7 9.46%
Durables manufacturing (3) 17 22.97%
Transport and communication (4) 5 6.76%
Wholesale and retail trade (5) 12 16.22%
Financial services (6) 10 13.51%
Services (7) 16 21.62%
Health services (8) 2 2.70%

42
Table 3 Univariate tests of fraud vs. matching firms This table reports univariate comparisons between the fraud group and the matched firms on CEO/executive perks and compensation, corporate governance variables, and firm characteristics during the 3 years before the fraud occurrence. Panel A reports the results of the 74 pairs. Panel B reports the results for 56 AAER reports, which specify the person who committed the fraud. Dummy of no perk disclosure is set to 1 if there is no disclosure of perks in a year; 0 otherwise. CEO pay slice (CPS) is the share of CEO total compensation to the total compensation of the top five executives. Significant differences between fraud and matching firms are indicated along means (using t-tests) and medians (using Wilcoxon tests) of matching firms. See Appendix A for details of variable definitions and data sources. *, **, *** Significant at the 10, 5, and 1 percent levels, respectively, for a two-tailed test.
Panel A. 74 Pairs: whole sample
Fraud Firms (n=191)
Matching Firms (n=202)
Mean Median Mean Median
CEO & Top 5 Executive Perks Dummy of no perk disclosure 0.43 0.00 0.36 0.00 CEO total amount of perks ($000s) 36.41 0.00 82.44 * 0.43 CEO entertainment perks ($000s) 0.82 0.00 5.88 0.00 CEO home and family perks ($000s) 11.33 0.00 3.19 0.00 CEO services perks ($000s) 6.40 0.00 9.65 0.00 CEO financial and severance perks($000s) 8.32 0.00 56.08 * 0.00 **
Top5EXE total amount of perks ($000s) 128.59 11.06 237.50 ** 15.12 Top5EXE entertainment perks ($000s) 2.62 0.00 9.19 0.00 Top5EXE home and family perks ($000s) 37.02 0.00 22.76 0.00 Top5EXE services perks ($000s) 12.45 0.00 14.57 0.00 Top5EXE financial and severance perks($000s) 51.08 0.00 168.01 ** 0.00 **
CEO & Top 5 Executive Compensation
CEO total compensation (TDC1) ($mil) 1.83 0.97 1.59 0.76 CEO cash based compensation ($mil) 1.06 0.66 0.93 0.54 CEO equity based compensation ($mil) 0.58 0.13 0.32 0.05 ***
Top5EXE total compensation (TDC1) ($mil) 4.80 2.82 4.67 2.52 Top5EXE cash based compensation ($mil) 3.00 1.97 2.97 1.81 Top5EXE equity based compensation ($mil) 1.26 0.35 0.79 * 0.18 ***
Corporate Governance: CPS, Institutional Holding, Analysts Following CEO pay slice (CPS) 0.37 0.37 0.33 *** 0.34 **
Dummy of no analysts following 0.44 0.00 0.36 * 0.00 *
Dummy of low institutional ownership 0.33 0.00 0.25 * 0.00 *
Number of analysts following 7.27 3.00 6.95 3.00 Institutional share holding at Q4 0.35 0.32 0.31 0.28 Performance & Accounting Information
ROA -0.02 0.03 -0.12 ** 0.03 Tobin's q 2.74 1.41 2.77 1.40 Z SCORE 1.24 0.95 1.24 0.95 One-year stock returns - value adj. 0.26 0.02 0.10 -0.03 Total assets ($ bn) 4.64 0.59 4.48 0.65 Market value of equity ($ bn) 3.13 0.61 5.93 ** 0.55 Market to book value 0.90 2.33 4.68 * 2.05

43
Table 3 (Continued)
Panel B. 56 Pairs: fraud firms with fraud executive names
Fraud Firms
(n=145) Matching Firms
(n=155)
Mean Median Mean Median
CEO & Top 5 Executive Perks
Dummy of no perk disclosure 0.41 0.00 0.32 0.00
CEO total amount of perks ($000s) 41.47 0.00 102.26 * 3.35 *
CEO entertainment perks ($000s) 1.08 0.00 7.38 0.00
CEO home and family perks ($000s) 14.52 0.00 3.78 0.00
CEO services perks ($000s) 8.42 0.00 12.57 0.00
CEO financial and severance perks($000s) 6.55 0.00 69.28 * 0.00 ***
Top5EXE total amount of perks ($000s) 152.08 14.00 262.58 * 26.48
Top5EXE entertainment perks ($000s) 3.45 0.00 9.97 0.00
Top5EXE home and family perks ($000s) 43.62 0.00 27.27 0.00
Top5EXE services perks ($000s) 15.76 0.00 18.99 0.00
Top5EXE financial and severance perks($000s) 60.08 0.00 182.15 ** 0.00 ***
CEO & Top 5 Executive Compensation
CEO total compensation (TDC1) ($mil) 1.76 0.90 1.52 0.71
CEO cash based compensation ($mil) 1.07 0.60 0.91 0.50
CEO equity based compensation ($mil) 0.46 0.11 0.22 *** 0.05 ***
Top5EXE total compensation (TDC1) ($mil) 4.87 2.98 4.58 2.32
Top5EXE cash based compensation ($mil) 3.04 1.75 2.89 1.69
Top5EXE equity based compensation ($mil) 1.17 0.30 0.70 ** 0.18 **
Corporate Governance: CPS, Institutional Holding, Analyst Following
CEO pay slice (CPS) 0.35 0.36 0.33 * 0.33
Dummy of no analysts following 0.47 0.00 0.39 0.00
Dummy of low institutional ownership 0.37 0.00 0.28 0.00
Number of analysts following 6.92 2.00 6.77 3.00
Institutional share holding at Q4 0.33 0.29 0.30 0.23
Performance & Accounting Information
ROA -0.02 0.02 -0.15 ** 0.02
Tobin's q 2.80 1.42 2.91 1.39
Z SCORE 1.28 0.95 1.10 0.87
One-year stock returns - value adj. 0.22 0.01 0.07 -0.05
Total assets ($ bn) 5.17 0.69 4.83 0.65
Market value of equity ($ bn) 2.90 0.60 4.25 0.53
Market to book value -0.08 2.41 4.36 2.08

44
Table 4 Likelihood of fraud events: CEO perks, compensation, and corporate governance This table presents results regarding the likelihood of fraud associated with CEO perquisites, compensation, corporate governance variables, and the controlled accounting variables. Panels A and B report the results of Logistic Model and Survival Model, respectively. In both Panels, (1) examines a firm’s transparency of perk disclosure;(2) examines CEO total amount of perks; (3) further examines the four main categories of CEO perks; (4) includes both the dummy of no perk disclosure and the four main categories of CEO perks. The dummy of no perk disclosure is set to 1 if there is no disclosure of perks in a year; 0 otherwise. CEO pay slice (CPS) is the share of CEO total compensation to the total compensation of the top five executives. See Appendix A for details of variable definitions and data sources. *,**, *** Significant at the 10, 5, and 1 percent levels, respectively, for a two-tailed test.
Panel A. Logistic Model (1) (2) (3) (4)
Coef.
Chi-Square
Coef.Chi-
SquareCoef.
Chi-Square
Coef.Chi-
Square
Dummy of no perk disclosure 0.47 3.53 * 0.43 2.28 Log CEO total amount of perks -0.04 3.02 *
Log CEO entertainment perks 0.03 0.21 0.04 0.46 Log CEO home and family perks -0.01 0.07 0.00 0.00 Log CEO services perks 0.07 2.32 0.08 3.29 *
Log CEO financial and severance perks -0.10 7.67 *** -0.08 5.12 **
CEO cash based compensation -0.11 1.38 -0.09 0.91 -0.11 1.35 -0.12 1.63 CEO equity based compensation 0.02 0.60 0.02 0.39 0.02 0.63 0.02 0.93 CEO Pay Slice (CPS) 1.91 2.86 * 2.16 3.68 * 2.28 3.89 ** 2.04 3.03 *
Dummy of no analysts following 0.86 3.26 * 0.91 3.65 * 0.95 3.82 * 0.90 3.41 *
Dummy of low institutional ownership 0.88 3.76 * 0.83 3.33 * 0.79 2.88 * 0.86 3.35 *
Number of analysts following 0.03 2.66 0.03 2.81 * 0.03 3.29 * 0.03 3.08 *
Institutional share holding at Q4 1.40 4.81 ** 1.40 4.87 ** 1.45 5.17 ** 1.45 5.05 **
Z Score -0.09 0.50 -0.09 0.49 -0.08 0.37 -0.09 0.41 Return on assets 1.59 9.14 *** 1.55 8.81 *** 1.53 8.66 *** 1.54 8.53 ***
Tobin's q 0.01 0.19 0.00 0.04 0.00 0.04 0.01 0.09 Log total assets -0.15 3.20 * -0.15 3.18 * -0.17 4.12 ** -0.16 3.50 *
Market to book value -0.02 1.70 -0.02 1.76 -0.02 1.53 -0.02 1.48 Intercept 0.29 0.06 0.36 0.09 0.50 0.18 0.41 0.12 Number of observations used 321 321 321 321
Pseudo R2 0.09 0.09 0.10 0.11

45
Table 4 (Continued)
Panel B. Survival Model (1) (2) (3) (4)
Coef.Chi-
SquareCoef.
Chi-Square
Coef.Chi-
SquareCoef.
Chi- Square
Dummy of no perk disclosure 0.25 2.31 0.16 0.73 Log CEO total amount of perks -0.03 2.94 *
Log CEO entertainment perks 0.02 0.21 0.03 0.38 Log CEO home and family perks -0.03 0.53 -0.02 0.26 Log CEO services perks 0.02 0.66 0.03 1.04 Log CEO financial and severance perks -0.06 5.74 ** -0.06 4.35 **
CEO cash based compensation -0.07 1.12 -0.05 0.73 -0.06 1.06 -0.07 1.20 CEO equity based compensation 0.02 0.93 0.01 0.72 0.02 0.91 0.02 1.14 CEO pay slice (CPS) 0.76 1.09 0.88 1.47 1.05 2.02 0.97 1.70 Dummy of no analysts following 0.48 2.08 0.49 2.18 0.55 2.66 0.54 2.55 Dummy of low institutional ownership 0.29 0.96 0.27 0.82 0.23 0.59 0.25 0.69 Number of analysts following 0.02 2.79 * 0.02 2.86 * 0.03 3.79 * 0.02 3.55 *
Institutional share holding at Q4 0.55 1.83 0.55 1.81 0.58 2.03 0.59 2.09 Z Score -0.05 0.37 -0.05 0.34 -0.05 0.34 -0.06 0.40 Return on assets 0.71 4.27 ** 0.68 4.01 ** 0.71 4.36 ** 0.70 4.18 **
Tobin's q 0.00 0.01 0.00 0.11 0.00 0.11 0.00 0.07 Log total assets -0.07 1.58 -0.07 1.51 -0.09 2.57 -0.08 2.16 Market to book value 0.00 1.25 0.00 1.56 0.00 0.99 0.00 0.78 Number of observations used 321 321 321 321
Pseudo R2 0.01 0.01 0.01 0.02

46
Table 5 Likelihood of fraud events: No CEO perks, compensation, and corporate
governance This table further analyzes the likelihood of fraud associated with CEOs not receiving certain type of perks, controlling for compensation, corporate governance, and accounting variables. Panels A and B report the results of Logistic Model and Survival Model, respectively. In both Panels, (1) examines the effect of CEOs not receiving any perks;(2) examines the effect of CEOs not receiving any particular type of perks; (3) examines both the effects of CEOs not receiving any perks and not receiving any particular type of perks. CEO pay slice (CPS) is the share of CEO total compensation to the total compensation of the top five executives. See Appendix A for details of variable definitions and data sources. *,**, *** Significant at the 10, 5, and 1 percent levels, respectively, for a two-tailed test.
Panel A. Logistic Model
(1) (2) (3)
Coef.
Chi- Square
Coef.
Chi- Square
Coef.
Chi- Square
Dummy of No CEO total perks 0.54 4.77 **
0.50 2.99 *
Dummy of No CEO entertainment perks
-0.4
0 0.51
-0.5
9 1.02
Dummy of No CEO home & family perks 0.25 0.18
0.06 0.01
Dummy of No CEO service perks
-0.7
6 2.96 *
-0.9
4 4.35 **
Dummy of No CEO financial & severance perks 0.89 5.98 ** 0.70 3.31 *
CEO cash based compensation -0.0
9 0.86
-0.1
1 1.41
-0.1
3 1.77
CEO equity based compensation 0.02 0.44 0.02 0.62
0.02 0.94
CEO Pay Slice (CPS) 2.08 3.38 * 2.24 3.80 * 1.98 2.92 *
Dummy of no analysts following 0.92 3.74 * 0.98 4.03 ** 0.91 3.50 *
Dummy of low institutional ownership 0.83 3.31 * 0.78 2.81 * 0.87 3.39 *
Number of analysts following 0.03 2.79 * 0.03 3.24 * 0.03 2.99 *
Institutional share holding at Q4 1.44 5.08 ** 1.46 5.21 ** 1.45 5.02 **
Z Score -0.1
0 0.52
-0.0
8 0.34
-0.0
8 0.38
Return on assets 1.55 8.74 **
* 1.54 8.78
**
* 1.55 8.61
**
*
Tobin's q 0.00 0.02 0.01 0.05
0.01 0.12
Log total assets -0.1
5 3.29 *
-0.1
7 4.22 **
-0.1
6 3.51 *
Market to book value -0.0
2 1.75
-0.0
2 1.53
-0.0
2 1.47
Intercept -0.1
3 0.01
0.54 0.12
1.19 0.56
Number of Observations Used 321 321 321

47
Pseudo R2 0.09 0.10 0.11

48
Table 5 (Continued)
Panel B: Survival Model
(1) (2) (3)
Coef.
Chi- Square
Coef.
Chi- Square
Coef.
Chi- Square
Dummy of No CEO total perks 0.33 3.82 *
0.20 1.04
Dummy of No CEO entertainment perks -0.19 0.29
-0.28 0.58
Dummy of No CEO home & family perks 0.33 0.70
0.24 0.34
Dummy of No CEO service perks -0.27 1.02
-0.35 1.61
Dummy of No CEO financial & severance perks
0.57 4.61 *
* 0.49 3.09 *
CEO cash based compensation -0.05 0.69 -0.07 1.12
-0.07 1.31
CEO equity based compensation 0.01 0.78 0.02 0.89
0.02 1.14
CEO Pay Slice (CPS) 0.83 1.31 1.03 1.96
0.95 1.65
Dummy of no analysts following 0.50 2.27 0.56 2.81 * 0.55 2.64
Dummy of low institutional ownership 0.26 0.77 0.22 0.54
0.25 0.67
Number of analysts following 0.02 2.82 * 0.03 3.81 * 0.02 3.50 *
Institutional share holding at Q4 0.57 1.99 0.59 2.05
0.59 2.07
Z Score -0.05 0.34 -0.05 0.33
-0.06 0.40
Return on assets 0.67 3.89 *
*0.71 4.41
*
* 0.70 4.19
*
*
Tobin's q -0.01 0.14 0.00 0.10
0.00 0.05
Log total assets -0.07 1.56 -0.09 2.65
-0.08 2.15
Market to book value 0.00 1.48 0.00 1.07
0.00 0.84
Number of Observations Used 321 321
321
Pseudo R2 0.01 0.01
0.01

49
Table 6 Effect of Top five executive perks, compensation, and corporate governance on the likelihood of fraud events This table presents results regarding the likelihood of fraud associated with the top five executive perquisites, compensation, corporate governance variables, and the controlled accounting variables. Panels A and B report the results of Logistic Model and Survival Model, respectively. In both Panels, (1) examines a firm’s transparency of perk disclosure; (2) examines CEO total amount of perks; (3) further examines the four main categories of CEO perks; (4) includes both the perk disclosure and the four main categories of CEO perks. Dummy of no perk disclosure is set to 1 if there is no disclosure of perks in a year; 0 otherwise. CEO pay slice (CPS) is the share of CEO total compensation to the total compensation of the top five executives. See Appendix A for details of variable definitions and data sources. *,**, *** Significant at the 10, 5, and 1 percent levels, respectively, for a two-tailed test.
Panel A. Logistic Model (1) (2) (3) (4)
Coef.
Chi-Square
Coef. Chi-
SquareCoef.
Chi-Square
Coef.Chi-
Square
Dummy of no perk disclosure 0.51 3.97 ** 0.51 2.48 Log Top5EXE total amount of perks -0.04 3.18 *
Log Top5EXE entertainment perks -0.01 0.02 0.00 0.01 Log Top5EXE home and family perks 0.00 0.00 0.02 0.28 Log Top5EXE services perks 0.01 0.07 0.02 0.47 Log Top5EXE financial and severance perks -0.04 2.53 -0.02 0.75 Log Top5EXE cash based compensation 0.14 0.29 0.15 0.33 0.16 0.37 0.12 0.21 Log Top5EXE equity based compensation 0.05 3.44 * 0.05 3.27 * 0.05 2.90 * 0.05 3.44 *
CEO pay slice (CPS) 1.71 2.94 * 1.73 3.00 * 1.82 3.22 * 1.76 3.01 *
Dummy of no analysts following 0.87 3.30 * 0.89 3.46 * 0.91 3.53 * 0.82 2.85 *
Dummy of low institutional ownership 0.80 3.04 * 0.79 3.01 * 0.70 2.36 0.80 3.02 *
Number of analysts following 0.03 1.82 0.03 1.82 0.03 1.96 0.03 1.79 Institutional share holding at Q4 1.30 4.18 ** 1.30 4.18 ** 1.26 3.99 ** 1.27 3.94 **
Z Score -0.11 0.64 -0.11 0.62 -0.11 0.58 -0.11 0.61 Return on assets 1.60 9.35 *** 1.57 9.19 *** 1.53 8.94 *** 1.56 8.78 ***
Tobin's q 0.01 0.09 0.01 0.10 0.01 0.19 0.01 0.22 Log total assets -0.22 3.95 ** -0.22 3.79 * -0.23 4.21 ** -0.22 3.75 *
Market to book value -0.02 1.58 -0.02 1.59 -0.02 1.62 -0.02 1.56 Intercept -2.97 0.77 -2.69 0.63 -2.88 0.72 -2.73 0.64 Number of observations used 321 321 321 321
Pseudo R2 0.09 0.09 0.09 0.09

50
Table 6 (Continued)
Panel B. Survival Model (1) (2) (3) (4)
Coef. Chi-Square Coef. Chi-
Square Coef. Chi-Square Coef. Chi-
Square
Dummy of no perk disclosure 0.27 2.56 0.20 0.83 Log Top5EXE total amount of perks -0.02 2.26
Log Top5EXE entertainment perks 0.00 0.01 0.01 0.05 Log Top5EXE home and family perks -0.01 0.17 0.00 0.00 Log Top5EXE services perks -0.01 0.20 0.00 0.02 Log Top5EXE financial and severance perks -0.02 1.31 -0.01 0.49 Log Top5EXE cash based compensation 0.11 0.41 0.11 0.45 0.13 0.55 0.11 0.44 Log Top5EXE equity based compensation 0.03 2.06 0.03 1.96 0.03 1.76 0.03 2.03 CEO pay slice (CPS) 0.76 1.25 0.76 1.27 0.81 1.41 0.80 1.41 Dummy of no analysts following 0.48 2.12 0.49 2.18 0.52 2.40 0.49 2.10 Dummy of low institutional ownership 0.25 0.68 0.25 0.69 0.20 0.45 0.23 0.60 Number of analysts following 0.02 1.69 0.02 1.67 0.02 1.91 0.02 1.69 Institutional share holding at Q4 0.53 1.69 0.53 1.67 0.51 1.53 0.52 1.62 Z Score -0.07 0.56 -0.07 0.54 -0.06 0.43 -0.06 0.52 Return on assets 0.71 4.44 ** 0.70 4.41 ** 0.70 4.51 ** 0.69 4.32 **
Tobin's q 0.00 0.01 0.00 0.01 0.00 0.00 0.00 0.00 Log total assets -0.12 2.61 -0.11 2.52 -0.12 2.97 * -0.12 2.59 Market to book value 0.00 1.04 0.00 1.11 0.00 1.20 0.00 0.96 Number of observations used 321 321 321 321
Pseudo R2 0.01 0.01 0.01 0.01

51
Table 7 Likelihood of fraud events: CEO vs. Top five executives In this table, we put both the CEO and top five executive perquisites and compensation variables in the same regression to examine the likelihood of fraud associated with executive perquisites, compensation, corporate governance variables, and the controlled accounting variables. (1) and (2) report the results of Logistic Model and Survival Model, respectively. Dummy of no perk disclosure is set to 1 if there is no disclosure of perks in a year; 0 otherwise. CEO pay slice (CPS) is the share of CEO total compensation to the total compensation of the top five executives. See Appendix A for details of variable definitions and data sources. *,**, *** Significant at the 10, 5, and 1 percent levels, respectively, for a two-tailed test.
(1)
Logistic Model (2)
Survival Model
Coef. Chi-Square Coef. Chi-
Square
Dummy of no perk disclosure 0.57 3.02 * 0.22 0.93
Log CEO entertainment perks 0.05 0.27 0.02 0.06
Log CEO home and family perks -0.03 0.23 -0.03 0.57
Log CEO services perks 0.12 2.48 0.08 1.80
Log CEO financial and severance perks -0.10 4.61 ** -0.07 4.21 **
Log Top5EXE entertainment perks -0.02 0.09 0.00 0.00
Log Top5EXE home and family perks 0.02 0.36 0.00 0.02
Log Top5EXE services perks -0.05 0.50 -0.05 0.95
Log Top5EXE financial and severance perks 0.04 0.95 0.03 1.16
CEO cash based compensation -0.14 1.51 -0.08 1.79
CEO equity based compensation -0.02 0.20 0.00 0.00
Log Top5EXE cash based compensation 0.28 0.80 0.21 1.27
Log Top5EXE equity based compensation 0.06 2.29 0.03 0.98
CEO pay slice (CPS) 2.72 4.63 ** 1.21 2.27
Dummy of no analysts following 0.95 3.49 * 0.61 3.13 *
Dummy of low institutional ownership 0.81 2.81 * 0.22 0.50
Number of analysts following 0.03 2.72 * 0.02 3.29 *
Institutional share holding at Q4 1.43 4.77 ** 0.62 2.28
Z Score -0.12 0.64 -0.08 0.83
Return on assets 1.64 9.05 *** 0.76 4.96 **
Tobin's q 0.00 0.00 -0.01 0.38
Log total assets -0.25 4.47 ** -0.15 3.98 **
Market to book value -0.02 1.39 0.00 0.60
Intercept -3.37 0.91
Number of observations used 321 321
Pseudo R2 0.12 0.02

52
Table 8 Likelihood of fraud events: 56 firm pairs with fraud executive name This table conducts a robustness test by only including those frauds for which we are able to identify a person’s name in the AAER report, even though the person named may not necessarily be the CEO or one of the top five executives. The results presented here show the likelihood of fraud associated with the CEO/top five executives’ perquisites & compensation, corporate governance variables, and the controlled accounting variables. Panels A and B report the results of Logistic Model and Survival Model, respectively. In both Panels, (1) examines the CEO perks and compensation, (2) examines the top five executives’ perks and compensation, and (3) examine both the CEO and top five executive perquisites and compensation variables, respectively. Dummy of no perk disclosure is set to 1 if there is no disclosure of perks in a year; 0 otherwise. CEO pay slice (CPS) is the share of CEO total compensation to the total compensation of the top five executives. See Appendix A for details of variable definitions and data sources. *,**, *** Significant at the 10, 5, and 1 percent levels, respectively, for a two-tailed test.
Panel A. Logistic Model (1) (2) (3)
Coef.
Chi-Squar
e
Coef.
Chi- Squar
e Coef
.
Chi-Squar
e
Dummy of no perk disclosure 0.71 4.41 ** 0.65 2.86 * 0.94 5.35 **
Log CEO entertainment perks 0.09 1.73
0.05 0.15
Log CEO home and family perks 0.04 0.40
0.00 0.00
Log CEO services perks 0.12 5.06 **
0.27 5.20 **
Log CEO financial and severance perks -0.1
6 11.73
**
*
-0.1
9 9.14
**
*
Log Top5EXE entertainment perks 0.06 1.60
0.04 0.16
Log Top5EXE home and family perks
-0.0
2 0.21
0.02 0.21
Log Top5EXE services perks
0.01 0.13
-0.1
5 1.95
Log Top5EXE financial and severance perks
-0.0
5 2.27
0.06 1.55
CEO cash based compensation 0.14 0.45
0.37 1.14
CEO equity based compensation 0.06 3.38 *
0.02 0.10
Log Top5EXE cash based compensation
0.09 0.09
-0.4
3 0.70
Log Top5EXE equity based compensation 0.07 4.41 ** 0.06 1.38
CEO pay slice (CPS) -0.9
0 0.35
0.52 0.19
-0.9
2 0.24
Dummy of no analysts following 0.85 1.79 0.71 1.26
0.73 1.23
Dummy of low institutional ownership 1.00 3.07 * 1.03 3.46 * 1.15 3.68 *
Number of analysts following 0.03 1.67 0.04 2.15
0.03 1.23
Institutional share holding at Q4 1.04 1.83 0.96 1.56
1.12 1.95
Z Score 0.22 1.29 0.18 0.83
0.27 1.72
Return on assets 2.03 7.20 ** 1.93 7.48 ** 2.15 7.57 **

53
* * *
Tobin's q 0.00 0.02
0.01 0.05
-0.0
1 0.28
Log total assets -0.2
3 4.47 **
-0.2
5 3.82 *
-0.1
8 1.73
Market to book value -0.0
1 0.39
-0.0
1 0.76
-0.0
1 0.41
Intercept -2.1
6 0.93
-2.1
0 0.28
0.06 0.00
Number of observations used 242 242
242
Pseudo R2 0.17 0.13
0.19
Table 8 (Continued)
Panel B. Survival Model (1) (2) (3)
Coef.
Chi-Squar
e
Coef.
Chi- Squar
e Coef
.
Chi-Squar
e
Dummy of no perk disclosure 0.30 1.76 0.20 0.59
0.34 1.59
Log CEO entertainment perks 0.05 1.19
-0.02 0.08
Log CEO home and family perks 0.00 0.00
-0.01 0.05
Log CEO services perks 0.04 1.85
0.19 3.77 *
Log CEO financial and severance perks -0.10 6.97 **
* -0.11 6.08
*
*
Log Top5EXE entertainment perks 0.04 1.60
0.06 0.90
Log Top5EXE home and family perks -0.02 0.60
-0.01 0.11
Log Top5EXE services perks -0.02 0.45
-0.15 2.53
Log Top5EXE financial and severance perks -0.02 0.85
0.04 1.91
CEO cash based compensation 0.12 0.65
0.08 0.09
CEO equity based compensation 0.02 1.41
0.00 0.03
Log Top5EXE cash based compensation 0.14 0.49
0.04 0.01
Log Top5EXE equity based compensation 0.03 2.08
0.03 0.76
CEO pay slice (CPS) -0.27 0.07 0.44 0.29
0.08 0.00
Dummy of no analysts following 0.72 2.77 * 0.72 2.65
0.76 2.88 *
Dummy of low institutional ownership 0.20 0.30 0.19 0.28
0.22 0.34
Number of analysts following 0.03 2.87 * 0.03 2.83 * 0.03 3.22 *
Institutional share holding at Q4 0.50 1.06 0.45 0.86
0.55 1.24
Z Score 0.05 0.22 0.04 0.15
0.05 0.19
Return on assets 0.99 4.43 ** 1.02 4.82 *
* 1.16 5.62
*
*

54
Tobin's q 0.00 0.11 0.00 0.02
-0.01 0.78
Log total assets -0.15 4.01 ** -0.17 3.90 *
* -0.17 3.57 *
Market to book value 0.00 0.03 0.00 0.37
0.00 0.02
Number of observations used 242 242
242
Pseudo R2 0.03 0.02
0.03

55
Table 9. Likelihood of fraud events: two stage regressions to address the concern that corporate governance and perks are related
This table conducts a two-stage regression to address the concern that corporate governance and perks are related. The first stage runs a regression of corporate governance variables on perks, treating the residual perks as unrelated to corporate governance variables. The second stage then incorporates the residual perks into the original model to see whether the results of perks remain.
First stage regression:
itit
itititit
ngshareholdialInstitutioofRatiofollowinganalystofNumber
ownershipnalinstitutiolowofDummyfollowinganalystnoofDummyCPSPerks
54
3210
Second stage regression:
ititititit ControlinvestorsnalinstitutioanalystsbyMonitoringCPSonCompensatiperkssidualFraud 543210 &Re The first stage results are presented in Panel A. The second stage results of Logistic Model and Survival Model are presented in Panels B and C, respectively. In all Panels, (1) examines CEO total amount of perks, (2) examines entertainment perks, (3) examines home & family perks, (4) examine service perks, and (5) examine financial & severance perks, respectively. See Appendix A for details of variable definitions and data sources. *,**, *** Significant at the 10, 5, and 1 percent levels, respectively, for a two-tailed test.
Panel A. 1st stage: Perk variables regressed on CEO power and outside monitoring variables
Independent variable: (1)Total Perk
(2) Entertain Perk
(3)Home & Family
(4)Service Perk
(5)Financial Perk
Coef. T-value Coef. T-value Coef. T-value Coef. T-value Coef. T-value
CEO Pay Slice (CPS) 4.16 1.93 * 0.42 0.52 0.92 0.86 2.28 1.99 ** 4.64 2.95 ***
Dummy of no analysts following 0.90 0.89 -0.42 -1.09 0.01 0.01 0.34 0.62 1.45 1.95 *
Dummy of low institutional ownership 0.16 0.16 0.33 0.89 0.17 0.34 -0.07 -0.13 -1.06 -1.46
Number of analysts following 0.04 1.28 0.00 0.34 -0.02 -1.02 0.02 1.20 0.02 0.88
Institutional share holding at Q4 1.02 0.78 0.30 0.60 0.03 0.04 -0.51 -0.74 0.61 0.64
Intercept 2.17 2.02 ** 0.21 0.51 0.39 0.74 -0.05 -0.09 -0.67 -0.85
Number of Observations Used 393 393 393 393 393
R2 0.050 0.012 0.008 0.016 0.034

56
Table 9 (Continued)
Panel B. Logistic Model
(1)
Total Perk (2)
Entertain Perk(3)
Home & Family(4)
Service Perk (5)
Financial Perk
Independent variable: Fraud Coef.Chi-
Square Coef.Chi-
Square Coef.
Chi- Square Coef.
Chi- Square Coef.
Chi- Square
Residual Log CEO total perks -0.04 3.02 *
Residual Log CEO entertainment perks 0.03 0.26
Residual Log CEO home & family perks -0.04 0.49
Residual Log CEO service perks 0.05 1.23
Residual Log CEO financial & severance perks -0.09 6.78 ***
CEO cash based compensation -0.09 0.91 -0.10 1.27 -0.10 1.19 -0.11 1.35 -0.10 1.07
CEO equity based compensation 0.02 0.39 0.01 0.30 0.01 0.30 0.01 0.30 0.02 0.60
CEO Pay Slice (CPS) 1.99 3.14 * 2.09 3.43 * 2.06 3.39 * 2.04 3.27 * 1.97 2.97 *
Dummy of no analysts following 0.87 3.36 * 0.90 3.59 * 0.91 3.67 * 0.89 3.54 * 0.84 3.02 *
Dummy of low institutional ownership 0.82 3.28 * 0.82 3.36 * 0.82 3.28 * 0.83 3.37 * 0.87 3.52 *
Number of analysts following 0.03 2.49 0.03 2.94 * 0.03 3.04 * 0.03 3.19 * 0.03 2.70
Institutional share holding at Q4 1.36 4.58 ** 1.41 5.04 ** 1.40 4.90 ** 1.41 5.00 ** 1.39 4.72 **
Z Score -0.09 0.49 -0.09 0.43 -0.09 0.47 -0.10 0.52 -0.08 0.36
Return on assets 1.55 8.81 *** 1.59 9.32 *** 1.59 9.39 *** 1.61 9.36 *** 1.52 8.73 ***
Tobin's q 0.00 0.04 0.01 0.12 0.01 0.12 0.01 0.13 0.00 0.04
Log total assets -0.15 3.18 * -0.16 4.16 ** -0.17 4.24 ** -0.17 4.45 ** -0.15 3.55 *
Market to book value -0.02 1.76 -0.02 1.63 -0.02 1.75 -0.02 1.69 -0.02 1.63
Intercept 0.27 0.05 0.50 0.19 0.48 0.17 0.60 0.27 0.35 0.09
Number of Observations Used 321 321 321 321
Pseudo R2 0.09 0.08 0.08 0.08 0.10

57
Table 9 (Continued)
Panel C. Survival Model (1)
Total Perk (2)
Entertain Perk(3)
Home & Family(4)
Service Perk (5)
Financial Perk
Independent variable: Fraud Coef.Chi-
SquareCoef.
Chi- Square
Coef.Chi-
SquareCoef.
Chi- Square
Coef.Chi-
Square
Residual Log CEO total perks -0.03 2.94 *
Residual Log CEO entertainment perks 0.01 0.13
Residual Log CEO home & family perks -0.03 0.78
Residual Log CEO service perks 0.01 0.24
Residual Log CEO financial & severance perks -0.06 5.57 **
CEO cash based compensation -0.05 0.73 -0.07 1.10 -0.06 1.07 -0.07 1.11 -0.06 0.86
CEO equity based compensation 0.01 0.72 0.01 0.56 0.01 0.50 0.01 0.55 0.02 1.03
CEO Pay Slice (CPS) 0.77 1.13 0.79 1.17 0.85 1.31 0.76 1.10 0.71 0.98
Dummy of no analysts following 0.47 1.97 0.50 2.27 0.50 2.27 0.51 2.31 0.44 1.76
Dummy of low institutional ownership 0.26 0.79 0.27 0.81 0.26 0.73 0.26 0.77 0.30 1.01
Number of analysts following 0.02 2.52 0.02 3.18 * 0.02 3.29 * 0.02 3.28 * 0.02 3.11 *
Institutional share holding at Q4 0.52 1.63 0.56 1.80 0.53 1.68 0.56 1.82 0.54 1.79
Z Score -0.05 0.34 -0.04 0.23 -0.05 0.27 -0.05 0.26 -0.05 0.30
Return on assets 0.68 4.01 ** 0.74 4.48 ** 0.74 4.60 ** 0.75 4.57 ** 0.71 4.39 **
Tobin's q 0.00 0.11 0.00 0.05 0.00 0.03 0.00 0.04 0.00 0.12
Log total assets -0.07 1.51 -0.08 2.26 -0.08 2.33 -0.08 2.36 -0.08 2.20
Market to book value 0.00 1.56 0.00 0.79 0.00 1.79 0.00 1.25 0.00 0.96
Number of Observations Used 321 321 321 321 321
Pseudo R2 0.01 0.01 0.01 0.01 0.01
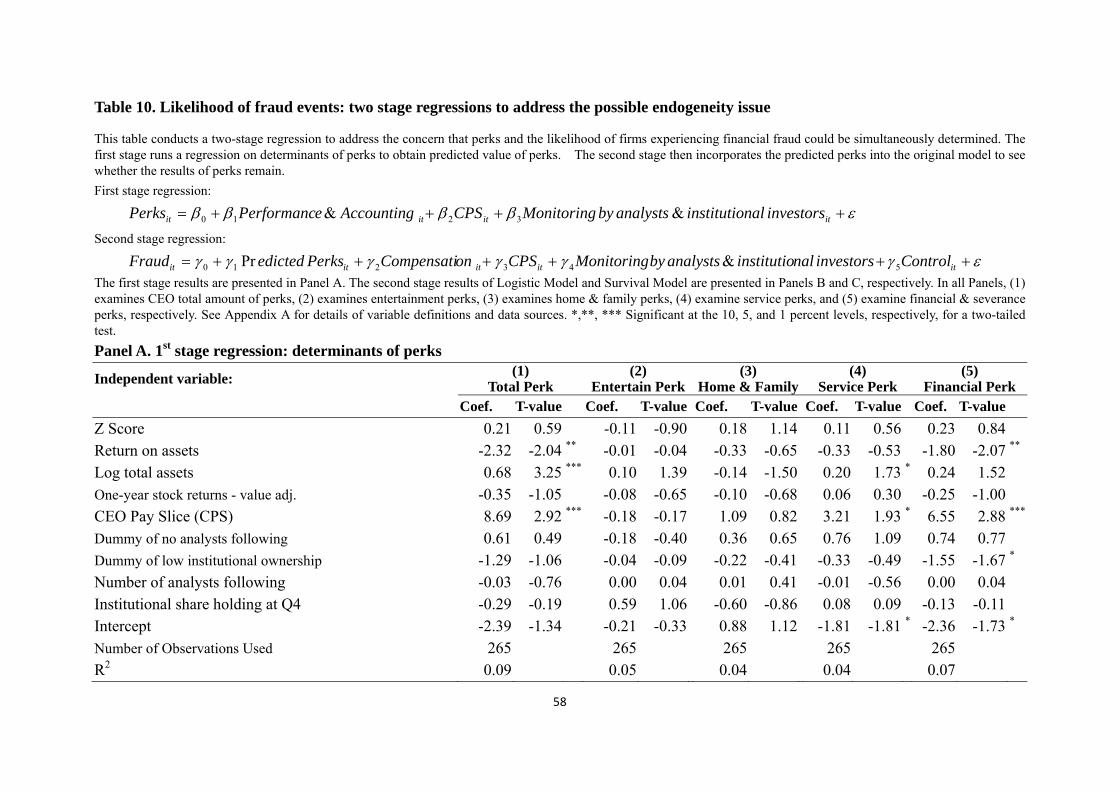
58
Table 10. Likelihood of fraud events: two stage regressions to address the possible endogeneity issue
This table conducts a two-stage regression to address the concern that perks and the likelihood of firms experiencing financial fraud could be simultaneously determined. The first stage runs a regression on determinants of perks to obtain predicted value of perks. The second stage then incorporates the predicted perks into the original model to see whether the results of perks remain.
First stage regression:
itititit investorsnalinstitutioanalystsbyMonitoringCPSAccountingePerformancPerks && 3210
Second stage regression:
ititititit ControlinvestorsnalinstitutioanalystsbyMonitoringCPSonCompensatiPerksedictedFraud 543210 &Pr The first stage results are presented in Panel A. The second stage results of Logistic Model and Survival Model are presented in Panels B and C, respectively. In all Panels, (1) examines CEO total amount of perks, (2) examines entertainment perks, (3) examines home & family perks, (4) examine service perks, and (5) examine financial & severance perks, respectively. See Appendix A for details of variable definitions and data sources. *,**, *** Significant at the 10, 5, and 1 percent levels, respectively, for a two-tailed test.
Panel A. 1st stage regression: determinants of perks
Independent variable: (1)Total Perk
(2) Entertain Perk
(3)Home & Family
(4)Service Perk
(5)Financial Perk
Coef. T-value Coef. T-value Coef. T-value Coef. T-value Coef. T-value
Z Score 0.21 0.59 -0.11 -0.90 0.18 1.14 0.11 0.56 0.23 0.84 Return on assets -2.32 -2.04 ** -0.01 -0.04 -0.33 -0.65 -0.33 -0.53 -1.80 -2.07 **
Log total assets 0.68 3.25 *** 0.10 1.39 -0.14 -1.50 0.20 1.73 * 0.24 1.52 One-year stock returns - value adj. -0.35 -1.05 -0.08 -0.65 -0.10 -0.68 0.06 0.30 -0.25 -1.00 CEO Pay Slice (CPS) 8.69 2.92 *** -0.18 -0.17 1.09 0.82 3.21 1.93 * 6.55 2.88 ***
Dummy of no analysts following 0.61 0.49 -0.18 -0.40 0.36 0.65 0.76 1.09 0.74 0.77 Dummy of low institutional ownership -1.29 -1.06 -0.04 -0.09 -0.22 -0.41 -0.33 -0.49 -1.55 -1.67 *
Number of analysts following -0.03 -0.76 0.00 0.04 0.01 0.41 -0.01 -0.56 0.00 0.04 Institutional share holding at Q4 -0.29 -0.19 0.59 1.06 -0.60 -0.86 0.08 0.09 -0.13 -0.11 Intercept -2.39 -1.34 -0.21 -0.33 0.88 1.12 -1.81 -1.81 * -2.36 -1.73 *
Number of Observations Used 265 265 265 265 265
R2 0.09 0.05 0.04 0.04 0.07

59
Table 10 (Continued)
Panel B. Logistic Model
(1)
Total Perk (2)
Entertain Perk(3)
Home & Family(4)
Service Perk (5)
Financial Perk
Independent variable: Fraud Coef.Chi-
Square Coef.Chi-
Square Coef.
Chi- Square
Coef.Chi-
Square Coef.Chi-
Square
Predicted Log CEO total perks -0.35 7.74 ***
Predicted Log CEO entertainment perks -1.08 1.92
Predicted Log CEO home & family perks -0.70 1.63
Predicted Log CEO service perks -0.65 1.84
Predicted Log CEO financial & severance perks -0.84 10.35 ***
CEO cash based compensation -0.11 0.75 -0.15 1.39 -0.31 2.94 * -0.14 1.20 -0.15 1.49 CEO equity based compensation 0.01 0.10 0.00 0.00 -0.01 0.22 0.00 0.00 0.01 0.07 CEO Pay Slice (CPS) 3.91 6.18 ** 1.23 0.87 2.50 2.75 * 3.29 3.26 * 6.37 9.67 ***
Dummy of no analysts following 1.20 5.01 ** 0.72 1.94 1.03 3.71 * 1.40 4.46 ** 1.59 7.74 ***
Dummy of low institutional ownership 0.47 0.87 0.68 1.90 0.46 0.82 0.52 1.10 -0.33 0.32 Number of analysts following 0.03 3.36 * 0.03 2.69 0.01 0.76 0.02 1.75 0.04 5.09 **
Institutional share holding at Q4 1.84 7.45 *** 2.59 9.48 *** 1.45 3.67 * 1.97 8.63 *** 1.76 6.79 ***
Z Score -0.13 0.72 -0.28 2.76 * -0.05 0.08 -0.10 0.41 -0.04 0.08 Tobin's q -0.02 0.56 -0.01 0.06 0.01 0.05 0.00 0.00 -0.03 0.92
Market to book value -0.01 0.48 -0.01 0.61 -0.01 0.92 -0.01 0.65 -0.01 0.53
Intercept 0.41 0.07 0.71 0.22 2.65 1.33 ‐0.11 0.00 ‐0.29 0.04
Number of Observations Used 265 265 265 265 265
Pseudo R2 0.07 0.05 0.05 0.05 0.08
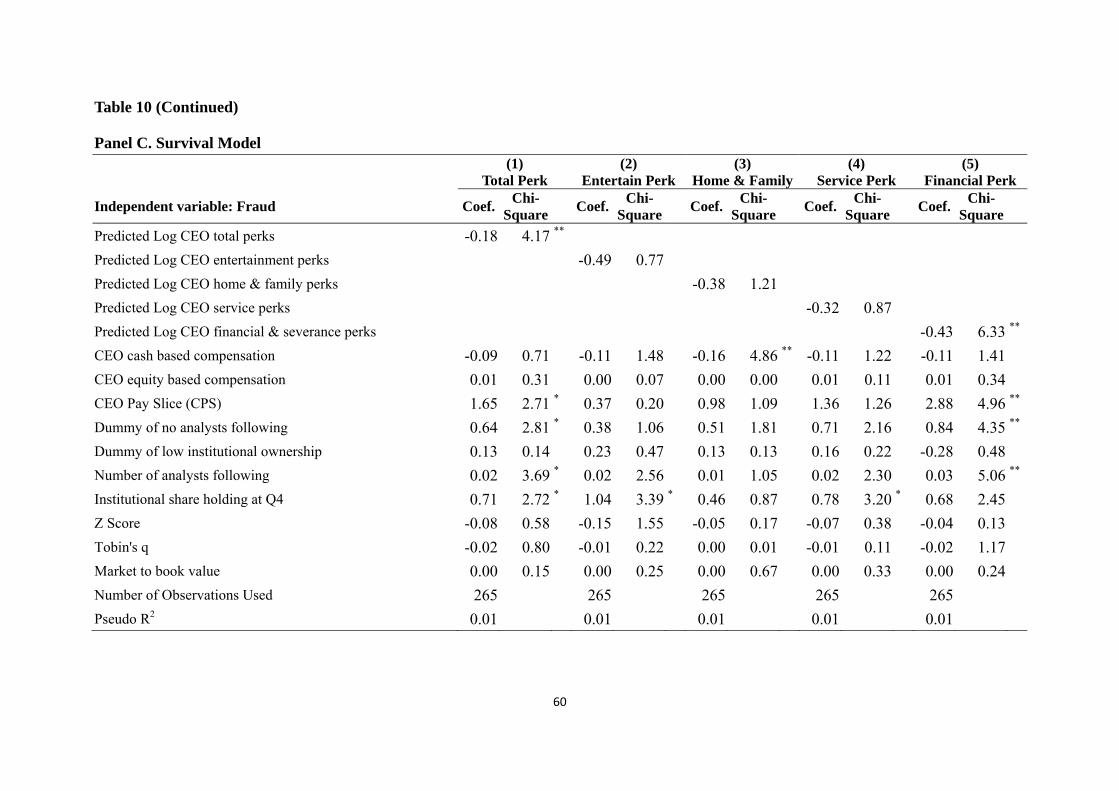
60
Table 10 (Continued)
Panel C. Survival Model
(1)
Total Perk (2)
Entertain Perk(3)
Home & Family(4)
Service Perk (5)
Financial Perk
Independent variable: Fraud Coef.Chi-
Square Coef.Chi-
Square Coef.
Chi- Square Coef.
Chi- Square Coef.
Chi- Square
Predicted Log CEO total perks -0.18 4.17 **
Predicted Log CEO entertainment perks -0.49 0.77
Predicted Log CEO home & family perks -0.38 1.21
Predicted Log CEO service perks -0.32 0.87
Predicted Log CEO financial & severance perks -0.43 6.33 **
CEO cash based compensation -0.09 0.71 -0.11 1.48 -0.16 4.86 ** -0.11 1.22 -0.11 1.41 CEO equity based compensation 0.01 0.31 0.00 0.07 0.00 0.00 0.01 0.11 0.01 0.34 CEO Pay Slice (CPS) 1.65 2.71 * 0.37 0.20 0.98 1.09 1.36 1.26 2.88 4.96 **
Dummy of no analysts following 0.64 2.81 * 0.38 1.06 0.51 1.81 0.71 2.16 0.84 4.35 **
Dummy of low institutional ownership 0.13 0.14 0.23 0.47 0.13 0.13 0.16 0.22 -0.28 0.48 Number of analysts following 0.02 3.69 * 0.02 2.56 0.01 1.05 0.02 2.30 0.03 5.06 **
Institutional share holding at Q4 0.71 2.72 * 1.04 3.39 * 0.46 0.87 0.78 3.20 * 0.68 2.45 Z Score -0.08 0.58 -0.15 1.55 -0.05 0.17 -0.07 0.38 -0.04 0.13 Tobin's q -0.02 0.80 -0.01 0.22 0.00 0.01 -0.01 0.11 -0.02 1.17
Market to book value 0.00 0.15 0.00 0.25 0.00 0.67 0.00 0.33 0.00 0.24
Number of Observations Used 265 265 265 265 265
Pseudo R2 0.01 0.01 0.01 0.01 0.01