why gross national disposable income should substitute
TRANSCRIPT

ISSN: 2281-1346
Department of Economics and Management
DEM Working Paper Series
Why Gross National Disposable
Income should substitute Gross
National Income
Gianni Vaggi
(Università di Pavia)
Clara Capelli
(Università di Pavia)
# 91 (09-14)
Via San Felice, 5
I-27100 Pavia
http://epmq.unipv.eu/site/home.html
September 2014
1
Why Gross National Disposable Income
should substitute Gross National
Income*
Clara Capelli Gianni Vaggi [email protected] [email protected]
Department of Economics and Management University of Pavia
* The authors are highly indebted to François Bourguignon and Annalisa Prizzon and to the participants in the session of the June 2014 EADI Conference in Bonn, for their useful comments and constructive suggestions. All remaining errors are ours. Keywords: Gross National Income, Gross National Disposable Income, Living standard, Balance of Payments, Current Account, Remittances JEL classification: F60, O011, O015
2
Abstract
The Gross National Income (GNI) is often used as an indicator for a
country’s living standards. Yet, it does not record unilateral transfers and
notably remittances, which in the last decades have gained growing
importance as a source of income for developing countries.
Gross National Disposable Income (GNDI), includes both income and
transfers and provides a much better account of people’s actually
available income. However GNDI is sometimes confused with the GNI and
is rarely available in major reports.
This paper fills this gap by calculating the GNDI for all the countries in
the World Bank database and it discusses the use of GNDI for 27 countries
amongst the world top remittance receivers. We show that GNDI is much
more informative than GNI and is a much more reliable basis for policy
making in developing countries.

3
1 INTRODUCTION
In the remote district of Cheskam - at the feet of the Himalaya in Nepal - many
people receive money from their relatives working abroad. This does not make
them rich, neither upgrades Nepal from its status of Low Income Country, but for
sure sensibly increases their local purchasing power; in Nepal remittances
approximately account for 25 per cent of the GDP, representing a phenomenon
that cannot be ignored when focusing on the country’s living standards.
Remittance flows into developing countries are a well-established
phenomenon, which is being investigated particularly for its impact on households
at the micro level. However, remittances also have very important implications at
the macro level and on the profile of national accounts, a fact which has not
received much attention. This paper tries to fill this gap and provides new insights
in two particular areas.
First, it shows that the Gross National Disposable Income (GNDI) is a more
informative indicator than the Gross National Income (GNI) to measure the
standard of living of an economy and how well off the members of a country are on
average.
Second, for countries where remittances play an important role, the analysis of
the different components of the Current Account Balance is an essential element
to understand the weaknesses and strengths of an economy and to design
appropriate development policies. We will see that in many developing countries
the current account is in a much better position than the trade account, largely
because of remittances; in the case of Nepal a trade deficit of 26 per cent of the

4
GDP turns into a current account surplus of 3 per cent.
The Gross National Income (GNI) is often regarded as an either
complementary or alternative measure with respect to the Gross Domestic
Product (GDP)1. We will show that - contrary to a largely held view - GNI is not
the most appropriate indicator for a population’s monetary income. A third
indicator, the Gross National Disposable Income (GNDI) proves to be more
telling and useful in many fields. Let us briefly summarise the argument.
The GNI does not record the so-called unilateral transfers, most importantly
remittances. Their total worldwide value in current prices has increased by seven
times between 1990 and 2012(see the World Bank database) and they represent
one the largest types of monetary inflows for developing countries. GNDI captures
both factor incomes and unilateral transfers, which makes it a better tool to
measure how well off a country’s population is.
Unfortunately, the GNDI is rarely available in international reports and
databases. Sometimes it is even confused with the GNI in common practice. This
paper provides a first attempt to calculate GNDI for all the countries sin the World
Bank database and it will discuss the differences among GDP, GNI and GNDI in 27
economies where remittances are particularly relevant.
Section 2 illustrates the concepts of GDP, GNI and GNDI, explaining their
mutual relations and their differences in an open economy. Section 3 shows some
figures regarding the three indicators with respect to 27 countries where
remittances play a very important role. Section 4 presents some data on
remittances, trade account and current account balance for the above 27 countries
and discusses their implications. Section 5 presents a number of fields for which

5
the GNDI could substitute the GNI. Section 6 concludes with some policy
recommendations.
In the Appendix Table A shows the value of GNDI for all the countries of the
World Bank Database.
2 THE VALUE OF AN ECONOMY
The measurement of the value of an economy is a complicated issue, which
basically depends on conventions, the existing statistical tools and the availability
of data2. This paper will focus on the economic dimension of the ”standards of
living”, namely what Amartya Sen classifies as opulence in the sense of ”command
over a mass of commodities” (Sen 1987:14-17)3. We will simply consider the
monetary income side of the standard of living and will follow the classifications of
the System of National Accounts, issued by the United Nations in 2008 (UN 2008)
and the sixth edition of the Balance of Payments Manual (IMF, 2009).
The most used indicator for the value of an economy is obviously the GDP,
which identifies the value of an economy with the value of the activities that take
place within its geographical borders. GDP is also used to compare the size of the
economies and to evaluate their growth performance.
(a) The GNI and the mobility of factors of production
In a globalised world, where mobility of people and capital has been steadily
growing, some producers may operate in an economy that is not the one where
they dwell and use their incomes. As explained by the UN Systems of National

6
Accounts (SNA) in the 2008 handbook, ”Some of the production of a resident
producer may take place abroad, while some of the production taking place within
the geographical boundary of the economy may be carried out by non-resident
producer units” (UN, 2008: 105). In other words, a country’s factors of production
are not necessarily employed domestically, but may be hired abroad for foreign
production process.
If residence does not coincide with the location of the production activity,
differences arise between the income generated within an economy - the GDP - and
the income actually available to the citizens of that country. Here is where the
notion of Gross National Income comes in, because it is widespread view that GNI
fills the gap between the income resulting from domestic production and the
income actually received by a country’s inhabitants.
Let us take Ireland and the Palestinian Territories. In the 1990s the Irish GNI
was on average 10 per cent lower than the GDP and such difference increased to
approximately 15 per cent in the 2000s, hitting 23 per cent in 2012. For this
reason Sweeney questioned the usefulness of the GDP, given the weight of
multinational corporation profits that were generated in Ireland, but repatriated to
the head offices abroad (Sweeney 1999: 53). His claim was that the GNI4 was a
better indicator for living standards, as it measured the income generated by the
resident factors of production, regardless of the country where they are employed.
An opposite case refers to the Palestinian Territories. Between the time of the
Oslo accords in 1993-94 and the eruption of the Second Intifada in 2000 a large
number of Palestinians were working in Israel. In the Occupied Palestinian
Territories, the GNI was on average 15 per cent higher than the GDP5. Such a gap
was the result of the compensations of employees hired in Israel but living in the

7
West Bank and Gaza.
Both examples show that the GDP does not provide a complete picture of the
income actually available in a country. In Ireland, the GDP somehow
”overestimates” the income really earned by the Irish residents. On the contrary, in
the Palestinian Territories it ”underestimates” the Palestinians’ purchasing power.
In light of considerations of this kind, the GNI has been more and more largely
used, thus giving more importance to the income generated by the resident factors
of production - no matter where they earn it - than to the income generated within
the economy.
For instance, GNI is now used by UNDP to build the Human Development Index
(HDI). From 1990 to 2009 the HDI component of (material) living standards was
measured by the GDP per capita in PPP US$. In 2010, the latter was replaced by the
GNI per capita in PPP US$, namely in order to account for the differences that arise
in a globalised world between the income of a country’s residents and its domestic
production (see Kovacevic, 2010: 14; Klugman et al 2011: 20).
(b) The GNDI and remittances
The GNI does not completely explain the difference between the value of
production of a country and its income, as it does not include remittances. We shall
see that only the GNDI does accomplish this task.
Both gross and net remittance flows have been constantly growing during all
the Nineties (Kapur 2004: 4). According to the World Bank, the overall value of
remittances at the world level is estimated to be 542 billion US$ in 2013 and 404
billion US$ are flowing towards developing countries (World Bank 2014b: 5). The

8
latter are also expected to continue to grow at 8 on average over the next three
years, reaching 516 billion in 2016 (ibid.: 1). In 1996 overall remittances inflows to
developing countries were just above 58 million US$ (de Luna Martinez 2005:
Annex 2). These figures merely refer to officially recorded transactions and do not
account for the informal transfers of money that seem to be as important as those
formally registered6.
Original data on remittances come from the countries’ governments and there
exists a huge need to improve them (World Bank 2011: 6), but it is clear that such
massive inflows have a considerable impact on a country’s standard of living. In
the World Development Indicators reports, remittances and compensation of
employees are grouped together under the label of ”personal remittances” (World
Bank 2014a: 93-4 and Table 6.13), but no specific figures for the GNDI are
provided7.
Notwithstanding the fact that remittances are not included in the GNI, some
degree of confusion exists in common practice, as the GNI is often believed to
record also unilateral transfers. For example, Todaro and Smith comments on the
use of the GNI to calculate the HDI as follows:
”Gross National Income (GNI) per capita replaces Gross
Domestic Product (GDP) per capita. This should be an
unambiguous improvement: GNI reflects what citizens can do
with income they receive, ...... As trade and remittance flows have
been expanding rapidly, and as aid has been better targeted to
very low-income countries, this distinction has become

9
increasingly important.” (Todaro and Smith 2011: 54)
The last sentence apparently implies that remittances and foreign aid are
included in the GNI and this seems to be a rather common belief, although the
Systems of National Accounts (UN 2008: 35) shows this is not the case. The
famous Report by the Commission on the Measurement of Economic Performance
and Social Progress by Stiglitz, Sen and Fitoussi makes the distinction between GNI
and GNDI:
”Although national income (NI) and national disposable income
(NDI) both refer to the income of the whole economy, NDI is a
more comprehensive aggregate than NI. [...] At the level of the
whole economy, taxes, social security payments and so on that
take place inside the country cancel out; but current transfers
from and to other countries do not, and the difference between
them mark the difference between NI and NDI. Thus, NDI better
measures how well off citizens are” (Stiglitz et al., 2008, Box 1: 95
emphasis is ours).
This is a very important and enlightening statement, but then the report
focuses on the notion of well-being, therefore the distinction between NI and NDI
is not further discussed, not even in terms of the possible implications for people’s
well-being. No figures are provided, we try to fill this gap.
GNDI rarely appears in the major international reports and databases. One
exception is the OECD, which calculates the GNDI together with the GDP and the

10
GNI for its member countries and some non-member countries, for instance China
and Indonesia(see OECD Database, National Accounts Section). However, for OECD
countries the differences between GDP-GNI and GNDI is not particularly
significant. This paper provides a first attempt to calculate GDP, GNI and GNDI for
all the countries sin the World Bank database and it focuses on 27 economies
where remittances are particularly relevant.
3 GDP, GNI AND GNDI IN FIGURES
In order to analyse the differences between GDP, GNI and GNDI, it is necessary
to recall some characteristics of the Balance of Payments and how different types
of income flows are recorded and classified in it8.
It is important to make clear that in the BoP the concept of ”residence” - and
not ”nationality”- is the leading classification criterion. An institutional unit (i.e. a
household, an enterprise, etc.) is resident in an economic territory if it has a
”predominant interest” with some location, dwelling, place of production or other
premises(see UN 2008 : 487-88 and IMF 2009b : 70-75).
The current account records how income is re-distributed worldwide via factor
incomes and unilateral transfers. In the sixth version of the IMF Balance of
Payments Manual the primary distribution of income refers to the net
remunerations of factors of production of different nationalities employed in the
production processes worldwide; this phenomenon is captured by the GNI. The
secondary distribution of income regards net unilateral transfers (mostly aid and
remittances), which are recorded by the GNDI, but are not included in the GNI.

11
Let us examine the two accounts in more detail.
(a) The Primary Income Account and the GNI
The Primary Income Account records income flows between resident and non-
resident institutional units for i) their direct contribution to the production
process; ii) the provision of financial assets; iii) the renting of natural resources to
institutional units in other countries.
In other words, this account records all the remunerations for the factors of
production (labour, capital, and natural resources) employed in a production
process that takes place in an economy that is not the one where the factors are
resident.
Following the sixth edition of the IMF Balance of Payments, the primary income
account includes:
•••• Compensation of employees: the remuneration in return for the labour
input to the production process that comes from/goes to the rest of the
world.
A classic example are the compensations of cross-border employees,
namely wages paid to workers who commute to a neighbouring country
every day, as they are employed in the latter but do not dwell in it.
•••• Income associated with the ownership of financial and other non-
produced assets, i.e. dividends, reinvested earnings, interests, rents. Again,
the residence criterion holds and these transactions include repatriated
profits, royalty interests on the exploitation of natural resources by non-
resident corporations, etc..

12
In the case of countries with a relevant foreign debt, interest payments paid to
foreign creditors appear in the primary income account; a very important item in
the debt crisis following Mexico’s default in 19829.
The Net Primary Income (NPI) is the balance of primary income flows recorded
in the Primary Income Account. It results from the difference between the primary
income receivable from non-residents and the primary income payable to non-
residents10.
GNI = GDP + NPI
(b) The Secondary Income Account and the GNDI
The Secondary Income Account focuses on the redistribution process that takes
place worldwide after the process of production. Once the factors of production
have been paid, their owners decide how to use the income, either keeping it for
themselves or transferring (a part of) it to foreign non-resident institutions.
In principle, these transfers are not related to any specific contribution to the
production process or to any market relationship between the sender and the
recipient institutions. Sometimes they are called ”unrequited transfers”, namely
because they do not derive from any pre-existing obligation of the sending party,
nor do they determine any obligation or debt for the receiving party (IMF,
2009b:31)11.
The Secondary Income Account includes:
•••• Personal Transfers: all current transfers in cash or in kind made or
received by resident households to or from non-resident households. This
source primarily regards personal remittances, namely the transfers of

13
money by migrant workers to their home countries.
•••• Current International Cooperation: current transfers in cash or in kind
between the governments of different countries or between governments
and international organisations. They range from food and emergency aid
to regular contributions and salaries of resident staff.
•••• Current Transfers to NPISHs: transfers received by resident Non-Profit
Institutions Serving Households (NPISH)12 from non-resident institutional
units in the form of membership dues, subscriptions, donations, etc.
Introduced for the first time by the System of National Accounts of 1993, the
notion of GNDI is defined as the GNI plus Net Secondary Income (NSI), which in
turn is the value of the Secondary Income Balance(see UN 2008: 35, 317 and IMF
2009b : 207, 223).
GNDI = GNI + NSI = GDP + (NPI + NSI)
The GNDI therefore measures the monetary resources that residents actually
have at their disposal and that can be used for a variety of purposes: from
purchases of foreign goods, to improving housing conditions, to investments in
children education, to investments in small family business, to bank deposits.
When the aim is to assess how well off a population is on average net secondary
incomes, namely remittances, cannot be ignored because they directly influence
the living standards. For some economies the difference between the GNI and the
GNDI is quite significant.
Tables 1 and 2 below show the figures for GDP, GNI, and GNDI with regard to a

14
27 developing countries for which workers’ remittances13 are particularly
important, either in absolute or relative terms. The Appendix has a Table with all
the countries in the World Bank database.
All the countries in Table 1 are amongst the top receivers of remittances in
absolute values in 2012; they all received an amount of remittances higher than 6
billion US$(see Table 5).
Countries are ranked with respect to their GNDI/GNI ratio. The figures for the
GDP, the NPI, and the NSI are directly taken from the World Bank Database. Those
for GNI and GNDI are calculated by the authors; GNI is the sum of GDP and NPI and
GNDI results from the sum of GDP with both NPI and NSI14 .
Table 1: Countries among top remittance receivers, absolute terms
(millions of current US$)
Country GDP NPI GNI NSI GNDI GNDI/GNI
Bangladesh 116,355 -1,778 114,577 a 14,493 129,070 1.13
Nigeria 262,597 -22,238 240,359 21,906 262,265 1.09
Pakistan 225,143 -3,389 221,754a 18,447 240,201 1.08
Morocco 95,981 -2,283 93,698 7,387 101,085 1.08
Philippines 250,182 -746 249,436a 19,172 268,608 1.08
Egypt 262,831 -6,564 256,267 19,791 276,058 1.08
Lebanon 42,945 391 43,336 2,667 46,003 1.06
Vietnam 155,820 -6,115 149,705 8,212 157,917 1.05
India 1,858,740 -20,843 1,837,897 65,435 1,903,332 1.04
Mexico 1,178,126 -22,866 1,155,260 22,559 1,177,819 1.02
Ukraine 176,308 -2,965 173,343 2,976 176,319 1.02
Poland 489,795 -22,670 467,125 5,139 472,264 1.01
Indonesia 878,043 -25,947 852,096 4,029 856,125 1.00
China 8,227,102 -42,139 8,184,963 3,434 8,188,397 1.00
a For these economies, the datum on GNI as provided by the World Bank Database appears to be considerably different from the result of GDP + NPI.
Table 2 provides the same kind of figures for the countries that in 2012
were among those with the highest share of remittances received as a percentage

15
of GDP and for all countries this is higher than 10 per cent (see Table 6). All the
countries below have a population of at least 3 million people15.
Table 2: Countries among top remittance receivers, relative terms
(millions of current US$)
Country GDP NPI GNI NSI GNDI GNDI/GNI
Liberia 1,733 88 1,821b 1,218 3,039 1.67
Tajikistan 7,632 -69 7,563 3,450 11,013 1.46
Kyrgyz Rep. 6,474 -144 6,330 2,061 8,391 1.33
Haiti 7,843 69 7,912 2,390 10,302 1.30
Nepal 18,962 126 19,088 5,370 24,458 1.28
Moldova 7,252 840 8,092 1,610 9,702 1.20
Honduras 18,434 -1,275 17,159 3,235 20,394 1.19
El Salvador 23,864 -932 22,932 4,004 26,936 1.17
Bosnia Herz. 17,465 157 17,622 2,359 19,981 1.13
Jordan 31,015 -305 30,710 4,014 34,724 1.13
Senegal 14,045 -281 13,764 1,767 15,531 1.13
Georgia 15,747 -146 15,601 1,408 17,009 1.09
Armenia 9,950 629 10,579 723 11,302 1.07
b For this economy, the datum on GNI as provided by the World Bank Database appears to be considerably different from the result of GDP + NPI.
A few considerations emerge from the two tables. First, the GDP and the GNI
are not markedly different but a striking difference arises in many cases between
the GDP-GNI and the GNDI, particularly in the countries of Table 2. The GNDI is
always much larger than then GNI, ranging from 7 per cent for Armenia to a
notable 67 per cent for Liberia.
Some remarkable results emerge also in Table 1, with a 13 per cent difference
between the GNDI and GNI in Bangladesh and a number of countries – i.e. Nigeria,
Pakistan and the Philippines- following with a difference between 9 and 5 per
cent.

16
For economies with a large number of migrants remittances make a large
impact on the amount of income a population can actually dispose of and the GNDI
is a much more appropriate indicator than the GNI of the standard of living of the
people. This obviously holds for small countries in terms of either GDP or
population, but the story goes also the same even for some big countries, such as
the aforementioned Bangladesh, Pakistan, and Nigeria. In India GNDI exceeds GNI
by 4 per cent and in Nepal, whose population is more than 27 million people,
remittances represent 25 per cent of the GDP and the GNDI is 28 per cent larger
than the GNI. These figures can hardly be overlooked when the aim is to assess
material living standards.
Second, in both tables the Net Secondary Income in most cases offsets – and
often by a significant magnitude – the Net Primary Income. This phenomenon is
glaringly evident for the countries shown in Table 2, but it may be observed even
in Table 1, where NPI is negative for all countries but Lebanon. In four cases –
Mexico, Nigeria, Vietnam, and Ukraine – NPI and NSI are more or less alike, but
with opposite signs; thus GNI is lower than the GDP, but the GNDI improves
thanks to secondary transfers. Only in three cases -Poland, Indonesia, and China-
the Net Primary Income is far higher than the Net Secondary Income.
This confirms that the secondary distribution of income through transfers from
abroad importantly affects countries’ national accounts, as it either compensates
for a negative primary income balance or hugely complements the effect of a
positive one.
The outflows of income that contribute to a negative NPI are usually due to
dividends and distributed profits paid to foreign companies; compensation of
employees do not seem to be particularly relevant (Central Bank of Nigeria, 2012;

17
Central Bank of Poland, 2012; Central Bank of Vietnam, 2012)16. Therefore, in
many Middle Income Countries, particularly those that have received Foreign
Direct Investments in the past, GNI is systematically lower than the GDP, contrary
to a common held view.
Another important item in the Primary Income Account may also be interest
payments on foreign debt. In the 1980s and 1990s, they represented a very large
outflow of income for developing countries. In 2000, the interests paid by all
developing countries amounted to 2 per cent of the GNI, with Latin America and
Caribbean hitting 2.8 per cent (World Bank 2002 Vol. 1:222, 228).
Third, Net Secondary Income flows are much more stable than the Net Primary
Income ones. Let us look at our 27 countries. In Tables 3 and 4 below, for each
country the first row refers to the NPI flows and the second row to the NSI flows.
The final column lists the coefficients of variation for both NPI and NSI series of all
the countries considered. At the moment of writing the figures in the World Bank
database are available from 2005 to 2012.
Table 3: NPI and NSI for the countries in Table 1, 2005-2012
(millions of current US$)
Country 2005 2006 2007 2008 2009 2010 2011 2012 Coeff.
of Var.
Bangladesh -793 -840 -967 -959 -1,399 -1457 -1,520 -1,814 0.29
4,774 5,933 7,288 9,617 10,981 11,379 12,243 14,548 0.33
Nigeria -2,991 -4,601
-
11,748
-
15,059
-
14,403
-
19,512 -22,784
-
22,238 0.49
15,152 17,798 18,545 20,398 19,362 20,781 21,809 21,906 0.11
Pakistan -2,515 -3,131 -3,745 -4,334 -3,614 -3,187 -3,098 -3,391 0.15
9,079 10,941 11,084 11,136 12,459 13,793 16,431 18,571 0.23
Morocco -383 -477 -404 -522 -1,495 -1,242 -2,052 -2,283 0.65
5,375 6,329 7,703 8,768 7,451 7,270 8,115 7,387 0.13
Philippines -298 -1,261 -899 105 -193 505 280 -746 1.83
11,391 13,197 14,153 15,247 16,279 16,648 18,380 19,172 0.16
Egypt -35 783 1,388 1,289 -2,076 -5,911 -6,376 -6,564 1.52

18
5,748 5,768 8,322 9,758 7,960 12,439 15,221 19,791 0.43
Lebanon 186 183 740 437 -228 -508 174 391 2.12
1,062 1,968 2,769 2,360 1,827 2,449 2,525 2,667 0.24
Vietnam -1,205 -1,429 -2,190 -4,401 -3,028 -4,564 -5,019 -6,115 0.48
3,380 4,049 6,430 7,311 6,448 7,885 8,685 8,212 0.28
India -6,649 -6,245 -6,515 -5,364 -7,539
-
15,601 -16,043
-
20,843 0.52
23,643 28,716 37,438 48,752 48,762 52,120 60,2121 65,435 0.30
Mexico
-
16.021
-
19,352
-
22,701
-
19,439
-
14,296
-
11,321 -19,179
-
22,866 0.21
22,137 25,945 26,405 25,469 21,593 21,537 22,976 22,559 0.08
Ukraine -985 -1,722 -659 -1,540 -2,440 -2,009 -3,796 -2,965 0.48
2,845 3,173 3,539 3,127 2,661 2,975 3,708 2,976 0.10
Poland
-7,045 -
10,781
-
25,030
-
41,003
-
20,160
-
25,872 -25,671
-
11,373 0.5
1,958 3,237 4,194 3,578 2,218 3,762 6,159 5,139 0.35
Indonesia
-
12,926
-
13,789
-
15,525
-
15,155
-
15,140
-
20,790 -26,676
-
25,947 0.28
4,792 4,863 5,104 5,364 4,576 4,631 4,211 4,029 0.09
China
-
16,114
-
51,433 8,044 28,580 -8532
-
25,899 -70,317
-
42,139 1.73
2,387 2,807 3,710 4,316 3,166 4,069 2,451 3,434 0.41
Source: Authors’ calculations from the World Bank Database.
First of all, the value of NSI is considerably larger than the NPI for nine of the
fourteen countries examined. With the exception of Bangladesh and Pakistan, all
the economies exhibit a coefficient of variation that is higher for the NPI than for
the NSI. In some cases the NPI appears to be extremely volatile, with coefficient of
variations higher than one (see the Philippines, Egypt, Lebanon and China). NSI is
much more stable, with a coefficient of variation that is never higher than Egypt’s
0.43 and it is remarkably low for some countries, notably Nigeria, Morocco,
Mexico, Ukraine and Indonesia.
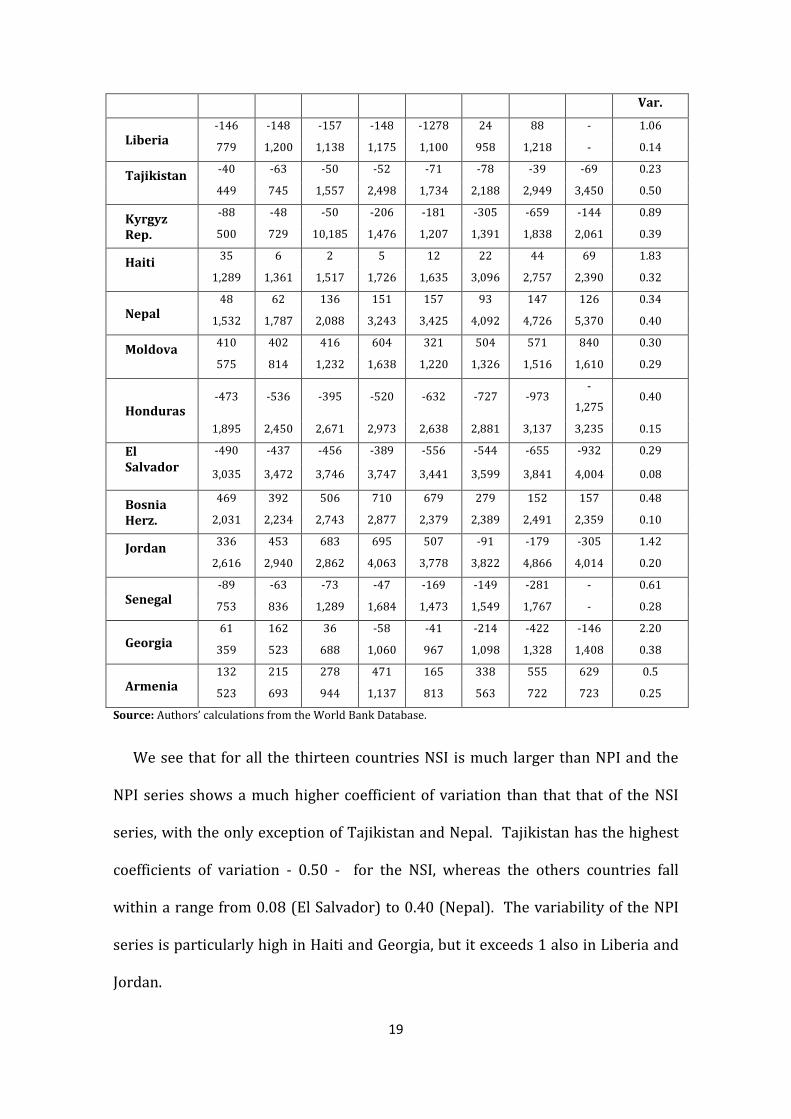
Table 4: NPI and NSI for the countries in Table 2, 2005-2012
(millions of current US$)
Country 2005 2006 2007 2008 2009 2010 2011 2012 Coeff. of
19
Var.
Liberia -146 -148 -157 -148 -1278 24 88 - 1.06
779 1,200 1,138 1,175 1,100 958 1,218 - 0.14
Tajikistan
-40 -63 -50 -52 -71 -78 -39 -69 0.23
449 745 1,557 2,498 1,734 2,188 2,949 3,450 0.50
Kyrgyz Rep.
-88 -48 -50 -206 -181 -305 -659 -144 0.89
500 729 10,185 1,476 1,207 1,391 1,838 2,061 0.39
Haiti
35 6 2 5 12 22 44 69 1.83
1,289 1,361 1,517 1,726 1,635 3,096 2,757 2,390 0.32
Nepal 48 62 136 151 157 93 147 126 0.34
1,532 1,787 2,088 3,243 3,425 4,092 4,726 5,370 0.40
Moldova
410 402 416 604 321 504 571 840 0.30
575 814 1,232 1,638 1,220 1,326 1,516 1,610 0.29
Honduras -473 -536 -395 -520 -632 -727 -973
-
1,275 0.40
1,895 2,450 2,671 2,973 2,638 2,881 3,137 3,235 0.15
El Salvador
-490 -437 -456 -389 -556 -544 -655 -932 0.29
3,035 3,472 3,746 3,747 3,441 3,599 3,841 4,004 0.08
Bosnia Herz.
469 392 506 710 679 279 152 157 0.48
2,031 2,234 2,743 2,877 2,379 2,389 2,491 2,359 0.10
Jordan
336 453 683 695 507 -91 -179 -305 1.42
2,616 2,940 2,862 4,063 3,778 3,822 4,866 4,014 0.20
Senegal -89 -63 -73 -47 -169 -149 -281 - 0.61
753 836 1,289 1,684 1,473 1,549 1,767 - 0.28
Georgia 61 162 36 -58 -41 -214 -422 -146 2.20
359 523 688 1,060 967 1,098 1,328 1,408 0.38
Armenia 132 215 278 471 165 338 555 629 0.5
523 693 944 1,137 813 563 722 723 0.25
Source: Authors’ calculations from the World Bank Database.
We see that for all the thirteen countries NSI is much larger than NPI and the
NPI series shows a much higher coefficient of variation than that that of the NSI
series, with the only exception of Tajikistan and Nepal. Tajikistan has the highest
coefficients of variation - 0.50 - for the NSI, whereas the others countries fall
within a range from 0.08 (El Salvador) to 0.40 (Nepal). The variability of the NPI
series is particularly high in Haiti and Georgia, but it exceeds 1 also in Liberia and
Jordan.
20
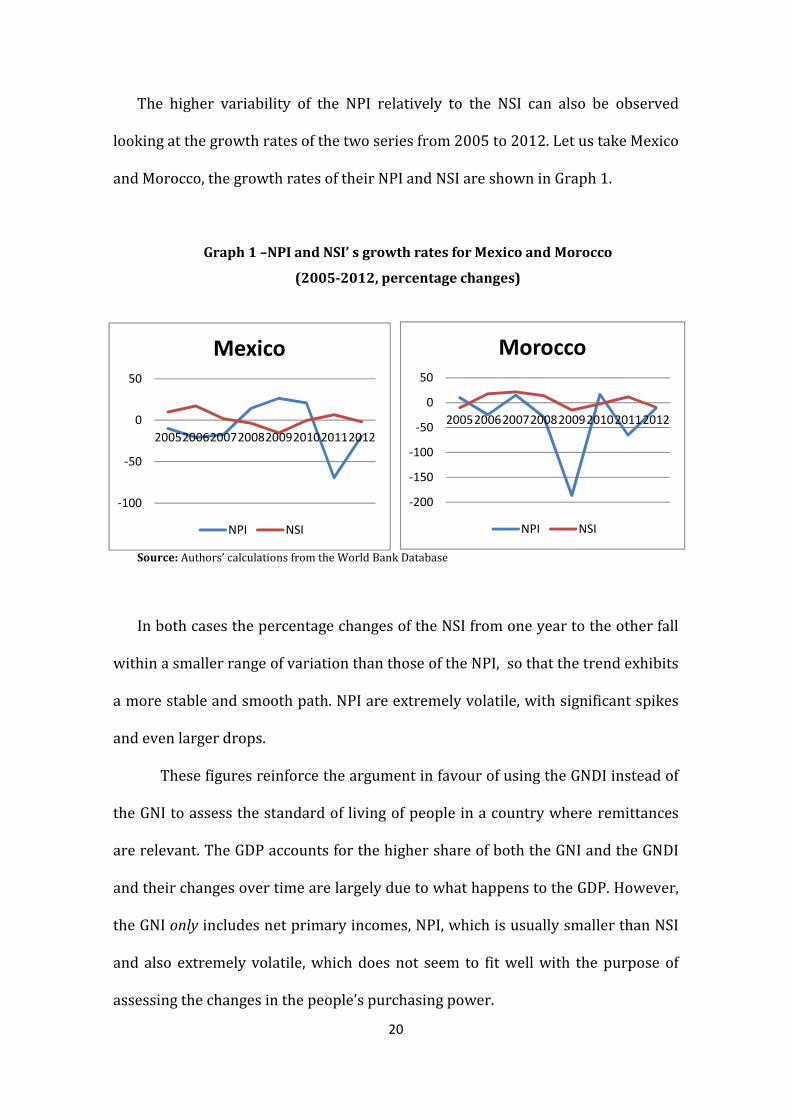
The higher variability of the NPI relatively to the NSI can also be observed
looking at the growth rates of the two series from 2005 to 2012. Let us take Mexico
and Morocco, the growth rates of their NPI and NSI are shown in Graph 1.
Graph 1 –NPI and NSI’ s growth rates for Mexico and Morocco
(2005-2012, percentage changes)
Source: Authors’ calculations from the World Bank Database
In both cases the percentage changes of the NSI from one year to the other fall
within a smaller range of variation than those of the NPI, so that the trend exhibits
a more stable and smooth path. NPI are extremely volatile, with significant spikes
and even larger drops.
These figures reinforce the argument in favour of using the GNDI instead of
the GNI to assess the standard of living of people in a country where remittances
are relevant. The GDP accounts for the higher share of both the GNI and the GNDI
and their changes over time are largely due to what happens to the GDP. However,
the GNI only includes net primary incomes, NPI, which is usually smaller than NSI
and also extremely volatile, which does not seem to fit well with the purpose of
assessing the changes in the people’s purchasing power.
-100
-50
0
50
20052006200720082009201020112012
Mexico
NPI NSI
-200
-150
-100
-50
0
50
20052006200720082009201020112012
Morocco
NPI NSI

21
NSI is much larger and much more stable than the NPI and helps to compensate
for the NPI’s higher volatility. But the GNI does not include the largest and most
stable type of incomes from abroad, hence does not seem to be the most
informative indicator about how living standards develop over time. On the
contrary GNDI includes both the Net Primary and the Net Secondary Income and
offers a more exhaustive and reliable picture about how incomes and their sources
evolve along time.
These figures show that in many developing countries the GNDI provides a
much more reliable assessment of the standard of living than either the GDP or the
GNI and it should be directly available in international datasets and reports.
Notice that - as can be seen in the Appendix - a remarkable difference between
GNDI and GNI exists in all three developing countries groups: Low, Lower-Middle
and Upper-Middle Income countries- and in some High Income country too.
The next section shows broader considerations on the balance of payments for
countries receiving huge inflows of remittances.
4 REMITTANCES, TRADE ACCOUNT AND CURRENT ACCOUNT BALANCE
Tables 5 and 6 show data on Remittances, Trade Balance and Current Account
Balance for the 27 countries analysed in Section 3. The data on remittances are in
millions of US dollars, current value in 2012. The other three columns refer to
remittances, Trade Account and Current Account as shares of countries’ GDP.

22
Table 5: Countries among top remittance receivers. Remittances, Trade Balance and Current Account Balance (2012, millions of current US$ and % GDP)
Country Remittances Remittances
(% GDP) Trade Balance
(% GDP) CA Balance
(% GDP)
Bangladesh 14,084 12.10% (-)8.65% (+)2.3%
Nigeria 20,633 7.86% (+)7.88% (+)7.8%
Pakistan 14,007 6.22% (-)7.59% (-)0.9%
Morocco 6,507 6.78% (-)15.29% (-)10%
Philippines 24,641 9.85% (-)4.51% (+)2.8%
Egypt 19,236 7.31% (-)7.69% (-)2.7%
Lebanon 6,918 16.1% (-)10.99% (-)3.9%
Vietnam* 8,600 6.35% (-)2.53% (+)0.19%
India 68,820 3.70% (-)7.32% (-)4.9%
Mexico 23,365 5.84% (-)1.21% (-)1.2%
Ukraine 8,449 4.79% (-)8.39% (-)8.4%
Poland 6,935 1.42% (-)0.15% (-)3.7%
Indonesia 7,212 0.82% (-)0.25% (-)2.7%
China 39,221 0.48% (+)2.82% (+)2.3%
Source: Authors’ calculations from the World Bank Database
For six countries, Nigeria, Mexico, Ukraine, Poland, Indonesia and China
the Trade and the Current Accounts do not differ much and for only two countries
the Trade Balance is positive, namely Nigeria and China.
All other countries have significant trade deficits, however thanks to
remittances, the current accounts are much less severe and for three countries -
Bangladesh, the Philippines and Vietnam- the trade deficit becomes a current
account surplus.
In Indonesia and Poland the Trade Balance shows a slight deficit and is

23
better than the Current Account Balance. From Table 1, we can see that this is due
to large outflows of income payments, which are not offset by the inflows of
unilateral transfers.
For all the countries where remittances have high weight on GDP the surpluses
in secondary incomes provide a major contribution to bring down the Current
Account deficits to manageable values, the only exception being Morocco with a
deficit of 10%. Let us now examine the countries of Table 2.
Table 6: Countries among top remittance receivers. Remittances, Trade Balance
and current Account Balance (2012, millions of current US$, % GDP)
Country Remittances Remittances
(% GDP) Trade Balance
(% GDP) CA Balance
(% GDP)
Liberia* 360 23.4% (-)65.84% (-)49.1%
Tajikistan 3,625 47.5% (-)47.55% (-)3.2%
Kyrgyz Rep. 2,031 31.37% (-)51.7% (-)22.1%
Haiti 1,612 20.55% (-)35.79% (-)4.4%
Nepal 4,793 24.99% (-)25.94% (+)3%
Moldova 1,786 24.63% (-)40.61% (-)6.8%
Honduras 2,909 15.78% (-)19.24% (-)8.6%
El Salvador 3,927 16.46% (-)18.14% (-)5.3%
Bosnia Herz. 1,848 10.58% (-)23.75% (-)9.3%
Jordan 3,573 11.52% (-)30.31% (-)18.4%
Senegal** 1,478 11.43% (-) 15.37% (-)4.6%
Georgia 1,770 11.24% (-)19.76% (-)11.7%
Armenia 2,122 21.33% (-)24.72% (-)11.1%
Source: Authors’ calculations from the World Bank Database.
All these countries are characterised by tremendous trade deficits, which

24
clearly describe how weak their economies are in the international markets.
However, they also benefit from very high remittances relatively to the GDP; thus
unilateral transfers from abroad not only sustain people’s purchasing power, but
they also contribute in a decisive way to the Balance of Payments. Apart from
Nepal, all countries have Current Account deficits, but they are less outrageous
than the trade ones, and only for three countries -Liberia, the Kyrgyz Republic and
Jordan- the Current Account deficits are extremely high and well above 10%.
For all these countries it is thanks to a positive and large Net Secondary
Income-mainly due to remittances- that the net position to abroad does not get
excessively weak, despite their very poorly diversified economies and huge trade
deficits.
The Current Account and the Trade Account. A few more considerations
on the two accounts. The Current Account Balance (CAB) is the sum of three
elements: i) the Trade Balance (TB), namely the difference between exports (X)
and imports (M); ii) the Net Primary Income (NPI); iii) the Net Secondary Income
(NSI):
CAB = (X-M) + NPI + NSI.
The CAB is commonly regarded as a very important element for the
assessment of the macroeconomic conditions of a country and of its external
position. Imbalances in the international position of an economy are usually
related to surplus/deficits in the CAB. In particular the CAB to GDP ratio is quite
often regarded as the key element to gauge the sustainability of the external

25
position of a country. However, for many developing countries the Current
Account Balance is also greatly influenced by primary and secondary income
movements. In an open developing country TB and CAB provide very different
information.
The balance of the current account determines the change in the net asset
position of a country with the rest of the world, whether or not it is more or less
indebted than before. This is of course quite important, but we have seen that for
many of our 27 countries the CAB gives a sort of rather reassuring picture of their
external position, which however is largely due to Secondary Income inflows and
in particular to remittances. Therefore, the Current Account provides a misleading
view of these countries position in international markets. In order to assess the
strength and the international competitiveness of an economy, it would be much
more appropriate to take into consideration the Trade Balance rather than the
CAB. Only the former balance is really informative about the ability to export and
the import dependence of a country.
Let us now briefly focus on two types of income flows which are very important
component of the Primary Income Account: profit repatriation and interest
payments on foreign debt.
Foreign Direct Investments are a very positive type of inflow to developing
countries, particularly in the ‘greenfield’ version. They generate new productive
capacity and employment and do not create a debt position. The FDIs enter the
country through the Financial Account, formerly known as Capital Account.
However, over the years they might generate an outflow of funds in the form of
profit repatriation through the Current Account, and in particular through the

26
Primary Income Account. All the countries in Table 1 but Lebanon have a negative
and sometime quite large NPI; profit repatriation greatly contributes to this
deficit and might create problems to the Balance of Payments.
Another type of outflow which may contribute to a deficit in the Primary
Income Account is interest payments on foreign debt, a phenomenon that has
characterised many developing countries in the Eighties and Nineties. During the
debt crisis of those decades another concept was largely used: the so-called Non-
Interest Current Account (NICA)17, that is to say the value of the Current Account
net of the payment of interests abroad:
NICA = (NPI + NSI) – iD
With D as the overall foreign debt and i as the average interest rate on it. A
positive NICA is equivalent to the notion of primary surplus in the case of domestic
debt. A primary surplus is regarded as an extremely important indicator for an
economy, as it shows the ability of a country to sustain its budget, were it not for
its pre-existing debt18.
For many developing countries, the NICA plays exactly the same role: the
overall deficit in the Current Account is reduced thanks to a positive NICA.
However, as Tables 1, 2, 5 and 6 show in many countries both the trade balance
and the primary income account, NPI, are in deficit, therefore the relevant
contribution for a surplus in the NICA comes from the secondary income balance,
NSI.
For most of 27 countries it looks as if it is thanks to the exportation of labour
and to the huge inflows of remittances that they can afford to pay dividends and
interests abroad. In other words: labour incomes from abroad pay the
compensations for the previous importation of either physical or financial capital.

27
Not an ideal type of arrangement, which at the very least shows that those capital
inflows have not yet generated enough additional domestic employment to
prevent huge migration flows.
5 NATIONAL ACCOUNTS AND THE THREE INDICATORS
We have seen that:
1. the GDP refers to the productive strength of an economy;
2. the GNI represents the productive strength of the resident factors of
production, no matter where they are employed;
3. the GNDI regards the income that is actually available to a country’s resident
citizens, no matter who has generated it and where.
The first three points below show why in some relevant cases the GNDI should
replace the GNI. Points 4 deals with some implications for the Current Account
1. The Human Development Index (HDI). The GNI per capita in PPP is now
used to assess the economic component of the HDI, however it does not include
unilateral transfers, foreign aid and most importantly remittances, two items
which play an important role in enhancing the standard of living in developing
countries.
The GNDI includes all types of income inflows therefore it is a more useful
indicator of the income available to a country’s residents and should replace the
GNI for building the HDI19.

28
2. Income classifications for economies. The World Bank classifies the
countries into four income groups, according to three thresholds that are
expressed in terms of GNI per capita (World Atlas method) and updated every year
to account for inflation.
The adoption of the GNDI (calculated on the basis of the World Atlas method)
instead of the GNI to define the thresholds would probably lead to minor changes.
However, the choice of the indicator depends on the purpose of the analysis. If the
aim is to assess the standard of living of a population and its ability to consume
and to save, then the GNDI per capita should be adopted. If, on the other hand, the
thresholds are meant to capture to the ‘strength’ or ’weakness’ of a country in the
international economy and trade, then the GDP per capita would be a better tool.
The GNI does not look as the most insightful to evaluate a country position with
respect either to the first or to the second purpose.
3. The poverty lines. Another very important threshold is the so-called
international poverty line of 1.25US$ a day (currently referring to 2005 PPP
prices). This concept is the basis for the First Millennium Goal, according to which
the number of people living in absolute poverty should be reduced at least by 50
per cent by 2015, with respect to the 1990 situation.
The World Bank method to set the poverty line is based on households’
consumption (using consumption surveys) and not on income20. Therefore no
problem of choosing among the three indicators would arise; however, it is clear
that the income actually available to the households of a country influences their
expenditure pattern. Without unilateral transfers, effective consumption might be
lower, therefore GNDI should also be linked to the field of poverty measurement

29
(see Adams and Page 2003: 2029).
The story is the same for the Multidimensional Poverty Index, developed by the
Oxford Poverty and Human Development Initiative (OPHI) since 2010. The three
dimensions and ten indicators in the index do not include income and living
standards are assessed in terms of deprivation with respect to six ”basic needs”
(see Alkire et al 2013). However, in many Low and Middle Income economies
deprivation would be higher without a (largely) positive Net Secondary Income
Account, which is captured by the GNDI.
4. Remittances and the external accounts. For the Balance of Payments large
net remittances represent both a blessing and a curse. First the positive side;
remittances may have positive effects on both macro and micro aspects. Take the
macro level first. Remittances help to ease the trade deficit, without creating new
foreign debts. Remittances have been much more resilient than other financial
flows following the economic crisis which started in 2007, and they play an
counter-cyclical role in the recipient country (Bettin et al. 2013:13). Moreover,
they usually increase following natural and human-made disasters and in a way
improve the country macro stability, therefore her creditworthiness (Sirkeci et al.
2012: 2-4).
At the households’ level, remittances sustain people’s income easing the
burden of poverty and provide a larger possibility for consumption and saving by
local people. These additional funds may be employed in the education of the
youngsters, in better health and diet, thus they lead to an improvement in human
development. Remittances may also be used in the improvement of small
agricultural and business activities21.

30
However, remittances might lead to two shortcomings. First, remittances may
have a negative impact at the macro level by leading to an appreciation of the
exchange rate that will make the economy less competitive (Fajnzylber and Lopez
2007:12).
Second, remittances contribute to increase domestic demand, in particular
domestic consumption, consequently domestic absorption, without necessarily
enhancing the domestic productive capacity. In many countries with large outflows
of migrants the productive structure is still very weak, with a very undiversified
productive and export basis. This implies that the domestic economy cannot
sustain higher consumption standards and this may easily result in an increase in
imports, thus worsening the trade balance. Remittances may lead to a kind of
‘Dutch Disease’ phenomenon, in which thanks to some sort of outside bonanza
domestic incomes are higher than the corresponding productive structure and this
can lead to a surge in the prices of both tradable and non-tradable commodities.
When they enter the country remittances help to pay for the trade deficit, but
they can also contribute to generate an even larger one in the future.
6 CONCLUSION
During the last twenty years, a huge process of income re-distribution has been
taking place worldwide. In today’s globalised world only the notion of Gross
National Disposable Income, (GNDI) captures a population’s purchasing power at
its full extent and it is a much better indicator than the GNI to assess the income
available to the residents of a country and to provide information their standard of
living.

31
We have also seen that contrary to a common held view in developing
countries GNI is not higher than GDP, precisely because of the large income flows
to abroad, which quite often result in a negative Net Primary Income.
The GDP is the best way to account for a country’s productive strength and the
Trade Account provides the most informative indication of her competitiveness in
the international markets. GNDI and the analysis of the Current Account and its
components can provide a very useful guide for development policies.
A first set of recommendations regards the importance of a more
extensive data coverage that should regularly include GNDI. This indicator
provides information that are different and complementary to those involved in the
GDP and should become an indicator readily available in national accounts and in
international datasets.
National datasets should be adapted to the standards of the 2008 System of
National Accounts and of the 2009 Balance of Payments Manual, in particular with
respect to the countries’ external position. The distinction between the primary
and the secondary distribution of income helps to analyse more in detail the relation
between the Trade and the Current Account Balances and to give a more precise
evaluation of a country external position. As we have seen, unilateral transfers -
foreign aid and remittances- are very likely to ameliorate the international position,
particularly in Low Income Countries.
A second set of recommendations is more related to the role of
remittances. In most developing countries a frail productive structure and the
labour market represent the two major areas on which development policies

32
should focus. In each country the difference between GNDI and GDP-GNI shows that
there are relevant financial sources which could be added to domestic savings and
investments.
The analysis of the Balance of Payments carried on this paper provides
additional arguments to analyze the various ways to improve the link between
remittances and economic growth, a topic that has already received a lot of
attention (see Katseli, Lucas and Xenogiani 2006: 25-7 and 48-ff. and Driffield, N.
and Jones, C. 2013:180-ff). Remittances might increase import dependence, but
policy makers should focus on how to channel remittance inflows into capital
accumulation and domestic productive investment, in particular non-building
investment, and try to avoid ‘Dutch disease’ effects.
It is very important to find policies to foster small business and local
entrepreneurship. Remittances could be used as a sort of collateral to facilitate
access to local credit markets and to reduce interest rates. They already play the
role of insurance against possibly adverse business shocks: a small entrepreneur
might be prepared to enlarge his business because he knows that someone abroad
will help him in case the cash-flow is either smaller than expected or too much
delayed.
All this requires more involvement of the diasporas into local productive
activities. Possibilities range from multiple citizenship to partial return initiatives
to the use of international currency in local transaction; from keeping accounts in
foreign currency at local banks, to the coordination between the destination and
the home country.

33
It is not easy to promote FDIs in the first place, but it may be even more
complicated to convince foreign firms to reinvest profits in the local economy, thus
avoiding outflows in the primary Income Account. This requires appropriate
industrial and national policies; not an easy task, but these elements have been and
still are part of development strategies in many Middle Income countries,
particularly in Asia.
Long-term migration might be a matter of choice and of a larger set of
opportunities, but in most of the 27 countries we have examined migration looks
very much as a necessity, because very few options are available. Remittances are
the outcome of structurally weak economies that do not generate enough jobs.
However, remittances and Net Secondary Income in general may be a very
important ‘buffer’ item in the Balance of Payments. The ‘buffer’ has both a time and
a size component.
On the one hand, a 10 percent difference between GNDI and GNI-GDP shows
that there is a very important ‘buffer’ item which may help to ‘buy time’ for the
improvement of the productive capacity of a country. A positive NSI compensates
for a trade deficit and negative net income flows (NPI) but above all it offers time to
improve the productive structure provided that these net unilateral transfers are
channelled into investments. Remittances and international aid make Balance of
Payments deficits less problematic and avoid the building up of foreign debt.
On the other hand, the difference between GNDI and GNI-GDP provides an
indication of the possible maximum addition to domestic productive investments. If
most of secondary incomes were used to improve the economy productive
capacity the investment ratio could raise by several points.
The issues of migration and of decent work have entered the post-2015

34
debate and appear in the preparatory documents (see World Bank 2014b: 11-12).
Free movement of labour is a very important aim, but the creation of enough
decent jobs is a priority in most developing economies.

35
ENDNOTES
1 On the limits of the concept of GDP and on wellbeing, see the Report of the Commission on The
Measurement of Economic Performance and Social Progress of 2008 by Stiglitz, Sen and Fitoussi and
the 2013 World Happiness Report edited by Helliwell, Layard and Sachs. On the concept of
sustainable wellbeing, see Dasgupta and Duraiappah, 2012: 15, 18, 23.
2 On problems related to the provision of proper data and indicators see Morten 2013.
3 Pigou used ”standard of living”, ”standard of real income”, ”material prosperity” as synonyms for
”economic welfare”, in turn defined as ”the part of social welfare that can be brought directly or
indirectly into relation with the measuring rod of money” (Pigou, 1929:11). Sen specifies that this
approach also dates back to Adam Smith, who wrote at the very beginning of his Wealth of Nations
that ”the nation will be better or worse supplied with the necessaries and conveniences for which it has
occasion”, thus implying a notion of standards of living as opulence or prosperity (Smith, 1776:10).
4 Sweeney made reference to the GNP - Gross National Product - instead of the GNI, but the two
terms are intended to be considered as synonymous.
5 Authors’ calculations on the basis of the database of the Palestinian Central Bureau of Statistics,
PCBS. After 2000 the difference between GDP and GNI has basically halved.
6 Remittances are increasingly better measured and estimated with respect to the past. On the
informal value transfer systems, see for instance Kapur, 2004:8 and Acosta et al 2007:44. On the
transfer mechanisms of remittances and on the initiatives to improve the use of formal channels see
for instance de Luna Martinez 2005: 6-ff.
7 The same is true in other major reports, see for instance the 2012 Global Development Finance or
the 2013 International Debt Statistics.
8 We adopt the classification of the sixth edition of the Balance of Payments Manual, published by
the IMF in 2009. Since 2013 the World Development Indicators report makes reference to this
edition of the IMF BP Manual. The previous editions of the report adopted the 1993 edition of the
IMF Balance of Payments Manual.
9 In 1999 interest payments represented 3% of the GNI of the Severely Indebted Low Income
36
Countries (SILIC) and 8.6% of the value of their exports (World Bank 2002 Vol. 1: 236).
10 It is also known as Net Factor Income (NFI), an expression that was used in the earlier versions of
the IMF Balance of Payments Manual and Systems of National Accounts Manual.
11 In the fifth edition of the BoP Manual, the secondary income was labelled as ”current transfers”;
the primary income was simply referred to as ”income” (see also World Bank 2012b, Table 4.17:
278).
12 NPISH may be NGOs, charities, relief and aid organizations, trade unions, consumers’
associations, religious institutions, cultural and recreational clubs, foundations.
13 ”Remittances” here refer to what the IMF Balance of Payments Manual calls ”personal transfers”.
The Manual also introduces the concept of ”personal remittances”, which is the sum of personal
transfers and compensation of employees (see also World Bank 2014a: 93-4 and the notes to Table
6.13).
14 The data for GNI in the World Bank database are slightly different from the result of GDP + NPI,
which may be due to the fact that GNI also includes product taxes (less subsidies).
15 Very small countries are not included, as for instance Gambia, Guyana, Jamaica, Kosovo, Lesotho,
Samoa, Timor-Leste, Tonga, and Togo. West Bank and Gaza should also be included in Table 2, but
data are not available for 2012. Finally, Bangladesh, Lebanon, and the Philippines have a share of
remittances higher than 10 percent of their GDP, but they are already in Table 1.
16 This phenomenon is consistent with the International Debt Statistics 2013 and the data on the
item called ‘Primary Income on FDIs’, previously known as ‘Profit Remittances on FDIs’ (see World
Bank 2014a, Table 4.17). On the implication profit repatriation and foreign exchange outflows on
the Balance of Payment see Singh 2003: 209.
17 On the importance of the NICA for developing countries, see Vaggi and Prizzon 2013 (in press).
18 The 3% threshold for the overall budget deficit is part of the conditions of the Maastricht treaty.
In most countries of the Euro zone the overall deficit is being reduced thanks to a primary surplus
that (partly) compensates for large interest payments. Following the financial crisis of 2007-2008
and in particular since 2010, growing attention has arisen towards debt indicators for countries of
the Euro zone (see World Bank 2013: 13-5).

37
19 GDP and GNI can be measured with either the Atlas or the PPP method, for a description of the
two methods see World Bank 2014a: 18 and 111. The same could be done with the GNDI.
20 Income-based measurement methods are adopted by Sala-i-Martin (Sala-i-Martin 2006). For
more information on the problems of using either consumption or income see Ravaillon 1998.
21 See for instance the contributions of Fajnzylber, P. and Lopez, H. 2007 and Sirkeci et al. 2012.
BIBLIOGRAPHY
Adams, R.H., and Page, J. (2003). Poverty, Inequality and Growth in Selected Middle
East and North Africa Countries, 1980-2000. World Development, vol. 31, n. 12.
Acosta, P., Fajnzylber, P., and Lopez, J. H. (2007). How Important are Remittances
in Latin America. In Fajnzylber, P. and Lopez, H., editors, Remittances and
Development. Lessons from Latin America. The World Bank, Washington D.C.
Alkire, S., Roche, J., and Seth, S. (2013). Multidimensional Poverty Index 2013,
Oxford.
Bettin, G., Presbitero, A.F. and Spatafora, N. (2013). Remittances and Vulnerability
in Developing Countries. IMF Working Paper n. 14, Washington D.C..
Central Bank of Nigeria (2011). Annual Report.
Central Bank of Poland (2011). Annual Report.
Central Bank of Vietnam (2011). Annual Report.
Dasgupta, P. and Duraiappah, A. (2012). Well-Being and Wealth. In UNU-IHDP and
UNEP, editors, Inclusive Wealth Report 2012. Measuring Progress Towards
Sustainability. Cambridge University Press: Cambridge.
de Luna Martinez, J. (2005). Worker’s Remittances to Developing Countries: A
Survey with Central Banks on Selected Public Policy Issues. World Bank Policy

38
Research Working Paper 3638, June. Washington D.C.
Driffield, N. and Jones, C. (2013). Impact of FDI, ODA and Migrant Remittances on
Economic Growth in Developing Countries: A Systems Approach. European Journal
of Development Research, 25(2):173–196.
Fajnzylber, P. and Lopez, H. (2007). The Development Impact of Remittances in
Latin America, in Fajnzylber, P. and Lopez, H., editors, Remittances and
Development. Lessons from Latin America. The World Bank, Washington D.C.
Helliwell, J., Layard, R., and Sachs, J. (2013). World Happiness Report.
IMF (2009a). Balance of Payments Manual. Sixth Edition. Washington D.C.
IMF (2009b). International Transactions in Remittances. Guide for Compilers and
Users. Washington D.C.
Kapur, D. (2004). Remittances: The New Development Mantra. UNCTAD G-24
Discussion Paper Series, 29.
Katseli, L., Lucas, R.E.B., Xenogiani, T. (2006). Effects of Migration On Sending
Countries: What Do We Know? OECD Development Centre, Working Paper N° 250.
Klugman, J., Rodriguez, F., and Choi, H. (2011). The HDI 2010: New Controversies,
Old Critiques. UNDP Human Development Research Paper, 01.
Kovacevic, M. (2010). Review of HDI Critiques and Potential Improvements. UNDP
Human Development Research Paper, 33.
Mazumdar, P. (2013). Remittances and the Rupee: A Puzzle. Centro Studi Luca
D’Agliano.
Morse, S. (2013). For Better or for Worse, till the Human Development Index Do Us
Part? Ecological Economics, 45(2):281–296.
Morten, J. (2013). Poor Numbers: How We Are Misled by African Development

39
Statistics and What to Do About it. Cornell University Press: Ithaca, NY.
OECD Database. http://stats.oecd.org/.
PCBS (2013). Palestine In Figures 2012. Ramallah.
Pigou, A. (1929). Economics of Welfare. Macmillan:London.
Ravaillon, M. (1998). Poverty Lines in Theory and Practice. Living Standard
Measurement Study Working Paper, 133.
Sala-i-Martin, X. (2006). The World Distribution of Income: Falling Poverty and
Period of Convergence. The Quarterly Journal of Economic., 02(121):351–397.
Sen, A. (1987). The Standards of Living. Cambridge University Press: Cambridge.
Sirkeci, I., Cohen, J., and Ratha, D. (2012). Migration and Remittances during the
Global Financial Crisis and Beyond. The World Bank:Washington D.C.
Singh, A. (2003). Capital Account Liberalization, Free Long-Term Capital Flows,
Financial Crises And Economic Development. Eastern Economic Journal, vol. 29, n°
2, Spring.
Smith, A. (1776). An Inquiry into the Nature and Causes of the Wealth of Nations.
Oxford University Press. Oxford. edited by R.H. Campbell, A.S. Skinner and W.B.
Todd, 1976.
Stiglitz, J., Sen, A., and Fitoussi, J. P. (2008). Report by the Commission on the
Measurement of Economic Performance and Social Progress.
Sumner, A. (2013). Global Poverty, Aid and Middle-Income Countries. Are the
Country Classifications Moribund or is Global Poverty in the Process of
”Nationalizing”? WIDER Working Paper, 062.
Sweeney, P. (1999). The Celtic Tiger: Ireland’s Continuing Miracle Explained. Oak
Tree Press. Dublin.

40
Todaro, M. and Smith, S. (2011). Development Economics. Pearson: Boston.
Eleventh Edition.
UN (2008). Systems of National Accounts. Washington D.C.
UNDP (2010). Human Development Report. New York.
Vaggi, G. and Prizzon, A. (in press). On the Sustainability of External Debt: Is Debt
Relief Enough? Cambridge Journal of Economics.
World Bank (2002). Global Development Finance. Washington D.C.
World Bank (2011). Outlook for Remittance Flows 2012-14. Migration and
Development Brief, (17). Washington D.C.
World Bank (2012a). Global Development Finance. Washington D.C.
World Bank (2012b), World Development Indicators. Washington D.C.
World Bank (2013). International Debt Statistics. Washington D.C.
World Bank (2014a). World Development Indicators. Washington D.C.
World Bank (2014b). Migration and Development Brief, (22). Washington D.C.
World Bank Database. http://data.worldbank.org/english.

41
Appendix
2012 GDP, GNI, AND GNDI FOR ALL WORLD BANK
COUNTRIES
Data are provided by the 2014 World Development Indicators (World Bank, 2014), which
in turn uses the World Bank Database. The GNI results from the sum GDP and NPI. The
GNDI is calculated summing the GDP with the NPI and the NSI.
Table A: GDP, GNI, and GNDI for all the World Bank Countries (millions
current US$)
GDP
NPI
GNI
NSI
GNDI
Afghanistan 20,469 313 20,782 362 21,144
Albania 12,648 -115 12,533 1,121 13,654
Algeria 205,788 -3,874 201,914 3,164 205,078
American Samoa - - - - -
Andorra - - - - -
Angola 114,147 -10,422 103,725 -1,762 101,963
Antigua and Barbuda 1,134 -42 1,092 26 1,118
Argentina 475,501 -11,504 463,997 -447 463,550
Armenia 9,950 629 10,579 723 11,302
Arubaa 2,584 -228 2,356 -115 2,241
Australia 1,532,407 -38,683 1,493,724 -1,426 1,492,298
Austria 394,707 128 394,835 -2,709 392,126
Azerbaijan 66,604 -4,267 62,337 -50 62,287
Bahamas, The 8,149 -263 7,886 11 7,897
Bahrain 30,362 -3,121 27,241 -2,074 25,167
Bangladesh 116,355 -1,814 114,541b 14,548 129,089
Barbados 4,224 -113 4,111 66 4,177
Belarus 63,267 -1,473 61,794 -3,223 58,571
Belgium 483,261 4,068 487,329 -10,085 477,244
Belizea 1,493 -98 1,395 84 1,479

42
Benin 7,557 -16 7,541 142 7,683
Bermuda 5,473 1,379 6,852 -138 6,714
Bhutan 1,779 -77 1,702 243 1,945
Bolivia 27,035 -1,629 25,406 1,266 26,672
Bosnia and Herz. 17,465 157 17,622 2,359 19,981
Botswana 14,504 -501 14,003 1,758 15,761
Brazil 2,252,664 -35,448 2,217,216 2,846 2,220,062
Brunei 16,953 - - - -
Bulgaria 50,972 -1,865 49,107 2,671 51,778
Burkina Faso 10,726 -6 10,720 493 11,213
Burundi 2,472 -7 2,465 447 2,912
Cabo Verde 1,827 -60 1,767 266 2,033
Cambodia 14,038 -742 13,296 484 13,780
Cameroon 25,321 -445 24,876 263 25,139
Canada 1,779,634 -22,473 1,757,161b -3,547 1,753,614
Cayman Islands - - - - -
Central African Rep. 2,184 - - - -
Chad 12,887 - - - -
Channel Islands - - - - -
Chile 269,869 -12,676 257,193 2,192 259,385
China 8,227,102 -42,139 8,184,963 3,434 8,188,397
Colombia 369,606 -15,968 353,638 4,579 358,217
Comoros 595,900 - - - -
Congo, Dem. Rep. 17,203 - - - -
Congo, Rep. 13,677 - - - -
Costa Rica 45,103 -815 44,288 333 44,621
Cote d’Ivoire 24,680 -914 23,766 -439 23,327
Croatia 59,228 -2,033 57,195 1,485 58,680
Cubaa 68,233 - - - -
Curacao - - - - -
Cyprus 22,766 -588 22,178 -277 21,901

43
Czech Republic 196,446 -13,703 182,743 -1,039 181,704
Denmark 315,163 8,389 323,552 -5,961 317,591
Djibouti - - - - -
Dominica 479 -17 462 16 478
Dominican Rep. 59,047 -2,212 56,835 3,373 60,208
Ecuador 84,039 -1,325 82,714 2,486 85,200
Egypt, Arab Rep. 262,831 -6,564 256,267 19,791 276,058
El Salvador 23,864 -932 22,932 4,004 26,936
Equatorial Guinea 17,697 - - - -
Eritrea 3,091 - - - -
Estonia 22,390 -1,266 21,124 306 21,430
Ethiopia 41,605 -97 41,508 5,248 46,756
Faeroe Islands - - - - -
Fiji 3,907 -152 3,755 212 3,967
Finland 247,545 -362 247,183 -1,723 245,460
France 2,612,878 38,199 2,651,077 -46,416 2,604,661
French Polynesia - - - - -
Gabon 18,377 - - - -
Gambia 907 -19 888 182 1,070
Georgia 15,747 -146 15,601 1,408 17,009
Germany 3,428,130 82,763 3,510,893 -47,438 3,463,455
Ghana 40,710 -2,131 38,579 2,550 41,129
Greece 249,098 -2,048 247,050 1,872 248,922
Greenland - - - - -
Grenada 766 -38 728 24 752
Guam - - - - -
Guatemala 50,233 -1,298 49,935 5,645 54,580
Guinea 5,631 -122 5,509 132 5,641
Guinea Bissau 822 -2 820 60 880
Guyana 2,850 -1 2,849 419 3,268
Haiti 7,843 69 7,912 2,390 10,302
Honduras 18,434 -1,275 17,159 3,235 20,394
Hong Kong, SAR 263,259 5,605 268,864 -2,778 266,086
Hungary 124,600 -8,246 116,354 476 116,830

44
Iceland 13,578 -1,494 12,084 -81 12,003
India 1,858,740 -20,843 1,837,897 65,435 1,903,332
Indonesia 878,043 -25,947 852,096 4,029 856,125
Iran, Islamic Rep. 552,397 - - - -
Iraq 215,837 1,059 216,896 -5,112 211,784
Ireland 210,771 -39,996 170,775 -1,538 169,237
Isle of Man - - - - -
Israel 257,621 -8,020 249,601 8,377 257,978
Italy 2,014,699 -9,798 2,004,901 -19,897 1,985,004
Jamaica 14,755 -434 14,321 2,048 16,369
Japan 5,961,065 179,191 6,140,256 -14,345 6,125,911
Jordan 31,015 -305 30,710 4,014 34,724
Kazakhstan 203,520 -28,191 175,329 -1,005 174,324
Kenya 40,697 -171 40,526 2,812 43,338
Kiribati 174,984 200 - - -
Korea, Dem. R. - - - - -
Korea, Rep. 1,129,598 4,886 1,134,484 -2,764 1,131,720
Kosovo 6,445 199 6,644 1,533 8,177
Kuwait 183,242 9,192 192,434 -17,220 175,214
Kyrgyz Rep. 6,474 -144 6,330 2,061 8,391
Lao PDR 9,147 -118 9,029 252 9,281
Latvia 28,372 -502 27,870b 819 28,689
Lebanon 42,945 391 43,336 2,667 46,003
Lesotho 2,447 201 2,648 865 3,513
Liberia 1,733 88 1,821b 1,218 3,039
Libya - -1,932
-2,824
Liechtenstein - - - - -
Lithuania 42,343 -1,755 40,588 1,254 41,842
Luxembourg 55,178 -17,113 38,065 -1,147 36,918
Macao SAR 43,582 -5,819 37,763 -1,134 36,629
Macedonia, FYR 9,612 -190 9,422 2,095 11,517
Madagascar 9.,975 - - - -
Malawi 4,263 -111 4,152 448 4,600
Malaysia 305,032 -11,642 293,390 -5,904 287,486
Maldives 2,222 -338 1,884 -242 1,642
Mali 10,387 -419 9,968 538 10,506

45
Malta 8,721 -526 8,195 82 8,277
Marshall I. 182 - - - -
Mauritania 4,199 - - - -
Mauritius 10,486 145 10,631 142 10,773
Mexico 1,178,126 -22,866 1,155,260 22,559 1,177,819
Micronesia F.S. 326 - - - -
Moldova 7,252 840 8,092 1,610 9,702
Monacoa 6,074 - - - -
Mongolia 10,271 -948 9,323 239 9,562
Montenegro 4,373 70 4,443 174 4,617
Morocco 95,981 -2,283 93,698 7,387 101,085
Mozambique 14,243 -13 14,230 403 14,633
Myanmar - - - - -
Namibia 13,072 -478 12,594 1,322 13,916
Nepal 18,962 126 19,088 5,370 24,458
Netherlands 770,555 22,517 793,072 -16,160 776,912
New Caledonia - - - - -
New Zealand 171,281 -7,653 163,628 -422 163,206
Nicaragua 10,507 -301 10,206 1,310 11,516
Niger 6,773 -47 6,726 448 7,174
Nigeria 262,597 -22,238 240,359 21,906 262,265
North. Mariana I. - - - - -
Norway 500,029 10,679 510,708 -5,565 505,143
Oman 78,110 -4,304 73,806 -8,086 65,720
Pakistan 225,143 -3,391 221,752b 18,571 240,323
Palau 228 - - - -
Panama 36,252 -2,656 33,596 81 33,677
Papua N.G. 15,653 -592 15,061 190 15,251
Paraguay 25,502 -1,401 24,101 759 24,860
Peru 203,790 -12,701 191,089 3,296 194,385
Philippines, The 250,182 -746 249,436b 19,172 268,608

46
Poland 489,795 -22,670 467,125 5,139 472,264
Portugal 212,273 -8,913 203,360 4,809 208,169
Puerto Rico 101,495 - - - -
Qatar 192,390 -12,130 180,260 -14,481 165,779
Romania 169,396 -3,877 165,519 4,417 169,936
Russian Fed. 2,014,774 -67,661 1,947,113 -6,133 1,940,980
Rwanda 7,103 -74 7,029 722 7,751
Samoa 683 -39 644 173 817
San Marino - - - - -
Sao Tome and P. 263 -3 260 14 274
Saudi Arabia 711,049 10,989 722,038 -30,438 691,600
Senegal 14,045 -281 13,764 1,767 15,531
Serbia 37,488 -1,034 36,454 3,775 40,229
Seychelles 1,128 -61 1,067 24 1,091
Sierra Leone 3,796 -133 3,663 236 3,899
Singapore 274,701 -3,136 271,565 -6,731 264,834
Sint Maarten - - - - -
Slovak Republic 91,148 -2,123 89,025 -830 88,195
Slovenia 45,279 -706 44,573 26 44,599
Solomon Islands 1,008 -81 927b 100 1,027
Somalia - - - - -
South Africa 384,312 -8,902 375,410 -3,801 371,609
South Sudan 10,220 - - - -
Spain 1,322,964 -24,086 1,298,878 -5,275 1,293,603
Sri Lanka 59,423 -1,236 58,187 5,392 63,579
St. Kitts and N. 767 -31 736 47 783
St.Lucia 1,238 -14 1,224 18 1,242
St.Martin - - - - -
St. Vincent 712 -12 700 7 707
Sudan 58,768 -1,605 57,163 863 58,026
Suriname 5,012 -197 4,815 73 4,888
Swaziland 3,744 -314 3,430 975 4,405

47
Sweden 523,942 13,151 537,093 -9,348 527,745
Switzerland 631,153 13,022 644,175 -12,743 631,432
Syrian Arab Rep.a 73,700 -1,514 72,186 949 73,135
Tajikistan 7,632 -69 7,563 3,450 11,013
Tanzania 28,242 -291 27,951 791 28,742
Thailand 365,965 -16,247 249,718 12,216 361,934
Timor-Leste 1,293 3,875 5,168 425 5,593
Togo 3,813 -23 3,790 356 4,146
Tonga 471 12 483 68 551
Trinidad and T. 23,320 -3,074 20,246 33 20,279
Tunisia 45,662 -1,721 43,941 2,149 46,090
Turkey 789,257 -7,157 782,100 1,383 768,717
Turkmenistan 35,164 - - - -
Turks and Caicos Isl. - - - - -
Tuvalu 39,875 - - - -
Uganda 20,032 -588 19,444 1,261 20,705
Ukraine 176,308 -2,965 173,343 2,976 176,319
UAE 383,799 - - - -
United Kingdom 2,475,781 3,525 2,479,306b -36,291 2,443,015
United States 16,244,600 223,924 16,468,524 -129,736 16,338,788
Uruguay 49,919 -1,465 48,454 91 48,545
Uzbekistan 51,112 - - - -
Vanuatu 787 -44 743 17 760
Venezuela, RB 381,286 -10,048 371,238 -978 370,260
Vietnam 155,820 -6,115 149,705 8,212 157,917
Virgin Islands - - - - -
WB and Gaza - 1,217 - 1,320 -
Yemen, Rep. 35,645 -2,552 33,093 2,134 35,227
Zambia 20,590 -1,125 19,465 454 19,919
Zimbabwe 9,802 - - - -
a Data referring to 2011. b For these economies, the datum on GNI as provided by the World Bank Database appears to be considerably different from the result of GDP + NPI.