why is the capital market opening up and stock price
TRANSCRIPT

Journal of Economics and Public Finance
ISSN 2377-1038 (Print) ISSN 2377-1046 (Online)
Vol. 6, No. 2, 2020
www.scholink.org/ojs/index.php/jepf
38
Original Paper
Why is the Capital Market Opening up and Stock Price
Linkage?—Empirical Research Based on “Land-Hong Kong
Stock Connect”
Ji Yuxi1*
1 School of Economics and Management, Harbin Engineering University, Heilongjiang 150000, China
Received: March 10, 2020 Accepted: March 21, 2020 Online Published: March 25, 2020
doi:10.22158/jepf.v6n2p38 URL: http://dx.doi.org/10.22158/jepf.v6n2p38
Abstract
Based on the quarterly data of all A-share listed companies from 2011 to 2019, this article uses the
multi period double difference model to explore the causes and transmission mechanism of the linkage
effect of the stock prices of the two cities after the implementation of the “Land-Hong Kong Stock
Connect”. The results show that: first, after the implementation of “Land-Hong Kong Stock Connect”,
the degree of herd behavior of domestic investors as a whole becomes higher, and the larger the
company scale is, the higher the degree of herd behavior of investors is; secondly, after the
implementation of “Land-Hong Kong Stock Connect”, all listed companies have the behavior of
internal investors imitating external investors, especially small and medium-sized companies; finally,
from the overall sample From the point of view, the imitation behavior of internal investors is indeed
conducted through the investor network, but it is divided into three categories: large, medium and
small companies. Only the imitation transmission path of large companies is the investor network, and
small and medium companies do not realize the imitation behavior through the network. The research
of this article is helpful to appeal for rational investment of investors and provide empirical evidence
support for further opening of capital market.
Keywords
Land-Hong Kong Stock Connect, herd behavior, imitation theory, investor network density
1. Introduction
Herding behavior in financial market is a kind of special irrational behavior, which means that investors
tend to ignore their valuable private information and follow the decision-making mode of most people
in the market. Herding behavior shows that in a certain period, a large number of investors adopt the

www.scholink.org/ojs/index.php/jepf Journal of Economics and Public Finance Vol. 6, No. 2, 2020
39 Published by SCHOLINK INC.
same investment strategy or have the same preference for specific assets. One of the biggest
characteristics of herding behavior is that investors imitate each other. The imitation theory was first
developed by Jean Gabriel Tarde pointed out that imitation is the most basic social relationship, and
society is a group of individuals who imitate each other. Because of the characteristics of China’s
capital market, herd behavior is very significant in China.
In order to promote the opening of the capital market and improve the phenomenon of irrational
imitation in China, China has successively promulgated the Interim Measures for the administration of
domestic securities investment by qualified overseas institutional investors (referred to as QFII), the
pilot measures for domestic securities investment by fund management companies and RMB qualified
overseas institutional investors of securities companies (referred to as RQFII), and officially launched
in November 2014 Shanghai Hong Kong Stock Exchange interconnection mechanism pilot (hereinafter
referred to as the “Shanghai-Hong Kong stock connect”) was officially launched in December 2016
(hereinafter referred to as the “Shenzhen-Hong Kong stock connect”). In this article, the “Shanghai
Hong Kong stock connect” and “Shenzhen-Hong Kong stock connect” is collectively referred to as
“Land-Hong Kong stock connect”, which will not be described in detail later). The implementation of
“Land-Hong Kong stock connect” is another important attempt and Exploration on the road of capital
market opening in China after QFII, RQFII and other systems. At the same time, it also provides a good
quasi natural experimental environment for the study of the effect of capital market opening. Although
the implementation of “Land-Hong Kong Stock Connect” is conducive to promoting the integration of
China’s capital market and international capital market, it also inevitably brings about the problem of
volatility risk of stock price linkage. Now a large number of literature studies have shown that the
implementation of “Land-Hong Kong Stock Connect” will increase the stock price linkage between
land port and Hong Kong, but the research on the underlying causes of stock price linkage between the
two places still exists There is a certain blank. At the same time, overseas institutional investors are
considered to have professional teams and have strong ability to obtain and analyze information. Under
the condition of information asymmetry, domestic investors may choose to imitate the investment
behavior of overseas investors. Is the reason for the stock price linkage after the implementation of
“Land-Hong Kong Stock Connect” due to the increase of domestic herding behavior? Is it true that
domestic investors imitate foreign investors? This is an important issue in this article.
At the same time, the investor network is one of the important ways for investors to obtain information.
Investors can obtain information through the network, observe and imitate the investment behavior of
others. Foreign institutional investors have strong ability to obtain and analyze information, which
makes it possible for domestic investors to imitate the investment behavior of foreign investors through
the network. Therefore, this article further studies whether the internal investors realize their own
imitation behavior through the transmission mechanism of investor network.
The results of this study show that: after the implementation of Land-Hong Kong Stock Connect, the
degree of herd behavior of the whole investors in China has become higher, and the larger the company

www.scholink.org/ojs/index.php/jepf Journal of Economics and Public Finance Vol. 6, No. 2, 2020
40 Published by SCHOLINK INC.
scale is, the higher the degree of herd behavior of investors is; at the same time, there are behaviors of
internal investors imitating external investors in all listed companies, but only the imitation
transmission path of large companies is the investor network, and the imitation path of small and
medium-sized companies has not yet been. It can be seen that further research is needed.
The contribution of this article is as follows: firstly, this article deeply studies the causes of stock price
linkage between Hong Kong and land, fills in the gap in the causes of linkage effect, and further
deepens the understanding of stock price linkage effect between Hong Kong and land; secondly, this
article further explores the transmission path of imitation behavior, and provides some ideas and
methods for the follow-up study of this issue. In addition, as an important national pilot project, it is of
great practical significance to comprehensively analyze its policy effect. The conclusion of this article
provides some enlightenment for calling for rational investment of investors and further opening of
capital market.
The follow-up arrangement of this article is as follows: the second part reviews relevant literature and
puts forward hypothesis, the third part describes model and research design, the fourth part is empirical
results and analysis, and the last part is conclusion and enlightenment.
2. Literature Review and Research Hypotheses
2.1 Herd Behavior in China’s Capital Market
Compared with overseas developed capital markets, China’s capital market has its own characteristics:
the information disclosure system is not perfect, the information is severely asymmetric (Peng, 2000),
there are more retail investors among investors, and the speculative atmosphere is heavier (Guo & Wu,
2004), in addition to the fund manager’s pursuit of reputation, herd instincts (Song & Wu, 2001), these
have provided a petri dish for the breeding of herd behavior, so in China, blindly imitating the trend
Phenomenon occurs from time to time. In order to promote the opening of China’s capital market and
improve domestic irrational investment behavior, on November 5, 2002, the “Interim Measures for the
Administration of Domestic Securities Investment by Qualified Foreign Institutional Investors” was
officially promulgated. The scale of assets managed by institutional investors began to increase. Its
market share is also increasing. Institutional investors are generally considered to have a professional
team and strong information analysis and processing capabilities, which can improve the efficiency of
stock pricing (Li et al., 2011; Bae et al., 2012; Shi et al., 2009; Rao, 2013), This can alleviate domestic
herd behavior, but existing research shows that QFII’s entry into the Chinese market has not eased herd
behavior in China. Like domestic institutional investors, QFII’s herd behavior is also very significant
(Liu et al., 2007; Li et al., 2008), the reason why QFII showed significant herd behavior may be that
China’s capital market was not yet open, the channels for foreign investors to collect information were
single, and the information disclosure system of domestic listed companies was incomplete, which led
to the concentration of external investors. Invest in listed companies with more standard information
disclosure (Liu et al., 2007). Compared with small companies, large companies generally have more

www.scholink.org/ojs/index.php/jepf Journal of Economics and Public Finance Vol. 6, No. 2, 2020
41 Published by SCHOLINK INC.
standardized information disclosure and are more inclined to voluntary information disclosure due to
high agency costs, large information requirements, and lower costs of preparing and publishing
information (Zhong et al., 2005; Liu, 2008; Fang et al., 2009), so foreign capital will also tend to invest
in larger companies. This may lead to the phenomenon of “grouping together” by external investors
after the implementation of the land-port link mechanism to promote the further opening of the
domestic capital market. Therefore, this article proposes the hypothesis H1.
H1: After the implementation of Land-Hong Kong Stock Connect, the degree of domestic herd
behavior has increased, and the larger the company scale, the higher the herd behavior.
2.2 Imitation Theory and Land-Hong Kong Stock Connect Mechanism
The founder of imitation theory Jean Gabriel Tarde proposed the following imitation laws in 1890: the
law of distance, the closer the distance, the stronger the imitation; the top-down law, the inferior
imitates the superior, the lower-level characters imitate the upper-level characters; This opposite style
prevails at the same time. One style can replace the other style. Once the old style declines, the new
style rises. These three laws also apply in the capital market.
In order to promote the joint development of the mainland and Hong Kong capital markets and the
further opening up of the domestic capital market, on April 10, 2014, the China Securities Regulatory
Commission officially approved the Shanghai-Hong Kong Stock Connect pilot. On November 17, 2014,
the Shanghai-Hong Kong Stock Connect trading system was officially implemented. The first batch of
Shanghai-Hong Kong Stock Connect stocks included the SSE 180 Index, SSE 380 Index constituent
stocks, and 568 eligible stocks of A + H listed companies. Since the launch of the Shanghai-Hong Kong
Stock Connect pilot, the overall operation has been stable and orderly, which has provided valuable
experience for the implementation of the Shenzhen-Hong Kong Stock Connect trading system. On
December 5, 2016, Shenzhen-Hong Kong Stock Connect was officially launched. The first list of
Shenzhen-Hong Kong Stock Connect includes the Shenzhen Component Index. SZSE Small and
Medium Innovation Index and 882 eligible stocks listed in the A + H shares. At present, the number of
stocks that comply with the land-port link is continuously expanding.
The implementation of the land-port link will help attract foreign capital to flow into the A-share
market, improve the valuation system that differs significantly between A-shares and overseas markets,
and further increase the vitality of the A-share market. The Hong Kong stock market can be said to be
one of the more mature overseas markets. After Shenzhen-Hong Kong Stock Connect cooperates with
Shanghai-Hong Kong Stock Connect to fully open the A-share and H-share channels, it is more
conducive to the introduction of overseas institutional investors and gradually change the market
structure and training led by retail investors. Long-term investment concept. This will promote the
integration of domestic capital markets and overseas capital markets (Pang et al., 2017), but this may
also enhance the linkage between a country’s economy and the international market. Liu et al. (2016)
applied the dual differential model to Shanghai-Hong Kong Stock Connect A study on the volatility of
A-share prices shows that the Shanghai-Hong Kong Stock Connect trading mechanism not only did not

www.scholink.org/ojs/index.php/jepf Journal of Economics and Public Finance Vol. 6, No. 2, 2020
42 Published by SCHOLINK INC.
stabilize the stock price at the beginning of the policy, but played a negative role of “chasing up and
down”. This phenomenon is no longer significant after the policy has been fully advanced, Zhang et al.
(2014) and Feng et al. (2016) use Granger causality test to confirm that the implementation of the
Shanghai-Hong Kong Stock Connect has significantly enhanced the volatility spillover effect of the
Shanghai stock market on the Hong Kong stock market, while the implementation of the
Shenzhen-Hong Kong Stock Connect has played a role in diverting funds, making Shanghai The
correlation between Hong Kong and Hong Kong has been reduced (Pang et al., 2017), but Tang et al.
(2018) used Gaussian Copula function and t-Copula function to fit stock index returns. The research
results show that in Shanghai-Hong Kong Stock Connect and Shenzhen-Hong Kong Stock Connect
Under the China-Hong Kong Stock Connect policy, there is still a synergy effect between the stock
markets of the two places. After the Shenzhen-Hong Kong Stock Connect was launched, it was more
volatile than the Shanghai-Hong Kong Stock Connect (Duan, 2018, etc.), in the long run, the linkage
effect between the two places can be enhanced more (Wang & Dong, 2018). The existing literature has
conducted a very comprehensive study on the linkage between the stock markets of the two places after
the implementation of the land-port link mechanism. Few literatures have explored the underlying
causes of the linkage effect between the stock markets of the mainland and Hong Kong.
According to Tarde’s “Three Laws of Imitation”, the implementation of the land-port link allows a
large amount of external funds to flow into the country, and there is no obstacle to the interaction
between internal and external funds, so there will be internal and external imitations; external investors
are mostly developed market institutional investors with strong information. The ability to collect,
analyze, and process, while domestic investors are mainly retail, and the ability to collect, analyze, and
process information is weak, so internal investors will imitate the investment behavior of external
investors. Due to the imitating behavior of internal investors to external investors, the stock prices of
the two places are linked. Therefore, this article proposes hypothesis H2:
H2: One of the reasons for the linkage effect after the implementation of Land-Hong Kong Stock
Connect is the existence of internal investors imitating the behavior of external investors.
2.3 Inter-organizational Imitation via Investor Networks
The investor network is an important way to pass information between investors. Investors can not only
pass information through the network, but also observe the behavior of other investors through the
network. They can influence their investment decisions through their own rational analysis or
emotional perception (Xiao et al., 2012). Closely connected investors have stronger correlations in their
investment behaviors and are more likely to have herd behavior (Pareek, 2012). They participate in the
market through the Internet and observe and imitate each other (Liu & Su, 2016). In fact,
inter-organizational imitation is a very common way of organizational behavior. Emerging technologies,
management methods, and choices for entering new markets all have inter-organizational imitation
(Li-eberman & Asaba, 2006). For example, in sociology, “Isomorphism of Institutions” (Dimaggio &
Powell, 1983), “Embedded Networks” (Granovetter, 1985), Management Cost and Risk Sharing (Levitt

www.scholink.org/ojs/index.php/jepf Journal of Economics and Public Finance Vol. 6, No. 2, 2020
43 Published by SCHOLINK INC.
& March, 1988), also in Economics There are also studies such as “herd behavior” (Chang et al., 1997).
For example, Xiao et al. (2012) confirmed that the herd behavior of fund managers in the same network
is obvious. Although the subject areas involved are different, these studies have tried to answer the
following three questions: imitation motivation, imitation information channels, and imitation behavior
patterns. The motivation for imitation has been described above. Since external investors are mostly
institutional investors in developed markets and have strong information collection, analysis, and
processing capabilities, while domestic investors are mainly retail investors, whose ability to collect,
analyze, and process information is weak. In the case of asymmetric market information, internal
investors will imitate the behavior of external institutional investors in order to reduce the risk of
uncertainty in decision-making. And this article tries to focus on answering the question about imitating
information channels: internal investors observe the investment behavior of institutional investors
through the investor network to imitate and make their own investment decisions based on the
information transmitted on the network, so this article proposes hypothesis H3:
H3: Internal investors imitate external investors through the investor network.
3. Model Description and Research Design
3.1 Sample Selection and Data Source
This article uses the “Top Ten Mobile Shareholder Details” reported in all A-share listed companies
from the 2011 mid-term report to the 2019 third quarter report as the initial sample. The data comes
from the Choice financial terminal, and the data is processed according to the following steps: First,
remove Financial industry, ST company, * ST company sample data; second, remove missing data
samples; third, in order to reduce the impact of extreme values, this article performs a winsorize
processing on all continuous variable data at the level of 1%, while controlling the industry and
quarterly Fixed effects. The standard error of all regression analysis in this article is adjusted at the
company level by Cluster-robust. The final sample size was 80,104.
3.2 Herd Behavior
One of the main variables in this article is to use the standard commonly used in the study of herd
behavior: standard deviation. This index is used in many literatures such as Song and Wu (2001),
Hwang and Salmon (2004), Li, Rhee and Wang (2009) and Li Yu and Yang (2010), etc.
The herd behavior of an investor is defined as the standard deviation of the investor’s holding of each
stock position𝐻𝑒𝑟𝑑𝑗,𝑡, as shown in formula (1). The more consistent investor behavior, the more
obvious herd behavior, and the smaller the standard deviation 𝐻𝑒𝑟𝑑𝑗,𝑡.
𝐻𝑒𝑟𝑑𝑗,𝑡 = √∑ (∆𝐼𝑛𝑣𝑒𝑠𝑡𝑜𝑟𝑠𝑗,𝑡 − ∆𝐼𝑛𝑣𝑒𝑠𝑡𝑜𝑟𝑠𝑗,𝑡
)2𝑁
𝑗=1
𝑁 − 1#(1)
In formula (1), ∆𝐼𝑛𝑣𝑒𝑠𝑡𝑜𝑟𝑠𝑗,𝑡 represents the change in the position of the investor holding the 𝑗-th
stock in the 𝑡-th quarter compared to the previous quarter, ∆𝐼𝑛𝑣𝑒𝑠𝑡𝑜𝑟𝑠𝑗,𝑡 indicates the average
position change of investors holding the 𝑗-th stock in the 𝑡-th quarter compared to the previous quarter,

www.scholink.org/ojs/index.php/jepf Journal of Economics and Public Finance Vol. 6, No. 2, 2020
44 Published by SCHOLINK INC.
and 𝑁 indicates non-new investors who hold the 𝑗-th stock in the 𝑡-th quarter.
Table 1. Variable Definition
variable meaning Detailed definition
∆𝐼𝑛𝑣𝑒𝑠𝑡𝑜𝑟𝑠𝑗,𝑡 Changes in positions of all
investors Investor’s position of the 𝑗-th stock in the 𝑡-th quarter. (unit:%)
∆𝐼𝑛𝑣𝑒𝑠𝑡𝑜𝑟𝑠𝑗,𝑡
Average change in
positions of all investors
The average position held by investors in the 𝑡-th quarter compared to the previous quarter
(unit:%)
∆𝐸𝑥_𝑖𝑛𝑣𝑒𝑠𝑡𝑜𝑟𝑠𝑗,𝑡 Position changes by
outside investors Positions of external investors in the 𝑡-th quarter compared to the previous quarter (unit:%)
∆𝐼𝑛_𝑖𝑛𝑣𝑒𝑠𝑡𝑜𝑟𝑠𝑗,𝑡 Changes in positions of
internal investors
Positions of internal investors in the 𝑡-th quarter compared to the previous quarter for the 𝑗-th
stock (unit:%)
𝑂𝑝𝑒𝑛 Policy effect When the company is on the list of dry ports, it is 1 after the year of implementation, otherwise
it is 0
𝐶𝑅𝑗,𝑡 Current ratio Current assets divided by current liabilities
𝐶𝐹𝑂𝑗,𝑡 Cash flow ratio Net cash flow from operating activities divided by operating income
𝐿𝑎𝑟𝑠ℎ𝑎𝑟𝑒𝑗,𝑡 Shareholdings of the top
ten shareholders (Total number of shares held by the top ten shareholders / total share capital) × 100%
𝐼𝑛𝑠𝑗,𝑡 Institutional investor
shareholding (Total number of institutional shares held / total equity) × 100%
𝐸𝑃𝑆𝑗,𝑡 Earnings per share Current net profit attributable to ordinary shareholders
∑(Number of common shares outstanding × Number of months issued)/12
𝑇𝑂𝐼𝑃𝑆𝑗,𝑡 Total operating income per
share Total operating income / end-period paid-in capital (unit: yuan)
𝑇𝑢𝑟𝑛𝑜𝑣𝑒𝑟𝑗,𝑡 Stock turnover ∑ [Volume on a single trading day (shares)
Total number of current shares (shares)] × 100%
𝑅𝑂𝐴𝑗,𝑡 Return on assets EBIT × 2
Total assets at the beginning of the period + total assets at the end of the period× 100%
𝐿𝑖𝑞𝑢𝑖𝑑𝑖𝑡𝑦𝑗,𝑡 Current assets ratio Non-current assets divided by total assets
𝐿𝑒𝑣𝑗,𝑡 Assets and liabilities Total liabilities divided by total assets
𝐷𝑢𝑎𝑙 Two jobs in one If the chairman and the general manager are the same person, the value is 1; otherwise, it is 0.
𝐵𝑠𝑖𝑧𝑒𝑗,𝑡 Board size Natural logarithm of the total number of board members.
𝐼𝑛𝑑𝑒𝑝𝑗,𝑡 Independent director ratio The number of independent directors divided by the total number of board members.
𝑆𝑂𝐸 Property right The value is 1 when the company’s actual controller is state-owned, otherwise it is 0.
𝐴𝑔𝑒𝑗,𝑡 Time to market The natural logarithm of the number of years the company has been listed in the current period.

www.scholink.org/ojs/index.php/jepf Journal of Economics and Public Finance Vol. 6, No. 2, 2020
45 Published by SCHOLINK INC.
𝐵𝑟𝑔4
Four audit dummy
variables When the accounting firm hired is “Big Four”, the value is 1; otherwise, it is 0.
𝑠𝑖𝑧𝑒 Asset size Natural logarithm of total market value of listed companies
𝑄𝑢𝑎𝑟𝑡𝑒𝑟 Quarter dummy variable
𝐼𝑛𝑑𝑢𝑠𝑡𝑟𝑦 Industry dummy variables
3.3 Exploration on the Causes of the Linkage between the Stock Markets of the Mainland and Hong
Kong
Before the implementation of Land-Hong Kong Stock Connect mechanism, the inflow of overseas
funds into China was only through the QFII mechanism. After the implementation of the Land-Hong
Kong Stock Connect mechanism, Hong Kong Securities Clearing Co., Ltd. could be entrusted as a
nominal holder. Therefore, the definition of an external investor as a shareholder is “QFII”, “Hong
Kong Securities Clearing Co., Ltd.” and “Hong Kong Securities Clearing (Agent) Co., Ltd.” terms,
internal investors are defined as all other investors who do not contain these terms in the nature of
shareholders. This article uses Li et al. (2010) to study whether there is an indicator of imitation in
investors in herd behavior: changes in investor positions to study imitation between internal investment
and external investors. For the study of imitation behavior, all investors are divided into external
investors and internal investors. Since the implementation of the two policies of Shanghai-Hong Kong
Stock Connect and Shenzhen-Hong Kong Stock Connect from 2011 to 2019, that is, the
implementation time of the policies is different, a multi-period double difference model is considered,
referring to the multi-period DID analysis method of Beck et al. (2010). Its basic form is as follows:
∆𝐼𝑛_𝑖𝑛𝑣𝑒𝑠𝑡𝑜𝑟𝑠𝑗,𝑡 = 𝛽0 + 𝛽1𝑂𝑝𝑒𝑛 × ∆𝐸𝑥_𝑖𝑛𝑣𝑒𝑠𝑡𝑜𝑟𝑠𝑗,𝑡−1 + 𝛽𝐶𝑜𝑛𝑡𝑟𝑜𝑙𝑉𝑎𝑟𝑖𝑎𝑏𝑙𝑒𝑠𝑗,𝑡 +
∑ 𝐼𝑛𝑑𝑢𝑠𝑡𝑟𝑦 + ∑ 𝑄𝑢𝑎𝑟𝑡𝑒𝑟 + 𝜀𝑗,𝑡(2)
In formula (2), ∆𝐼𝑛_𝑖𝑛𝑣𝑒𝑠𝑡𝑜𝑟𝑠𝑗,𝑡 represents the change in the position of the internal investor holding
the 𝑗-th stock in the 𝑡-th quarter compared to the previous quarter. ∆𝐸𝑥_𝑖𝑛𝑣𝑒𝑠𝑡𝑜𝑟𝑠𝑗,𝑡−1 represents the
change in the position of an external investor holding the 𝑗-th stock in the 𝑡 − 1 quarter compared to
the previous quarter. 𝑂𝑝𝑒𝑛 refers to the effect of the implementation of the land-port link policy. The
latter is 1, otherwise it is 0, which indicates the net effect of the policy. In the multi-period DID, due to
the different time of policy implementation, there are no 𝑇𝑟𝑒𝑎𝑡 and 𝑃𝑜𝑠𝑡 in the model, and the
interaction terms 𝑂𝑝𝑒𝑛 and ∆𝐸𝑥_𝑖𝑛𝑣𝑒𝑠𝑡𝑜𝑟𝑠𝑗,𝑡−1 can explore the effect of the independent variable
on the dependent variable before and after the policy is implemented, which makes the multi-period
double difference more flexible. 𝐶𝑜𝑛𝑡𝑟𝑜𝑙𝑉𝑎𝑟𝑖𝑎𝑏𝑙𝑒𝑠𝑗,𝑡 represents a series of control variables,
∑ 𝐼𝑛𝑑𝑢𝑠𝑡𝑟𝑦𝑖 and ∑ 𝑄𝑢𝑎𝑟𝑡𝑒𝑟𝑡 represent the industry and quarterly fixed effects, and 𝜀𝑗,𝑡 represents
the residual term. 𝛽1 is the coefficient of main concern. If 𝛽1 is significantly positive, it indicates that
one of the reasons for the linkage effect between the stock markets of the two places after Land-Hong
Kong Stock Connect is that internal investors imitate external investors; otherwise, it indicates that the
linkage effect between the two stock markets is not due to internal investors. Imitation of external

www.scholink.org/ojs/index.php/jepf Journal of Economics and Public Finance Vol. 6, No. 2, 2020
46 Published by SCHOLINK INC.
investors.
This article chooses the lagging term of external investors to prevent “pseudo-herd” behavior.
“Pseudo-herd” behavior refers to investors taking similar decisions when facing similar decision
problems and information sets. Such situations can be understood as investors It happens to be similar
decisions, not to imitate each other. Considering that the data selected by Li et al. (2010) is daily data,
the data comes from TopView. The data was born on June 1, 2007, and disappeared on January 1, 2009.
This article cannot obtain daily data in the same way. Therefore, quarterly data was used instead. Li et
al. (2010) adopted data lagging five periods and lagging to eight periods in empirical tests. The
conclusion remains unchanged. Considering that quarterly data is used in this article, data lagging one
period are selected for research.
3.4 Further Research: The Transmission Path of Herd Imitation—Investor Information Network
In order to explore the transmission path of internal investors imitating external investors, referring to
the methods of Xiao (2012) and Crane et al. (2017), whether any two investors jointly hold a large
number of shares of any company to establish institutional investors Information networks, specifically,
between any two investors, if they jointly hold at least the shares of any of the same companies at the
end of the 𝑡 quarter and the proportion of shares in circulation is 5% or more, they There is an
association between them (in the network, two investors are connected by a straight line) to define the
network 𝑆(𝐼) of this investor 𝐼 as a set of other investors that are associated with it.
The degree 𝐷(𝐼) of the investor 𝐼 is defined as the number of elements in the investor network 𝑆(𝐼).
The investor 𝐼 holding stock 𝑗 is 𝐼(𝑗), and the information network 𝑇(𝑗) of stock 𝑗 is defined as
the collection of elements 𝐾 in the investor information network 𝑆(𝐼(𝑗)) , that is,
𝑇(𝑗) = {𝐾,𝐼(𝑗):𝐾 ∈ 𝑆(𝐼(𝑗)); for example, stock j was held by two investors at the same time in a
quarter with more than 5% of the number of shares outstanding. If you have your own network, then
define the stock information network as a collection of these two investor networks.
The network density of stock 𝑗 is defined as the ratio of the number of edges actually connected
between nodes in the network 𝑇(𝑗) of stock 𝑗 to the maximum number of possible edges. The
network density of stock j can be expressed as:
𝐷𝑗 =2𝐸𝑗
𝑘𝑗(𝑘𝑗 − 1)#(3)
Among them, 𝐸𝑗 is the number of edges actually connected in the stock information network 𝑇(𝑗); 𝑘𝑗
is the number of investors in the stock information network 𝑇(𝑗).
In order to eliminate the impact of stock market value, this article uses the method of Hong et al. (2000)
and Nagel (2005) to perform regression analysis on the stock network density value and its own
circulating market value. The specific form is as follows:
ln (𝐷𝑗𝑡
𝐷𝑗𝑡 − 1) = 𝛼𝑡 + 𝛽𝑡 ln(𝑀𝑗) + 𝜀𝑡#(4)
𝑅𝐶𝑗 = 𝜀𝑡#(5)

www.scholink.org/ojs/index.php/jepf Journal of Economics and Public Finance Vol. 6, No. 2, 2020
47 Published by SCHOLINK INC.
Among them, 𝐷𝑗𝑡 represents the network density value of each quarter of stock 𝑗, and 𝑀𝑗 represents
the circulating market value of stock 𝑗 at the end of each quarter. As this article focuses on the
information transmission path between domestic and foreign investors after the implementation of
Land-Hong Kong Stock Connect, the stocks with external investors from the second quarter of 2014 to
the third quarter of 2019 are selected for analysis. The influence of investors is not the influence
between internal investors or between external investors, so this article only calculates the network
density of stocks containing external investors, and defines 𝑅𝐶𝑗 as quarterly stocks containing external
investors The market value adjusted residual network density value is used to measure the degree of
information connection and diffusion of external investors in the investor information network. The
model established is as follows:
∆𝐼𝑛_𝑖𝑛𝑣𝑒𝑠𝑡𝑜𝑟𝑠𝑗,𝑡 = 𝛽0 + 𝛽1𝑅𝐶𝑗 + 𝛽2𝑂𝑝𝑒𝑛 × ∆𝐸𝑥_𝑖𝑛𝑣𝑒𝑠𝑡𝑜𝑟𝑠𝑗,𝑡−1 +
𝛽𝐶𝑜𝑛𝑡𝑟𝑜𝑙𝑉𝑎𝑟𝑖𝑎𝑏𝑙𝑒𝑠𝑗,𝑡 + ∑ 𝐼𝑛𝑑𝑢𝑠𝑡𝑟𝑦 + ∑ 𝑄𝑢𝑎𝑟𝑡𝑒𝑟 + 𝜀𝑗,𝑡##(6)
In formula (6), ∆𝐼𝑛_𝑖𝑛𝑣𝑒𝑠𝑡𝑜𝑟𝑠𝑗,𝑡 represents the change in the position of the internal investor holding
the 𝑗-th stock in the 𝑡-th quarter compared to the previous quarter, and 𝑅𝐶𝑗 is the Stock network
density, other variables have the same meaning as in formula (2). 𝛽1 is the main coefficient concerned
in this article. If 𝛽1 is not significant, it means that internal investors imitate external investors to
increase or decrease their holdings of shares are not related to the information of external investors in
the investor network. If 𝛽1 is significant, it means that internal investors imitate external investments.
Investors do obtain external investor information through the investor network.
4. Empirical Results and Analysis
4.1 Descriptive Statistics
Table 2. Descriptive Statistics of the Main Variables
Variable Obs. Mean St.dev. Min Max
∆𝐼𝑛𝑣𝑒𝑠𝑡𝑜𝑟𝑠𝑗,𝑡 608,259 0.0944921 1.0988 -59.02 65.2
∆𝐸𝑥_𝑖𝑛𝑣𝑒𝑠𝑡𝑜𝑟𝑠𝑗,𝑡 14,586 0.0123056 1.33152 -49.61 59.43
∆𝐼𝑛_𝑖𝑛𝑣𝑒𝑠𝑡𝑜𝑟𝑠𝑗,𝑡 593,673 0.0965114 1.09238 -59.02 65.2
𝐶𝑅𝑗,𝑡 80,104 2.933982 16.71739 -60.95686 4010.502
𝐶𝐹𝑂𝑗,𝑡 80,104 0.0778562 1.0543 -171.6743 60.54544
𝐿𝑎𝑟𝑠ℎ𝑎𝑟𝑒𝑗,𝑡 80,104 59.27207 15.38798 1.310332 244.2684
𝐼𝑛𝑠𝑗,𝑡 80,104 30.37312 23.43992 0 113.6913
𝐸𝑃𝑆𝑗,𝑡 80,104 0.2405875 0.478414 -7.8872 28.02
𝑇𝑂𝐼𝑃𝑆𝑗,𝑡 80,104 3.976601 8.245211 -0.8716874 603.5945
𝑇𝑢𝑟𝑛𝑜𝑣𝑒𝑟𝑗,𝑡 80,104 166.2583 185.6589 0.0098 2103.539
𝑅𝑂𝐴𝑗,𝑡 80,104 3.927247 7.522341 -186.8086 1061.563

www.scholink.org/ojs/index.php/jepf Journal of Economics and Public Finance Vol. 6, No. 2, 2020
48 Published by SCHOLINK INC.
𝐿𝑖𝑞𝑢𝑖𝑑𝑖𝑡𝑦𝑗,𝑡 80,104 42.58784 20.72152 0 99.1321
𝐿𝑒𝑣𝑗,𝑡 80,104 41.85416 29.38944 -68.38275 3443.177
𝑆𝑂𝐸 80,104 0.3569565 0.479105 0 1
𝐼𝑛𝑑𝑒𝑝𝑗,𝑡 80,104 18.3547 3.784363 1.904762 46.66667
𝐵𝑟𝑔4 80,104 0.0621934 0.241508 0 1
𝐷𝑢𝑎𝑙 80,104 0.2549029 0.435809 0 1
𝐴𝑔𝑒𝑗,𝑡 80,104 2.491108 0.63417 0 3.401197
𝐵𝑠𝑖𝑧𝑒𝑗,𝑡 80,104 2.84886 0.214941 2.079442 4.65396
4.2 Herd Behavior
In order to verify the hypothesis H1, grouping according to 𝑂𝑝𝑒𝑛, and then calculating according to
formula (1), the value of 𝐻𝑒𝑟𝑑𝑗,𝑡 under the full sample is obtained. This article groups according to
the previous literature experience and divides the sample into large Small, medium, and small
companies: Sort according to the natural logarithm of the total market capitalization at the end of 2019,
and calculate based on the natural logarithm. The natural companies with the largest third in the
ranking are large companies, and those with the middle third are For the Chinese company, the lower
third is the small company, and calculate the 𝐻𝑒𝑟𝑑𝑗,𝑡 of each group, as shown in Table 3. As shown in
Table 3, the value of 𝐻𝑒𝑟𝑑𝑗,𝑡 in the full sample was 35.838779 before the land-port link, and the value
of 𝐻𝑒𝑟𝑑𝑗,𝑡) was 31.07442 in the full sample after the land-port link. After the implementation of the
Hong Kong Stock Connect mechanism, the overall herd behavior was higher. From the grouping results,
the value of the 𝐻𝑒𝑟𝑑𝑗,𝑡 of the three types of companies before the implementation of the land-port
link is greater than the value after the implementation of the land-port link, indicating that the degree of
herd behavior of these three types of companies is higher than before. The values of 𝐻𝑒𝑟𝑑𝑗,𝑡 for large,
medium, and small companies are: 29.49098, 31.05645, and 33.22599 in sequence, indicating that the
larger the company size, the higher the degree of herd behavior. This result supports Hypothesis H1:
After the implementation of Land-Hong Kong Stock Connect mechanism, the larger the company, the
higher the herd behavior’s degree.
Table 3. Comparison of Herd Behavior
Mean Obs.
𝑂𝑝𝑒𝑛 = 0
Full sample 35.83879 63,966
Small 35.43541 46,382
Medium 37.0896 14,849
Big 35.88868 2,735
𝑂𝑝𝑒𝑛 = 1

www.scholink.org/ojs/index.php/jepf Journal of Economics and Public Finance Vol. 6, No. 2, 2020
49 Published by SCHOLINK INC.
Full sample 31.07442 16,139
Small 33.22599 2,574
Medium 31.05645 10,183
Big 29.49098 3,382
4.3 Imitation Effect
Because the hypothesis of the dual-slave difference model is the parallel trend, this article uses PSM
(Preference Score Matching) to perform one-to-one nearest neighbor matching within the caliper from
the control group of the sample and the processing group. The matching radius is 0.01, The balance
effect is shown in Table 4.
Table 4. PSM Matching Balance Effect
Variable Obs. Mean Difference Test Standardized Difference Test
Treated Control T-test %bias bias
𝐶𝑅𝑗,𝑡 U 2.1073 2.8456 -28.09*** -27.7
95.8 M 2.1073 2.0762 1.38 1.2
𝐶𝐹𝑂𝑗,𝑡 U 0.11816 0.071 16.91*** 15.2
98.1 M 0.11816 0.11725 0.28 0.3
𝐿𝑎𝑟𝑠ℎ𝑎𝑟𝑒𝑗,𝑡 U 63.101 58.314 36.09*** 31.4
87.6 M 63.101 62.506 3.46*** 3.9
𝐼𝑛𝑠𝑗,𝑡 U 37.754 28.451 45.87*** 39.8
98.2 M 37.754 37.918 -0.61 -0.7
𝐸𝑃𝑆𝑗,𝑡 U 0.37614 0.20032 61.16*** 48.9
88.2 M 0.37614 0.35534 4.53*** 5.8
𝑇𝑂𝐼𝑃𝑆𝑗,𝑡 U 5.0356 3.3656 39.02*** 31.1
94.7 M 5.0356 4.9466 1.34 1.7
𝑇𝑢𝑟𝑛𝑜𝑣𝑒𝑟𝑗,𝑡 U 124.25 173.69 -33.08*** -30.8
94.9 M 124.25 121.74 1.62 1.6
𝑅𝑂𝐴𝑗,𝑡 U 5.0861 3.6291 38.93*** 33.1
99 M 5.0861 5.1007 -0.28 -0.3
𝐿𝑖𝑞𝑢𝑖𝑑𝑖𝑡𝑦𝑗,𝑡 U 44.783 42.021 15.22*** 13.2
98.6 M 44.783 44.744 0.16 0.2
𝐿𝑒𝑣𝑗,𝑡 U 45.973 40.345 30.39*** 27.3
93.6 M 45.973 46.334 -1.61 -1.7
𝐼𝑛𝑑𝑒𝑝𝑗,𝑡 U 18.097 18.405 -9.62*** -8.5
75.1 M 18.097 18.02 1.92* 2.1

www.scholink.org/ojs/index.php/jepf Journal of Economics and Public Finance Vol. 6, No. 2, 2020
50 Published by SCHOLINK INC.
𝐴𝑔𝑒𝑗,𝑡 U 2.5334 2.4865 8.6*** 7.4
-10.9 M 2.5334 2.5855 -7.72*** -8.2
𝐵𝑠𝑖𝑧𝑒𝑗,𝑡 U 2.9035 2.8338 38.09*** 33.2
90.9 M 2.9035 2.9099 -2.67*** -3
It can be seen from Table 4 that the difference in the mean value of the feature variables of the two
groups after the matching are significantly reduced, and the absolute value of the standardized
difference is within 10%. Statistically speaking, the matching satisfies the balance assumption well. At
the same time, only a small number of samples (2 in the treat group and 13 in the control group) fell
outside the common support domain, which also satisfactorily satisfied the common support
hypothesis.
Next, this article performs regression according to formula (2). After the full sample regression, it is
also divided into small, medium and large companies according to the scale, and the regression is
performed. The results are shown in Table 5.
Table 5. Internal Investors Imitate External Investors
Full sample Small Medium Big
∆𝐼𝑛𝑣𝑒𝑠𝑡𝑜𝑟𝑠𝑗,𝑡
𝑂𝑝𝑒𝑛 × ∆𝐸𝑥_𝑖𝑛𝑣𝑒𝑠𝑡𝑜𝑟𝑠𝑗,𝑡−1 0.0353*** 0.0555*** 0.0468*** 0.0259*
(0.00645) (0.0195) (0.00759) (0.0132)
𝐶𝑅𝑗,𝑡 0.0309 0.0240 0.0859 0.133
(0.0656) (0.0796) (0.126) (0.192)
𝐶𝐹𝑂𝑗,𝑡 1.270*** 1.019** 1.789** 0.984
(0.415) (0.490) (0.825) (1.486)
𝐿𝑎𝑟𝑠ℎ𝑎𝑟𝑒𝑗,𝑡 -0.0541*** -0.0517*** -0.0175 0.00490
(0.0121) (0.0175) (0.0190) (0.0348)
𝐼𝑛𝑠𝑗,𝑡 0.108*** 0.119*** 0.117*** 0.0684***
(0.00795) (0.0111) (0.0127) (0.0211)
𝐸𝑃𝑆𝑗,𝑡 -2.345*** -2.043* -0.996 -1.456
(0.680) (1.121) (1.008) (1.427)
𝑇𝑂𝐼𝑃𝑆𝑗,𝑡 -0.0207 -0.123** 0.00969 0.199**
(0.0350) (0.0529) (0.0524) (0.0794)
𝑇𝑢𝑟𝑛𝑜𝑣𝑒𝑟𝑗,𝑡 0.0182*** 0.0170*** 0.0194*** 0.0269***
(0.000827) (0.000949) (0.00178) (0.00469)
𝑅𝑂𝐴𝑗,𝑡 -0.0138 0.0469 0.0400 -0.180
(0.0491) (0.0727) (0.0766) (0.126)

www.scholink.org/ojs/index.php/jepf Journal of Economics and Public Finance Vol. 6, No. 2, 2020
51 Published by SCHOLINK INC.
𝐿𝑖𝑞𝑢𝑖𝑑𝑖𝑡𝑦𝑗,𝑡 0.00574 0.00346 0.00615 0.0352
(0.00838) (0.0108) (0.0145) (0.0249)
𝐿𝑒𝑣𝑗,𝑡 0.0173* 0.0249* 0.0352** -0.0187
(0.0102) (0.0131) (0.0178) (0.0315)
𝑆𝑂𝐸 1.785*** 1.559*** 1.856*** 1.132
(0.387) (0.525) (0.626) (1.198)
𝐼𝑛𝑑𝑒𝑝𝑗,𝑡 -0.0944 0.0238 -0.207** 0.0425
(0.0574) (0.0760) (0.0914) (0.172)
𝐵𝑟𝑔4 -1.399** 0.685 -1.823* 0.682
(0.653) (1.343) (1.031) (1.187)
𝐷𝑢𝑎𝑙 0.0116 0.698 -0.529 -4.127***
(0.365) (0.440) (0.660) (1.375)
𝐴𝑔𝑒𝑗,𝑡 1.854*** 2.539*** 1.006* 2.489**
(0.344) (0.471) (0.563) (1.152)
𝐵𝑠𝑖𝑧𝑒𝑗,𝑡 -8.216*** -4.902*** -8.697*** -6.433**
(1.016) (1.414) (1.645) (2.805)
Constant 134.3*** 133.8*** 130.1*** 49.80***
(5.878) (7.883) (10.11) (19.02)
𝑄𝑢𝑎𝑟𝑡𝑒𝑟 yes yes yes yes
𝐼𝑛𝑑𝑢𝑠𝑡𝑟𝑦 yes yes yes yes
Obs. 68,014 41,524 21,297 5,193
R2 0.074 0.088 0.064 0.052
Note. The value of t in parentheses, *, **, *** represent significant levels of 10%, 5% and 1%,
respectively, the same below.
As shown in Table 5, in the full sample regression, the coefficient of 𝑂𝑝𝑒𝑛 × ∆𝐸𝑥_𝑖𝑛𝑣𝑒𝑠𝑡𝑜𝑟𝑠𝑗,𝑡−1 is
positive and significant at the 1% level, indicating that after the implementation of the land-port link,
external investors in the previous period increased holdings, and the internal investors also increased
their holdings in the current period. In the previous period, the external investors reduced their holdings,
and the current internal investors also reduced holdings. That is, the internal investors did imitate
external investments. The 𝑂𝑝𝑒𝑛 × ∆𝐸𝑥_𝑖𝑛𝑣𝑒𝑠𝑡𝑜𝑟𝑠𝑗,𝑡−1 coefficient of the medium company is positive
and significant at the 1% level, and the 𝑂𝑝𝑒𝑛 × ∆𝐸𝑥_𝑖𝑛𝑣𝑒𝑠𝑡𝑜𝑟𝑠𝑗,𝑡−1 coefficient of the large company
is positive and the 10% level is significant, indicating that small and medium-sized companies have
more imitations, and large companies may have invested with qualified foreign institutional investors
such as QFII before the implementation of the Shanghai-Hong Kong Stock Connect, and the large
companies themselves have higher information collection and analysis capabilities. Although the
imitation of newly entered external funds is not as strong as that of small and medium-sized companies,
www.scholink.org/ojs/index.php/jepf Journal of Economics and Public Finance Vol. 6, No. 2, 2020
52 Published by SCHOLINK INC.
there is also a more obvious imitation.
In summary, the hypothesis that H2 is confirmed indicates that after the implementation of Land-Hong
Kong Stock Connect mechanism, internal investors have imitated the behavior of external investors.
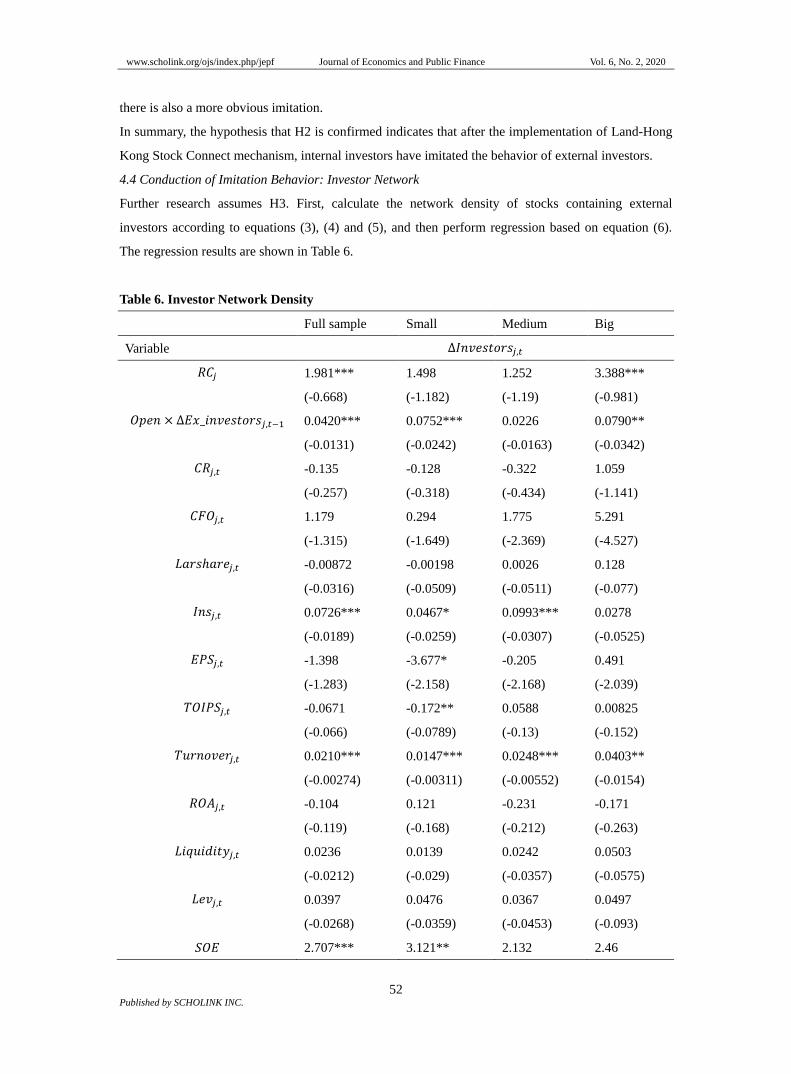
4.4 Conduction of Imitation Behavior: Investor Network
Further research assumes H3. First, calculate the network density of stocks containing external
investors according to equations (3), (4) and (5), and then perform regression based on equation (6).
The regression results are shown in Table 6.
Table 6. Investor Network Density
Full sample Small Medium Big
Variable ∆𝐼𝑛𝑣𝑒𝑠𝑡𝑜𝑟𝑠𝑗,𝑡
𝑅𝐶𝑗 1.981*** 1.498 1.252 3.388***
(-0.668) (-1.182) (-1.19) (-0.981)
𝑂𝑝𝑒𝑛 × ∆𝐸𝑥_𝑖𝑛𝑣𝑒𝑠𝑡𝑜𝑟𝑠𝑗,𝑡−1 0.0420*** 0.0752*** 0.0226 0.0790**
(-0.0131) (-0.0242) (-0.0163) (-0.0342)
𝐶𝑅𝑗,𝑡 -0.135 -0.128 -0.322 1.059
(-0.257) (-0.318) (-0.434) (-1.141)
𝐶𝐹𝑂𝑗,𝑡 1.179 0.294 1.775 5.291
(-1.315) (-1.649) (-2.369) (-4.527)
𝐿𝑎𝑟𝑠ℎ𝑎𝑟𝑒𝑗,𝑡 -0.00872 -0.00198 0.0026 0.128
(-0.0316) (-0.0509) (-0.0511) (-0.077)
𝐼𝑛𝑠𝑗,𝑡 0.0726*** 0.0467* 0.0993*** 0.0278
(-0.0189) (-0.0259) (-0.0307) (-0.0525)
𝐸𝑃𝑆𝑗,𝑡 -1.398 -3.677* -0.205 0.491
(-1.283) (-2.158) (-2.168) (-2.039)
𝑇𝑂𝐼𝑃𝑆𝑗,𝑡 -0.0671 -0.172** 0.0588 0.00825
(-0.066) (-0.0789) (-0.13) (-0.152)
𝑇𝑢𝑟𝑛𝑜𝑣𝑒𝑟𝑗,𝑡 0.0210*** 0.0147*** 0.0248*** 0.0403**
(-0.00274) (-0.00311) (-0.00552) (-0.0154)
𝑅𝑂𝐴𝑗,𝑡 -0.104 0.121 -0.231 -0.171
(-0.119) (-0.168) (-0.212) (-0.263)
𝐿𝑖𝑞𝑢𝑖𝑑𝑖𝑡𝑦𝑗,𝑡 0.0236 0.0139 0.0242 0.0503
(-0.0212) (-0.029) (-0.0357) (-0.0575)
𝐿𝑒𝑣𝑗,𝑡 0.0397 0.0476 0.0367 0.0497
(-0.0268) (-0.0359) (-0.0453) (-0.093)
𝑆𝑂𝐸 2.707*** 3.121** 2.132 2.46

www.scholink.org/ojs/index.php/jepf Journal of Economics and Public Finance Vol. 6, No. 2, 2020
53 Published by SCHOLINK INC.
(-0.935) (-1.299) (-1.591) (-1.964)
𝐼𝑛𝑑𝑒𝑝𝑗,𝑡 -0.0258 0.258 -0.142 0.152
(-0.143) (-0.223) (-0.215) (-0.358)
𝐵𝑟𝑔4 -0.759 -1.068 0.174 3.529
(-1.115) (-3.363) (-1.627) (-2.726)
𝐷𝑢𝑎𝑙 -0.519 -1.8 3.726* -6.572***
(-1.071) (-1.297) (-2.012) (-2.271)
𝐴𝑔𝑒𝑗,𝑡 0.108 -0.655 0.252 2.043
(-0.846) (-1.136) (-1.329) (-2.976)
𝐵𝑠𝑖𝑧𝑒𝑗,𝑡 -2.993 1.535 -2.034 -4.005
(-2.638) (-3.705) (-4.517) (-6.193)
Constant 85.59*** 115.4*** 53.93* -34.89
(-18.61) (-24.74) (-31.94) (-53.81)
𝑄𝑢𝑎𝑟𝑡𝑒𝑟 yes yes yes yes
𝐼𝑛𝑑𝑢𝑠𝑡𝑟𝑦 yes yes yes yes
Obs. 8,602 4,303 3,283 1,016
R2 0.049 0.066 0.047 0.092
It can be seen from Table 6 that under the entire sample, the residual network density coefficient is
positive and significant at the level of 1%, indicating that overall internal investors do obtain external
investor information through the investor network density to imitate external investment. However, it
can be found that the network residual density coefficient of small and medium companies is positive
but not significant, while the network residual density of large companies is significantly positive at the
1% level. The regression results show that the imitation behavior of small and medium-sized
companies may not be transmitted through the investor network, but through other channels, the
imitation behavior of large companies is indeed transmitted through the investor network.
The reason why the small and medium-sized company’s network residual density regression results are
not significant may be that there are fewer external institutional investors who invest in small and
medium-sized companies. Small and medium-sized companies can obtain less external investor
information through the network and have a slower acquisition speed. External investors, and the large
companies themselves have a stronger ability to obtain and process information. In addition, external
institutional investors are more willing to invest in large companies with more standardized information
disclosure, and external investors available in the network. There is more information and the speed of
acquisition is faster. Therefore, the investment behavior of internal investors through the network
containing external investor information will inevitably exist in reference to the investment behavior of
external investors. To sum up, the regression results partially support the hypothesis H3. As for how
small and medium-sized companies obtain external investment information, further research is needed.

www.scholink.org/ojs/index.php/jepf Journal of Economics and Public Finance Vol. 6, No. 2, 2020
54 Published by SCHOLINK INC.
4.5 Robustness Test
1. The PSM matching radius of 0.01 is used in this article. The main results remain unchanged after
changing to 0.005 matching radius.
2. In order to prevent the “pseudo herd” behavior, we use the data that is one period behind. In fact, we
try to lag two periods in the test. It is found that the imitation behavior of small and medium-sized
companies is still significant, but the imitation behavior of large companies is no longer significant.
The possible reason is that due to the limitation of data, the lag period is too long, and large companies
can obtain foreign capital information quickly fast response to foreign investment behavior, while the
ability of small and medium-sized companies to obtain information is weak and slow, which leads to
the situation that small and medium-sized companies are still significant but large companies are no
longer significant.
3. In the quarterly reports of listed companies, there are some new investors, which will have a certain
impact on the research of herding behavior. The main conclusions of this article remain unchanged
after excluding the impact of new investors.
5. Conclusions and Implications
Based on the quarterly data of all A-share listed companies from 2011 to 2019, this article uses the
multi period double difference model to explore the causes and transmission mechanism of the linkage
effect of the stock prices of the two cities after the implementation of Land-Hong Kong Stock Connect.
The results show that: first, after the implementation of “Land-Hong Kong Stock Connect”, the degree
of herd behavior of domestic investors as a whole becomes higher, and the larger the company scale is,
the higher the degree of herd behavior of investors is; secondly, after the implementation of
“Land-Hong Kong Stock Connect”, all listed companies have the behavior of internal investors
imitating external investors, and the imitation behavior of small and medium-sized companies is
significant; finally, from the overall sample from the point of view, the imitation behavior of internal
investors is indeed conducted through the investor network, but it is subdivided into three categories:
large, medium and small companies. Only the imitation transmission path of large companies is the
investor network, and the imitation path of small and medium companies is unknown, which needs
further study.
According to the empirical results, the policy implications of this article are as follows: firstly, the
government should further cultivate the investors’ rational investment awareness and reduce irrational
imitation; secondly, the government should further standardize the information disclosure system of the
company and improve the transparency of the company’s information; finally, the government should
speed up the improvement of the supporting system of interconnection and maintain the two ports
Stable development of the land.

www.scholink.org/ojs/index.php/jepf Journal of Economics and Public Finance Vol. 6, No. 2, 2020
55 Published by SCHOLINK INC.
References
Beck, T., Levine, R., & Levkov, A. (2010). Big bad banks? The winners and losers from bank
deregulation in the United States. The Journal of Finance, 65(5), 1637-1667.
https://doi.org/10.1111/j.1540-6261.2010.01589.x
Feng, Y. Q., & Duan, X. H. (2016). Impact of “Shanghai-Hong Kong Stock Connect” on
Shanghai-Hong Kong Stock Market Linkage Effect. Economic System Reform, 02, 143-147.
Guo, L., & Wu, C. F. (2004). An empirical study of rational and irrational herd behavior in Chinese
stock market. Management Review, 11, 53-57, 64.
Li, X. F., Fu, L. J., & Su, W. (2008). A Comparative Study of the “Herding Behavior” of QFII and
Domestic Open-ended Securities Investment Funds. Forum on World Economy and Politics, 04,
7-14.
Li, Z. W., Yu, P. Y., & Yang, J. (2010). Differences in Herd Behavior between Institutional Investors
and Individual Investors. Financial Research, 11, 77-89.
Liu, C. Y., Hu, F., & Wang, H. (2007). Does QFII also have herd behavior? Financial Research, 10,
111-122.
Liu, J. J., & Su, C. L. (2016). Infectious Funds: Research on Fund Flow and Performance Impact Based
on Network Structure. Management World, 01, 54-65.
Pang, H. F., Liu, Z. L., & Pang, S. Y. (2017). Correlation analysis of Shanghai and Hong Kong stock
markets before and after Shenzhen-Hong Kong Stock Connect is launched based on Copula
function. Journal of Harbin Commercial University (Social Science Edition), 04, 77-84.
Peng, H. (2000). Herd Behavior and Bubbles under Asymmetric Information—The Theory of
Microstructure of Financial Markets. Financial Research, 11, 5-19.
Song, J., & Wu, C. F. (2001). Research on Herd Behavior in Financial Markets Based on Dispersion.
Economic Research, 11, 21-27.
Song, J., & Wu, C. F. (2001). Research on the Causes and Controlling Strategies of Herd Behavior in
Financial Markets. Finance Theory and Practice, 06, 46-48.
Xiao, X. R., Liu, J., & Zhao, H. J. (2012). The Contagion of the Behavior of Institutional
Investors—Based on the Perspective of Investor Networks. Management World, 12, 35-45.
Zhang, Z., Li, A. Y., & Qin, L. J. (2014). Impact of Shanghai-Hong Kong Stock Connect on the
Linkage of Shanghai and Hong Kong Stock Markets. Finance Teaching and Research, 06, 59-62,
71.