why it matters in midsized firms - harvard business school files/06-013.pdf · why it matters in...
TRANSCRIPT
06-013
Copyright © 2005
Working papers are in draft form. This working paper is distributed for purposes of comment and discussion only. It may not be reproduced without permission of the copyright holder. Copies of working papers are available from the author.
Why IT Matters in Midsized Firms
Marco Iansiti George Favaloro James Utzschneider Greg Richards
Marco Iansiti David Sarnoff Professor of Business Administration Harvard Business School George Favaloro Keystone Strategy, Inc. James Utzschneider Microsoft Corporation Greg Richards Keystone Strategy, Inc

Harvard Business School Working Paper Series, No. 06-013, 2005
Why IT Matters in Midsized Firms
Marco Iansiti, David Sarnoff Professor of Business Administration, Harvard Business School George Favaloro, Keystone Strategy, Inc.
James Utzschneider, Microsoft Corporation Greg Richards, Keystone Strategy, Inc.
Boston, MA 02163, USA
September 1, 2005
PRELIMINARY DRAFT – COMMENTS WELCOME ACKNOWLEDGEMENTS: We are grateful to the many individuals at Keystone, Microsoft, and
HBS who helped with this research. From Keystone: Julio Gomez, John Robb, Michael Pao, Henry Lui, and Michael Kraft
From Microsoft: Sarah Dziuk, Andrea Simons, and the many individuals who contributed to the development of the scenario framework
From HBS: David Brunner and Brad Staats
Why IT Matters
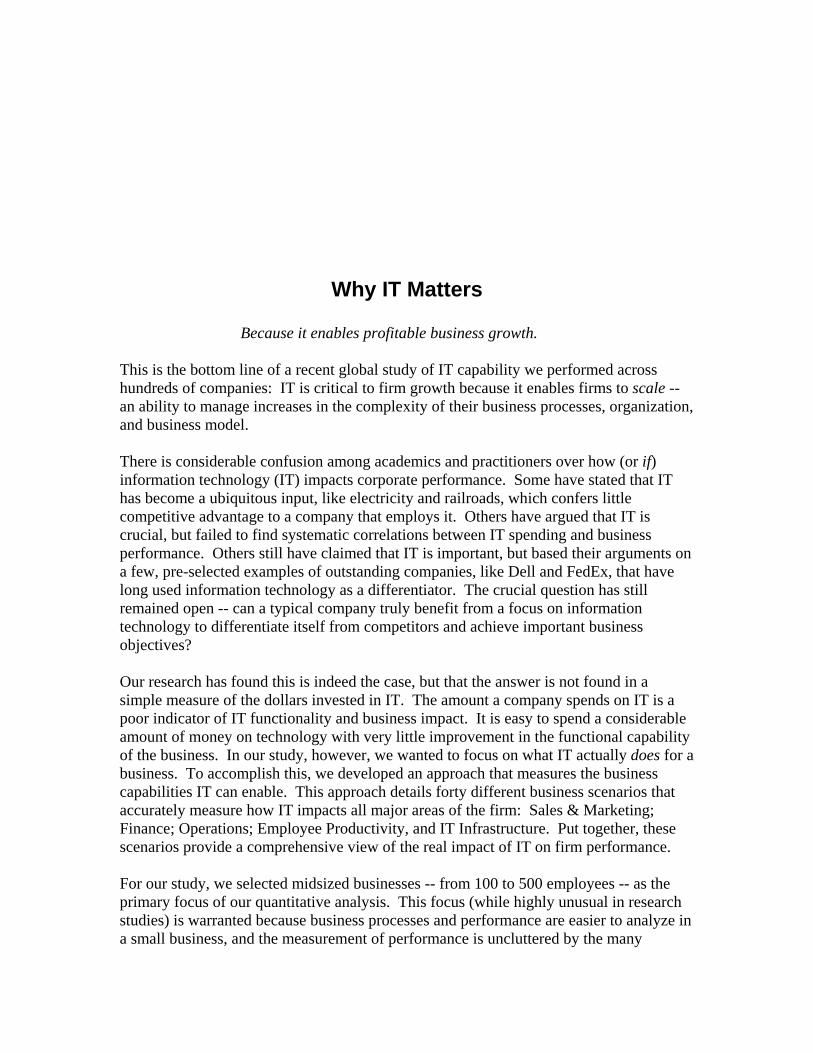
Because it enables profitable business growth. This is the bottom line of a recent global study of IT capability we performed across hundreds of companies: IT is critical to firm growth because it enables firms to scale -- an ability to manage increases in the complexity of their business processes, organization, and business model. There is considerable confusion among academics and practitioners over how (or if) information technology (IT) impacts corporate performance. Some have stated that IT has become a ubiquitous input, like electricity and railroads, which confers little competitive advantage to a company that employs it. Others have argued that IT is crucial, but failed to find systematic correlations between IT spending and business performance. Others still have claimed that IT is important, but based their arguments on a few, pre-selected examples of outstanding companies, like Dell and FedEx, that have long used information technology as a differentiator. The crucial question has still remained open -- can a typical company truly benefit from a focus on information technology to differentiate itself from competitors and achieve important business objectives? Our research has found this is indeed the case, but that the answer is not found in a simple measure of the dollars invested in IT. The amount a company spends on IT is a poor indicator of IT functionality and business impact. It is easy to spend a considerable amount of money on technology with very little improvement in the functional capability of the business. In our study, however, we wanted to focus on what IT actually does for a business. To accomplish this, we developed an approach that measures the business capabilities IT can enable. This approach details forty different business scenarios that accurately measure how IT impacts all major areas of the firm: Sales & Marketing; Finance; Operations; Employee Productivity, and IT Infrastructure. Put together, these scenarios provide a comprehensive view of the real impact of IT on firm performance. For our study, we selected midsized businesses -- from 100 to 500 employees -- as the primary focus of our quantitative analysis. This focus (while highly unusual in research studies) is warranted because business processes and performance are easier to analyze in a small business, and the measurement of performance is uncluttered by the many
bureaucratic factors that are common in larger enterprises. We selected product, service, and financial companies in the US, Germany, and Brazil, and asked them questions in the following areas:
• Business performance: Revenue and profitability over a multi-year period. • IT spend and IT philosophy. • IT capability: A comprehensive evaluation of their IT in-use in five key
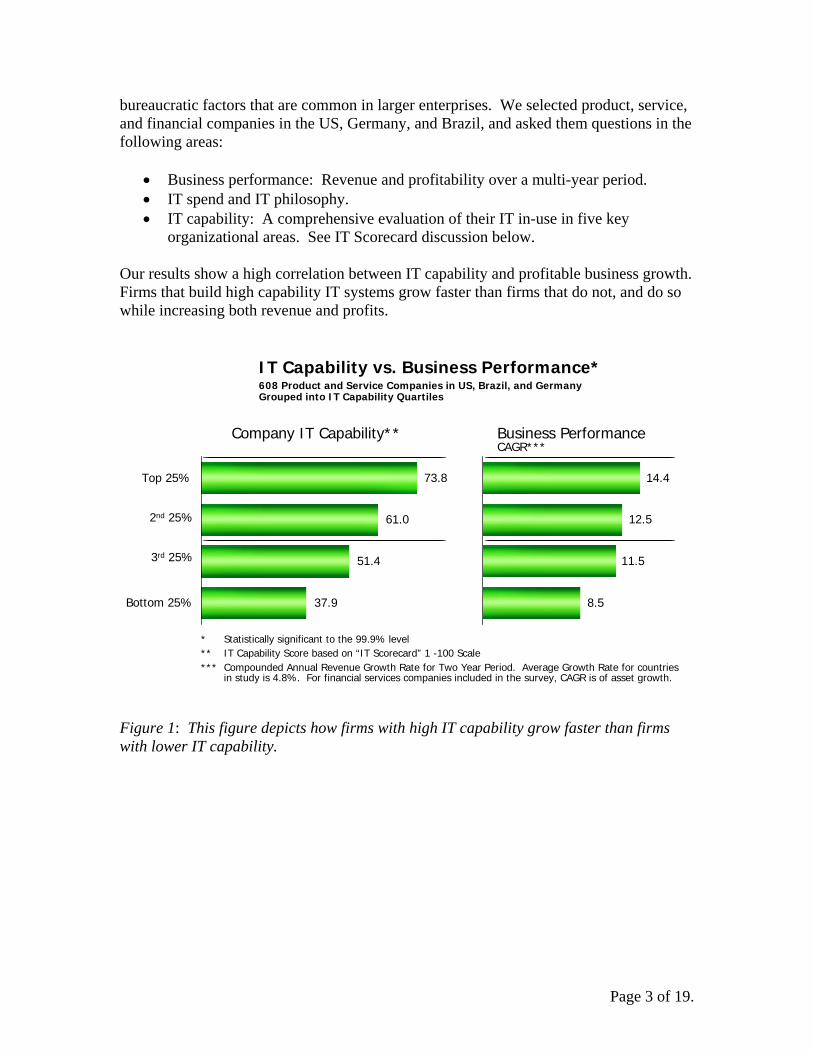
organizational areas. See IT Scorecard discussion below. Our results show a high correlation between IT capability and profitable business growth. Firms that build high capability IT systems grow faster than firms that do not, and do so while increasing both revenue and profits.
Company IT Capability** Business PerformanceCAGR***
Bottom 25%
2nd 25%
3rd 25%
p 25%
IT Capability vs. Business Performance*608 Product and Service Companies in US, Brazil, and GermanyGrouped into IT Capability Quartiles
* Statistically significant to the 99.9% level** IT Capability Score based on “IT Scorecard” 1 -100 Scale*** Compounded Annual Revenue Growth Rate for Two Year Period. Average Growth Rate for countries
in study is 4.8%. For financial services companies included in the survey, CAGR is of asset growth.
73.8
61.0
51.4
37.9
14.4
12.5
11.5
8.5
To
Figure 1: This figure depicts how firms with high IT capability grow faster than firms with lower IT capability.
Page 3 of 19.

These results apply to the major divisions within the study: US product firms, US service firms, German firms and Brazilian firms.
73.5
36.6
US Products Firms231 Companies
71.6
37.3
73.5
36.3
Brazil136 Companies
Germany163 Companies
79.4
45.2
US Services Firms77 Companies
IT Score*
Bottom 25%
Top 25%
Bottom 25%
Top 25%
* IT Capability Score based on “IT Scorecard” 1 -100 Scale
IT Capability vs. Business PerformanceBreakdown by Country, Products, and Services
8.6
3.7
21.8
17.0
13.1
8.6
16.1
3.8
IT Score*
IT Score*
IT Score*
Figure 2: This figure shows that firms in the top Quartile of measured IT capability grow faster in Germany and Brazil, as well as in US product and services firms. The Profit Picture While the firms with the top IT scores achieved superior growth, this growth did not come at the expense of profitability. In fact, on average, the top firms slightly improved their profitability as a percent of sales. As a result, the top firms grew in total dollar terms on both the top and bottom lines.
All US Services US Products Brazil GermanyTop 25% of firms in IT Score 10.3% 11.2% 10.4% 15.5% 5.3%Bottom 25% in IT Score 8.8% 12.7% 10.3% 8.6% 5.5%
2004 Profit as a % of Sales
Figure 3: This figure shows that firms in the top Quartile of measured IT capability on average improved their profitability. The IT Scorecard To measure IT capability, we developed the IT Scorecard, a tool that measures actual IT usage within the firm. This scorecard was based on a framework originally developed by a team at Microsoft Corporation that measures IT capability in five key areas: sales and marketing; finance; operations; employee productivity and collaboration; and IT infrastructure. We refined and calibrated the tool through over 600 interviews with mid-
Page 4 of 19.

sized firms to the point where we can rate a firm’s overall IT capability on a 1-100 scale and break down their capabilities into the key functional areas (see the discussion section for case study examples of the IT Scorecard). Rather than measuring IT intensity based on IT spending or such measures as PCs per employee, this tool allowed us to rate the firm’s IT capability based on approximately 40 IT-enabled business processes actually used within the surveyed firms such as “automated production planning” or “mobile and remote access to information and processes.” How the Top Firms Improve Business Performance Using IT Intensive examination of our data and in-depth case studies sheds further light on how firms use IT to accelerate business growth. The best firms couple the design of their information technology system with the design of the firm. This can be seen in Figure 4.
Implementing the process changes in
software and systems.
Identifying the specific process changes
needed to drive each key business lever.
Business Strategy
A data-driven vision of how to use the key
economic and competitive levers in the business to
drive success.
Profitable Sales
Growth
Ability to scale up the business at minimal incremental cost.
Business Process Technology Implementation
Implementing the process changes in
software and systems.
Identifying the specific process changes
needed to drive each key business lever.
usiness Strategy
A data-driven vision of how to use the key
economic and competitive levers in the business to
drive success.
Profitable Sales
Growth
Ability to scale up the business at minimal incremental cost.
Business Process Technology Implementation
B Figure 4: The process used to apply IT to achieve profitable sales growth. In each of the case study firms, the design and implementation of critical business processes is tightly integrated with the design and implementation of IT capabilities needed to manage these processes. This integration allows companies to achieve business processes scalability. This is a fundamentally different view of scalability than is traditionally used in IT. Classically, IT scalability focuses on things such as the scalability of electronic transactions processing. Here, the corporations focused on using IT to improve the scalability of critical business processes. Using IT to achieve business process scalability provides:
• Improved process knowledge and process standardization, which enables the firm to more easily manage the complexity involved in growth.
• Streamlined operations that can grow without significant additions to headcount. • Flexibility to take advantage of new opportunities and respond quickly to
exogenous changes. • Better visibility into critical business parameters to guide important management
decisions. In short, our research indicates firms that have closely aligned the design of business processes and IT systems find it easier to manage the intrinsic complexity of their
Page 5 of 19.

businesses. This enables them to grow their revenues and their profits faster than competitors. The IT Scorecard, with its focus on automated business processes, provides a good method for the understanding any firm’s business process scalability. Our studies have shown a number of specific ways in which the appropriate implementation of information technology can aid in the management of the complexity found in business growth beyond basic process efficiencies. Once a well-designed information technology infrastructure has been put in place:
• New capabilities and process extensions can be more easily integrated into existing processes.
• Process improvements, through total quality initiatives and employee feedback, are easier to generate, evaluate, and implement.
• Business opportunities can be accessed more quickly and efficiently through the extension of new IT enabled business processes.
• The entire business process portfolio can be more easily monitored and tracked to quickly respond to changes in the business.
We have observed how the effective implementation of IT capabilities to manage growth requires a good alignment between the design of the IT systems and the design of the firm’s business processes. To be in alignment, a firm’s core business processes must be enabled by integrated IT capabilities. Each iterative expansion or modification of this core business process must be made with an intimate knowledge of how IT can be used to enhance or simplify the process. For example, PrintingForLess.com (a high growth e-commerce printer – see the Discussion Section for more) leveraged its core electronic ticketing system to redesign its customer service and sales operation. The newly designed business process created a new position called the technical sales representative who could manage the sale, conversion, acceptance, modification, and shipping of an electronic order. From this redesign, a new IT system was built to automate the workflow of the technical sales representative. This new system enabled the company to continue to grow deliberately and profitably despite extremely high growth rates. Additionally, the system provided improvements in customer service satisfaction, sales conversions, employee satisfaction, and order process speed. The alignment of business process and IT design isn’t easy. Our data indicates that only some companies are able to achieve it. However, when alignment is achieved, companies can truly differentiate themselves and sustain high growth over extended periods despite significant obstacles and challenges. In summary, IT does matter. It is an essential ingredient in long-term business success and not merely a commodity that adds little to the firm’s ability to thrive. IT drives growth.
Page 6 of 19.

Debate A significant volume of research has investigated the links between IT investment and a firm’s growth and productivity.i The results of these efforts have been ambiguous and often contradictory. For example, the results of early analysis indicated that increases in IT spending might actually decrease productivity. This led to the declaration of a “Productivity Paradox.” This early pronouncement of a paradox was subsequently refuted by analysis on better data that demonstrated IT investment actually increased productivity at the economy, industry, and firm level.ii A similar situation has arisen with links between a firm’s profitability and its IT investment. Many studies have failed to find a link between profitability and IT investment. In fact, those studies that did find a link, found one in reverse. Growth in profitability may have driven growth in IT investment and not the other way around -- analysis showed that good financial performance in one year was an indicator of increased IT investment in subsequent years.iii The ambiguity of this research naturally produced broad pronouncements on the value of IT. Most prominently, Nick Carr in his article (and book) “Does IT Matter?” claimed that IT was merely a ubiquitous utility, like electricity, that conferred no strategic advantage to the firm that employed it. These pronouncements were likely premature (again). The early studies may have been led astray by the complexity of the problem. The first (and most critical) consideration may be the use of IT spending as a surrogate measure of IT performance. Numerous studies indicate that it is a poor measure.iv In support of this, research into the profitability for firms that were leaders in their application of IT show correlation between profitability and IT investment.v A potential generic solution to this problem is to use the evolving field of process theory to measure the effectiveness of IT investment. Process theory is based on the understanding that IT investment is only valuable if the firm successfully completes a multi-step process of investment, deployment, and usage.vi Early results of work in this area suggest that this multi-step approach would prove valuable.vii
Another consideration may have been an exclusive focus on firm profitability. Profitability is likely a bad metric for firm health given the wide variability in its measure and the tendency of a firm to minimize profitability during periods of rapid growth (due to investment). A better metric is likely sales growth, since it reflects the firm’s ability to grow market share relative to competitors. Finally, ambiguity in the results of these studies may have arisen from the inherent complexity of the large firms studied. The complex interplay of operational processes within large firms makes it difficult, if not impossible, to generate a clean measure of financial health or IT usage. A focus on smaller companies may be a way to gather the data necessary to measure the impact of IT on a firm’s health.
Page 7 of 19.
Methodology To improve on previous studies, the structure of our research included three important departures from previous approaches to measuring the impact of IT: First, we focused our research on medium-size firms; second, we developed a method for assessing IT utilization using “Business Scenarios”; and third, we measured sales growth as well as profitability.
Sample Selection Our survey was administered to managers of small to medium-size firms in the US, Germany and Brazil. Medium-size firms were chosen because we expected they would have fewer organizational factors likely to mediate the link between IT deployment and business performance, such as conflicts between the IT organization and other divisions or the presence of multiple IT organizations. In such medium firms, IT is usually controlled by a very small group of people or a single individual, and that group or individual is also responsible for the overall performance of the firm.viii
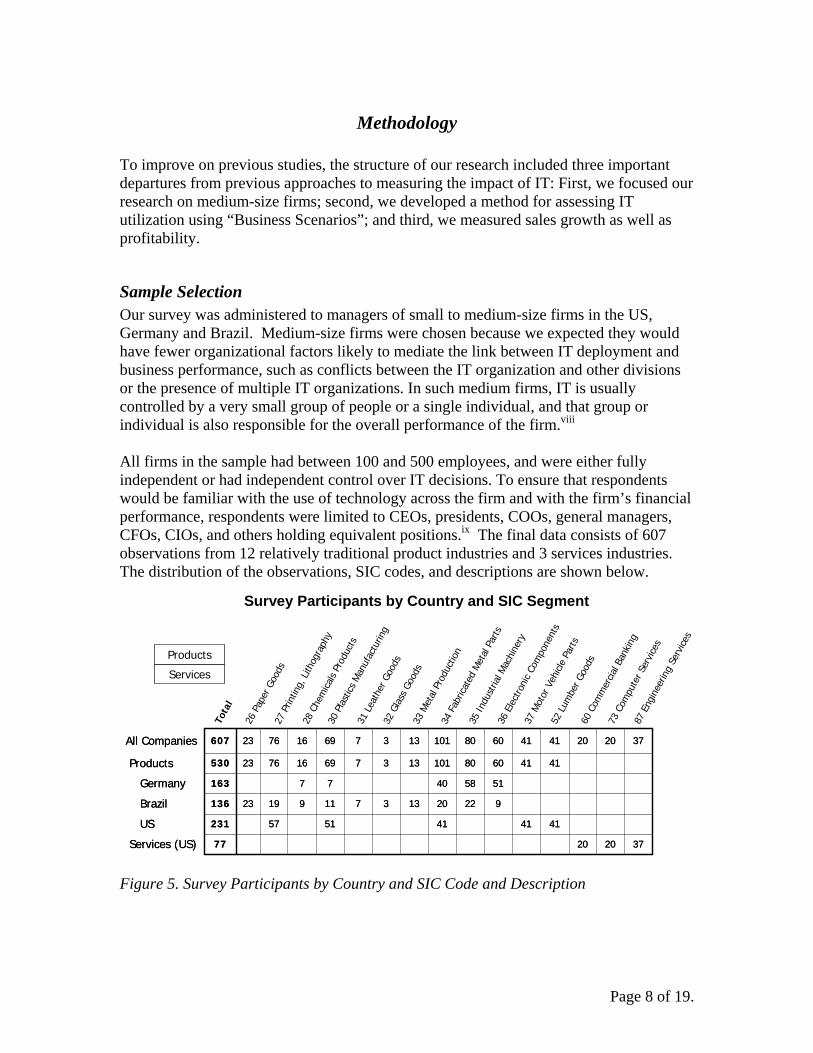
All firms in the sample had between 100 and 500 employees, and were either fully independent or had independent control over IT decisions. To ensure that respondents would be familiar with the use of technology across the firm and with the firm’s financial performance, respondents were limited to CEOs, presidents, COOs, general managers, CFOs, CIOs, and others holding equivalent positions.ix The final data consists of 607 observations from 12 relatively traditional product industries and 3 services industries. The distribution of the observations, SIC codes, and descriptions are shown below.
Products
Survey Participants by Country and SIC Segment
37202077Services (US)
4141415157231US
9222013371191923136Brazil
51584077163Germany
41416080101133769167623530Products
37202041416080101133769167623607
Figure 5. Survey Participants by Country and SIC Code and Description
All Companies
37202077Services (US)
4141415157231US
9222013371191923136Brazil
51584077163Germany
41416080101133769167623530Products
37202041416080101133769167623607l Companies
Tota
l
26 P
aper
Goo
ds27
Prin
ting,
Lith
ogra
phy
28 C
hem
icals
Prod
ucts
30 P
last
ics M
anuf
actu
ring
31 L
eath
er G
oods
32 G
lass
Goo
ds33
Met
al P
rodu
ctio
n34
Fab
ricat
ed M
etal
Par
ts
35 In
dust
rial M
achi
nery
36 E
lect
roni
c Co
mpo
nent
s
37 M
otor
Veh
icle
Parts
52 L
umbe
r Goo
ds60
Com
mer
cial B
anki
ng
73 C
ompu
ter S
ervi
ces
87 E
ngin
eerin
g Se
rvice
sServices
Al
Page 8 of 19.
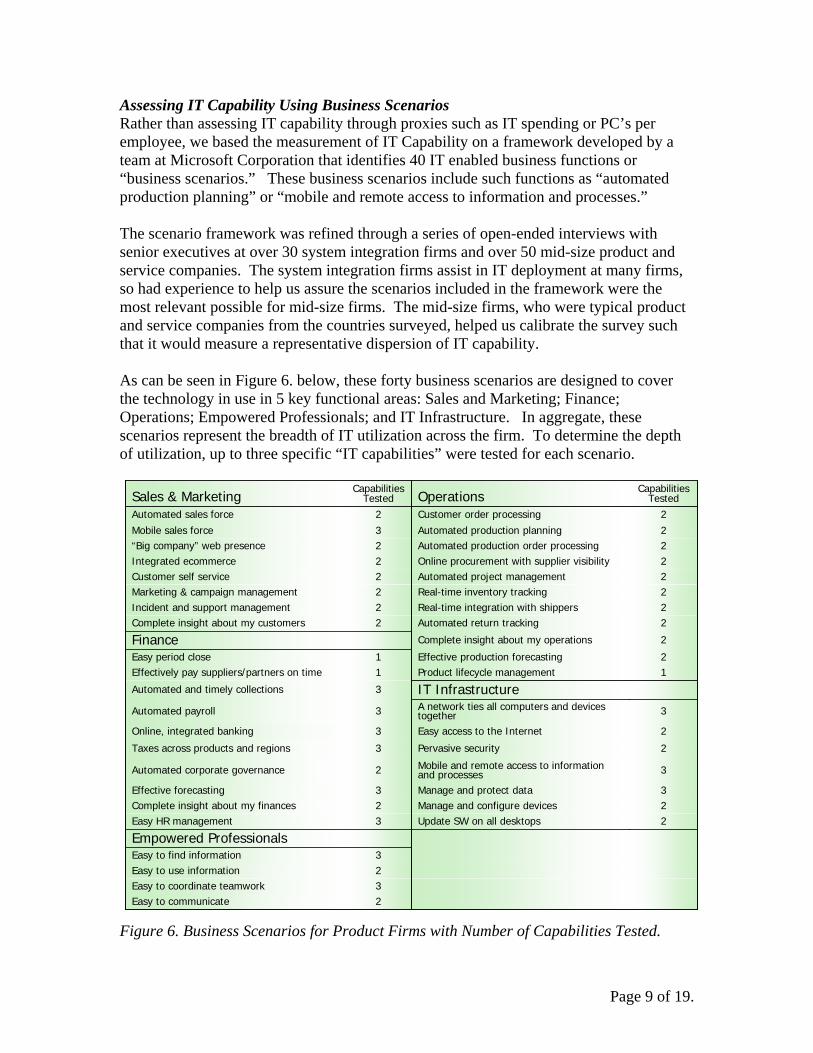
Assessing IT Capability Using Business Scenarios Rather than assessing IT capability through proxies such as IT spending or PC’s per employee, we based the measurement of IT Capability on a framework developed by a team at Microsoft Corporation that identifies 40 IT enabled business functions or “business scenarios.” These business scenarios include such functions as “automated production planning” or “mobile and remote access to information and processes.” The scenario framework was refined through a series of open-ended interviews with senior executives at over 30 system integration firms and over 50 mid-size product and service companies. The system integration firms assist in IT deployment at many firms, so had experience to help us assure the scenarios included in the framework were the most relevant possible for mid-size firms. The mid-size firms, who were typical product and service companies from the countries surveyed, helped us calibrate the survey such that it would measure a representative dispersion of IT capability. As can be seen in Figure 6. below, these forty business scenarios are designed to cover the technology in use in 5 key functional areas: Sales and Marketing; Finance; Operations; Empowered Professionals; and IT Infrastructure. In aggregate, these scenarios represent the breadth of IT utilization across the firm. To determine the depth of utilization, up to three specific “IT capabilities” were tested for each scenario.
2Easy to communicate3Easy to coordinate teamwork2Easy to use information3Easy to find information
Empowered Professionals2Update SW on all desktops3Easy HR management 2Manage and configure devices2Complete insight about my finances 3Manage and protect data3Effective forecasting
3Mobile and remote access to information and processes2Automated corporate governance
2Pervasive security3Taxes across products and regions
2Easy access to the Internet3Online, integrated banking
3A network ties all computers and devices together3Automated payroll
IT Infrastructure3Automated and timely collections
1Product lifecycle management1Effectively pay suppliers/partners on time2Effective production forecasting1Easy period close
2Complete insight about my operations Finance2Automated return tracking2Complete insight about my customers2Real-time integration with shippers2Incident and support management2Real-time inventory tracking2Marketing & campaign management2Automated project management 2Customer self service2Online procurement with supplier visibility2Integrated ecommerce2Automated production order processing2“Big company” web presence2Automated production planning3Mobile sales force2Customer order processing2Automated sales force
Capabilities TestedOperations
Capabilities TestedSales & Marketi
ng
2Easy to communicate3Easy to coordinate teamwork2Easy to use information3Easy to find information
Empowered Professionals2Update SW on all desktops3Easy HR management 2Manage and configure devices2Complete insight about my finances 3Manage and protect data3Effective forecasting
3Mobile and remote access to information and processes2Automated corporate governance
2Pervasive security3Taxes across products and regions
2Easy access to the Internet3Online, integrated banking
3A network ties all computers and devices together3Automated payroll
IT Infrastructure3Automated and timely collections
1Product lifecycle management1Effectively pay suppliers/partners on time2Effective production forecasting1Easy period close
2Complete insight about my operations Finance2Automated return tracking2Complete insight about my customers2Real-time integration with shippers2Incident and support management2Real-time inventory tracking2Marketing & campaign management2Automated project management 2Customer self service2Online procurement with supplier visibility2Integrated ecommerce2Automated production order processing2“Big company” web presence2Automated production planning3Mobile sales force2Customer order processing2Automated sales force
Capabilities TestedOperations
Capabilities TestedSales & Marketing
Figure 6. Business Scenarios for Product Firms with Number of Capabilities Tested.
Page 9 of 19.

In addition, to assure the applicability of the framework to the businesses surveyed, we developed different specific frameworks for the three types of firms included in the research: product firms, services firms, and financial services firms. Figure 6. lists the business scenarios we used for the product companies in our survey. We developed a survey tool that measured the capabilities described by the scenarios to be administered by phone survey. Measuring Financial Performance In addition to the capability data, we collected financial performance data on both profitability and growth for 2003, 2004, and estimated 2005. We also collected data for each firm on IT expenditures (as a percentage of revenue over the previous three years) and number of employees. 50.01.05.420.01.02.920.01.04.0I
T Spend as % of Revenue
37514132500141295001483Number of PCs
500100213500100215500100257Number of Employees
$430$1$63$366$6$42$76$1$142003 Revenue ($$ Millions)
MaxMinAvgMaxMinAvgMaxMinAvg
USGermanyBrazil
50.01.05.420.01.02.920.01.04.0IT Spend as % of Revenue
37514132500141295001483Number of PCs
500100213500100215500100257Number of Employees
$430$1$63$366$6$42$76$1$142003 Revenue ($$ Millions)
MaxMinAvgMaxMinAvgMaxMinAvg
USGermanyBrazil
Figure 7. Showing Summary Statistics by Country on the Firms included on the Study
Page 10 of 19.
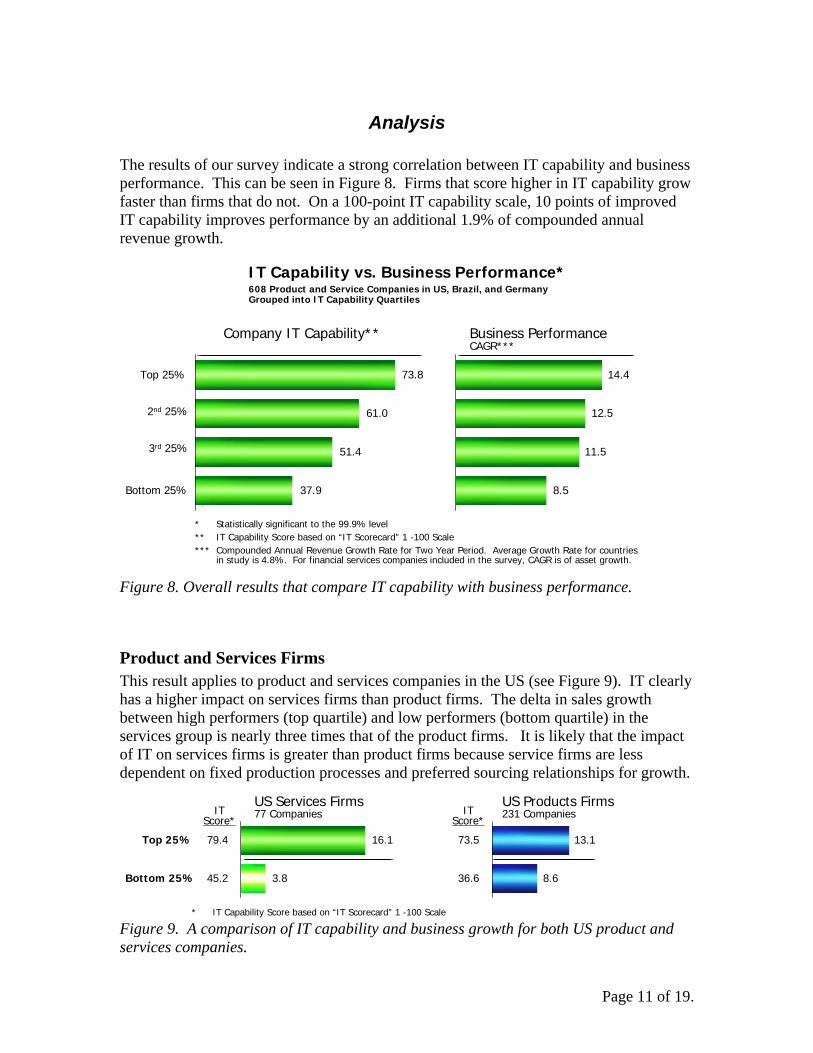
Analysis The results of our survey indicate a strong correlation between IT capability and business performance. This can be seen in Figure 8. Firms that score higher in IT capability grow faster than firms that do not. On a 100-point IT capability scale, 10 points of improved IT capability improves performance by an additional 1.9% of compounded annual revenue growth. Company IT Capability** Business Performance
CAGR*** Bottom 25%
2nd 25%
3rd 25%
Top 25%
IT Capability vs. Business Performance*608 Product and Service Companies in US, Brazil, and GermanyGrouped into IT Capability Quartiles
* Statistically significant to the 99.9% level** IT Capability Score based on “IT Scorecard” 1 -100 Scale*** Compounded Annual Revenue Growth Rate for Two Year Period. Average Growth Rate for countries
in study is 4.8%. For financial services companies included in the survey, CAGR is of asset growth.
73.8
61.0
51.4
37.9
14.4
12.5
11.5
8.5 Figure 8. Overall results that compare IT capability with business performance.
Product and Services Firms This result applies to product and services companies in the US (see Figure 9). IT clearly has a higher impact on services firms than product firms. The delta in sales growth between high performers (top quartile) and low performers (bottom quartile) in the services group is nearly three times that of the product firms. It is likely that the impact of IT on services firms is greater than product firms because service firms are less dependent on fixed production processes and preferred sourcing relationships for growth.
73.5
36.6
US Products Firms231 Companies
79.4
45.2
US Services Firms77 Companies
Bottom 25%
Top 25%
* IT Capability Score based on “IT Scorecard” 1 -100 Scale
13.1
8.6
16.1
3.8
IT Score*
IT Score*
Figure 9. A comparison of IT capability and business growth for both US product and services companies.
Page 11 of 19.

Brazil and Germany The correlation between IT capability and increased growth also applies to in Brazil and Germany (see Figure 10.) although not as markedly. The firms in the study from these countries benefit similarly to the US product firms from the effective use of IT.
71.6
37.3
73.5
36.3
Brazil136 Companies
Germany163 CompaniesIT
Score* Bottom 25%
Top 25% 8.6
3.7
21.8
17.0
IT Score*
* IT Capability Score based on “IT Scorecard” 1 -100 Scale
Figure 10. A comparison of Top and Bottom Quartiles of Brazil and German firms. The Profit Picture While the firms with the top IT scores achieved superior growth, this growth did not come at the expense of profitability. In fact, on average, the top firms slightly improved their profitability as a percent of sales. As a result, the top firms grew in total dollar terms on both the top and bottom lines.
All US Services US Products Brazil GermanyTop 25% of firms in IT Score 10.3% 11.2% 10.4% 15.5% 5.3%Bottom 25% in IT Score 8.8% 12.7% 10.3% 8.6% 5.5%
2004 Profit as a % of Sales
Figure 11: This figure shows that firms in the top Quartile of measured IT capability on average improved their profitability. Growth Rates While the average IT scores of the firms in each group were similar, the growth rates were substantially different. Both Brazilian and US firms grew faster than their counterparts in Germany (see Figure 12). The rates of growth of the economies account for a portion of the between country average growth rate differential.
Avg. Surveyed Revenue GrowthCAGR*
GDP GrowthCAGR**
Germany
Brazil
* CAGR based on 2 year period of 2003-2005.** CAGR based on 2004 and YTD 2005 GDP and Inflation Rates
Comparative Country Growth and Inflation Rates
US
Inflation RateCAGR**
6.220.7
6.3
6.010.5
6.9
1.6
3.0
3.4
Figure 12. A comparison of surveyed firm growth rates based on country of origin.
Page 12 of 19.
Testing Alternative Hypotheses To test that the relationship we describe between IT Capability and Sales Growth is the best explanation of the data, we analyzed a number of alternative hypotheses. One often discussed hypotheses is: larger firms have more IT as well as faster growth, thus the high sales growth is driven by firm size. Regression analysis on the full data set showed that, while IT Score was an extremely significant factor in sales growth, there was no statistically significant relationship between firm size and sales growth.viii
Another potential hypothesis is that the sales growth differential could be explained by IT spending alone. This is particularly interesting test because IT Spend does correlate to a statistically significantly degree with the business scenario-based measure of IT Capability we have employed. However, regression analysis of our data set shows that IT Spend alone is a very poor predictor of Sales Growth. The analysis confirms that a business scenario-based approach to analyzing the relationship between IT and business performance provides a much more robust model.ix
Page 13 of 19.
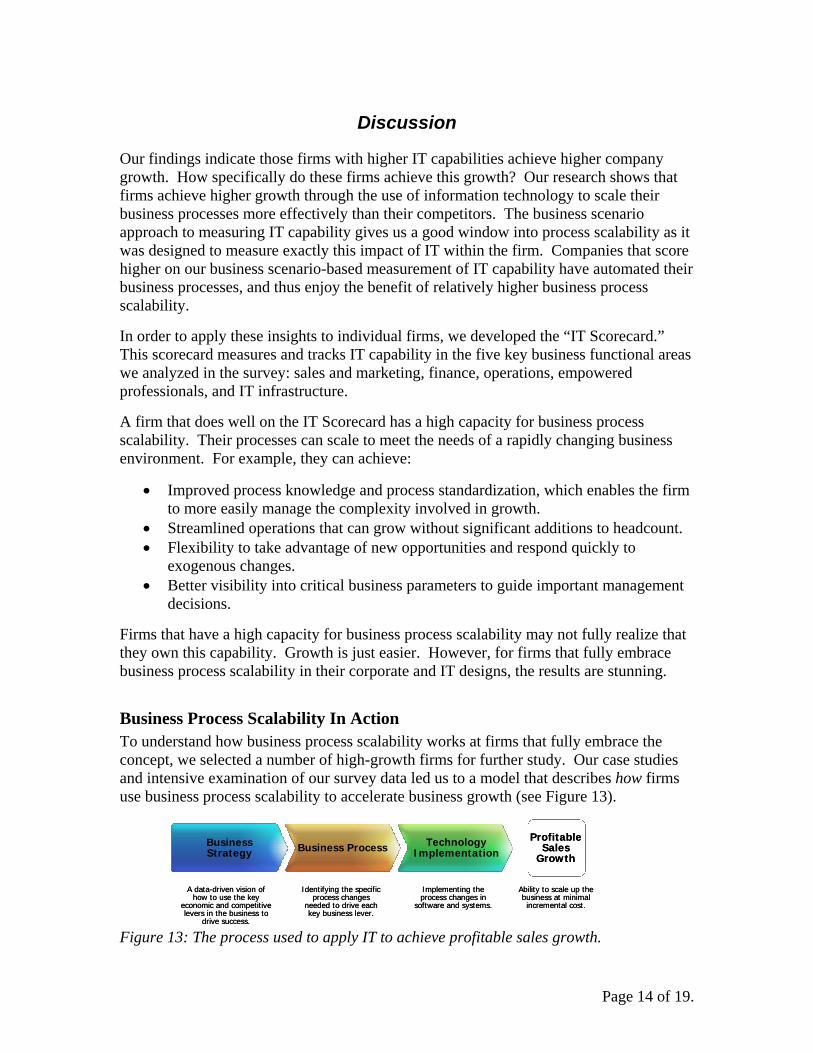
Discussion Our findings indicate those firms with higher IT capabilities achieve higher company growth. How specifically do these firms achieve this growth? Our research shows that firms achieve higher growth through the use of information technology to scale their business processes more effectively than their competitors. The business scenario approach to measuring IT capability gives us a good window into process scalability as it was designed to measure exactly this impact of IT within the firm. Companies that score higher on our business scenario-based measurement of IT capability have automated their business processes, and thus enjoy the benefit of relatively higher business process scalability. In order to apply these insights to individual firms, we developed the “IT Scorecard.” This scorecard measures and tracks IT capability in the five key business functional areas we analyzed in the survey: sales and marketing, finance, operations, empowered professionals, and IT infrastructure. A firm that does well on the IT Scorecard has a high capacity for business process scalability. Their processes can scale to meet the needs of a rapidly changing business environment. For example, they can achieve:
• Improved process knowledge and process standardization, which enables the firm to more easily manage the complexity involved in growth.
• Streamlined operations that can grow without significant additions to headcount. • Flexibility to take advantage of new opportunities and respond quickly to
exogenous changes. • Better visibility into critical business parameters to guide important management
decisions. Firms that have a high capacity for business process scalability may not fully realize that they own this capability. Growth is just easier. However, for firms that fully embrace business process scalability in their corporate and IT designs, the results are stunning.
Business Process Scalability In Action To understand how business process scalability works at firms that fully embrace the concept, we selected a number of high-growth firms for further study. Our case studies and intensive examination of our survey data led us to a model that describes how firms use business process scalability to accelerate business growth (see Figure 13).
Implementing the process changes in
software and systems.
Identifying the specific process changes
needed to drive each key business lever.
Business Strategy
A data-driven vision of how to use the key
economic and competitive levers in the business to
drive success.
Profitable Sales
Growth
Ability to scale up the business at minimal incremental cost.
Business Process Technology Implementation
Implementing the process changes in
software and systems.
Identifying the specific process changes
needed to drive each key business lever.
Business Strategy
A data-driven vision of how to use the key
economic and competitive levers in the business to
drive success.
Profitable Sales
Growth
Ability to scale up the business at minimal incremental cost.
Business Process Technology Implementation
Figure 13: The process used to apply IT to achieve profitable sales growth.
Page 14 of 19.

Repeated iterations of this model allows firms that internalize business process scalability. Once a well-designed information technology infrastructure has been put in place:
• New capabilities and process extensions can be more easily integrated into existing processes.
• Process improvements, through total quality initiatives and employee feedback, are easier to generate, evaluate, and implement.
• Business opportunities can be accessed more quickly and efficiently through the extension of new IT enabled business processes.
• The entire business process portfolio can be more easily monitored and tracked to quickly respond to changes in the business.
The following two case studies provide illustrations of this model in action.
Page 15 of 19.

Case Study 1: PrintingForLess.com (PFL) PrintingForLess.com (PFL), a printer based in Livingston, Montana, is one of America’s fastest growing private companies – it has been listed on the INC 500 for the last three years. In 2004, automated financial and operations data indicated to PFL’s management that its presses were operating at less than optimal capacity due to highly erratic inbound order flow. During peak demand, the company had to turn away orders, driving away new customers and growth opportunities. During periods of low demand, the company’s profitability suffered because many of its presses were idle. To correct this situation, PFL’s management decided to build a system that shared peak order flow with Printer partners. To accomplish this, an existing cross-functional team built and documented a new process that leveraged existing IT capability. From this process document, the company’s IT team rapidly built a new secure Web site for its partners. This site extended its existing IT systems and rapidly flowed orders to partner firms that had excess capacity. As a result of this effort, PFL was able to boost the average utilization of their presses to 100% of their capacity. The company was also able to cherry pick the most profitable orders for internal printing. Business Strategy
Profitable Sales
GrowthBusiness Process Technology
Implementation
• Implemented new order processing system
• Developed partner portal.
• New work sorted for profit potential
• Lower profit work dispersed to partners.
Vision: Increasing capacity utilization hrough leveraging
partners.
Business achieves utilization of 100% of capacity: a dramatic increase in profitability.
PFL
Business StrategyProfitable
Sales Growth
Business Process Technology ImplementationBusin
t
ess StrategyProfitable
Sales Growth
Business Process Technology Implementation
• Implemented new order processing system
• Developed partner portal.
• New work sorted for profit potential
• Lower profit work dispersed to partners.
Vision: Increasing capacity utilization hrough leveraging
partners.
Business achieves utilization of 100% of capacity: a dramatic increase in profitability.
PFL
t
Figure 14: PFL scales its business processes through IT to capture business opportunity.
IT Scorecard: PrintingForLess.com
Sales & Marketing
Overall Score
Finance
Operations
EmpoweredProfessionals
IT Infrastructure
1999 200520% 73%
25% 75%
10% 60%
40% 67%
20% 83%
43% 86%
Figure 15: PFL’s IT Scorecard. Repeated cycles of innovation have improved PFL’s potential for business process scalability over the last 6 years.
Page 16 of 19.
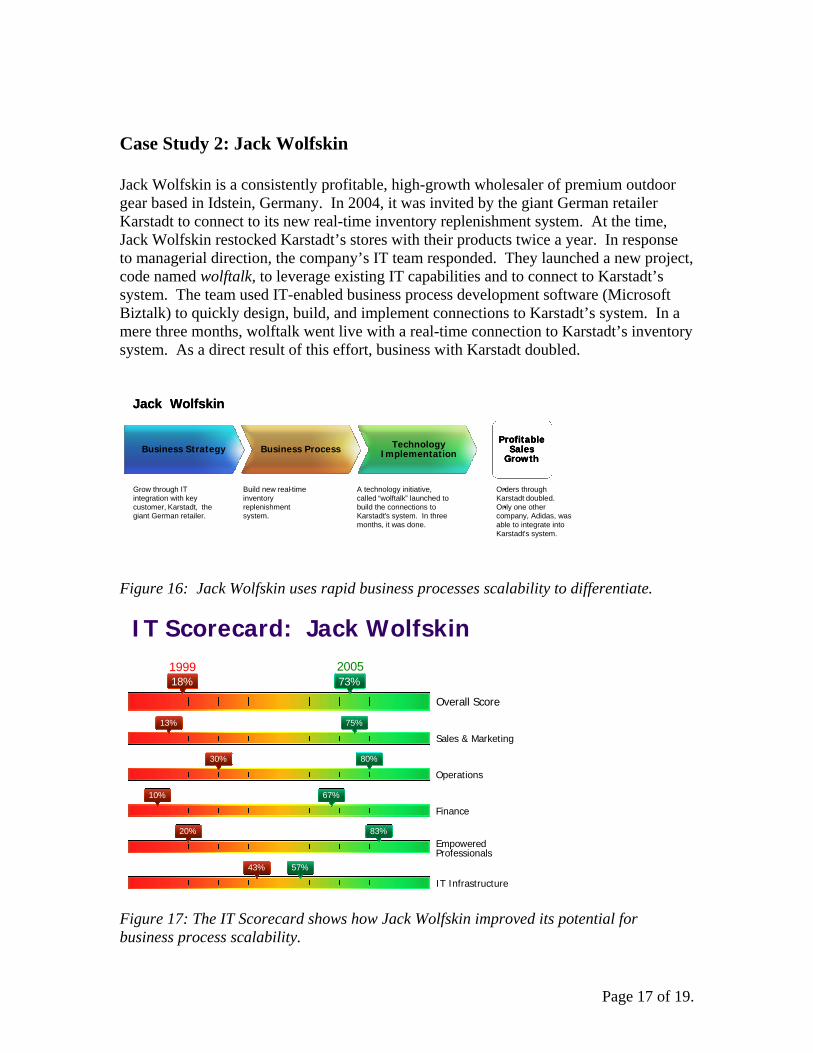
Case Study 2: Jack Wolfskin Jack Wolfskin is a consistently profitable, high-growth wholesaler of premium outdoor gear based in Idstein, Germany. In 2004, it was invited by the giant German retailer Karstadt to connect to its new real-time inventory replenishment system. At the time, Jack Wolfskin restocked Karstadt’s stores with their products twice a year. In response to managerial direction, the company’s IT team responded. They launched a new project, code named wolftalk, to leverage existing IT capabilities and to connect to Karstadt’s system. The team used IT-enabled business process development software (Microsoft Biztalk) to quickly design, build, and implement connections to Karstadt’s system. In a mere three months, wolftalk went live with a real-time connection to Karstadt’s inventory system. As a direct result of this effort, business with Karstadt doubled. Jack Wolfskin
A technology initiative, called “wolftalk” launched to build the connections to Karstadt’s system. In three months, it was done.
Grow through IT integration with key customer, Karstadt, the giant German retailer.
•Orders through Karstadt doubled.
•Only one other company, Adidas, was able to integrate into Karstadt’s system.
Build new real-time inventory replenishment system.
Business StrategyProfitable
Sales Growth
Business Process Technology Implementation
Jack Wolfskin
A technology initiative, called “wolftalk” launched to build the connections to Karstadt’s system. In three months, it was done.
Grow through IT integration with key customer, Karstadt, the giant German retailer.
•Orders through Karstadt doubled.
•Only one other company, Adidas, was able to integrate into Karstadt’s system.
Build new real-time inventory replenishment system.
Business StrategyProfitable
Sales Growth
Business Process Technology ImplementationBusiness Strategy
Profitable Sales
GrowthBusiness Process Technology
Implementation
Figure 16: Jack Wolfskin uses rapid business processes scalability to differentiate. IT Scorecard: Jack Wolfskin
Sales & Marketing
Overall Score
Finance
Operations
EmpoweredProfessionals
IT Infrastructure
1999 2005
18% 73%
13% 75%
30% 80%
10% 67%
20% 83%
43% 57%
Figure 17: The IT Scorecard shows how Jack Wolfskin improved its potential for business process scalability.
Page 17 of 19.

Conclusion IT capability helps companies grow. Our study of over 600 medium-sized global firms shows that IT capability is highly correlated with profitable business growth. This result holds in both the US product and services sectors as well as internationally in Germany and Brazil. Our data indicates that IT accelerates firm growth because it enables firms to scale -- an ability to manage increases in the complexity of their business processes, organization and business model. Firms with business process scalability find it easier to overcome obstacles to growth, differentiate themselves from competitors, and quickly capitalize on opportunities. IT does matter. It is an essential ingredient in long-term business success and not merely a commodity that adds little to the firm’s ability to thrive. IT drives growth. i For more comprehensive reviews of previous literature, please refer to Crowston & Treacy 1986, Brynjolfsson 1993, Brynjolfsson & Yang 1996, Chan 2000, Dewett & Jones 2001, Kohli & Devaraj 2003, and Melville et al. 2004, among others. ii Brynjolfsson & Hitt 1993, 1995, 1996 & 2000, Brynjolfsson 1993, Jorgenson & Stiroh 1995 & 2000, Lichtenberg 1995, Triplett 1999, Oliner and Sichel 2000, Kraemer and Dedrick 2001, Jorgenson 2001, Gordon 2002 iii Weill 1992, Kraemer & Dedrick, 1993; Brynjolfsson & Hitt, 1996, Hitt & Brynjolfsson, 1996, Siegel, 1997, Lee, Barua & Whinston 1997, Sircar, Turnbow, & Bordoloi, 2000, Shin, 2001, Hu and Plant 2001, Hitt, Wu, & Zhou, 2002 iv Bharadwaj (2000) suggests, “IT investment dollars serves as a poor surrogate for assessing a firm’s IT intensiveness.” Devaraj and Kohli (2003) add, “Merely examining the dollars invested in IT may not be an accurate reflection of the effectiveness of IT because the extent of its usage may vary across industries, firms, or processes.” Brynjolfsson and Hitt (1996) suggest another criticism of IT spending. They say that economic theory predicts that in equilibrium companies that spend more on IT will not have higher profitability. Rather, managers will be as likely to overspend, as they are to underspend, thus a company that spends more is not necessarily “better.” By their logic, the finding of a zero or weak correlation between spending and profitability does not indicate a low payoff for computers, but instead suggests an “expected” payoff. v Bharadwaj (2000) compares firms ranked as IT leaders by Information Week with a matched sample and finds that profit ratios were higher for the IT leaders. Stratopoulos and Dehning (2000) use the Computerworld Premier 100 list to define successful and unsuccessful users of IT and they find a link between IT and performance, but their measure is coarse, and causality is difficult to establish. vi Markus & Soh 1993, Barua et al. 1995, Mooney et al. 1995, Soh & Markus 1995, Lukas 1999 Davern & Kauffman 2000, Stratopoulos and Dehning 2000 vii Devaraj & Kohli (2003) propose that the missing link in the value chain is actual usage. Their data from eight hospitals suggests that firms that actually use IT have higher profitability (operationalized as revenue in the hospital context).
Page 18 of 19.
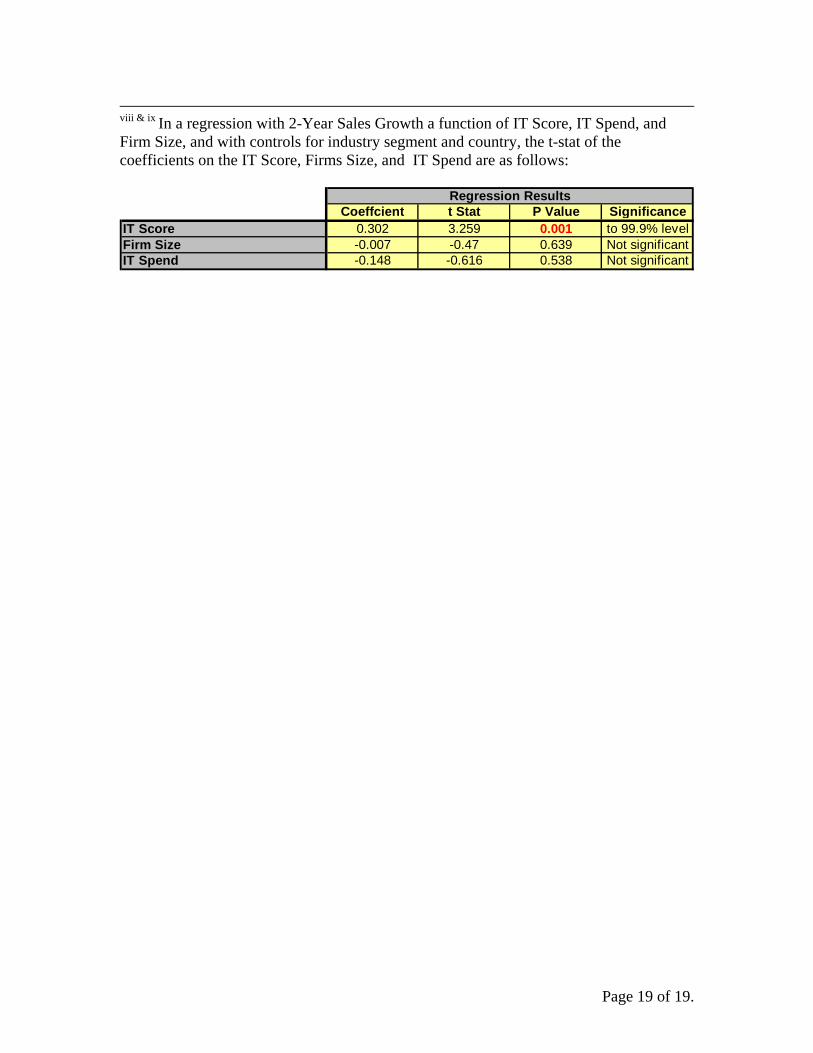
viii & ix In a regression with 2-Year Sales Growth a function of IT Score, IT Spend, and Firm Size, and with controls for industry segment and country, the t-stat of the coefficients on the IT Score, Firms Size, and IT Spend are as follows:
Coeffcient t Stat P Value SignificanceIT Score 0.302 3.259 to 99.9% levelFirm Size -0.007 -0.47 0.639 Not significantIT Spend -0.148 -0.616 0.538 Not significant
Regression Results
0.001
Page 19 of 19.