why nations fail: managerial decisions and performance in ...why nations fail: managerial decisions...
TRANSCRIPT

Why Nations Fail: Managerial Decisionsand Performance in Indian Cotton
Textiles, 1890-1938SUSAN WOLCOTT AND GREGORY CLARK
Between 1890 and 1938 Japan experienced rapid economic growth. India stagnated.This national divergence was reflected in the performance of both countries' leadingmodern industry, cotton textiles. The parallels between national and industry perfor-mance suggest the problems of the Indian textile industry may have been those of Indiaas a whole. Weak management is widely blamed for poor performance in textiles. Ananalysis of managerial decisions in Bombay shows, however, that on all measurabledimensions Indian managers performed as well as they could. The problem instead wasone factor they could not change—the effort levels of Indian workers.
In 1890 Indian and Japanese cotton spinning mills had roughly equal capi-tal and labor productivity. Thereafter, however, the cotton industries of the
two countries diverged dramatically. Table 1 shows estimates of output perworker hour and per spindle hour in spinning in both countries from 1890to 193 8 by five year averages. Between 1890 and 193 8 Japanese firms near-ly quintupled output per worker hour, while output per worker hour roselittle in India. Japan also achieved higher outputs per spindle hour, thoughhere the gains over India were much more modest. The table indicates thatthe Japanese labor productivity advantage was 300 percent, while the Japa-nese advantage in terms of capital was only 50 percent. And because laborcosts in India in the 1920s were at least double the costs of fixed capital, thelow labor productivity of the Indian industry was a much more importantproblem than the lower output per spindle.
The central problem of the Indian textile industry in the years 1890 to1938 was thus the failure to improve labor productivity. In this article, con-centrating in particular on the firms of Bombay, India's largest textile center,we make the following arguments about India's failures. The divergence intextile labor productivity between Japan and India was not due to differencesin machinery. The equipment used in the two countries was basically similar
The Journal of Economic History, Vol. 59, No. 2 (June 1999). © The Economic HistoryAssociation. All Rights Reserved ISSN 0022-0507.
Susan Wolcott is Associate Professor, Department of Economics, University of Mississippi, Univer-sity, MS 38677. Gregory Clark is Professor, Department of Economics, University of California,Davis, CA 95616-8578.
We thank the following for advice, help, and responses to queries, without implicating them in any wayin the conclusions of the article: Chris Hanes, Tim Leunig, Peter Lindert, Joel Mokyr, Gary Saxonhouse,Gavin Wright, and two anonymous referees, as well as seminar participants at Yale University, at theCliometrics Conference at Vanderbilt University in 1996, and at the conference on "Cotton as a PrimeMover in World Industrialization" at Manchester Metropolitan University, Jury 1997.
397

398 Wolcott and Clark
TABLE 1
CAPITAL AND LABOR PRODUCTIVITY IN SPINNING 20S YARN: INDIA AND JAPAN,1890-1938
Period
1890-18941895-18991900-19041905-19091910-19141915-19191920-19241925-19291930-19341935-1938
Pounds of Yarn perWorker-hour
India
0.750.790.800.780.750.730.921.13—
0.90
Japan
0.800.891.351.421.631.911.882.563.543.99
Pounds of Yarn per
India
0.0270.0280.0260.0290.0270.0260.0270.034
—0.030
Spindle-hour
Japan
0.0260.0360.0390.0400.0440.0420.0420.0420.0480.045
Notes: The figures for India for the years 1925-1929 are a from a sample of some Bombay mills in 1929only. We show later that in Bombay there was little increase in output per worker between 1907 and 1938.The figures for India from 1935—1938 are for 1949, because figures for the intervening years are notavailable. As can be seen there is no growth in labor productivity in India between 1920 and 1949.Source: Clark, "Textile History."
and did not change significantly in either country over the period 1890 to1930. Nor was there a lack of entrepreneurial initiative in India. It appears thatinvestment responded to relatively modest positive profit rates, and had Bom-bay mills brought their labor requirements down to those of English and laterJapanese mills, their profits would have risen enough to justify a great expan-sion. Why did managers fail to improve labor productivity? There is no evi-dence for the conventional view that the problem of the Indian industry wasmanagerial.1 Some Bombay managers did take steps to "rationalize" laborusage and achieved staffing levels similar to Japanese averages. The majorityof Indian managers did not follow their lead because firms which rationalizeddid not improve profits. A contemporary manager who noted "that in manysections of the industry, operatives were not doing from more than three tofour hours actual work" was correct.2 A preference for low labor inputs byworkers was at the heart of the Indian cotton industry's problems. The sourcesof this preference cannot be completely resolved here. The low efforts of theIndian workers could reflect worker solidarity and a failure of bargainingbetween workers and managers to translate these unused efforts into useful
1 Supporters of the conventional view include Bagchi, Private Investment; Chandavarkar, Origins;Kiyokawa, "Technical Adaptations"; Mass and Lazonick, "British Cotton Industry"; Otsuka, Gustav,and Saxonhouse, Comparative Technology, and Morris, Emergence. Morris argues that while theoverstaffing may not have been a problem in the early history of the industry, efforts to eliminate it inthe interwar period were unsuccessful due to management's lack of direct control over labor. Morris,Emergence, pp. 129-53. Clark, "Would Better Management," discusses the importance of managementin mill success in India and China in the 1920s.
2 India. Royal Commission on Labor in India [hereafter IRC]. Evidence, vol. 1, part 1, p. 486.

Why Nations Fail 399
work, a result of the peculiar institutions of the Indian labor market. Or, thelow efforts could reflect the leisure preferences of Indian workers.
THE BOMBAY INDUSTRY AND ITS PROBLEMS, 1890-1938
At the most basic level the problem of the Indian industry was a huge excessof workers assigned to each machine. Based on the technical specifications ofthe machines and the practices of countries such as England and the UnitedStates, Indian mills, even in the relatively productive center of Bombay, em-ployed as many as five times the number of workers as were needed. MorrisMorris argues that India's low wages and high capital costs explain the addi-tional labor. The apparent excess manning was actually optimal, he argues,because it allowed managers to run the machines faster with fewer stoppages.3
Yet even under particular Indian conditions, such as high breakage rates,most of the mill labor force was redundant. Consider, for example, time studyestimates of the minutes required per task in spinning. These predict well thenumber of workers required per spinning frame at different yarn counts in U. S.mills in 1949. Workers had five tasks to perform in ring spinning: to replaceexhausted input packages (creel), to repair thread breaks (piece), to clean lintfrom the machine, to patrol to check for breaks, and to remove the filled outputbobbins (doff). The second column of Table 2 shows the frequency of eachtask per hour on a spinning frame of 326 spindles under Indian conditions.There is some uncertainty about the breakage rate, which would affect piecing.We assume 25 breaks per 100 spindle hours, which would be 2.5 to 7 times theBritish and American breakage rates in this period. This is at the upper end ofthe various estimates we have.4 The third column of Table 2 shows the minutesrequired per task. The fourth column shows the total minutes required perhour per frame in India. Each spinning frame should have required less thanone worker. A conservative estimate of the actual number of workers tend-ing each frame, however, is somewhere between 3 and 3.8.5 Thus between
3 Morris, Emergence, p. 6.4 One expert cited the records of a Bombay firm in 1938 as indicating 27 breaks per 100 spindle
hours. He claimed he had seen rates higher than this: as many as 35 breaks per hour. Maharashtra StateArchives [hereafter MSA]. Textile Labour Inquiry Commission, Oral Evidence, vol. 21, pp. 4983 and4977, File 7-B. On the other hand, Pearse watched two frames for three minutes in a Bombay mill in1929 without seeing a single break. If the breakage rate was as high as 25 breaks per 100 spindle hours,he would expect to see 8.5 breaks in this time, and the chances of seeing zero would be 2 in 10,000.Pearse, Cotton Industry, p. 129. Even using the highest rate quoted, 35, would still only add 9.4 minutesof work per hour per frame, which would not materially change the implications of Table 2.
5 Thus, for example, it was reckoned that in an average Indian spinning room in 1929 spinning 20syarn the labor required would be in total 5.1 workers per frame, including however, ancillary workerssuch as bobbin carriers and sweepers, and supervisors. Cotton Yarn Association, "Statistics," p. 12.Modern mills in Bombay were said to employ 3 operatives per frame—2 spinners and a doffer—buteven these mills would employ extra workers to assist the regulars. Pearse, Cotton Industry. An alterna-tive estimate of the total numbers of workers per spindle comes from the wages census of 1921, which

400 Wolcott and Clark
TABLE 2
LABOR REQUIREMENTS IN SPINNING 20S YARN IN INDIA, 1890-1929
Task
CreelingPiecingCleaningPatrolingDoffingMinutes requiredMinutes availablePercent labor efficiency
Tasks per Hourfor 326 Warp
Spindles
18.773.4—6
132
Time Requiredper Task
(Seconds)
17.516.6
301 •233.9
Total TimeRequired(Minutes)
5.520.35.22.38.6
41.9180 to 230
18 to 23
Notes: Calculations assume that the net weight of yarn on the input (creel) bobbin is 0.63 pounds, thatoutput per spindle per hour is 0.036 pounds, and that the net weight of the yarn on the output bobbin is0.089 pounds. These assumptions are taken from the average specifications of machines purchased byIndian firms from Platt's in the years 1890 to 1929, assuming 90 percent spindle efficiency in operation.Sources: The times required for each operation are an average of those given in Doraiswamy, "Scope";Cotton Spinning Productivity Team, Cotton Spinning; Grosse, "Technological Structure"; Gunther andGross, "Spinner's Task"; Subramanian and Garde, End Breaks; and Textile Council, Cotton. Theestimate of actual workers per frame is discussed in the text.
three-quarters and four-fifths of the workers in Indian mills were super-numerary. Doffers, for instance, would be required to work only 9.6 minutesof each hour. This exercise indicates that Indian spinning mills were over-staffed by at least 300 percent. In marked contrast, similar calculations forJapan indicate that by the late 1930s Japanese mills were close to the levelof staffing we would expect from time studies estimates.6
While Indian labor productivity was low, output per spindle hour in Indianmills compared well with English and U.S. performance. Thus in 1924 outputper spindle hour spinning 20s ring yarn was estimated as follows: UnitedStates, 0.031 pounds per hour; England, 0.029 pounds per hour; India, 0.028pounds per hour; Japan, 0.042 pounds per hour.7 Spindle productivity thuslooks good compared to both the United States and England, and while it lagsJapan the differences are minor compared to labor productivity.
An examination of the details of the ring spinning machines purchased byboth countries from Platt Brothers in Lancashire, the world's major supplierof textile machinery, makes it clear that the rise in labor productivity inJapan in relation to India had little to do with the differences in machinery
implies 3.8 workers per frame in Bombay. The census reveals that the 2,381,876 ring spindles inBombay in 1921 were tended by 15,183 spinners and 7,385 doffers, as well as 5,485 "gaiters" and"tarwallers and followers." This would imply one spinner per 157 spindles, as well as one doffer per323 spindles, and a further helper per 434 spindles. Shirras, Report of an Enquiry into the Wages, pp. 4,25,35,37. The labor officer of the Bombay Millowners Association gave best practice in 1957 at 8.75workers per 1000 spindles on 20s count, or 2.85 workers for a frame of 326 spindles.
6 Clark, "Textile History."'Ibid.

Why Nations Fail 401
TABLE 3
TECHNICAL SPECIFICATIONS OF NEW RING SPINNING MACHINERY: INDIA ANDJAPAN, 1890-1934
Period
1890-18991900-19091910-19191920-19291930-1934
Number ofObservations
India
2817286560
Japan
137
48106
9
Average Draft
India
5.95.76.36.7
12.2
Japan
6.26.86.38.8
13.8
Average RingBobbin Size*
India
100103101112115
Japan
10097
100105113
Average; RovingBobbin Size*
India
10093
110121160
Japan
95104109138245
•These sizes have been set equal to 100 for Indian machines over the years 1890-1899.Notes: All measures are standardized for a machine spinning 20s count yarn using information for 1,596orders of ring machinery for all countries between 1890 and 1934.Source: Lancashire Record Office, Platt Ring Order Books, Platt MSS, DDPSL 1/42/7-42.
choices. Labor requirements per pound of yarn were influenced by such factorsas the size of the yarn packages that workers had to transfer between machinesand how many preparation steps were required before raw cotton reached thering frame. Larger packages and fewer processes lowered labor requirements.Table 3 shows the major characteristics of machines purchased by India andJapan in each decade from 1890 to 1934 which affected labor requirements. Theaverage draft of a spinning frame is the weight per yard of the cotton input,called roving, divided by the weight per yard of the yarn produced. The greaterthis number, and hence the coarser the roving, the smaller the number of prepa-ratory frames the roving has to pass through. Drafts were similar between thetwo countries until the mid-1920s, when average draft increased in Japan. Draftsalso increased in India shortly thereafter. These increases reflect the introductionof new techniques called "high drafting," which allowed the spinning machineto use coarser roving, delivered in bigger input packages which reduced creelinglabor. The last two columns of Table 3 show an index of the package size, nor-malized to be 100 for India in the 1890s. Input packages got significantly biggerin Japan in the late 1920s and India in the 1930s. High draft spinning did nothave much impact on the size of the output package, the ring bobbin; nor is theremuch change in ring bobbin size between 1890 and 1934 in either country.
Overall, we see that until the mid-1920s India and Japan bought machineswhich were almost identical in their labor requirements per pound of yarnspun. After 1925 Japan moved more quickly toward high draft spinning. Butbecause this saved labor only on new machines starting in the later 1920s,and because Japan's lead in adopting this technique was short lived, thisexplains little of the differences in labor productivity trends in each countryover the longer period, 1907 to 1938.
Despite the manifest problem of too many workers, the Indian industryshowed little sign of any improvement in manning levels before 1938.

402 Wolcott and Clark
TABLE 4
CHARACTERISTICS OF THE BOMBAY COTTON INDUSTRY, 1907-1938
Year
19071908190919101911191219131914191519161917191819191920192119221923192419251926192719281929193019311932193319341935193619371938
Gross ProfitRate on Fixed
Capital
0.110.08——
0.020.090.070.03—
0.070.100.05—
0.160.130.080.020.00
-0.010.000.03
-0.020.00
-0.010.010.00
-0.010.010.010.010.020.03
Industry Size(millions of spindle
equivalents)
2.933.113.233.303.383.393.463.603.643.663.693.663.733.753.843.994.284.404.454.494.504.504.524.514.514.524.334.153.963.963.843.87
LaborEfficiency
Index
0.960.97——0.950.950.940.91—0.970.950.98—1.021.061.031.011.000.971.021.001.340.950.930.920.930.950.900.930.910.910.90
Mule-to-SpindleRatio
0.390.370.340.330.320.300.290.270.250.240.220.220.220.210.210.190.160.140.130.120.120.110.110.100.100.100.100.090.080.080.070.06
ValueShare of
• Spindles
0.840.830.820.810.810.810.810.800.790.790.770.760.760.760.760.760.760.760.760.760.760.750.750.750.750.750.750.750.750.750.740.74
Notes: The labor efficiency index is the average of L, / Lo, the ratio of actual labor inputs to predictedlabor inputs. Value share of spindles is value of spindles / (value of spindles + value of looms). See thetext for the derivation of these figures. Profits and L, /Lo are constructed only for the mills listed in theInvestor's India Yearbook. For the construction of profit rates see the Appendix.Sources: Profit data are from the Investor's India Yearbook, and are calculated as described in theAppendix. All other data are from the Bombay Millowners' Association annual reports.
Table 4 gives a summary picture of the Bombay cotton industry in the years1907 to 1938. The third column shows the size of the industry measured inmillions of ring spindle equivalents, where mule spindles and looms wereconverted to equivalent ring spindles based on their relative associated fixedcapital. The industry grew from 1907 to 1924 at an average of 3 percent peryear, but thereafter stagnated and eventually began to decline in size. Be-cause output per machine was relatively standard, a simple measure of labor

Why Nations Fail 403
productivity is the number of machines manned by each worker.8 To obtainan industry-wide measure of machines per worker, we needed to control forthe varying composition of the equipment in different mills. We constructedthe index of labor per machine complement in the following way. Becausefirms had different types of machinery—rings, mules, and looms—whichembodied different capital-to-labor ratios, to measure labor inputs per millwe estimate a regression
LABOR, = axRINGS, + a2MULES,+ a^LOOMS, + e,
over the years 1907 to 1938. This gives the average amount of labor used asa function of the number of machines of each type each firm was utilizingthat year.9 The estimated coefficients are
LABOR, = 0.032 RINGS, + 0.028 MULES, + 0.928 LOOM,(0.001) (0.001) (0.029)
R2 = 0.10, N= 1,707
with standard errors in parentheses. These estimates are similar to the aver-age manning levels Pearse obtained from a survey of Indian mills in 1930,where he found 0.021 workers per ring spindle and 0.91 workers per loom.10
Further, the labor per mule is less than the labor per ring, as we would expectbecause a mule's output per spindle was less, and therefore there would beless cotton input per spindle and less preparatory work.
We use these estimates to calculate for each firm Lo, the amount of laborits equipment would be predicted to require on average. The ratio of actuallabor inputs to predicted inputs is L, I Lo. The average of this measure from1907 to 1938 will be unity. Firms for which the measure is greater than oneuse more labor than predicted by their equipment. As reported in Table 4,this measure shows that there was very little change in the capital-to-laborratio over time. The ratio of actual to average labor inputs starts at 0.96 in1907, and ends at 0.90 in 1938.11 Clearly, the Bombay mills in aggregatewere not shedding much labor over this period, despite a vigorous debateabout rationalization. Contrast the stagnation of this ratio in Bombay to the5 5 percent increase in the capital-to-labor ratio we observe in Japan betweenthe periods 1920 to 1923 and 1935 to 1938.12
I Clark, "Why."9 In the estimated regression, we transformed all variables by dividing by the size of the working
capital stock. This normalization avoids heteroskedasticity from larger mills having larger error terms.10 Pearse, Cotton Industry, pp. 288-306.II Labor used per machine increases slightly on this index in the 1920s. This increase is probably a
result of changes in the composition of the sample. The records of 19 firms are given in the 1911edition, b u t 4 4 i n t h e l 9 1 9 edition. Investor's India Yearbook, years indicated.
12 See Wolcott, "Perils," table 1.

404 Wolcott and Clark
While the Indian industry as a whole experienced stagnant labor produc-tivity, some mills did reduce their manning levels. The firm of E. D. Sassoonwas the pioneer.I3 After a "careful survey of the international textile situationmade in 1923," Fred Stones, the manager of all of the Sassoon mills, con-cluded that the Japanese and Chinese were able to undersell Bombay due tolower labor costs and product standardization. He noted that past attemptsto lower Bombay wages had resulted in strikes, and determined that it wouldbe preferable to decrease labor costs through "Fordizing" the industry. Thisstrategy later came to be known as "rationalization" in India. An examina-tion of his mills convinced him that in many sections of the industry, opera-tives were not doing more than three to four hours actual work, and theactual amount of work that could be done in these particular departmentscould easily be doubled without unduly taxing the worker.14
Stones thus altered his labor practices to increase the number of machinesper worker. Despite worker resistance, by 1935 the four most rationalizedSassoon mills employed only 0.58 workers per standard unit of labor re-quired in Bombay. The other Sassoon mills on average used 74 percent ofthe average labor input of Bombay mills. Though several other firmsclaimed to have rationalized parts of their mills, the Bombay Labour Officerstated that only two other firms had done so successfully.15 Toyo Podar, theonly Japanese owned and managed Indian mill, used only 69 percent of thepredicted labor. Bombay Dyeing and Manufacturing, managed by NessWadia, a Parsi trained in England, used only 68 percent of the predictedlabor. The Bombay average in 1935 excluding these "rationalizers" was 0.93workers per predicted worker, a substantial difference.
Estimated average annual profit rates for Bombay mills, calculated asexplained in the Appendix, are shown in the first column of Table 4. Be-cause throughout this period the interest cost of capital to mills seems tohave been about 6 percent, and the depreciation cost of buildings and ma-chinery would be at least 2 percent, we would expect new investment onlyif the gross profit rate on fixed capital was above 8 percent. Profit ratessurpassed 8 percent only in the years 1907/08,1912/13, 1916 to 1918, and1920 to 1922. The decline of the industry in the late 1920s and the 1930s isclearly explained by the inability of firms to make enough profit to justifynew investment. The connection between profits and investment is evident
13 In 1923, at the start of their rationalization efforts, the firm owned six mill companies (and a totalof 11 mills), and employed 21,078 workers, 14 percent of the Bombay workforce. By the end of theinterwar period the firm had also acquired two "upcountry" mills, but one of their Bombay mills waslargely shut down.
14 IRC, Evidence, vol. 1, part 1, p. 486.15 The four rationalized mills were the Edward, Meyer, Manchester and Apollo Mills, which had
moved to six looms per weaver, as had the Japanese. All of the other Sassoon mills had rationalizedspinning, and parts of their weaving operations. Textile Labour Enquiry Committee, Extracts, vol. 2,pp. 2 and 20, File 81(3).

Why Nations Fail 405
statistically. If we estimate the percentage change in capital in year t on theprofit rates from two years before we find the following relationship.
GROWTHRATE, = 0.010 + 0.363(PROFITRATE,, + PROFIT RATE l2) 12(0.007) (0.091)
Standard errors are in parentheses. There is a strong connection betweenprofit rates and subsequent growth rates.16
The excess labor of Indian mills was enough on its own to make a dra-matic difference to the profitability of the industry. The amount by whichprofits should increase as the manning levels are reduced depends on theshare of capital, labor, and other inputs in the costs of production. In general,in an industry with free entry we will find that for the average firm,
pQ=7T0K+wL+pcX
where pQ is revenue, n0 is the gross return on capital, including deprecia-tion, and K is the value of the capital stock, wL are wage payments, and p^Care payments for other inputs (here mainly cotton, fuel, and lubrication).Suppose the average labor requirement is Lo. Then if the labor requirementof a given firm is Z, the profits of the firm will be,
K={pQ-wLi-pcX)IK= (pQ-wL0-pcX)'K+(wL0-wL,)/K (1)
For Indian mills in this period the annual wage bill would be about 10percent of the value of the capital of the mill (measured as the replacementcost).17 An Indian mill which reduced its labor usage to the amounts sug-gested by the time studies of Table 2 should have increased its gross returnon capital by 8 percent. Because the average firm even in the good years of1907 to 1922 was making a gross return on capital of only 8.25 percent, thiswould represent a very large increase in terms of the average net return oncapital. Indeed the implied profit rates with no overmanning in Bombay
16 These estimates imply growth at average profit rates as low as 3 percent. But the relation betweengrowth and profits should be nonlinear, with growth at profit rates above 8 percent, no growth fromzero to 8 percent, and contraction at rates below zero percent. The linear relationship we fit to this datawould have an expected intercept of between zero and 8 percent. The actual estimate is thus within theexpected range.
17 Rutnagur, Bombay Industries, gives wage costs for all Bombay firms in 1924. We used this datato compute the average.

406 Wolcott and Clark
would be sufficient to cause the industry to grow even in the years 1924 to1938 when gross profits in practice were close to zero.
Though little was changing in manning levels over the years 1900 to1938, the Bombay industry was restructuring in other ways. The fifth andsixth columns of Table 4 show the ratio of mule spindles to all spindles, andthe ratio of the value of spindles to all fixed capital. From 1907 to 1938 thefraction of spindles which were mules declined steadily from 39 percent to6 percent. Until 1924 this reflected both large purchases of rings and largeabsolute declines in the stock of mules. After 1924 both scrapping of mulesand installations of rings continued, but at a much slower pace, suggestingthat the ring was viewed as more profitable throughout. But because muleswere only being scrapped gradually, the remaining mule spindles still shouldhave yielded positive profits if managers were rational. From 1907 to 1938the ratio of spindles to all equipment moved from 84 to 74 percent. This isa much less dramatic decline than for mule spindles, and it was a decline thatwas largely complete by 1918. We would thus expect that in the earliestperiod looms would have been more profitable than rings, but thereafterthere should have been no difference in profit rates between looms and rings.
THE CAUSE OF OVERMANNING IN BOMBAY
While the symptom of the Bombay industry's failure is easy to diagnose—too many workers—discovering the cause of these problems is difficult.
The proponents of managerial failure would argue that the excess labor inthe mills was due to ineffective management.18 Though doffers, for example,may have been idle most of the time, their idleness could represent a failure bymanagers to supervise them effectively or to realize that there was much un-tapped labor potential. Subsequently we use the calculated profit rates of indi-vidual firms in Bombay in the years 1907 to 1938 to argue that there is noevidence that managerial failings had any responsibility for surplus labor inBombay mills. We do this in three ways. First, we show that firms whichreduced their labor usage per machine did not increase profit rates. Second, weshow that where strategies did seem to be associated with greater profits, firmspursued those options: when firms earned profits they invested in expandingcapacity; when profits disappeared after 1924, firms bought no new plant, evenwhen they had reserves of cash; when looms appeared to earn more profits inthe 1910s, firms acquired looms; because ring spindles were associated withhigher earnings per unit of capital than looms, firms generally only investedin rings. Third, we show that where firms varied in their choices, such as inwhether to employ local or foreign managers, or what size to make mills, thesevariations were not associated with any systematic differences in profits. In
18 See note 1 for a list of scholars who hold this view.

Why Nations Fail 407
short, where profit opportunities appeared, managers in India exploited them.Where different choices were not clearly associated with differences in profits,then we observe a variety of decisions.
The profit rates for mills were constructed from several sources. The Appen-dix explains in detail how this was done. As the profit rates are important to ourclaim that the overmanning in Bombay was not a managerial problem, we needto be confident that the profit rates are reasonably reliable. The underlying bal-ance sheet data are drawn from the published annual reports of incorporatedfirms, which were attested to by independent accountancy firms and filed withthe registrar of firms. The calculated profit rates correlate well in aggregate andfor individual mills with other indicators of success or failure. As noted earlier,the aggregate statistical relationship between growth and profits is quite strong.The pattern fits with what we would expect from anecdotal accounts. The Bom-bay Millowners Association first applied for tariff protection from the Indiangovernment in 1925, the firstyear in which average profits became negative. Theextended general strikes of 1928 and 1929 show up as a second bout of negativeprofit rates. The negative profit rate in 1933 (actually, for most firms, April 1933to March 1934), corresponds to the general strike which ended in April 1934,and estimated profit rates improve in the later 1930s as significant protection isgranted to the industry. The aggregate data also correspond well to the state ofthe market in Bombay. We regressed the aggregate profit rate on the ratio ofcotton mill wages to cloth value added. The estimated coefficient is negative, asexpected, and statistically significant at better than the 1 percent level.
Perhaps the strongest evidence of the reliability of individual profit ratesis that these correlate also at the individual level with individual mill growthand with measures of the capacity utilization of the individual firms. A re-gression of individual mill growth on the average of the previous two yearsprofit rates yields the following relationship
GROWTHU = 0.01 + Q2\l(PROFITRATEit - 1 + PROFITRATEU - 2) / 2(0.004) (0.049)
adjusted/?2 = 0.02, N = 778
with standard errors in parenthesis.19 Given that growth should be a functionof expected future profits, for which past profit is a weak proxy, the clear
19 The intercept is larger and the slope coefficient smaller than in the aggregate regressioa This isas expected. The growth variable in the aggregate regression considered the industry as a whole,including mills for which we do not have profit data. The assumption is that the observed profit dataseries is a reasonable proxy for the profit rate pattern of the industry as a whole. The growth variablein the individual regression included only mills for which we have profit data Most of the growth andsubsequent decline of the industry as a whole came from mills entering and exiting. By construction,if a mill remained in our sample, it did not exit the industry. Thus the average growth of our sample isgreater than the average growth of the industry as a whole. The tendency of the industry to expandprimarily through entry also explains why the aggregate growth response to profits is greater than theindividual mill response.

408 Wolcott and Clark
Io
i<
U.Us -r o _ Nonrationalizers • = Rationalizers
0.06 -r
o ©
0.02 -
0
04
-0.02 -
0.6 . 0.8
Average Manning Level Index
1.2 1.4
FIGURE 1
AVERAGE PROFIT RATES AND MANNING LEVEL INDICES, 1935-1938
Notes: These are the average profit rates and manning level indices, Lj / Lo, of the 27 firms for whichwe have profit data in the period from 1935 to 1938. The rationalizing firms are those identified by theBombay Labour Officer as having successfully "rationalized" their production (File 81(3) TextileLabour Enquiry Committee, Extracts on Rationalization, vol. 3, p. 2). Toyo Podar is the onlyrationalized firm not included here as there are no published profit data.Source: See the text.
association is a strong sign that the individual profit rates convey good infor-mation about the success of firms. Capacity utilization is also correlated withthe pattern of individual mills' profits over time. For the 30 firms for whichwe have at least 15 annual data points, capacity utilization has a positive andstatistically significant effect on the mill's profit rate in 21 cases. The effectis positive in all 47 cases for which we have any data. Thus the aggregateand cross-section patterns of the profit rate series seem to correspond wellwith measures that we know a priori should be correlated with profits.Though our estimates may be less than perfect, they are sufficient to detectthe large increases in profits that an elimination of overmanning in Bombayshould have created.
Yet these estimated profit rates in fact show little association between theshedding of labor and the making of profits. Figure 1 shows the profit ratesof 28 Bombay mills for the years 1935 to 1938 compared to their averagelabor efficiency Z, / Lo (actual workers divided by expected workers). Therationalizing mills, represented by black circles, are clustered at the left endof the graph with low labor usage. Clearly, the rationalizers on average madeno more profit than the nonrationalizers. The average profit rate of the ratio-

Why Nations Fail 409
nalizers was 1.7 percent, while that of the nonrationalizers was 2.0 percent.Shedding surplus labor did not lead to higher profits in Bombay.
Bombay Dyeing and Manufacturing, which generated a 6 percent return,was the most profitable of the rationalizers. But even this mill was not asuccess in the eyes of its managers. The minutes of the board of directorsmeetings show that the profit rate was only sufficient to induce some re-placement of worn out equipment.20 Between 1930 and 1938 the board au-thorized average annual expenditures on equipment of 374,469 rupees, 1.3percent of the value of their fixed capital stock. On net, however, the num-bers of their spindles and looms declined. During these years the board alsoauthorized large investment of surplus cash on government bonds. By 193 8 themarket value of the company's holdings of government bonds was 8,026,989rupees, sufficient to extend their mills by 25 percent had they wished.
To test more systematically for the effect of labor utilization on profits weestimated the following regression for each of four subperiods: 1907 to1914,1915 to 1918,1922 to 1924, and 1935 to 1938.21
nit = b0 + b,RINGit I Kit + b2LOOMH I Kit + b3Lit I Lo + b4FORDUMit
+ bsKit + b6AGEit + b7i\ - UTILU) + eit
where RING,, is the fraction of the capital stock which is rings and LOOMit
is the fraction of the capital stock which is looms. The coefficients b, and b2
measure the differences in profit rates between rings and mules, and loomsand mules, respectively. FORDUMit is a dummy variable which is one whenthe mill is foreign owned, and Ku is the size of the capital stock in the mill.The variable AGEU is an indicator of the average age of the machinery ofthe mill.22 The evidence of the Platt data on machine purchases suggests thatthe coefficient on this variable should be negative but small. UTILit is thefraction of the mill equipment in operation in the period in question. Somemills did not operate to full capacity for all the years for which we haveprofit rates: they were closed by strikes; equipment was installed, but onlybegan operating part way through the year; or they closed down for part ofthe year because of lack of demand. Table 5 shows the result of estimatingthis regression using the average values for each mill in each period.
20 Bombay Dyeing and Manufacturing Co., Minutes of the Board of Directors Meetings, 1930-1938.21 The early subperiods are dictated by data availability. We limited the last period to the later 1930s
to give rationalization the best chance of being effective. Anecdotally, resistance to rationalizationended after the 1934 General Strike.
22 For machinery where we know the purchase date the age is taken as the years since purchase. Forany machinery where we do not know the purchase date the age is taken as the years since the mill wasfounded. Suppose, for example, a mill started in 1907, but we begin to have data on profits and machinepurchases only in 1920, and it doubles its machinery stock in 1924 with no subsequent additions. Thevariable AGE would be {YEAR- 1907) from 1920to 1923.From 1924 to 1938, the variable age wouldbe (YEAR - (0.5 * 1907) - (0.5 * 1924)).

410 Wolcott and Clark
TABLE 5
RESULTS OF REGRESSIONS OF PROFIT RATES ON FIRM CHARACTERISTICS,1907-1938
Mean profit rate (percentage)Intercept
RING/K
LOOM/K
L,/Lo
FORDUM
Kl 10"6
AGE
1-UTIL
R2
N
1907-1914
5.08.22
(9.03)4.63
(5.49)3.14
(8.39)-4.87(8.57)-2.28(1.98)
-0.13(0.34)
-0.01(0.07)
-14.49(16.28)
0.1230
Simple Labor Efficiency Index
1916-1918
6.9-1.03(5.97)1.14
(4.46)20.85***(5.67)3.51
(4.71)-0.87(151)0.16
(0.25)-0.02(0.04)
-19.45*(11.40)
0.3640
1923-1924
1.04.67
(5.83)2.52
(4.84)0.75
(6.87)-2.03(3.35)
-1.46(1.59)-0.03(0.15)-0.04(0.05)
-18.09***(6.51)0.20
50
1935-1938
2.0-1.33(3.28)3.29
(3.35)5.03
(5.01)0.76
(1.60)1.69**
(0.69)0.04
(0.07)-0.02(0.03)
-8.01**(3.82)0.43
27
Modified
1935-1938
2.00.67
(3.02)1.80
(2.96)3.68
(4.70)0.59
(1.93)2.21***
(0.79)0.05
(0.06)-0.03(0.03)-9.19***(3.29)0.36
27
= Significant at the 10 percent level.** = Significant at the 5 percent level.*** = Significant at the 1 percent level.Notes: Standard errors are in parentheses. Modified results for 1935-1938 use the labor efficiency indexcorrected for the quality of cotton. For an explanation of the index and this correction, see the text.Source: See the text.
Given the apparent labor surplus in Bombay mills shown in Table 2 wewould expect the coefficient onLu I Lo to be -10 based on equation I.23 Ingeneral our estimates are imprecise because profits varied greatly acrossfirms, as can be seen in Figure 1, and because we have small numbers offirms with the requisite data. But the standard errors of the estimates are lowenough that in all but the first period we can reject the idea that profit gainsfrom reducing the numbers of workers were as great as would be predictedif firms had excess labor, as Table 6 shows. Indeed though some firms usedonly half as much labor per machine as others there is no sign that this re-sulted in any gain in profits. In the thirties when rationalization increased thedispersion of manning levels we get more precise estimates of the possibleeffect of manning levels on profit rates, and these estimates confirm thateliminating labor had very little effect. At best the effect was one-quarter ofwhat would be predicted from the apparent labor surplus. Across all fourperiods the weighted average estimate is that the value of the coefficient on
23 The coefficient should be -10 because profits are measured in percentages in the regression equations.

Why Nations Fail 411
TABLE 6
ESTIMATED EFFECT OF MANNING LEVELS ON PROFIT RATES
_ . , Estimated Expected 95 PercentValue Value Confidence Limit
1907-19141915-19191923-19241930-1938Weighted average
-4.9+3.5-2.0+0.8-0.7
-10-10-10-10-10
-22.0-5.9-8.1-2.4-3.1
Notes: The weights used to construct the weighted average for the whole period are the squared inversesof the standard errors of each coefficient estimate.Source: Table 5.
L,J Lo is - 0.7 as opposed to the value of -10 which we would expect giventhe labor surplus in the mills.
The estimated coefficients on the fractions of the capital stock invested inmules and looms are as we would expect given trends in the industry towardsscrapping mules and slightly increasing the relative numbers of looms. In allcases mules are estimated to earn less profit than rings, though in none of thesamples individually is the result statistically significant. In both the periods1916 to 1918 and 1935 to 1938 the estimated gross profit on mules is predictedto be negative, implying firms should scrap mules, though the effect again isnot statistically significant. Looms are generally estimated to earn more profitsthan spindles, though again the effects are not statisti-cally significant exceptin the war years 1916 to 1918 when looms appear highly profitable.
Foreign-owned firms do not do any better in general than Indian-ownedfirms. In the different periods foreign-owned firms were estimated to earnanywhere between 2.3 percent less to 1.7 more as their return on capital.Taking a weighted average across all four periods the best estimate is thatforeign firms earned a 0.1 percent lower return on capital. The standarderrors are small enough that we can say with 95 percent confidence thatfirms under foreign ownership earned within 1.3 percent of the return oncapital of domestic firms. Again the market looks to have been very compet-itive, with local entrepreneurs doing as well as their foreign competitors.There is no sign that foreign entrepreneurs were more efficient but somehowwere blocked from taking over a larger share of the market.
It is noteworthy that the one statistically significant positive coefficient onforeign ownership is for the 1930s. It was a period of especially strong nation-alist political fervor in which we might have expected foreign managed firmsto have done poorly relative to domestic firms. But the higher returns to for-eign management are very stable over the years 1931 to 1938. Only in 1930do the foreign-owned firms earn less. The poor performance of foreign firmsin 1930 is perhaps due to the boycott of foreign-owned firms Gandhi orga-nized that year, but it could also be due to the fall in world trade, if it is true,
412 Wolcott and Clark
as Morris asserts, that foreign firms were more likely to rely on exporting.24
The only observable way in which the foreign-managed firms differ on aver-age from domestic firms is that their average wages were slightly higher.
There are no consistent size effects on profits. In some periods it is posi-tive and in others negative. In none is it statistically significant. Consistentwith the generally competitive nature of the industry in all countries, therewere no measurable economies of scale in cotton textiles hi Bombay at thefirm level. There was considerable variation in the size of firms in the Bom-bay market, but again there is no sign that this involved mistakes or con-straints on managers in the smaller firms. Even though we have valued thecapital stock of firms using a replacement cost for equipment of each type,and have thus made no allowance for the technological inferiority of oldermachines, the effect of the average age of mill equipment on profit rates isalways estimated to be small, and is never statistically significant. For eachten years the average age increased, measured profit rates are estimated tohave been only 0.2 percent less. This is a very modest effect, and suggeststhat there was little technological improvement in the equipment of theindustry in the years 1907 to 1925 when new investment largely ceased.25
The analysis thus far suggests that the Bombay cotton textile industry oper-ated in a competitive and reasonably well functioning market. Investmentresponded to relatively modest profit opportunities. There are no obviousmanagerial choices about machinery or labor utilization which we found to beassociated with greatly improved profits. Different managers made differentchoices, but the regressions suggests they made no obviously bad choices.
It might be argued, however, that we failed to measure differences in laborutilization accurately. The most important factor affecting a mill's laborrequirements other than the quantity of machinery used was the fineness ofyarn being spun. When the cotton spun was coarser the amount of laborrequired per spindle and per loom rose because input packages were depletedmore quickly and output packages filled up more quickly. The average cot-ton consumed per spindle, which indexes the yarn fineness, is thus anotherimportant predictor of labor requirements per spindle or loom.26 The Bom-bay Millowners' Association annual reports give the total raw cotton con-sumed annually per mill. Because this includes cotton consumed on both theday and night shifts, to get a measure of cotton consumed per spindle hourwe need measures of the amount of night shift work that was done. For theyears 1921 to 1927 there was only one shift worked by Bombay mills. Bythe 1930s multiple shifts were common, but the unpublished files of the
24 Morris, "South Asian Entrepreneurship," pp. 350-5325 Saxonhouse finds a similar result for the 1920s Japanese spinning industry. Saxonhouse, "Produc-
tivity Change," p. 214.26 Output per machine hour is lower with finer yarn, implying less labor in preparing cotton per
spindle, and less doffing per spindle hour.
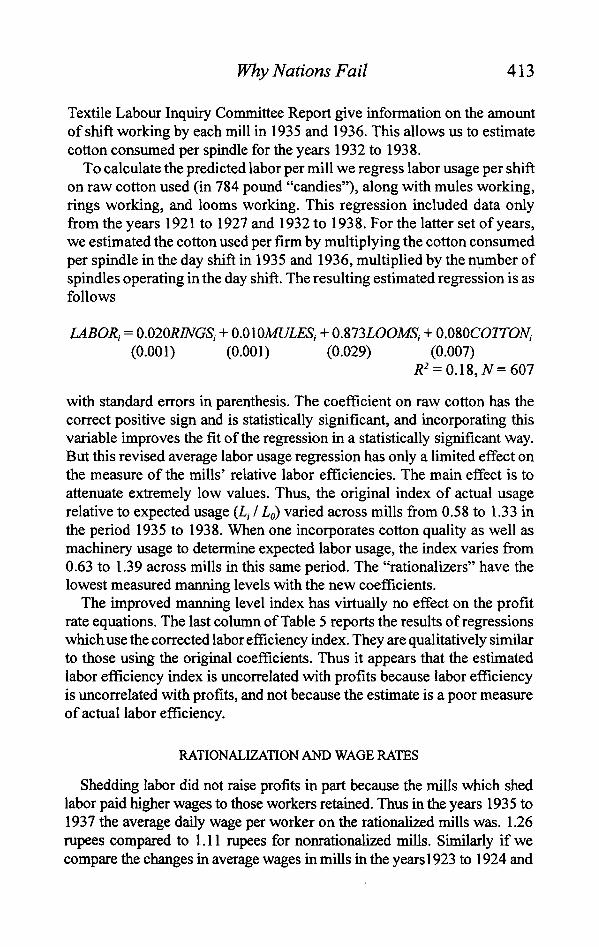
Why Nations Fail 413
Textile Labour Inquiry Committee Report give information on the amountof shift working by each mill in 1935 and 1936. This allows us to estimatecotton consumed per spindle for the years 1932 to 1938.
To calculate the predicted labor per mill we regress labor usage per shifton raw cotton used (in 784 pound "candies"), along with mules working,rings working, and looms working. This regression included data onlyfrom the years 1921 to 1927 and 1932 to 1938. For the latter set of years,we estimated the cotton used per firm by multiplying the cotton consumedper spindle in the day shift in 1935 and 1936, multiplied by the number ofspindles operating in the day shift. The resulting estimated regression is asfollows
LABOR, = O.OlORINGSi + 0.010MULES, + 0.873IOOMS', + O.O8OCO7T0W,(0.001) (0.001) (0.029) (0.007)
# = 0.18, # = 6 0 7
with standard errors in parenthesis. The coefficient on raw cotton has thecorrect positive sign and is statistically significant, and incorporating thisvariable improves the fit of the regression in a statistically significant way.But this revised average labor usage regression has only a limited effect onthe measure of the mills' relative labor efficiencies. The main effect is toattenuate extremely low values. Thus, the original index of actual usagerelative to expected usage (I, / Lo) varied across mills from 0.58 to 1.33inthe period 1935 to 1938. When one incorporates cotton quality as well asmachinery usage to determine expected labor usage, the index varies from0.63 to 1.39 across mills in this same period. The "rationalizers" have thelowest measured manning levels with the new coefficients.
The improved manning level index has virtually no effect on the profitrate equations. The last column of Table 5 reports the results of regressionswhich use the corrected labor efficiency index. They are qualitatively similarto those using the original coefficients. Thus it appears that the estimatedlabor efficiency index is uncorrelated with profits because labor efficiencyis uncorrelated with profits, and not because the estimate is a poor measureof actual labor efficiency.
RATIONALIZATION AND WAGE RATES
Shedding labor did not raise profits in part because the mills which shedlabor paid higher wages to those workers retained. Thus in the years 1935 to1937 the average daily wage per worker on the rationalized mills was. 1.26rupees compared to 1.11 rupees for nonrationalized mills. Similarly if wecompare the changes in average wages in mills in the years 1923 to 1924 and

414 Wolcott and Clark
TABLE 7
ESTIMATED ELASTICITY OF DAILY WAGE RATE WITH RESPECT TO LABOR USAGEINDEX
Period
1923-1924
1935-1938
Change1923-1924
Change1935-1938
DependentVariable
log of wage rate
log of labor usage
log of wage rate
log of labor usage
percentage changewage rate
percentage changelabor usage
IndependentVariable
log of labor usage
log of wage rate
log of labor usage
log of wage rate
percentage changelabor usage
percentage changewage rate
ParameterEstimated
b
lib
b
1/b
b
1/b
Coefficient
-0.27***(0.11)-0.34***(0.13)-0.20**(0.09)-0.42**(0.20)-0.42***(0.11)-0.57***(0.16)
Implied WageElasticity
-0.27
-2.94
-0.20
-2.38
-0.42
-1.75
N
60
60
48
48
43
43
** = Significant at the 5 percent level.*** = Significant at the 1 percent level.Note: We use the manning level index corrected for cotton consumption in these regressions. Thecoefficients are slightly larger with the basic index.Sources: Wage data for 68 mills in 1924 are given by Rutnagur, Bombay Industries. The BombayMillowners' Association, Annual Report, 1924, gives the number of workers in 1924. Information onwages and employment in 44 mills in 1935-1937 is given in File 39 of MSA. Textile Labour InquiryCommission, Written Replies.
1935 to 1937 with the change in labor utilization we find that while nominalwages fell 6 percent in the rationalized mills, wages fell 21 percent in thenonrationalized mills. More generally, subjecting two cross sections of wagesfrom Bombay constructed for the years 1923 to 1924 and 1935 to 1937 tostatistical analysis, we find a positive association between the average wageand the number of machines tended per worker.27 Thus if we regress
for both these samples the estimated values of b are -0.2 and -0.27, as isshown in Table 7. We also take a sample of firms for which we have data inboth periods and compare their percentage wage change from the years 1923to 1924 and 193 5 to 193 7 with the change in machines per worker. Here weget an estimated coefficient of - 0.42. This suggests that at least one quarterof any gains from lower manning levels were eaten up in higher wages. Thetrue figure would actually be even higher, because the variable Z, / Lo mea-sures actual versus required labor only with an error created by variations inhow fine the yarn being produced was, the vintage of the equipment, and the
27 Though this is a very simple specification, note that the index contains information on the mixtureof each mill's machinery—ring, mule, and loom—as well as a rough indicator of the quality of thecotton spun.

Why Nations Fail 415
inaccuracy of the stated mill labor forces. The existence of this downwardbias in our estimate of b is revealed when we regress
ln(Z, /Lo) = (a I b) + (1 / b)\n W, + e,
The estimated values of b from this regression are between -1.75 and- 2.94. The measurement error in wages here leads to a downward biasedestimate of Mb, and so an upward biased estimate of b. Thus, all we cansay is that the true increase in wages associated with a 1 percent reduc-tion in labor requirements was between 20 and 294 percent. If the errorsin both variables relative to their variances were the same, the best esti-mate is the geometric mean of these estimates, which would be 70 to 101percent.28 Bombay managers clearly had to pay at least some amount forgreater labor efficiency, and higher wages may have absorbed all thegains from labor savings.
Other costs that seemingly made rationalization unprofitable were thatrationalizing firms often changed other elements in the production pro-cess in the course of rationalization. Preparations were undertaken tominimize the effort requirements per machine, despite the apparentlyminimal tasks of the workers before rationalization. Machine mainte-nance was improved and better cotton quality used, both being designedto reduce the breakage rate.
LABOR SOLIDARITY OR LABOR PREFERENCES?
The most plausible reason for the lethargic pace of rationalization in Bom-bay from 1890 to 1938 was that firms which eliminated some of the "surplus"labor made no gains over firms that did nothing. It is also clear that at leastsome of the labor cost savings from rationalization were lost through increasedwages paid to the remaining workers. But the rise of wages with rationaliza-tion has two very different possible explanations. Suppose workers in Bombaywere hired in a competitive labor market, but they preferred a combination oflow wages and easy conditions at work. Then firms that demanded more effortwould find they could not retain workers unless they paid more in compensa-tion, hi this case firms in Bombay were simply responding to worker prefer-ences when they seemingly employed many "surplus" workers per machine.The lowest cost wage-effort combination involved low wages and many work-ers. Consequently, true labor costs in India were actually much higher than theday wages would indicate, and the decline of the Bombay industry in the late1920s can be attributed to the preferences of Bombay workers, which madeit a relatively high labor cost locatioa
u Kennedy, Guide, pp. 137-39.

416 Wolcott and Clark
Alternatively, workers may not have had preferences any different from thosein Britain, Japan, or the United States concerning the choices between wages andeffort. Suppose workers before rationalization received a wage that was abovethe free market rate, so that their jobs had some value to them. Suppose also theywere able to impede rationalization, and management had to buy out their resis-tance by raising the wages of workers that were retained. Then the cause of thefailure of rationalization to raise profits could have been the solidarity and resis-tance of Bombay workers. There was no formal bargaining over rationalizationin Bombay, but in Ahmedabad the labor union organized by Mahatma Gandhibargained for a rule in spinning that wages would increase 75 percent for dou-bling the work completed. The Delhi Agreement of 1934 compromised on again of 45 percent.29 By this account the Bombay industry declined because ofthe tenacious solidarity of the Bombay workers.
The extent of worker bargaining power in Bombay is hard to gauge be-cause workers were generally not formally organized. There are some indi-cations, though, that the mill labor market was not as competitive as mightbe expected in these circumstances. The ratio of textile wages to value addedper yard of cloth increased dramatically following World War I.30 It hadbeen fairly stable between 1900 and 1913, but had dropped during the waras wages failed to keep up with the increase in cloth prices. Wages finallycaught up in 1920, but almost immediately the price of cloth began to falldue to the world recession of 1920 to 1921. Cloth prices continued to fallgradually for the remainder of the period. By 1938 the price of cotton andcloth was only 3 percent greater than in 1910. Wages never experienced acorresponding drop. The real wage increase had, in fact, been one of the primemotivating factors behind the rationalization movement. The initial increasefollowing the war was perhaps due to real labor shortages, but even thoughmoney wages continued to rise until 1926, whatever shortages may haveexisted in the war period had disappeared by the general strike of 1925, whichfollowed management's unsuccessful attempt to lower nominal wages. Theinterwar period saw the decline of the Bombay industry from 80 to 60 mills,and a fall in employment of 15 percent. It was unanimously described as aperiod of "easy" labor market conditions. Yet the labor force was able to holdon to and build upon the nominal wage gains they had made until the failureof the final general strike of the interwar period in 1934. Real wages rosesteadily from 1913 to 1933. Moreover, textile wages rose relative to the work-ers' opportunity wages as field labor in the Deccan. From 1911 to 1914 the
29 MSR. Textile Labour Inquiry Commission, Extracts on Rationalisation, vol. 2, pp. 36,5 7, File 81 (3).30 Value added was computed by deducting the price of a pound of cotton from a pound of cloth. The
aggregate Bombay wage series is from Mukerji, "Trend," table 6. Cloth prices are from BombayMillowners' Association, Annual Report, 1939, table 10. The cotton price data are from India Depart-ment of Statistics. Prices, before 1920, and for later years, India. Department of Statistics. AgriculturalStatistics.

Why Nations Fail 417
ratio of the daily wage of a Bombay textile worker to that of a Deccan fieldlaborer averaged 2.06. The ratio's average from 1920 to 1937 was 2.64. In theperiod of greatest decline in the industry, 1932 to 1937, when labor demandshould have been lowest, the ratio averaged 2.99.31 This increase was not dueto either increased hours or productivity. Average daily hours fell from 12 to10 subsequent to the Factory Act of 1922.32 And as Table 5 indicates, laborproductivity was stagnant. Because rationalized wages were even higher, theincrease of these workers' wages relative to their opportunity costs was 48percent. It is hard to explain these wage increases except by allowing thatBombay mill hands had some degree of market power.33
Even if workers were able to display considerable solidarity in Bombayand resist rationalization, this solidarity cannot readily explain the stagnantlabor productivity of the entire subcontinent. If labor resistance based onoutdated work norms in the declining center of Bombay was the problem,rationalizing managers would have had enormous incentive to move to newlocations where labor norms had not yet been established and where workerswere new to the industry. In fact, there was rapid growth in such places asAhmedabad, Cawnpor, Nagpur, Madras, Delhi, and Coimbatore where theday wages of workers were generally lower in the interwar period. But whilemachinery and employment expanded, labor productivity at these othernewer textile centers tended to be even lower than in Bombay.34
LABOR SURPLUS AND MACHINE PURCHASES
One possible way of discerning between the two possible sources of theexcess labor—worker preferences, or worker resistance—is to examine the
31 Mazumdar , "Labour Supply," appendix. O n e wou ld prefer to compare the ratio of urban and ruralreal wages , but there are no measures of rural costs o f living in this period. It seems unlikely thatchanges in the relative cost of living accounted for the increased wage gap. The costs o f tradablecommodit ies—food, clothing, and fuel—presumably diverged little between the city and the country.Housing, at 9 percent of urban expenditures, is the only service wh ich is significant in the working-classbudget. E v e n if w e assume that the postwar housing price rise o f 165 percent w a s strictly confined tothe city that w o u l d require only a 0.058 increase in the ratio of the nominal industrial w a g e to thenominal agricultural w a g e to maintain a constant ratio o f real wages . Shirras, Report, pp. 15 and 4 0 - 4 1 .
32 R a m , State, pp. 106-07.33 Mazumdar , "Labour Supply," first noted the high ratio of wages relative to the opportunity cost
o f labor, focusing on the period 1900 to 1937. H e argued that the h igh ratio w a s necessary to secure"commi t t ed" mar r ied labor as opposed to "transient" single men. There are some difficulties wi thM a z u m d a r ' s analysis. See Newman , "Social Factors ," pp . 2 8 6 - 8 7 . But for the purpose o f our argument ,it is irrelevant whether Mazumdar ' s explanation for the generally high ratio of the industrial t o theagricultural w a g e is true or false. We are concerned here wi th the increase of this ratio in the 1920s and1930s and wha t that implies about the labor market . N e w m a n argues that the high urban relative w a g e ,and its movement over t ime, is due to the marke t power of the millhand. Wright found similar s igns o flabor power among an equivalent unorganized labor force, the village-based male textile workers o fthe Amer ican South. Wright, "Cheap Labor."
34 Wolcott, "Perils," table 2.

418 Wolcott and Clark
TABLE 8
MACHINE CHARACTERISTICS CIRCA 1910(20s warp yarn)
Country
CanadaEnglandBrazilFranceGermanyItalySpainMexicoPolandRussiaIndiaChinaJapan
Wage toCapital Cost
Ratio
1.41.00.70.60.60.40.40.30.30.30.10.10.1
Spindles perFrame
363368351416
378393438348365367326375374
Spindle Speed(revolutionsper minute)
8,1618,0408,012
8,2558,5608,3648,1867,9898,2718,2118,1948,8589,112
Ring BobbinVolume
(cubic Inches)
16.213.712.014.012.911.612.413.412.013.211.79.8
10.9
Roving BobbinVolume
(cubic inches)
1018384
99908487888790767075
Source: See Table 3 for machine characteristics. The wage rental ratio is from Clark, "Why.'
machine choices of Indian mill managers, using the Platt records. If manag-ers were stuck with extra workers who had nothing to do because of theworkers' solidarity in resisting reductions in manning levels, then whenpurchasing machinery they should have regarded their labor cost as effec-tively zero, and bought machinery that used the maximum amount of laborwhere this allowed savings on capital and cotton costs.
One theory of labor resistance might be that Indian workers had particularcomplements of machinery to which they were accustomed. It was some-times said, for example, that workers in spinning insisted on operating onlyone side of a spinning frame.35 In this case, because frames would vary inlength and in the number of spindles they contained, we would imagine thatmanagers in India would have had an incentive to order longer frames withmore spindles, or pack more spindles onto frames of given length (if the millbuildings constrained the length of the frames). Yet when we compare In-dian machine purchases around 1910 with those of other countries, as inTable 8, we see that Indian ring frames were in fact somewhat smaller thanthose of other countries.36 There is no sign in these purchases of the allegedlabor resistance to taking more than one side.
When we look at machine speeds we again see no sign that labor wasregarded as being in surplus in Indian mills. Machine speeds in India on a
35 Clark cites several references to such conservatism. Clark, "Why," p. 168.36 We control for the yarn count in doing this comparison because that affected frame length. But
even before these controls Indian ring frames had fewer spindles.

Why Nations Fail 419
given count were the same as in countries where the wage level was 6 to 14times that of Indian mills. Indian mills did not push up speeds to the maxi-mum that was technically feasible and then use extra labor to fix the in-creased number of thread breaks that would result. Countries such as Japanand China whose wages were about the same as those of India in 1910, wererunning their machines much faster.
The only case in which India did appear to act as if labor was in any sensecheap was with regard to package sizes. The volume of India ring and rovingbobbins was a little lower than those of the higher wage countries, so that themachines would have required more doffing and more labor. On the otherhand, the Indian bobbins were bigger than those of the other low wage coun-tries such as Japan and China.
Thus there is no evidence from comparisons with other countries' machin-ery choices that Indian managers regarded themselves as operating withsurplus labor that they could use at zero cost. The second form of evidencethat Indian managers did not regard labor as being essentially costless is thatthey were changing the machines ordered in the period 1890 to 1929 towardones that used less labor. Thus the average size of the output bobbins spin-ning 20s yarn went up from 13.8 cubic inches circa 1890 to 15.72 cubicinches circa 1929. Similarly the average size of the input bobbins on 20syarn moved up from 80.22 cubic inches circa 1890 to 115.1 cubic inchescirca 1929.37 Indian managers were choosing machines that occupied morefloor space but saved on labor. Why would they do this if they were con-strained to have surplus labor? Though by the standards of Table 1 Indianmanagers were operating with a surplus of labor on their machines through-out the period, certainly in 1910 they were choosing machines that impliedthey thought that labor had a cost to them.
CONCLUSION
Why did Indian mills fail to capitalize on their low-cost labor in the earlytwentieth century and spearhead the industrialization of India? This articleshows that, contrary to most previous writing, there is no evidence that thiswas a failure of management. The Indian industry had a higher proportionof mule spindles than Japan, but we show that while mules were most likelyless profitable than rings, the profit rate was not so low that it justified scrap-ping the existing equipment until the 1920s, when the equipment was indeedscrapped. The Indian industry was slow to enter the weaving sector, butagain there were no great profit opportunities evident there. Indigenousmanagement did as well as foreign managers, and there is no sign that millswere too small. The spinning machines purchased by Indian mills were very
37 The second change was statistically significant at the 1 percent level, the first at the 10 percent level.

420 Wolcott and Clark
similar to those purchased by other countries. Further, while Indian millsemployed astonishingly large amounts of labor, mills which reduced man-ning levels did not thereby make more money. The poor performance of theIndian mills instead was a problem of the low labor input per mill worker.
While we can conclude this much, we cannot with the information avail-able discriminate between two competing explanations of the source of thelabor problem. The first is that Indian workers were simply incompetent orhad low taste for effort on the job. The second is that there was surplus laborin the mills, but workers exercised power in the labor market to block man-ning reductions for fear of unemployment. We can show that mills that triedto reduce labor inputs had to both increase wages and, in at least some cases,reduce work loads per machine. These observations are compatible eitherwith the need to pay workers in a free market more money to induce higherefforts, and with workers having to be paid to overcome their antipathy tomanning reductions, where that antipathy had other causes.
Appendix: The Calculation of Profit Rates by MillTo calculate profit rates of the Indian textile mills studied in this article we need to
estimate both the earnings of mills, and the value of the capital stock. Mill earnings arederived from the Investor's India Yearbook and S. N. Rutnagur, Bombay Industries: TheCotton Mills. The Investor's India Yearbook annually printed summary balance sheets andother relevant information for publicly traded Indian firms. Published in Calcutta, it listsinformation for all of the firms carried on the Calcutta stock market as well as a limitednumber of others. Consequently, it only reports the profits of about half of the BombayMills. This financial data is available for every year that we have data on the mills from theBombay Millowners' Association. Rutnagur gives information on the finances of a morecomprehensive set of 66 mills in Bombay for the years 1923 to 1924. Profits are reportedin the Investor's India Yearbook as total revenues minus total expenses (including wages,supplies costs, debt service, and commission to managing agencies). The relation betweenthese profits and operating profits is
PROFITS IN MILL OPERATIONS= REPORTED PROFITS + NET DEBT SERVICE - DEPRECIATION
We use reports in the Investor's India Yearbook on the long-term debt of all firms, and theinterest rates on these debts for some firms. We infer the interest rates for others as theaverage for that year of the reported interest rates. Some short-term debts and loans of firmsare not reported and so will constitute noise in the measurement of profits. There is evi-dence from the 1920s, where we have access to the detailed accounts of some of the firmsthat cotton and yarn stocks at the mills were at least partly financed by short-term borrow-ing of "call" money by mills.38
31 For those mills which were borrowing to cover part of their working capital, our estimates willunderstate their profit rates because the denominator of our calculated profit rate includes both workingand fixed capital, and the numerator excludes payments of interest for short term loans. We calculatedan alternative profit rates series in which we used only the estimated fixed capital in the denominator.

Why Nations Fail 421
Data on the fixed capital by mill were extracted from the annual reports of the BombayMillowners' Association. This gives the number of mule and ring spindles and loomsinstalled in each mill, and the average annual number of spindles, looms, and workersemployed in the day shift. We have collected this data for all operating mills in Bombay forthe years 1907 to 1908,1911 to 1914,1916 to 1918, and 1920 to 1938.39
Estimating the value of the capital stocks of the firms is more difficult. The Investor'sIndia Yearbook gives the nominal value of share capital, but this is not a true representationof capital, as most of the mill expansions had been financed through retained earnings.40 Wedo have information on the insured value of mills for 1912, which should be a good indica-tion of the value not just of the buildings and machinery, but of the associated stocks ofcotton and work in process. To get from these insurance valuations to a value for each millin each year we use the following procedure. First we regressed the 1912 insured value ofthe fixed capital and stock and inventories of 19 mills in rupees on their spindle and loominventories.41 The estimated regression was
INSUREDVALUEI9I2 = T\.\(RINGSl9n + 0.85 MULES',„,,) + 1092.1LOOMSI9I,(8.3) (342.3)
with standard errors in parenthesis. We estimated the capital stock of all mills in all yearsusing these coefficients and a price index. This technique has the advantage of allowing usto use the data from all years where the Bombay Millowners' reports are available. Becausethese values include both fixed capital, which was approximately 76 percent of capital, andstocks of cotton, yarn, and cloth, the price index used was a similarly weighted average ofBagchi's Indian textile equipment index and a cotton and cloth price index.42
This procedure estimates the replacement value of the capital stock of all mills, not thedepreciated value. Over this period there was little improvement in the performance oftextile machinery, as was illustrated in Table 4 for labor requirements. Similarly the speedsof the machinery improved little. On 20s yarn average machine speeds, in revolutions perminute, for ring spinning machines were 8,351 for 1890 tol899, 8,463 for 1900 to 1909,8,752 for 1910 to 1919, 8,443 for 1920 to 1929, and 9,634 for 1930 to 1934. Thus, again,it is only in the 1930s that we see any sign of increases in output per machine, and eventhen the gain was only 15 percent compared to the 1890s. Consequently machinery wasused by the firms for very long periods. Fifty-year-old machinery was not unusual. Ourmethod of estimation, while it will overstate the value of capital for mills with older ma-chinery, should not distort the estimate of capital by too much. In the regression estimates,we include as a control variable the age of machinery.
The gross profit rate of the firms measured in terms of the replacement cost of fixedcapital, will thus be
For a few years, the difference is relatively large. The maximum difference is 6 percent in 1920. Butoverall, the difference between the two series is minor, with the average being 1.3 percent.
39 The miss ing years were created by the unavailabili ty to us of copies of the B o m b a y Mi l lowner s 'Associat ion Annual Repor t for these years . F e w copies of these early reports survive.
40 Bagchi , Private Investment, p . 68 .41 These da ta are given in the 1913 edit ion of the Investor's India Yearbook. The relat ive amoun t of
capital embodied in ring and mule spindles was calculated from Clark, Cotton Fabrics, pp. 23-4;Benjamin, Practical, p. 611; and Winterbottom, Cotton Spinning, pp. 264-73.
42 The estimate of the relative proportion of fixed capital and stocks is derived from the insured valueof the Finlay Mill and the Bombay Dyeing and Manufacturing Spring Mill. Both of these mills werebuilt around 1912 for a known amount of rupees. Thus the difference between the value of their fixedand working capital is obvious.

422 Wolcott and Clark
n= {REPORTED PROFITS + LONGTERMDEBTSERVICE) I FIXED CAPITAL
These are the profits reported in Table 4 as an annual average for the Bombay mills. Thisaverage will exceed the net profit rate on fixed capital by the depreciation rate on capital.As noted, the depreciation rate was low in the textile industry because machines physicallylasted a long time, and from 1890 to 1930 there was little technical improvement to newmachines that would create economic obsolescence of older machines.
REFERENCES
Bagchi, Amiya Kumar. Private Investment in India 1900-1939. Cambridge: CambridgeUniversity Press, 1972.
Benjamin, B. S. Practical Cotton Mill Management in India. Calcutta: Calcutta PhototypeCo., 1934.
Bombay Dyeing and Manufacturing Co., Bombay. Minutes of the Board of DirectorsMeetings, 1930-1938.
Bombay Millowners' Association. Millowners' Association Annual Reports. Bombay:Millowners' Association, various years.
Chandavarkar, Rajnarayan. The Origins of Industrial Capitalism in India. New Delhi:Cambridge University Press, 1994.
Clark, Gregory. "Why Isn't the Whole World Developed? Lessons from the Cotton Mills."this JOURNAL 47, no. 1 (1987): 141-73.
. "Would Better Management Have Developed the World? Reply to Wilkins." thisJOURNAL 48, no. 1 (1988): 143^8.
'Textile History as World History: Labor Organization and Productivity in Eng-land, the U.S.A., India and Japan, 1870-1980." Working Paper, University ofCalifornia-Davis, Department of Economics, 1992.
Clark, W. A. Graham. Cotton Fabrics in British India and the Philippines, Special AgentsSeries, No. 13. Washington, DC: Department of Commerce, Bureau of Foreign andDomestic Commerce, 1907.
Cotton Spinning Productivity Team. Cotton Spinning. London: Anglo-American Councilon Productivity, 1951.
Cotton Yarn Association. "Statistics Concerning Cotton Spinning in India." The Journalof the Textile Institute, Transactions (1929): 10-20.
Deshpande, S. R. Report on an Enquiry into Conditions of Labour in the Cotton Mill Indus-try of India. New Delhi: Labour Investigation Committee, Government of India, 1946.
Doraiswamy, Indra. "Scope for Increasing Productivity in Spinning Mills." In Resume ofPapers, Twenty Fourth Technological Conference. Ahmedabad: Ahmedabad TextileIndustry Research Association, 1983.
Grosse, Anne P. "The Technological Structure of the Cotton Textile Industry." In Studiesin the Structure of the American Economy, edited by Wassily Leontief, 360-420. NewYork: Oxford University Press, 1953.
Gunther, F. H., and Marcus Gross. "Spinner's Task Can Be Set Quickly." Textile World,no. 2 (April, 1947): 108-09.
India. Royal Commission on Labour in India. Evidence Taken in the Bombay Presidency.London: HMSO, 1931.
India. Department of Statistics. Prices and Wages in India . . . 4th through 47th issue.1866-1922. Calcutta: Superintendent of Government Printing, 1922.
India. Department of Statistics. Agricultural Statistics of British India. Calcutta: Superin-tendent of Government Printing, various issues.
Investor's India Yearbook Calcutta: Place, Siddons, and Gough, various years.

Why Nations Fail 423
Kennedy, Peter. A Guide to Econometrics. 3rd. ed. Cambridge, MA: Harvard UniversityPress, 1992.
Kiyokawa, Yukihiko. "Technical Adaptations and Managerial Resources in India: A Studyof the Experience of the Cotton Textile Industry from a Comparative Viewpoint." TheDeveloping Economies 21, no. 2 (1983): 97-133.
Lancashire Records Office. Platt Records.Mass, William, and William Lazonick. "The British Cotton Industry and International Com-
petitive Advantage: The State of the Debate." Business History 32, no. 4 (1990): 9-65.Maharashtra State Archives. Bombay. Textile Labour Inquiry Committee, 1937-1940,
Unpublished Proceedings.Mazumdar, Dipak. "Labour Supply in Early Industrialization: The Case of the Bombay
Textile Industry." Economic History Review 24, no. 3 (1973): 477-96.Morris, Morris. The Emergence of an Industrial Labour Force in India: A Study of the
Bombay CottonMills, 1854-1947. Berkeley and Los Angeles: University of CaliforniaPress, 1965.
. "South Asian Entrepreneurship and the Rashomon Effect," Explorations in Eco-nomic History 16, no. 3 (1979): 341-361.
Mukerji, Kshitimohan. "Trend in Real Wages in Cotton Textile Mills in Bombay City andIsland, From 1900 to 1951." Artha Vijnana 1, no. 1 (1959): 82-95.
Newman, Richard. "Social Factors in the Recruitment of the Bombay Millhands." In Econ-omy and Society: Essays in Indian Economic and Social History, edited by K. N.Chaudhuri and C. J. Dewey. Delhi: Oxford University Press, 1979.
Otsuka, Keijiro, Gustav Ranis, and Gary Saxonhouse. Comparative Technology Choice inDevelopment: The Indian and Japanese Cotton Textile Indi4Stries. New York: St.Martin's Press, 1988.
Pearse, Arno S. The Cotton Industry of India. Manchester: International Federation ofMaster Cotton Spinners Assoc., 1930.
Ram, V. Shiva. The State in Relation to Labour in India. Delhi: University of Delhi Press, 1939.Rutnagur, S. M. Bombay Industries: The Cotton Mills. Bombay: The Indian Textile Journal
Ltd., 1927.Saxonhouse, Gary R. "Productivity Change and Labor Absorption in Japanese Cotton
Spinning." Quarterly Journal of Economics 91, no. 2 (1977): 195-213.Shirras, G Findlay. Report of an Enquiry into the Wages and Hours of Labour in the
Cotton Mill Industry. Bombay: Labour Office, Government of Bombay 1923.. Findlay. Report of an Enquiry into Working Class Budgets in Bombay. Bombay:
Labour Office, Government of Bombay 1923.Subramanian, T. A., and A. R. Garde. End Breaks in Ring Spinning. Ahmedabad, India:
Ahmedabad Textile Industry Research Association, 1971.Textile Council. Cotton and Allied Textiles. Manchester, 1969.United Kingdom. Parliamentary Papers. Indian Factory Labour Commission. Volume
2—Evidence. Cd. 4519. London: HMSO, 1909.Winterbottom, James. Cotton Spinning and Yarn Costs. London: Longmans, Green, and
Co., 1921.Wright, Gavin. "Cheap Labor and Southern Textiles, 1880-1930." Quarterly Journal of
Economics 96, no. 4 (1981): 605-29.Wolcott, Susan. "The Perils ofLifetime Employment Systems: Productivity Advance in the Indian
and Japanese Textile Industries, 1920-1938." this JOURNAL 54, no. 2 (1994): 307-24.