why personal monitoring?
TRANSCRIPT

Why Personal Monitoring?The Influence of Personal Behaviors on Personal Air Pollution Exposures and Acute Health Effects
Edmund Seto, Graeme Carvlin, Yisi Liu, Ching-Hsuan Huang, Jeff Shirai, Elena Austin
ASIC
9/14/2018

Choice of talk
• Are Air Sensors Useful? (easy talk to give at Air Sensors International Conference)
• Is Community Air Monitoring Useful? (not a difficult talk in CA with AB617)
• Is Mobile Air Pollution Monitoring Useful? (Sorry, I didn’t bring my Prius)

1
one person,a GPS,
3.5 years
2.5 million points

More Bigger Data?
King County Metro
1,540
215
8,521
395,000
0 100,000 200,000 300,000 400,000 500,000
Bus Fleet
Routes
Stops
Passengers (daily)
Seattle scenario…

How many Aaron Parecki’s are there?
• Let’s do the math…
If we could convince 1 out of 100 King County Metro passenger to carry a personal air monitor…
395,000 ➗ 100 = 3,950 potential Aarons
2.5 million points ➗ 3.5 years = 714K points per year per Aaron
3,950 Aarons x 714K points/yr/Aaron =
2.8 Billion Air Measurements per year

http://www.skcinc.com/catalog/pdf/instructions/37713.pdfhttps://www.telegraph.co.uk/technology/0/best-fitness-trackers-2017/

https://rockhealth.com/deconstructing-fitbit-s-1/

PANDA (circa 2012, David Holstius)

Iterative Development and Testing of the PUWP
ChronologyUW Versions

PUWP ComplianceV
alid
wea
r ti
me
Version 1 Version 2 Version 3
Duncan, et al., JMIR 2018
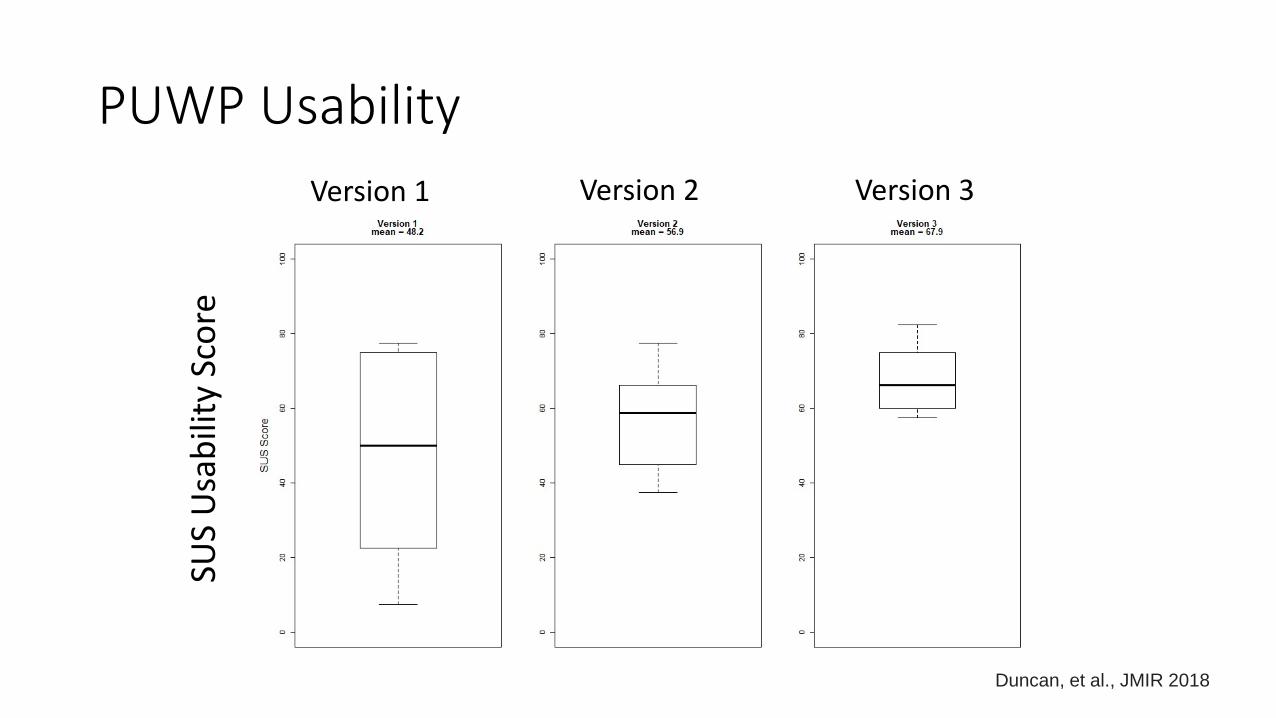
PUWP Usability
SUS
Usa
bili
ty S
core
Version 1 Version 2 Version 3
Duncan, et al., JMIR 2018
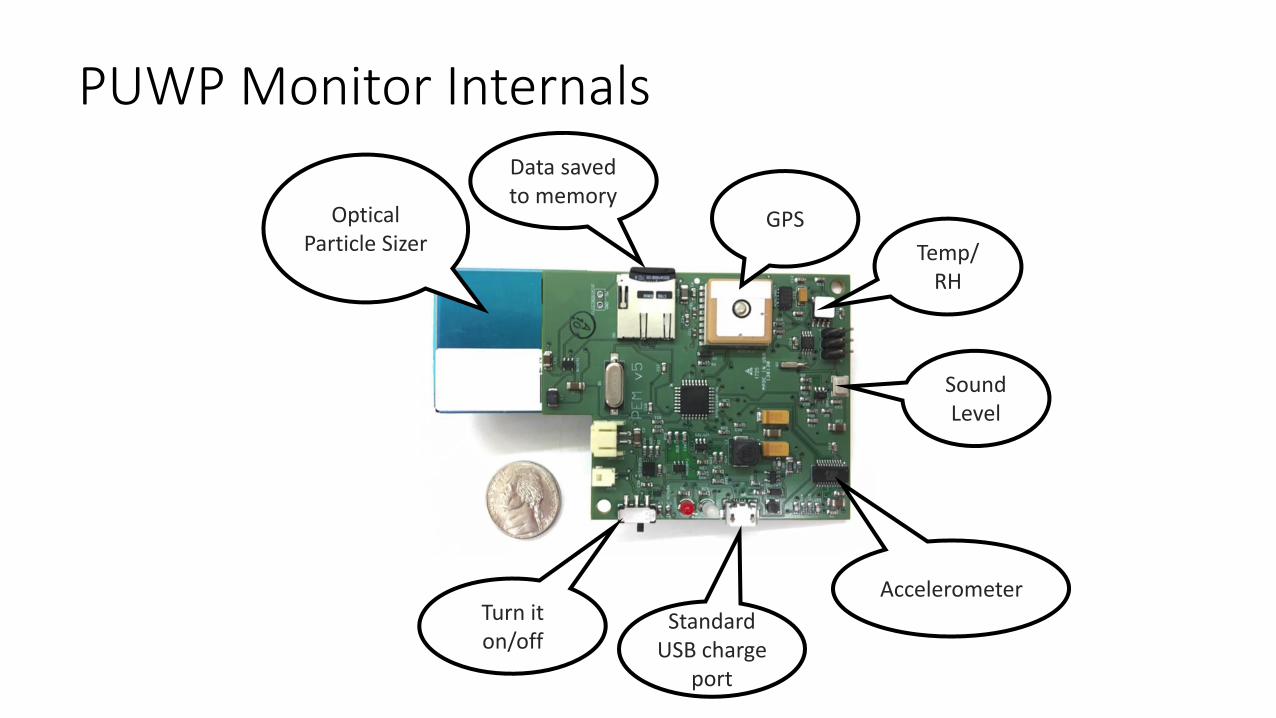
Optical Particle Sizer
PUWP Monitor Internals
GPS
Temp/RH
Sound Level
Accelerometer
Data saved to memory
Turn it on/off
Standard USB charge
port

Study of 300 Twins
PUWP Personal Monitors

BC Wildfire Event in Seattle, Summer 2017
0
10
20
30
40
50
60
70
80
90
7/28/177/29/177/30/177/31/17 8/1/17 8/2/17 8/3/17 8/4/17 8/5/17 8/6/17 8/7/17 8/8/17
Beacon
HillPM2.5ug/m
3
Regulatory Monitoring Data
Community Sensor Data
Un
calib
rate
dco
nc

Personal Exposure vs. Regional Air Quality
Regional
• Integrating data from regulatory, community, and personal air monitoring can be useful for understanding air pollution events and exposures at multiple scales.
90 deg weatherin Seattle
during the episode!

Dr. Catherine Karr’s Study:Home Air in Agriculture: Pediatric Intervention Trial (HAPI)
Randomized to receive HEPA filter or sham

Feasibility Testing TEMU in the HAPI Study
Randomized to receive HEPA filter or sham
Stationaryexposuremonitor
Tabletreported symptoms
Personal activity and exposuremonitoring
Subset of HAPI participants, recruited to test TEMU System

TEMU PRISMS Asthma Study
Personal activity and exposuremonitoring
Stationaryexposuremonitor
Tabletparent-reported symptoms
TEMU Components from the UW PRISMS Team
Sensors from other PRISMS teams• Activity• Exposure• Physiologic response• Ecological Momentary Assessment• etc.
PRISMS Informatics Platforms• Technologies for cohort deployments
(phones, watches, apps, etc.)• Integration of data from multiple
compatible PRISMS sensor systems• Merging other study participant data• Metadata tagging
PRISMS Data Center• Secure data sharing• Data harmonization• Cohort discovery• Meta-cohort analyses• etc.

TEMU Tablet Data Collection
Field staff visit set-up formParent-reported daily questionnaire on asthma symptoms
• Implemented in REDcap• Meets HIPAA requirements• Data uploaded to REDcap via cellular network• Spanish language

Daily Symptom Questionnaire (Asthmatic’s Parent)
An example:
Enter peak flow measurement
Missed school?
Clinic or hospital visit?

PM exposure context

TEMU Internals - Electrostatic PM Collector
Fluorescence Excitation-Emission MatrixLiquid Extraction
Collect cartridgesfrom participants, and sendto lab

Excitation Emissions MatrixResearch cigarette smokeDiesel exhaustClean cookstove (wood smoke)

Summary
• Thinking of Aaron Parecki… one person, lots of measurements
• Thinking of Fitbit… designing for usability
• Starting to integrate personal monitoring in epidemiologic studies, with both biological and digital health endpoints.
• Digital measurements potential provide insights into the behavioral context for exposures
• Speciated measurements potentially provides further context

AcknowledgementsThanks to Aaron Parecki.
Thanks to the Twin PUWP Collaborators (Glen Duncan’s team at WSU, Igor Novosselov’steam at UW)
HAPI research team and PRISMS collaborators (Catherine Karr’s HAPI team and Igor Novosselov’s team at UW)
The Twin PUWP research is funded by the National Institute of Biomedical Imaging and Bioengineering (NIEHS) U01 EB021923
Th PRISMS TEMU research is funded by the National Institute of Biomedical Imaging and Bioengineering (NIBIB) U01 EB021923
Contact: Edmund Seto ([email protected])