william blair growth stock conference - carvana
TRANSCRIPT
William Blair Growth Stock Conference
June 6, 2019
2
FY 2017 YTD 2018
Long Term Target
Forward-Looking Statements
This presentation contains forward-looking statements within the meaning of the Private Securities Litigation Reform Act of 1995. These
forward-looking statements reflect Carvana’s current expectations and projections with respect to, among other things, our financial
condition, results of operations, plans, objectives, future performance, and business. These statements may be preceded by, followed by or
include the words "aim," "anticipate," "believe," "estimate," "expect," "forecast," "intend," "likely," "outlook," "plan," "potential," "project,"
"projection," "seek," "can," "could," "may," "should," "would," "will," the negatives thereof and other words and terms of similar meaning.
Forward-looking statements include all statements that are not historical facts. Such forward-looking statements are subject to various risks
and uncertainties. Accordingly, there are or will be important factors that could cause actual outcomes or results to differ materially from
those indicated in these statements. Among these factors are risks related to the “Risk Factors” identified in Carvana’s Annual Report on
Form 10-K for 2018 and our Quarterly Report on Form 10-Q for Q1 2019.
There is no assurance that any forward-looking statements will materialize. You are cautioned not to place undue reliance on forward-looking
statements, which reflect expectations only as of this date. Carvana does not undertake any obligation to publicly update or review any forward-looking statement, whether as a result of new information, future developments, or otherwise.
Market and Industry Data
This presentation includes information concerning economic conditions, the Company’s industry, the Company’s markets and the Company’s
competitive position that is based on a variety of sources, including information from independent industry analysts and publications, as well
as Carvana’s own estimates and research. Carvana’s estimates are derived from publicly available information released by third party
sources, as well as data from its internal research, and are based on such data and the Company’s knowledge of its industry, which the
Company believes to be reasonable. The independent industry publications used in this presentation were not prepared on the Company’s
behalf. While the Company is not aware of any misstatements regarding any information in this presentation, forecasts, assumptions,
expectations, beliefs, estimates and projects involve risk and uncertainties and are subject to change based on various factors.
3
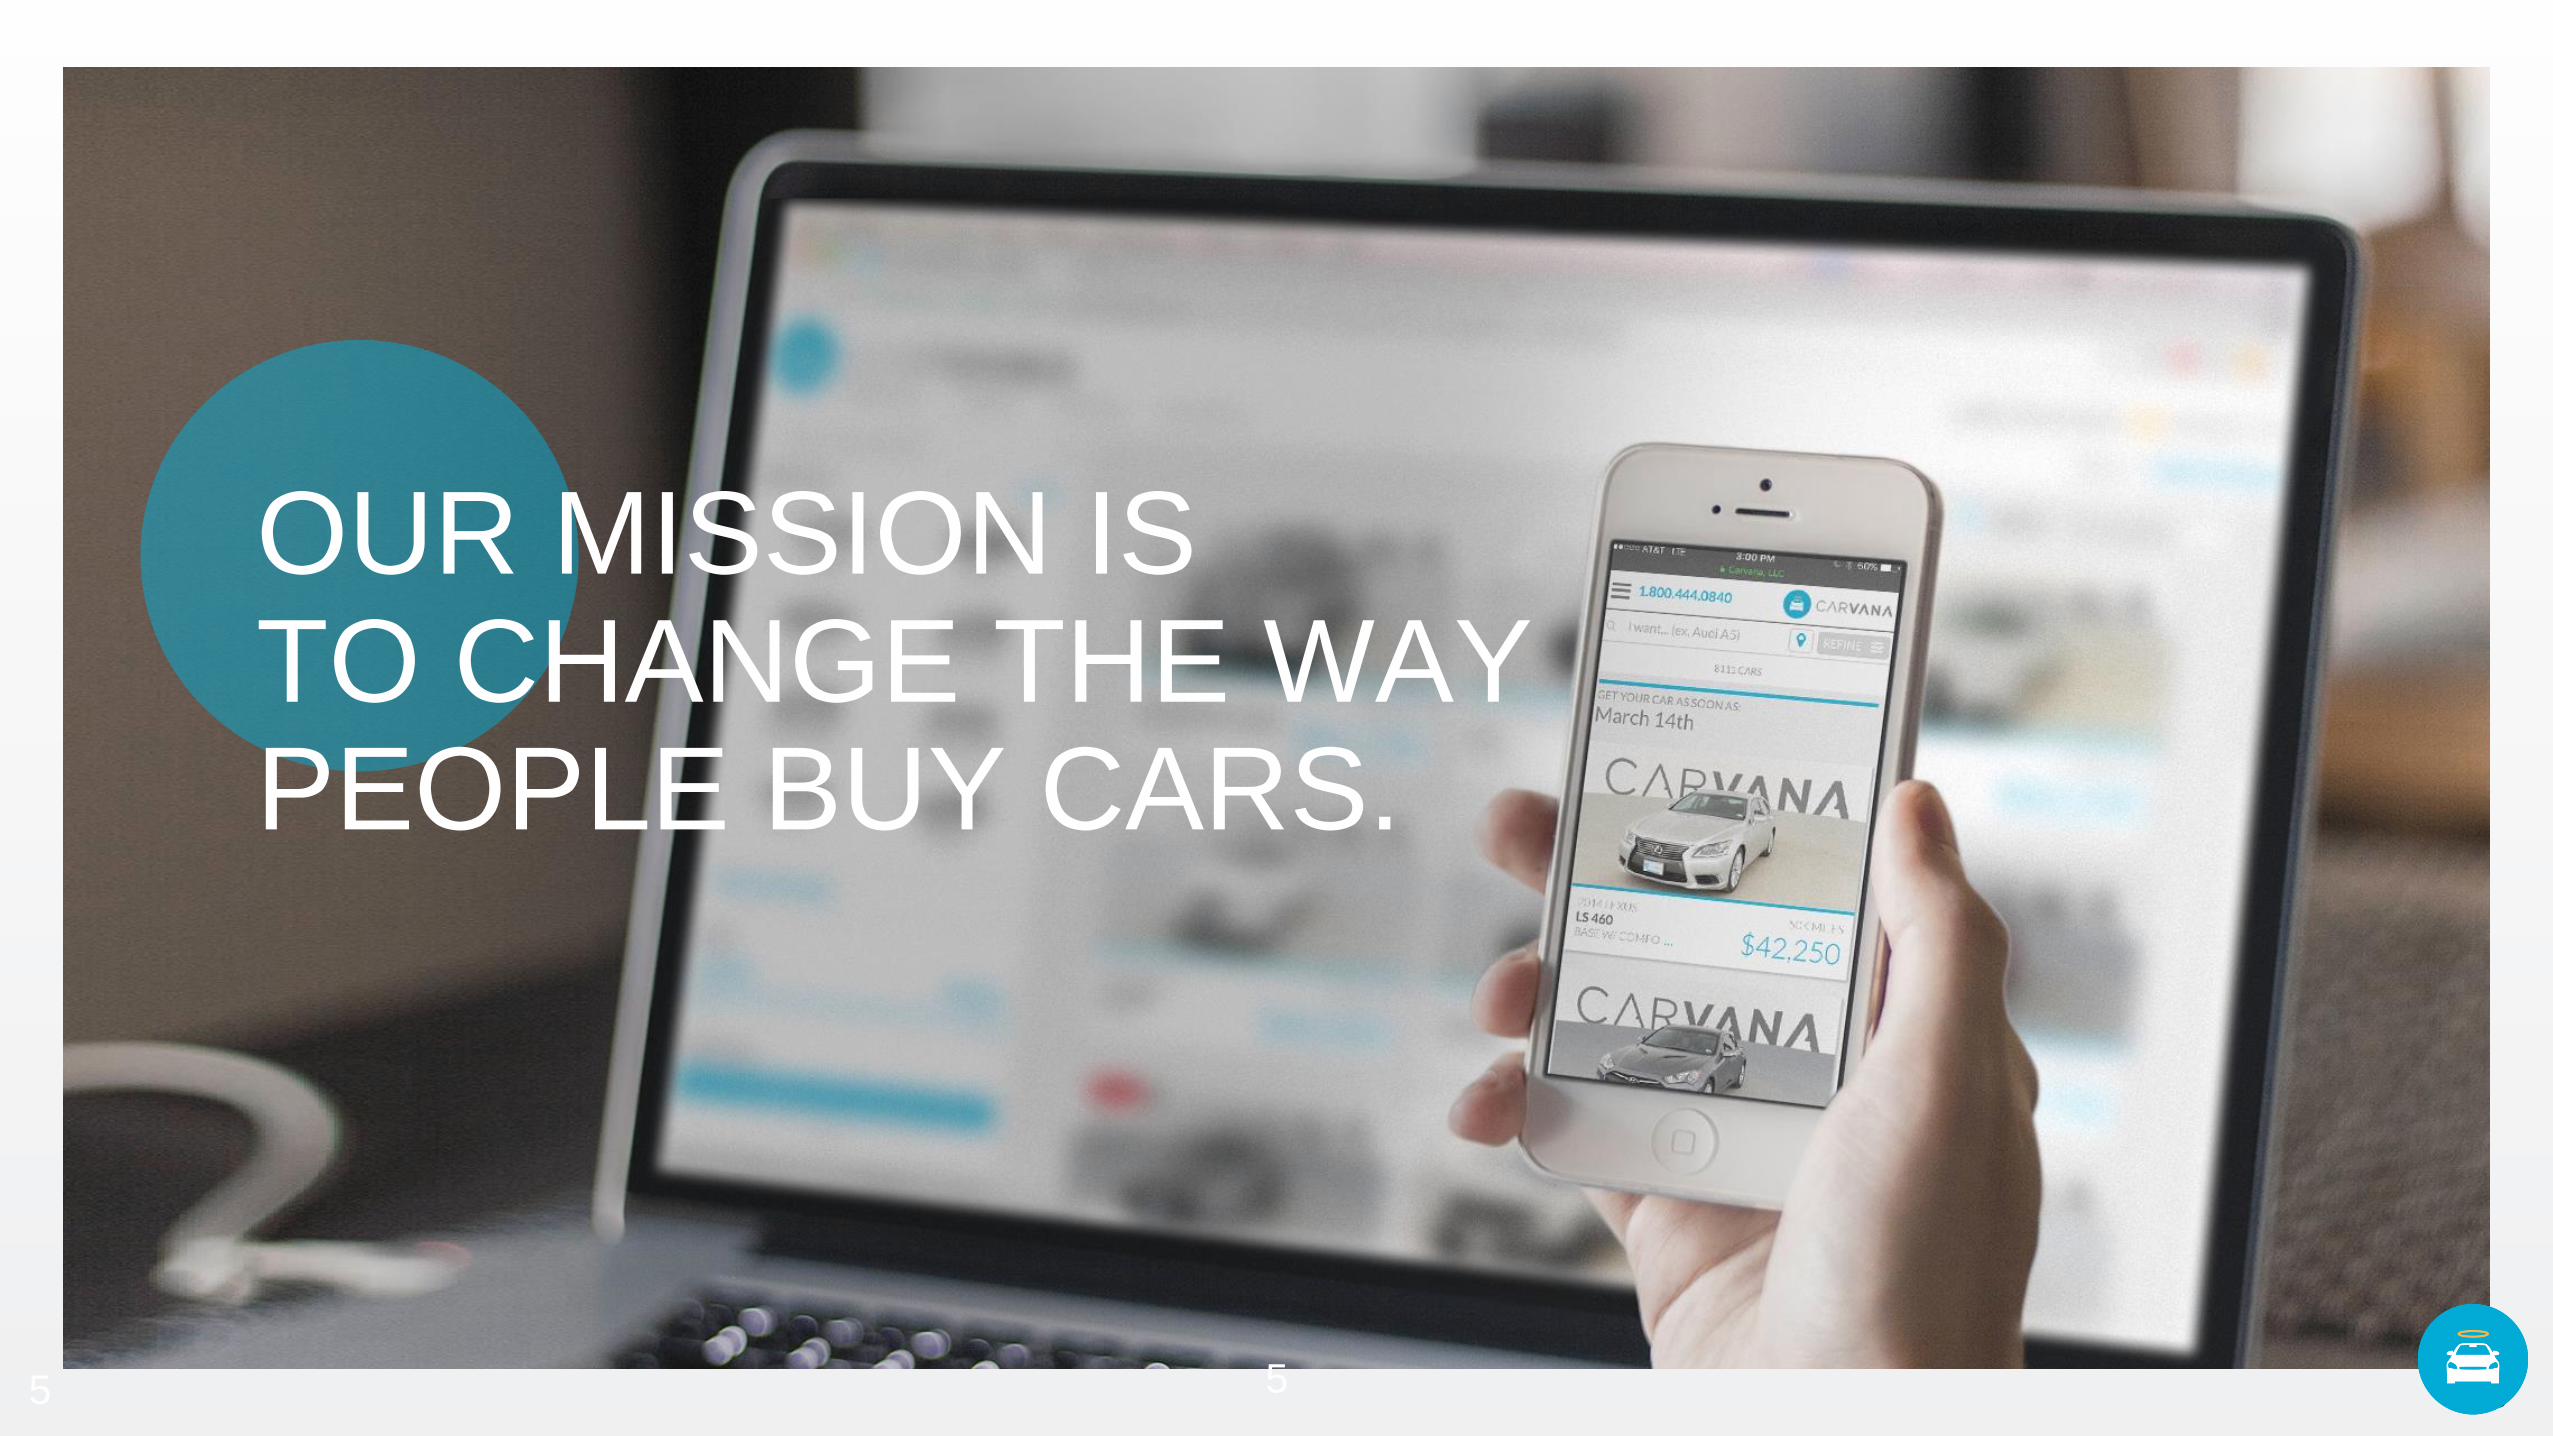
OUR MISSION IS TO CHANGE THE WAY PEOPLE BUY CARS.
55
4
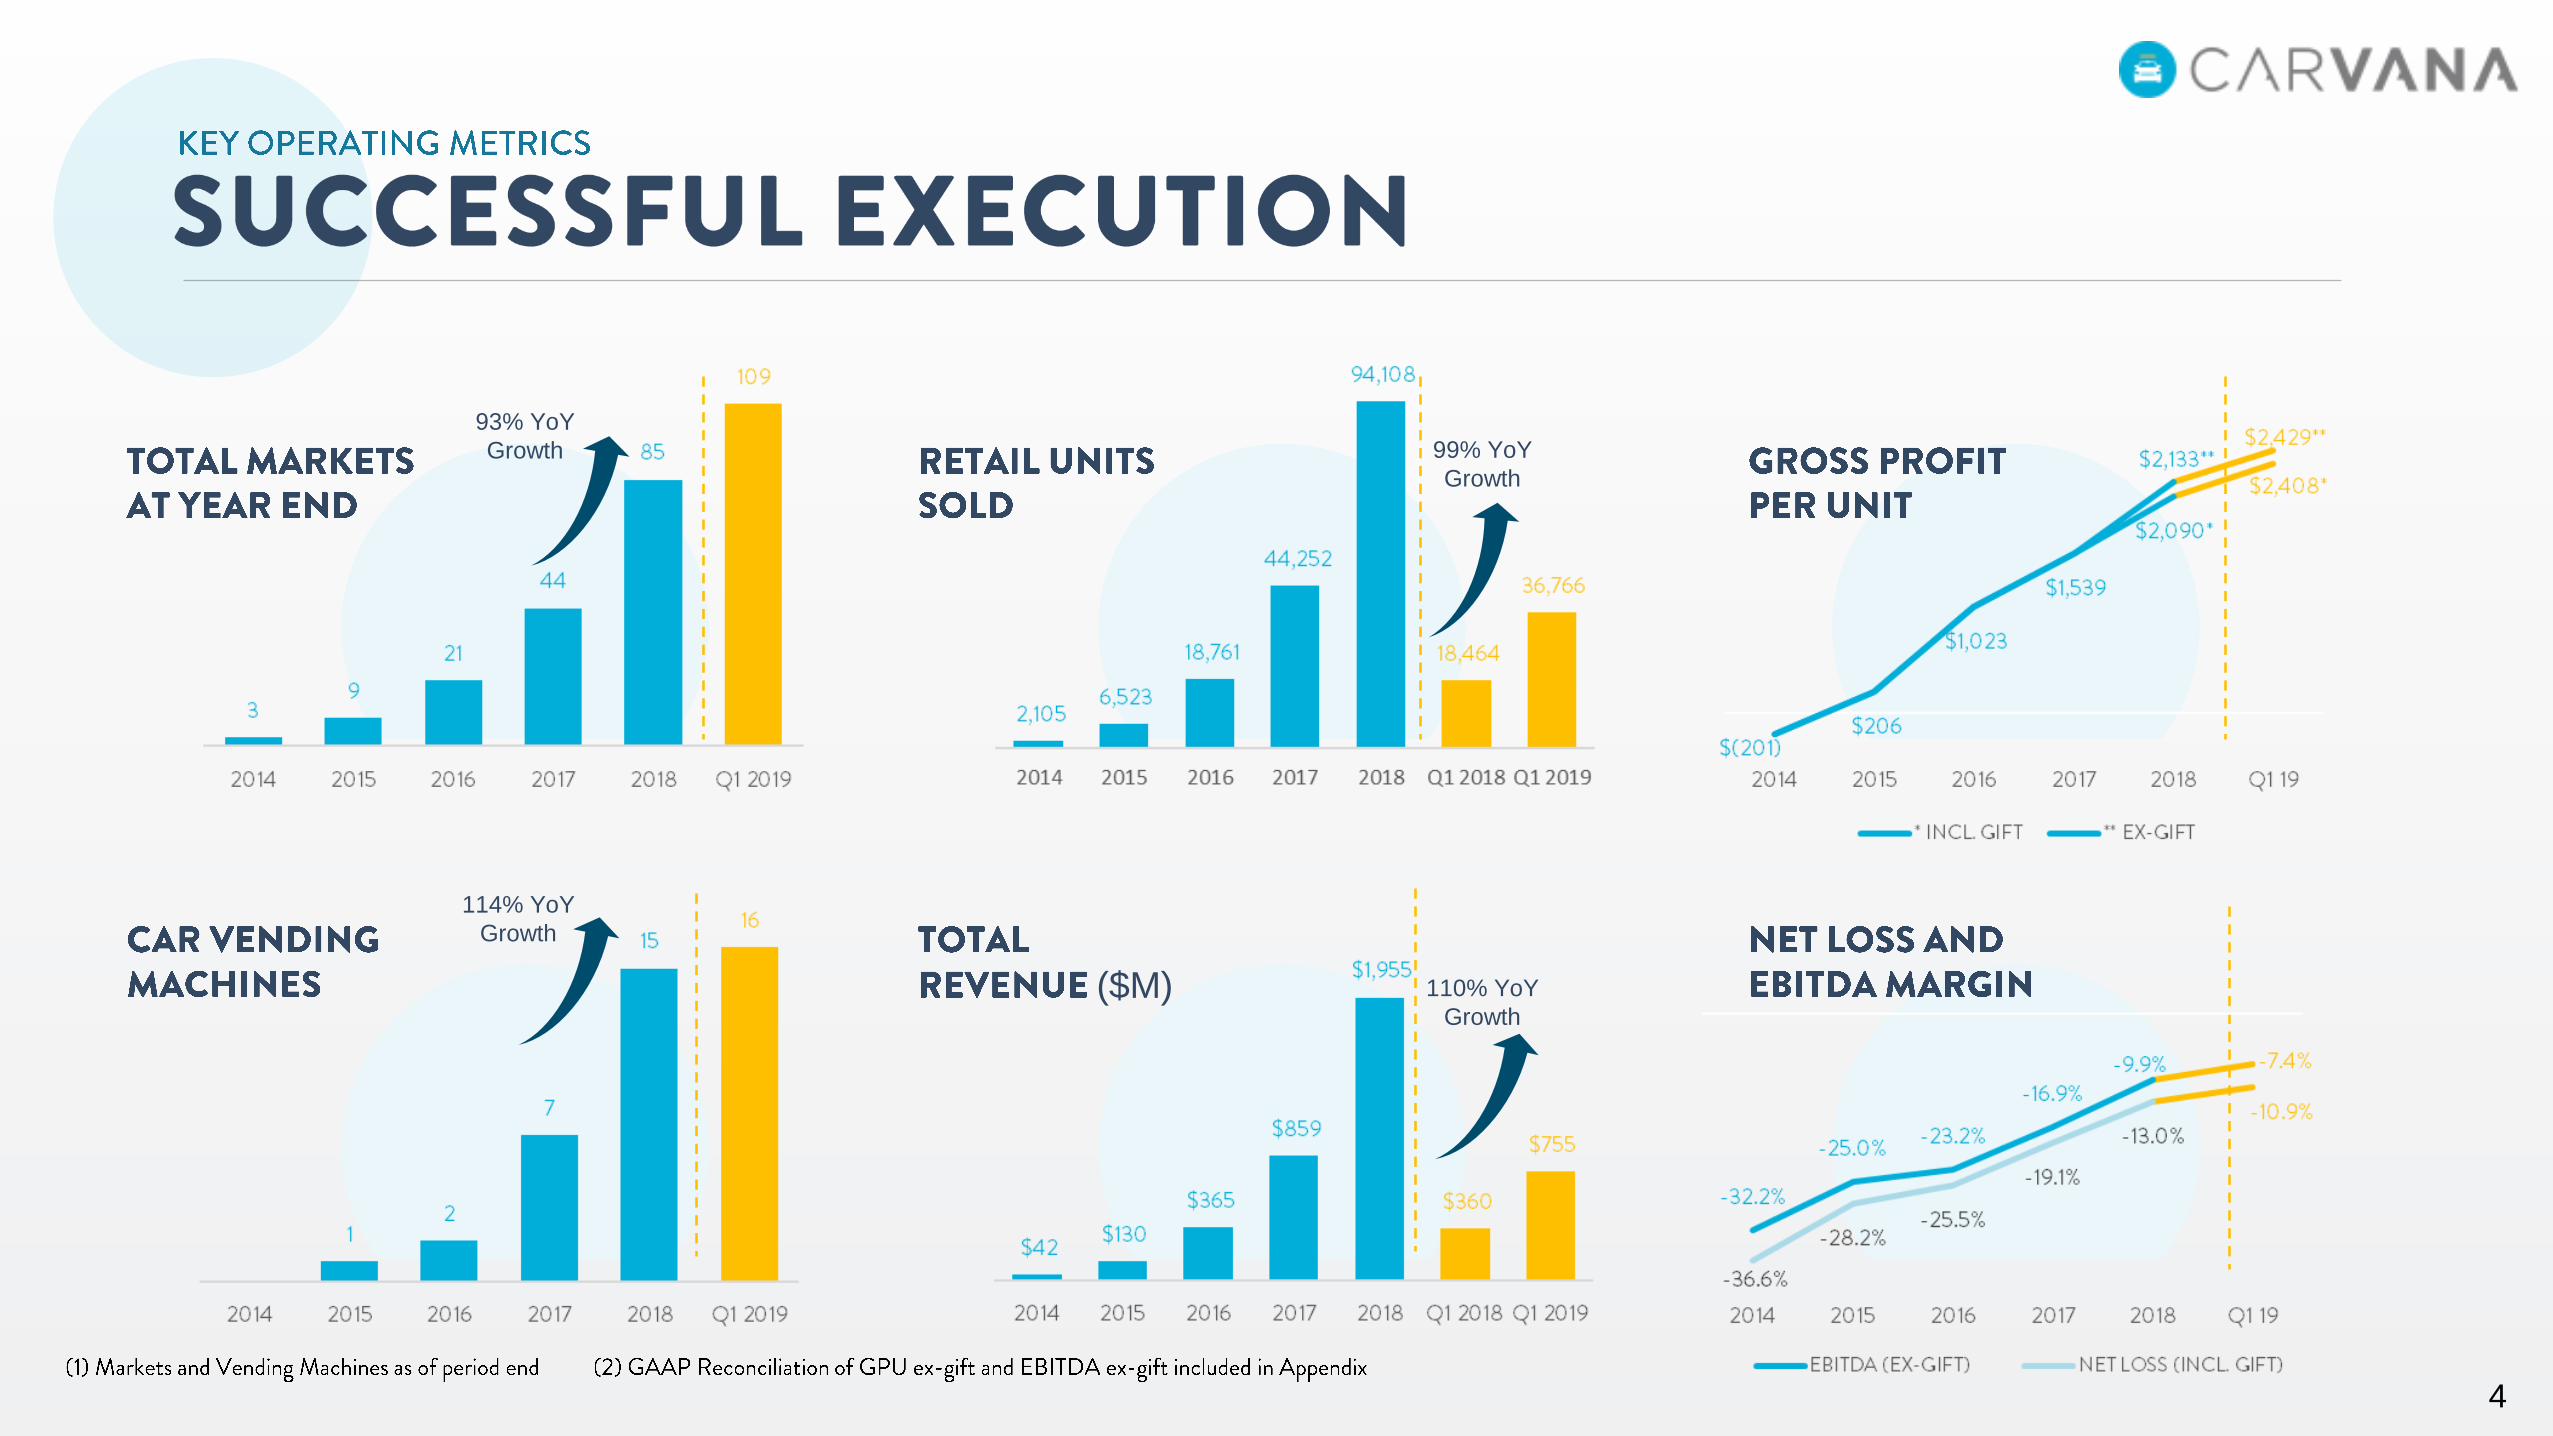
99% YoY
Growth
93% YoY
Growth
114% YoY
Growth
110% YoY
Growth($M)
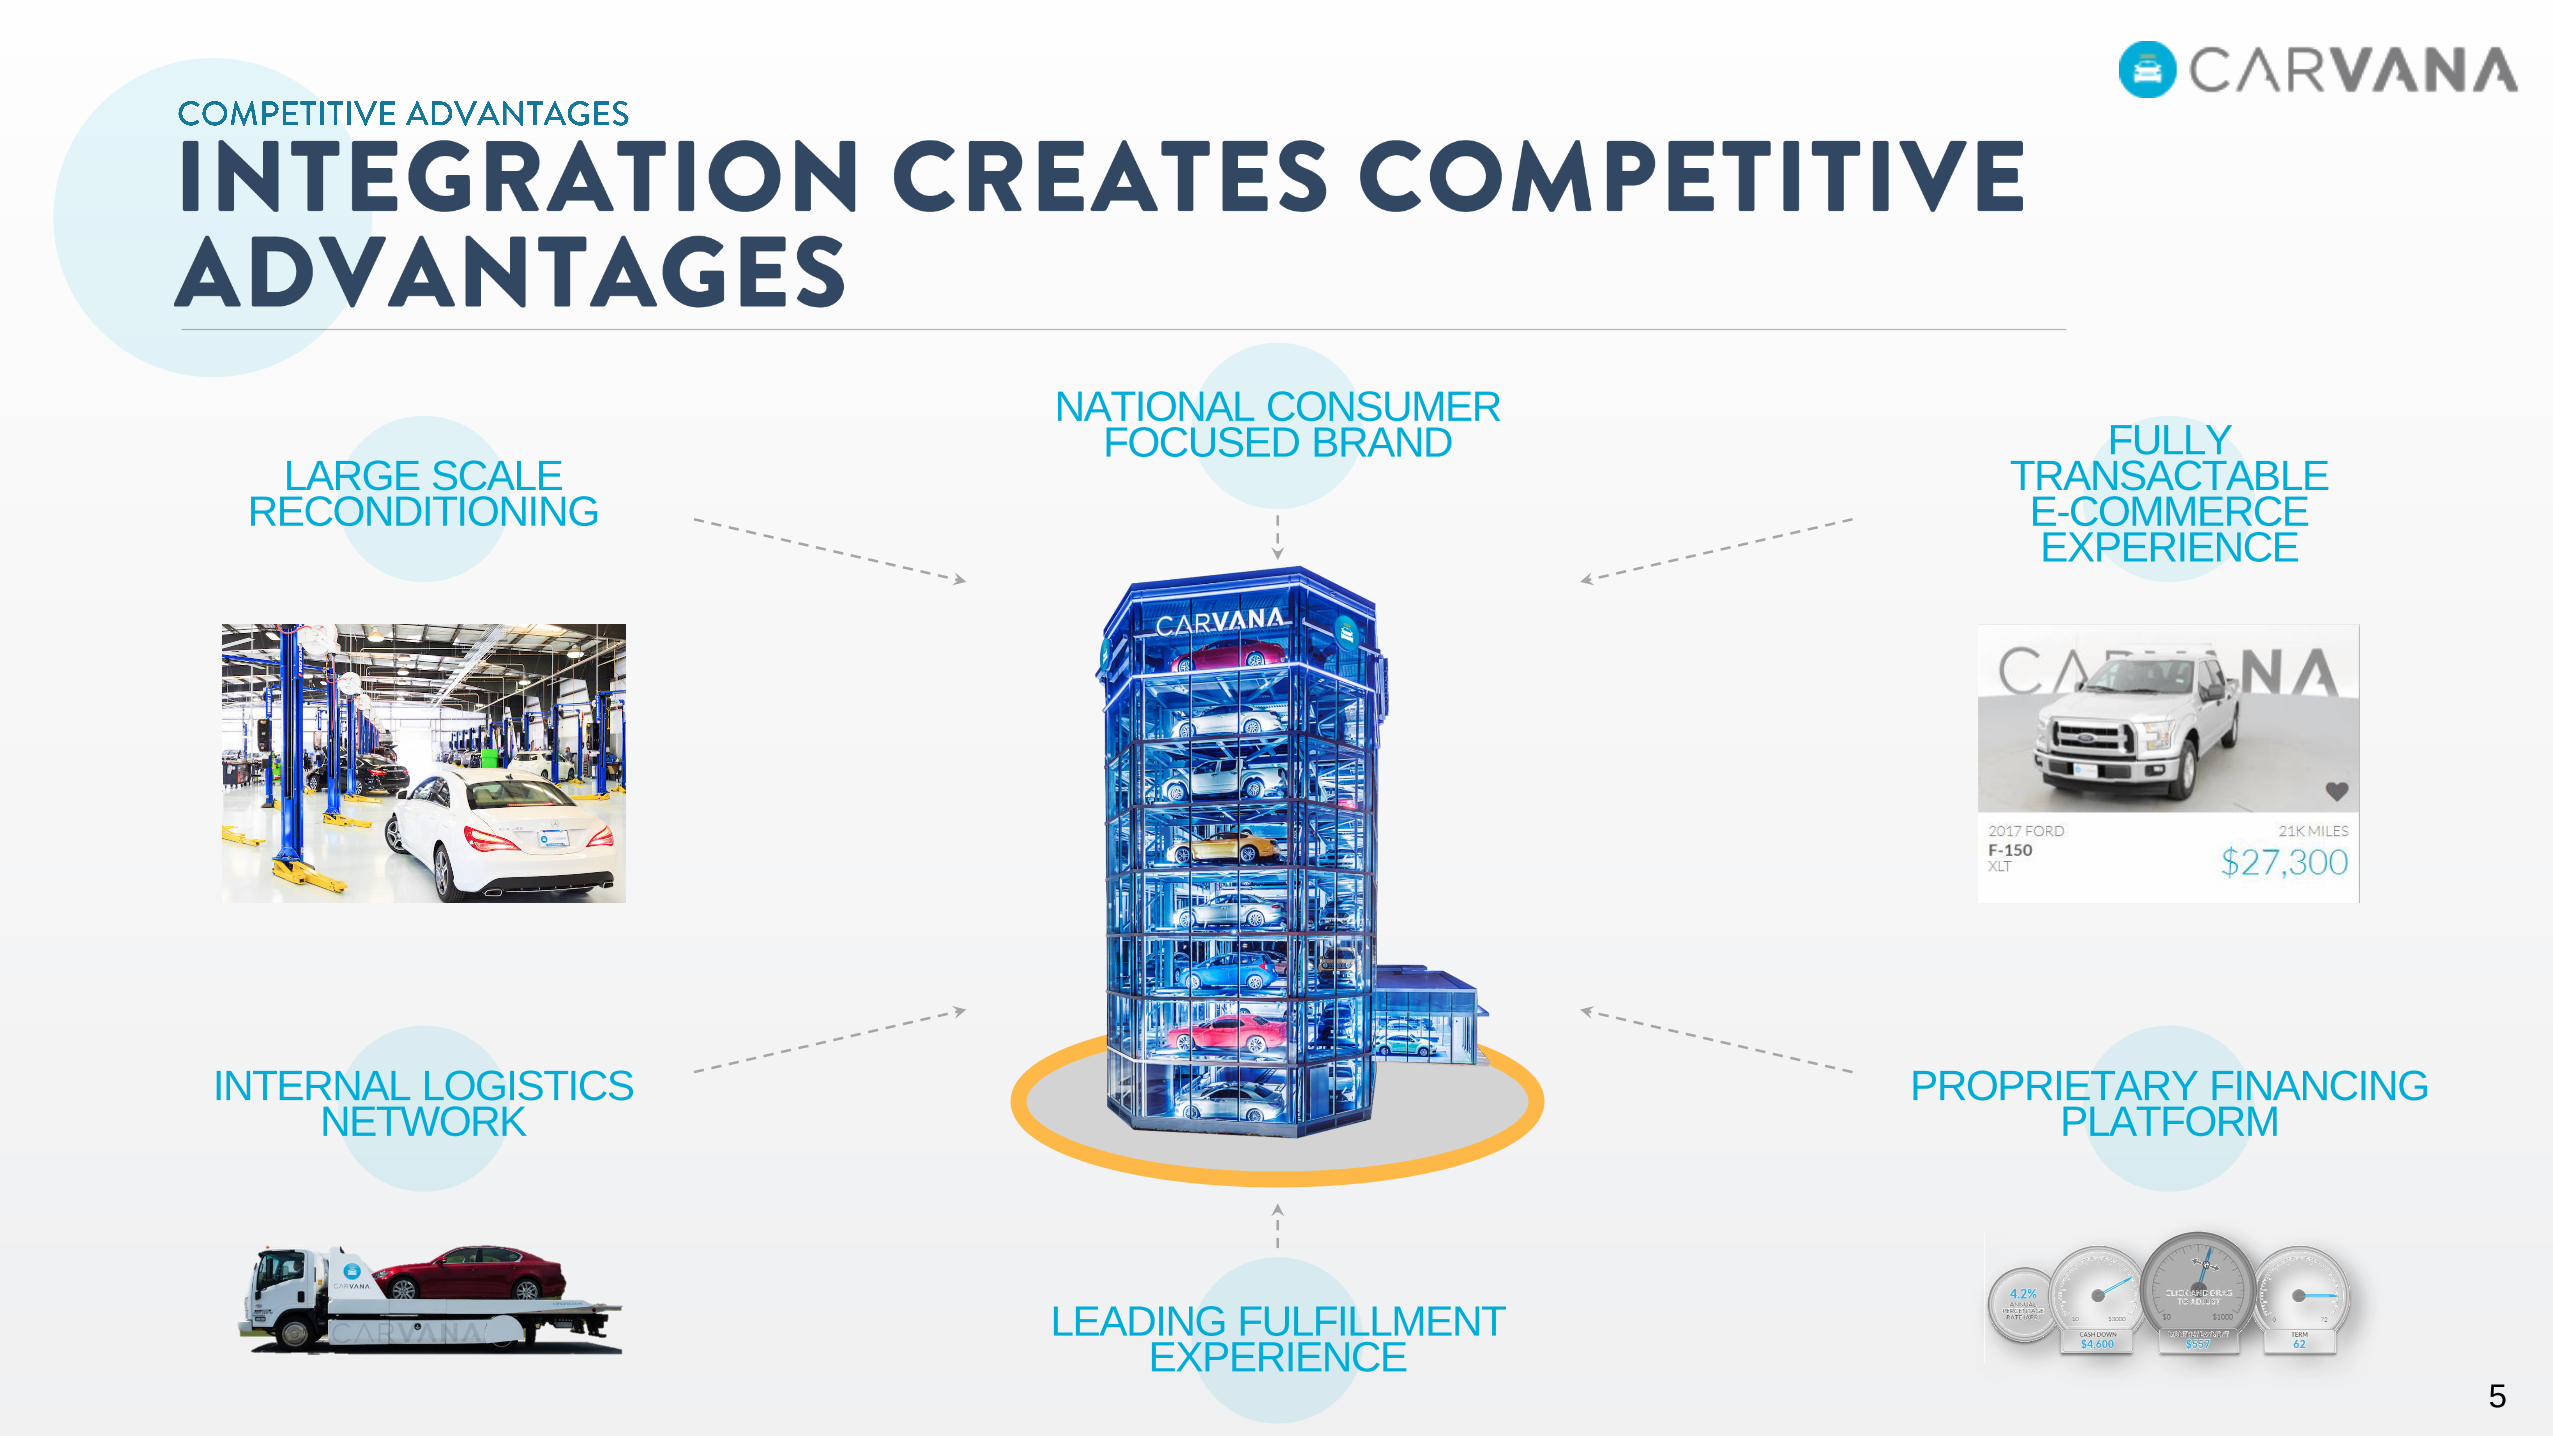
LEADING FULFILLMENT EXPERIENCE
NATIONAL CONSUMER FOCUSED BRAND
INTERNAL LOGISTICS NETWORK
PROPRIETARY FINANCING PLATFORM
FULLY TRANSACTABLE E-COMMERCE EXPERIENCE
LARGE SCALE RECONDITIONING
5
6
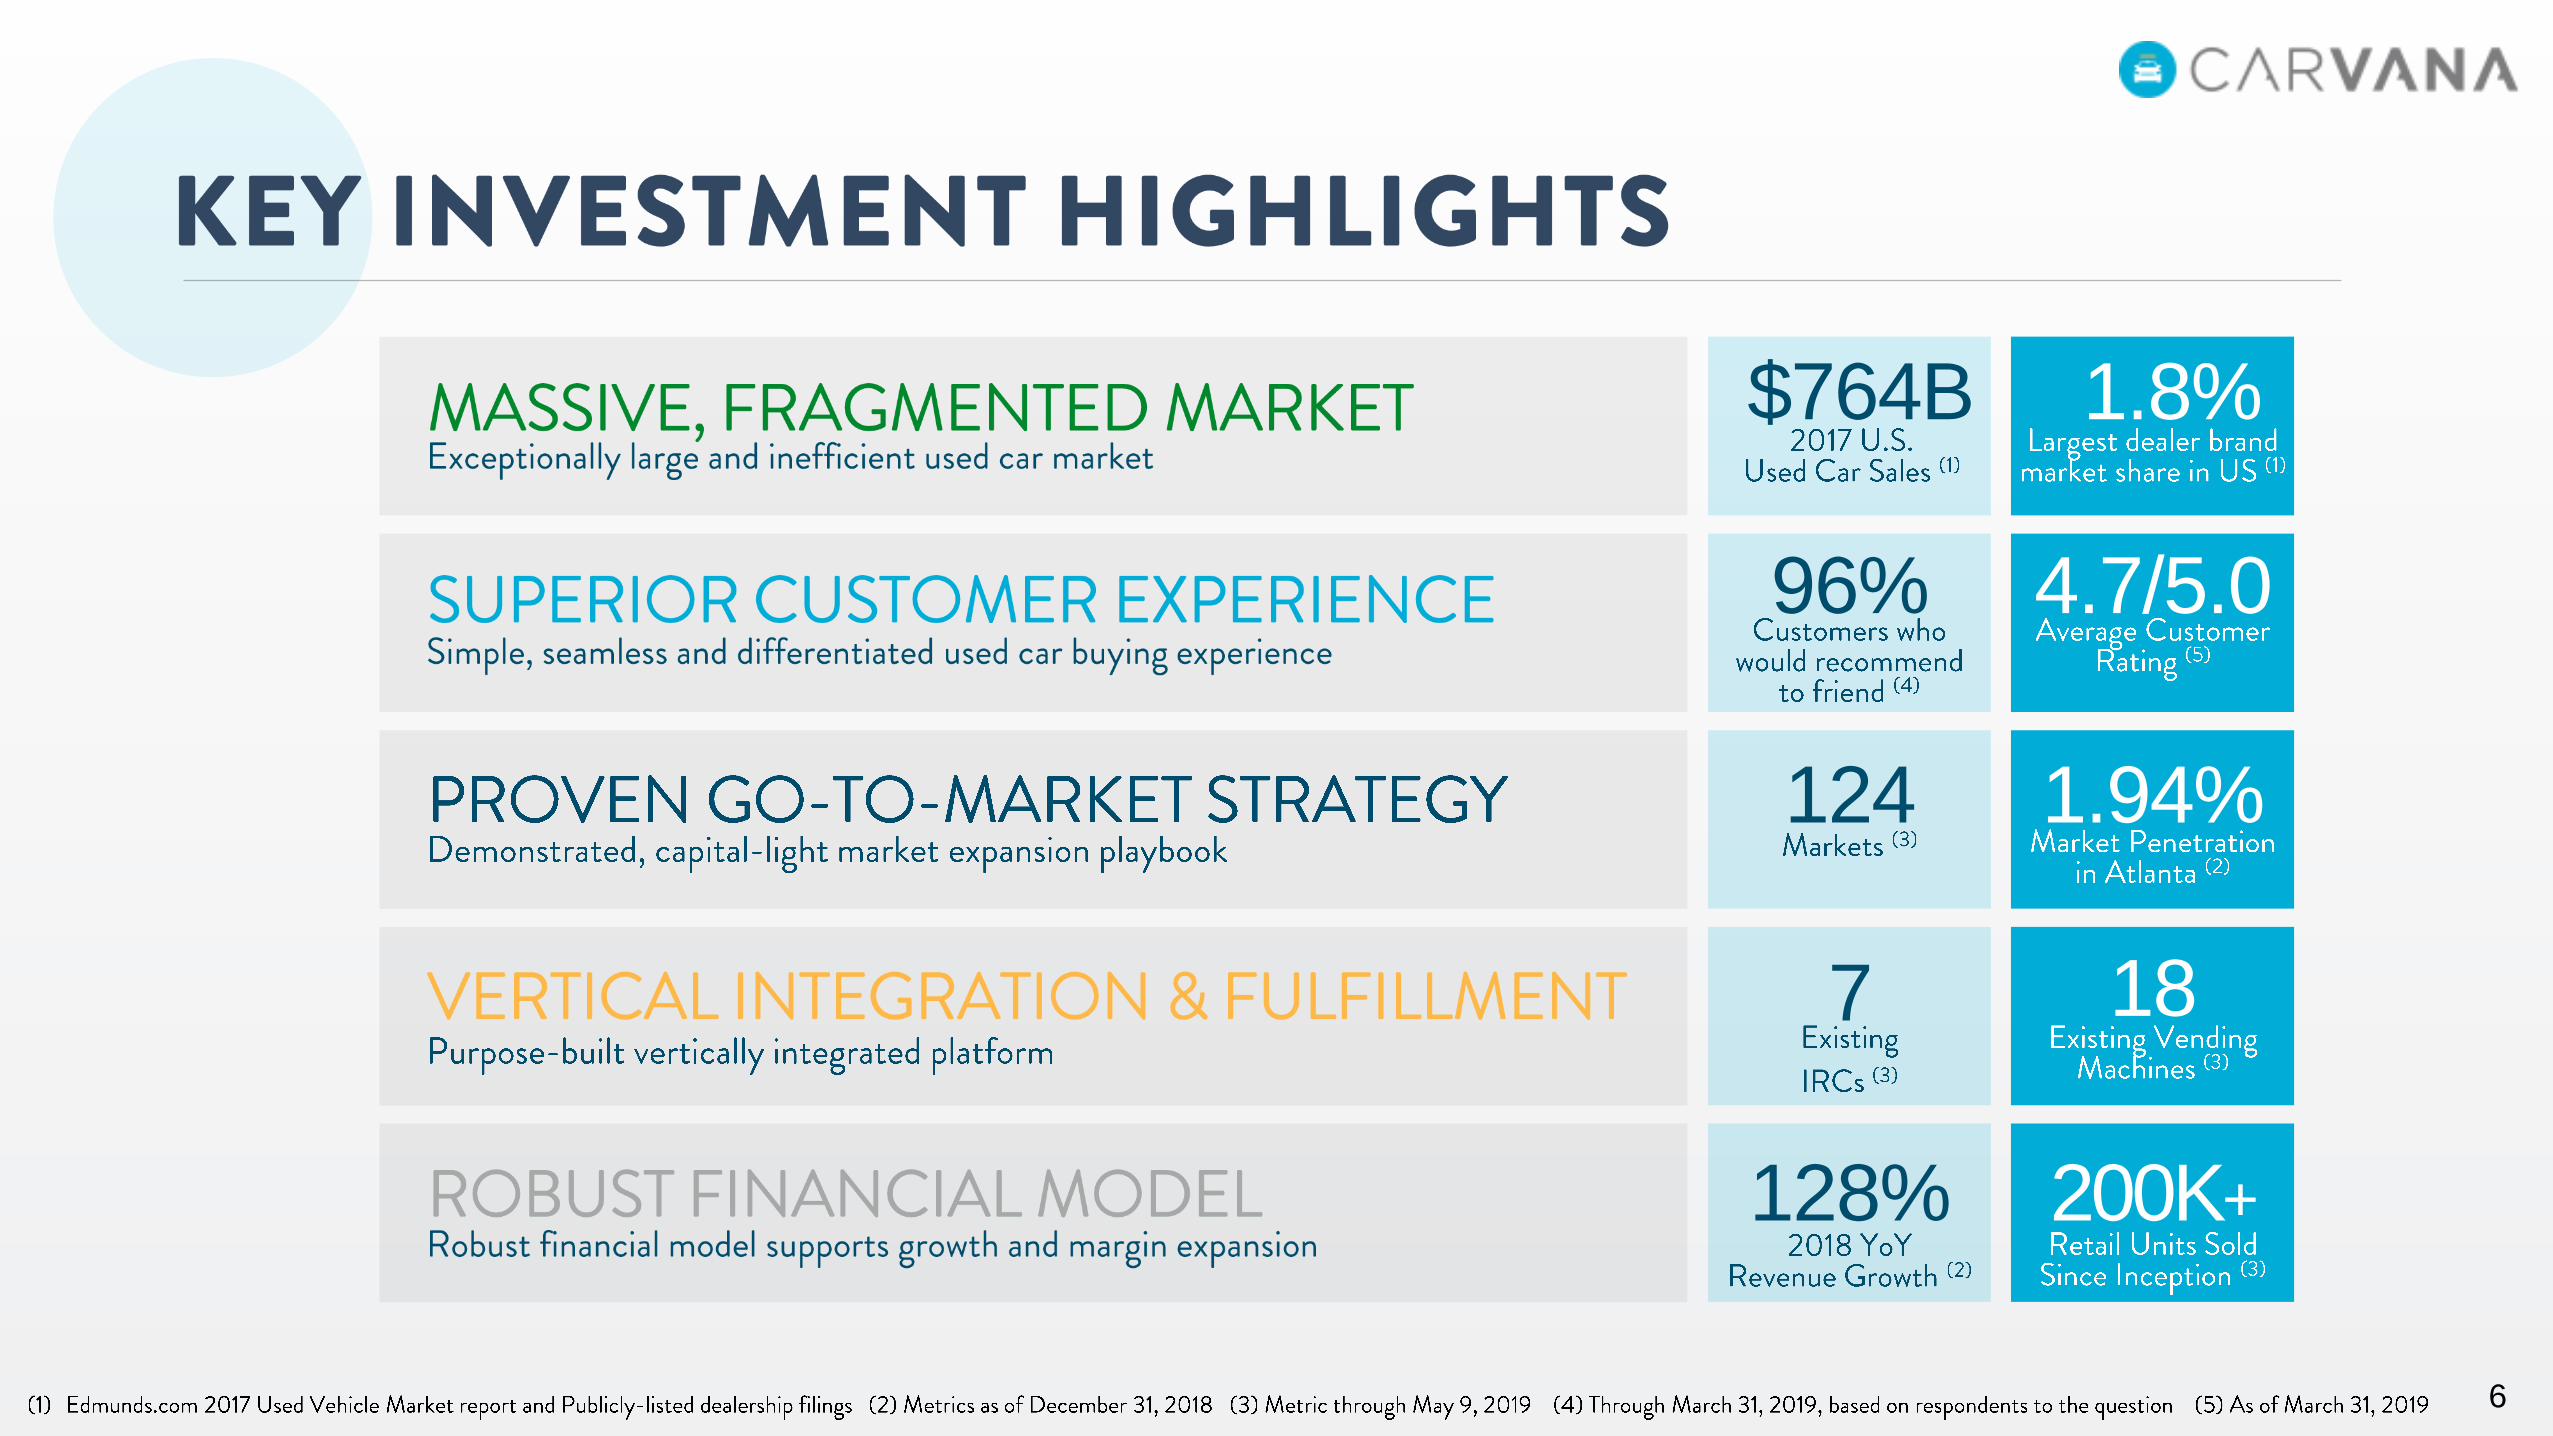
$764B 1.8%
96% 4.7/5.0
128% 200K+
7 18
124 1.94%
7
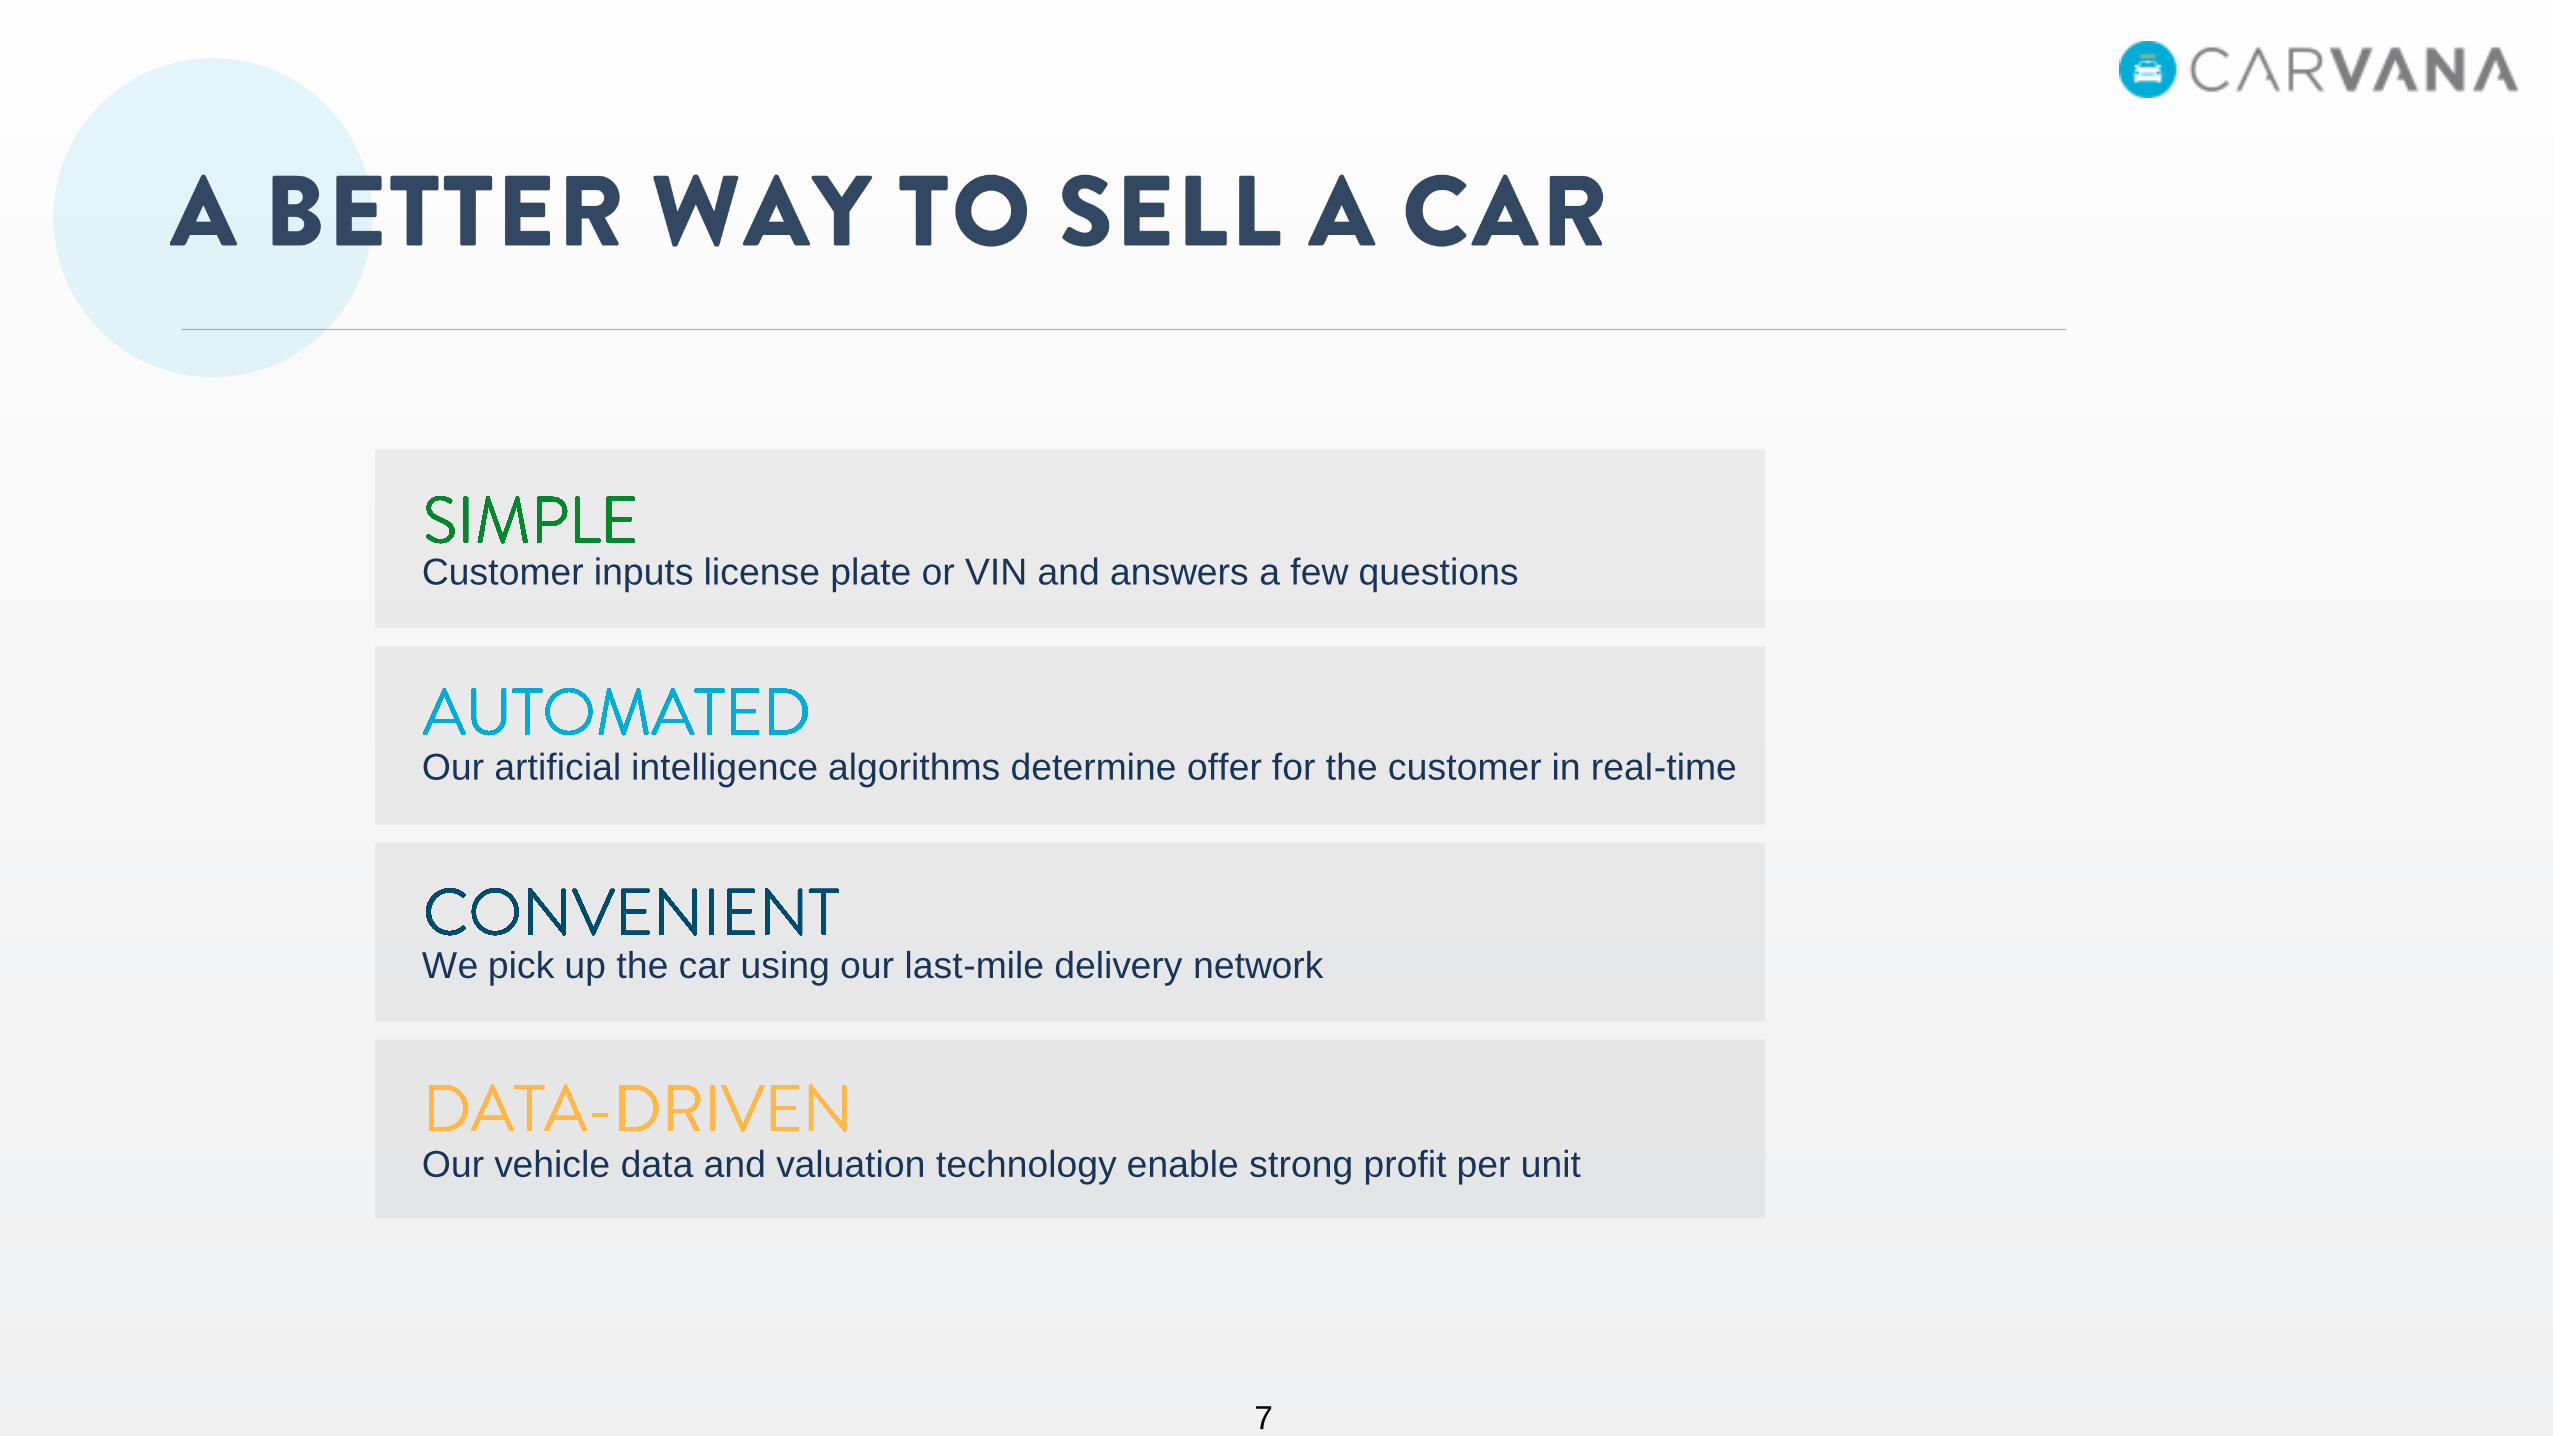
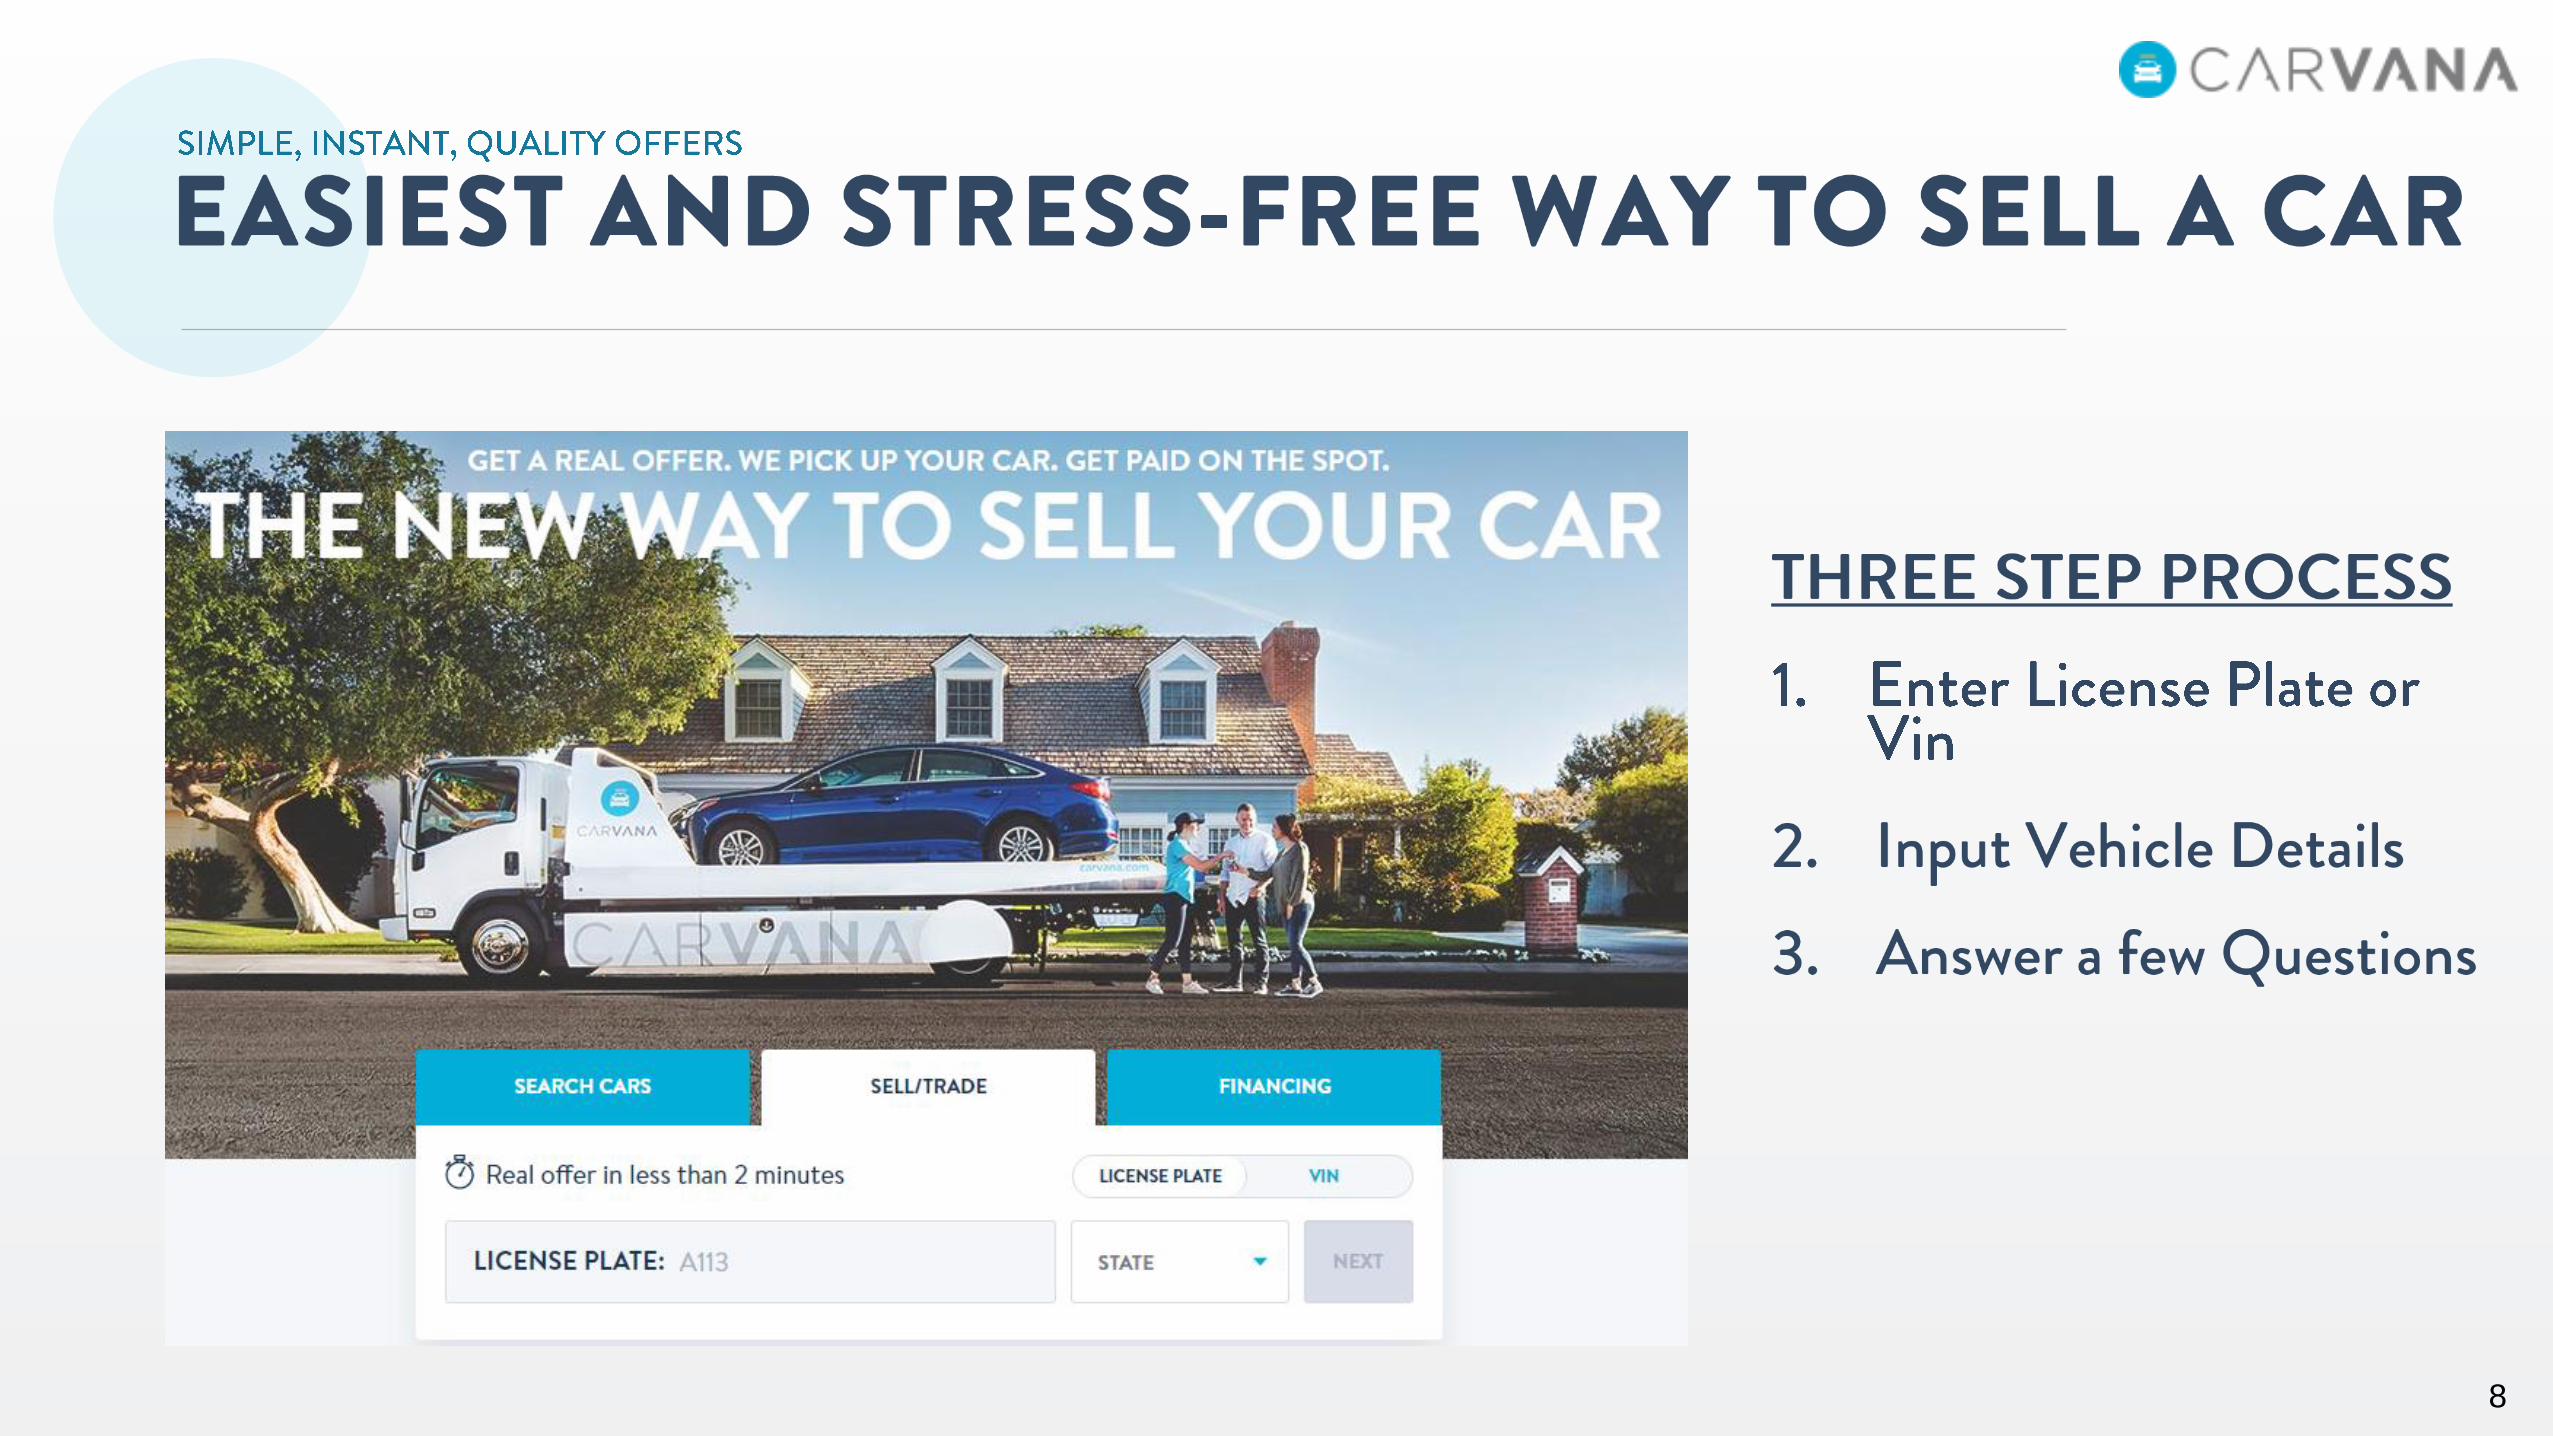
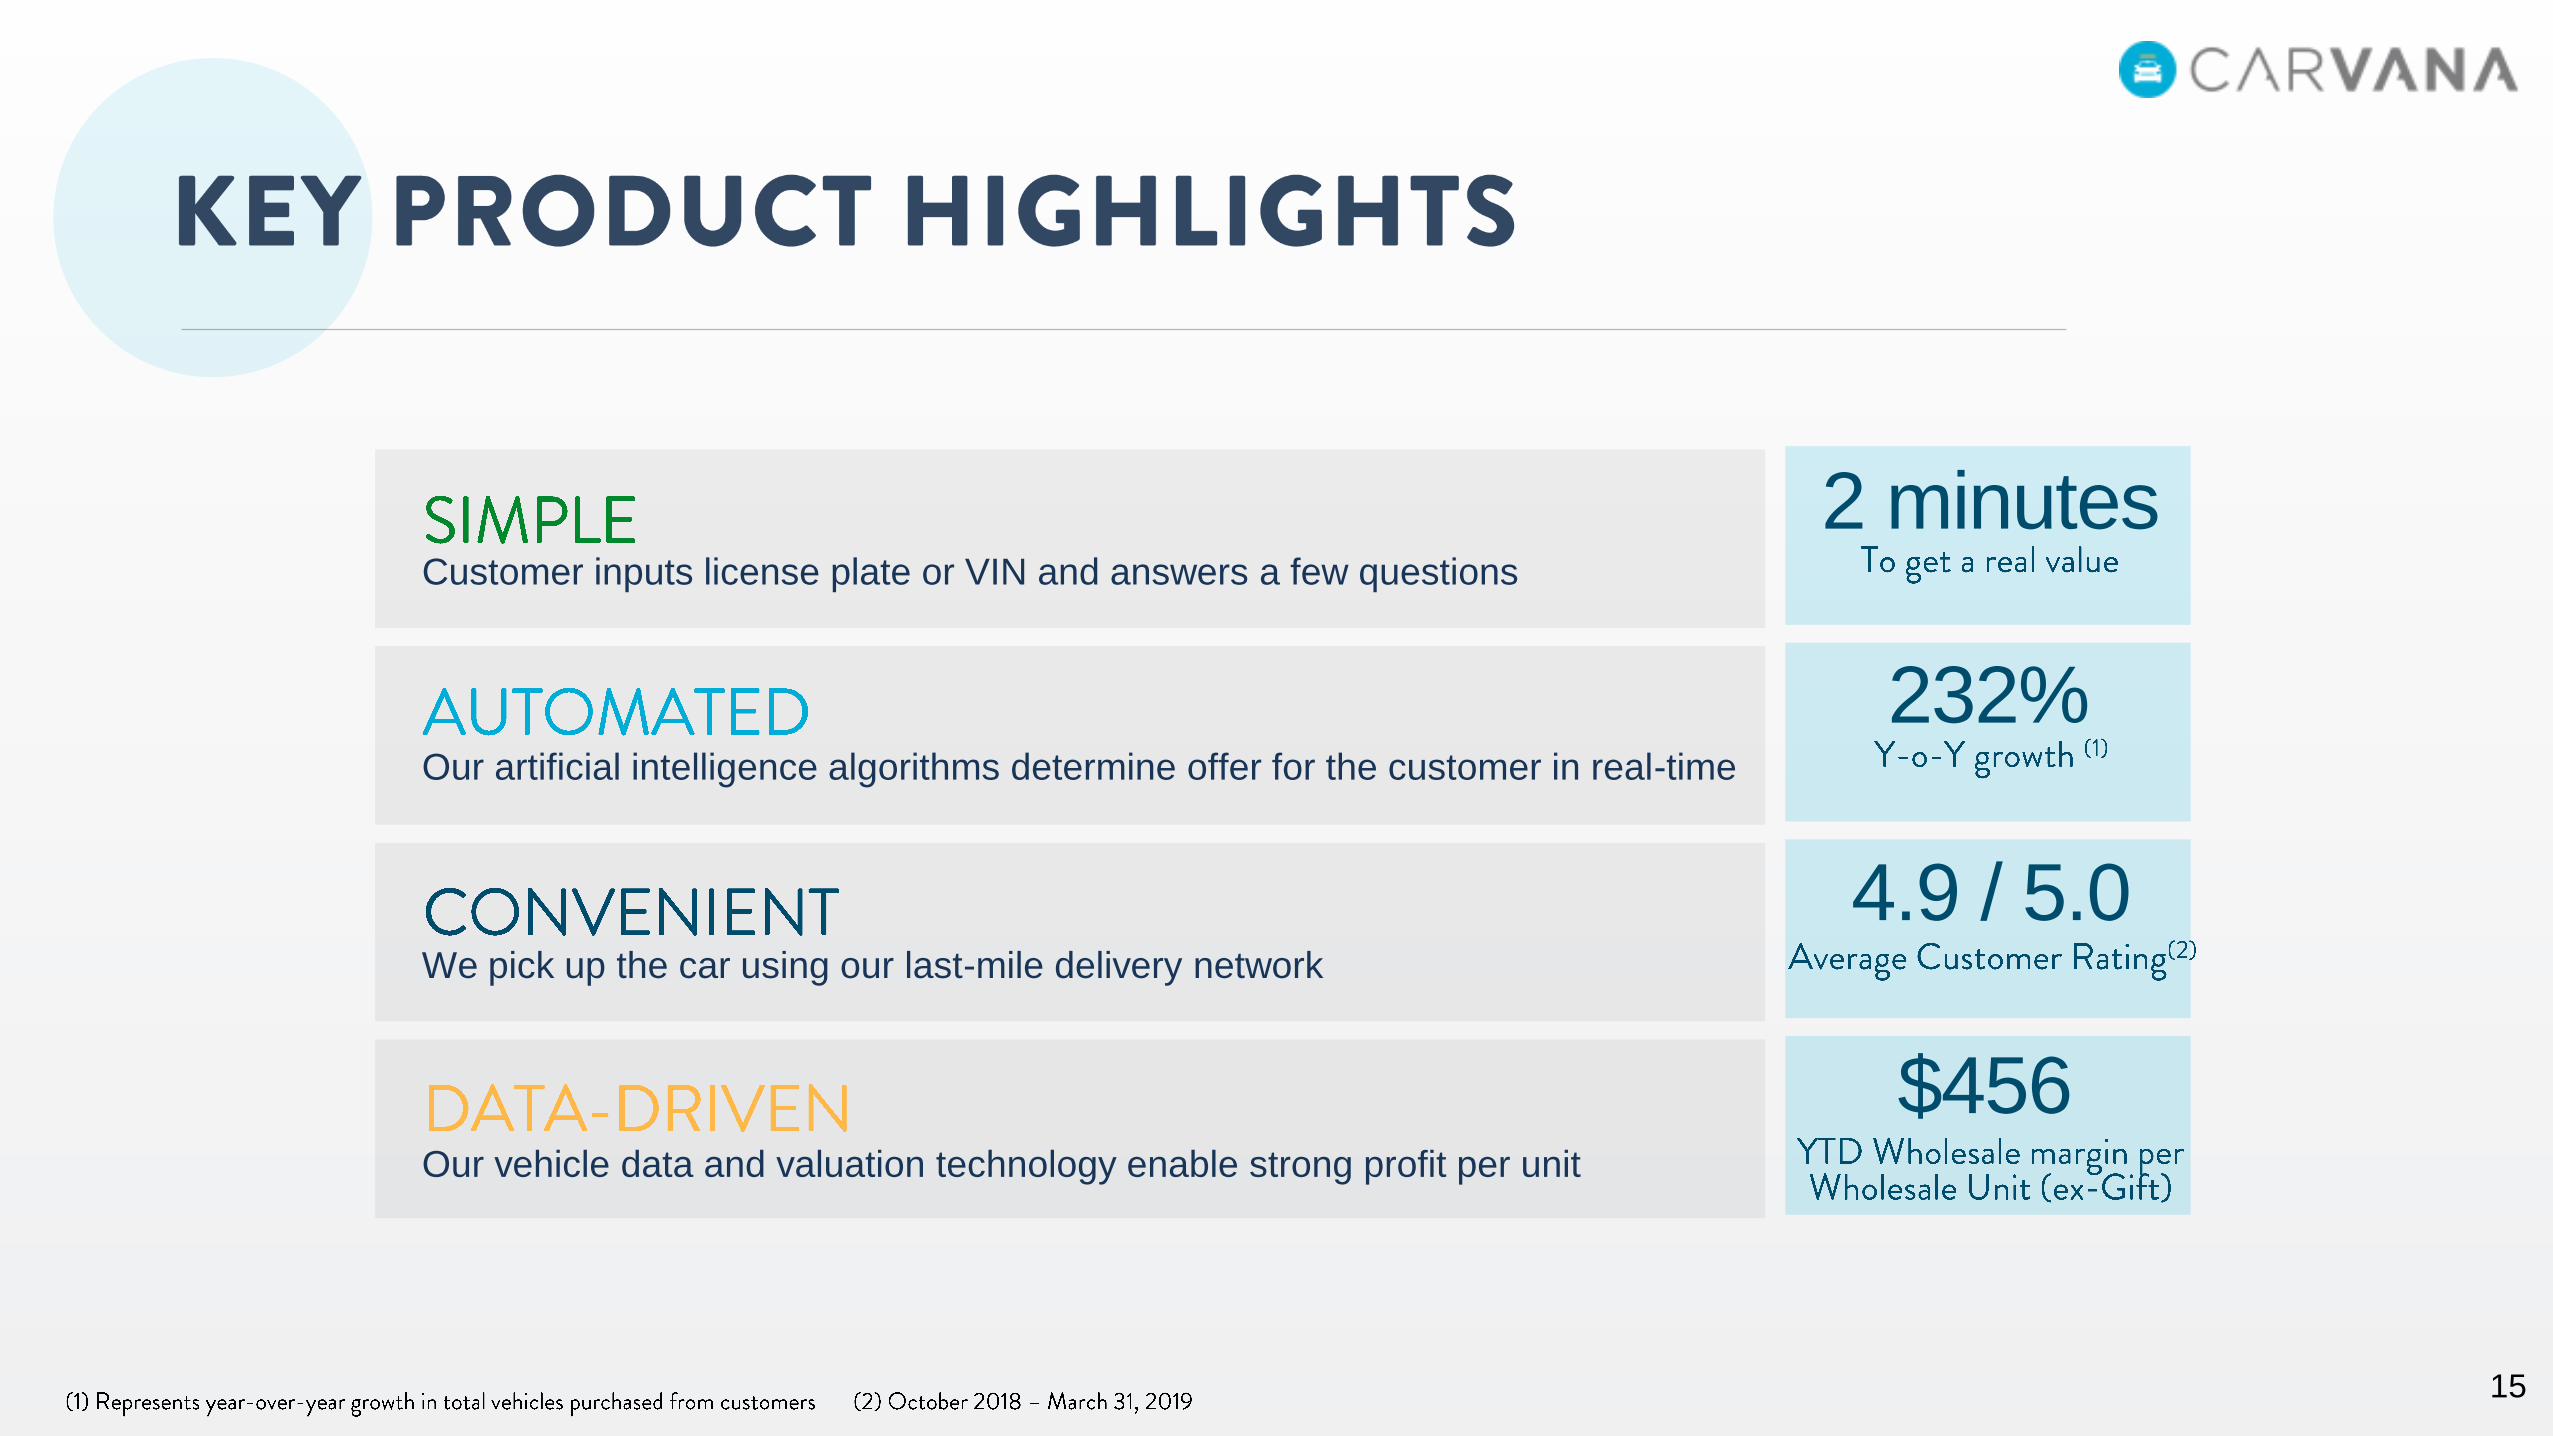
Customer inputs license plate or VIN and answers a few questions
Our vehicle data and valuation technology enable strong profit per unit
We pick up the car using our last-mile delivery network
Our artificial intelligence algorithms determine offer for the customer in real-time
8
9
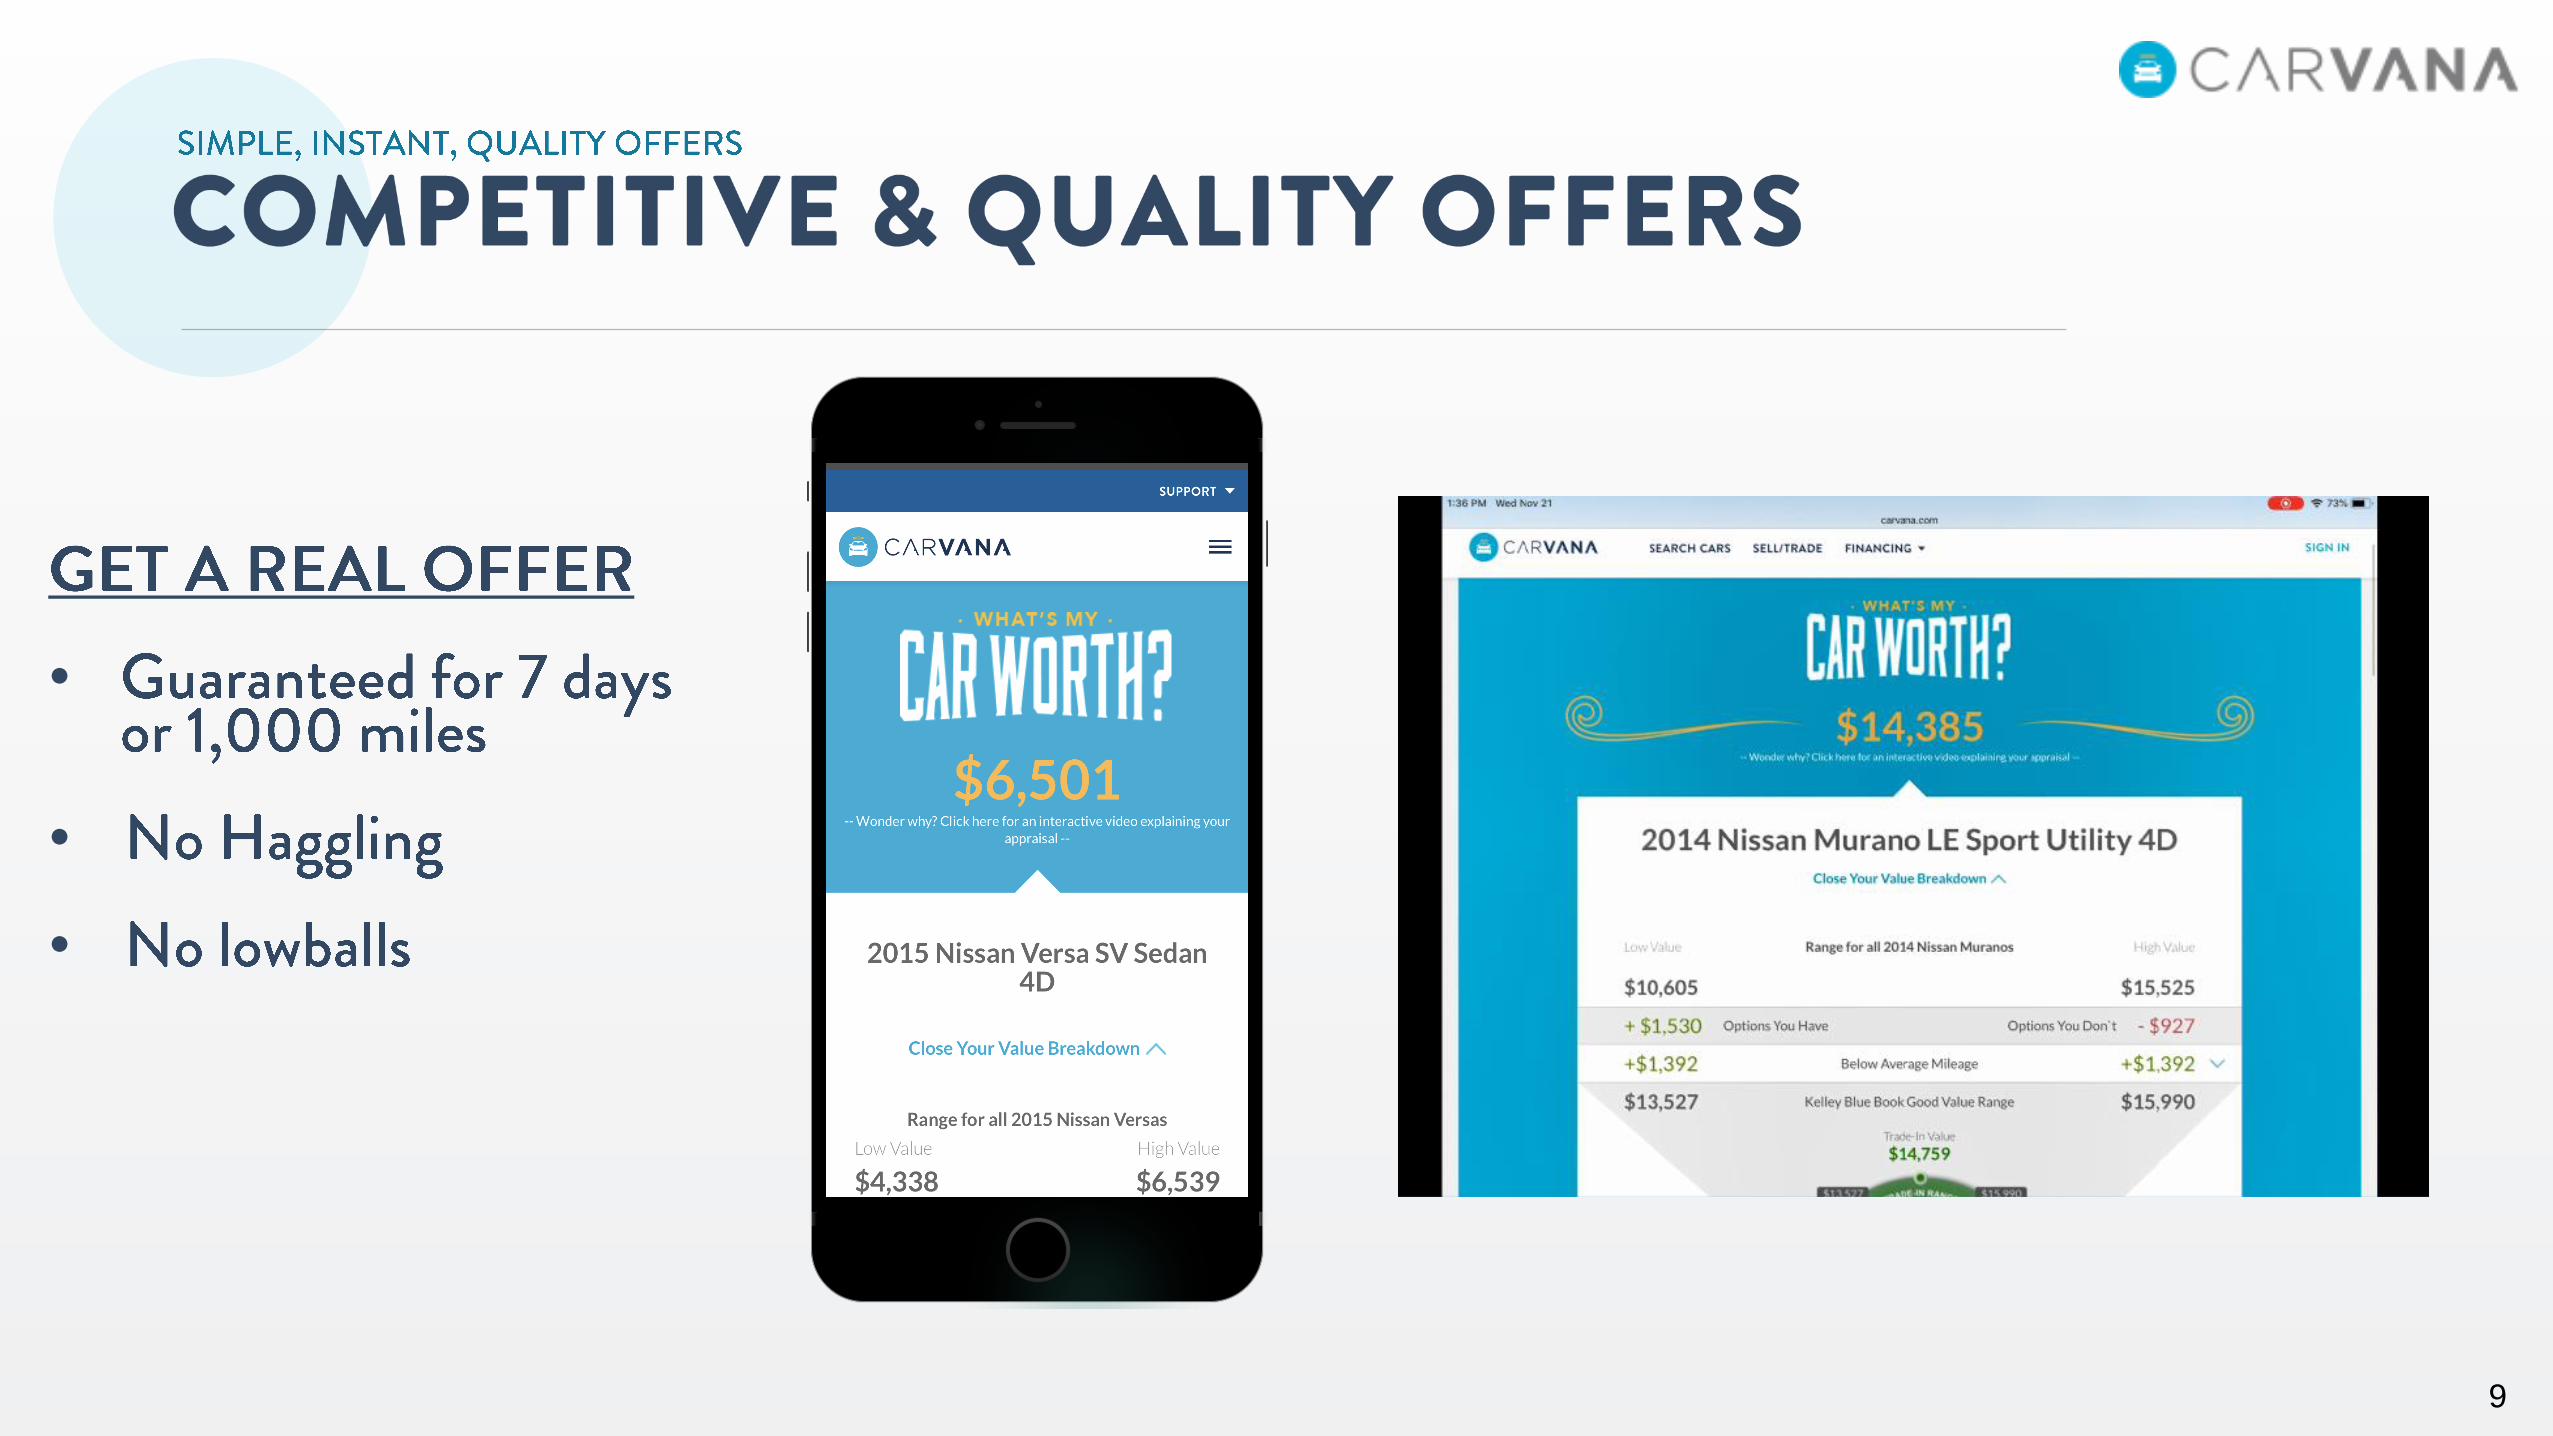
•
•
•
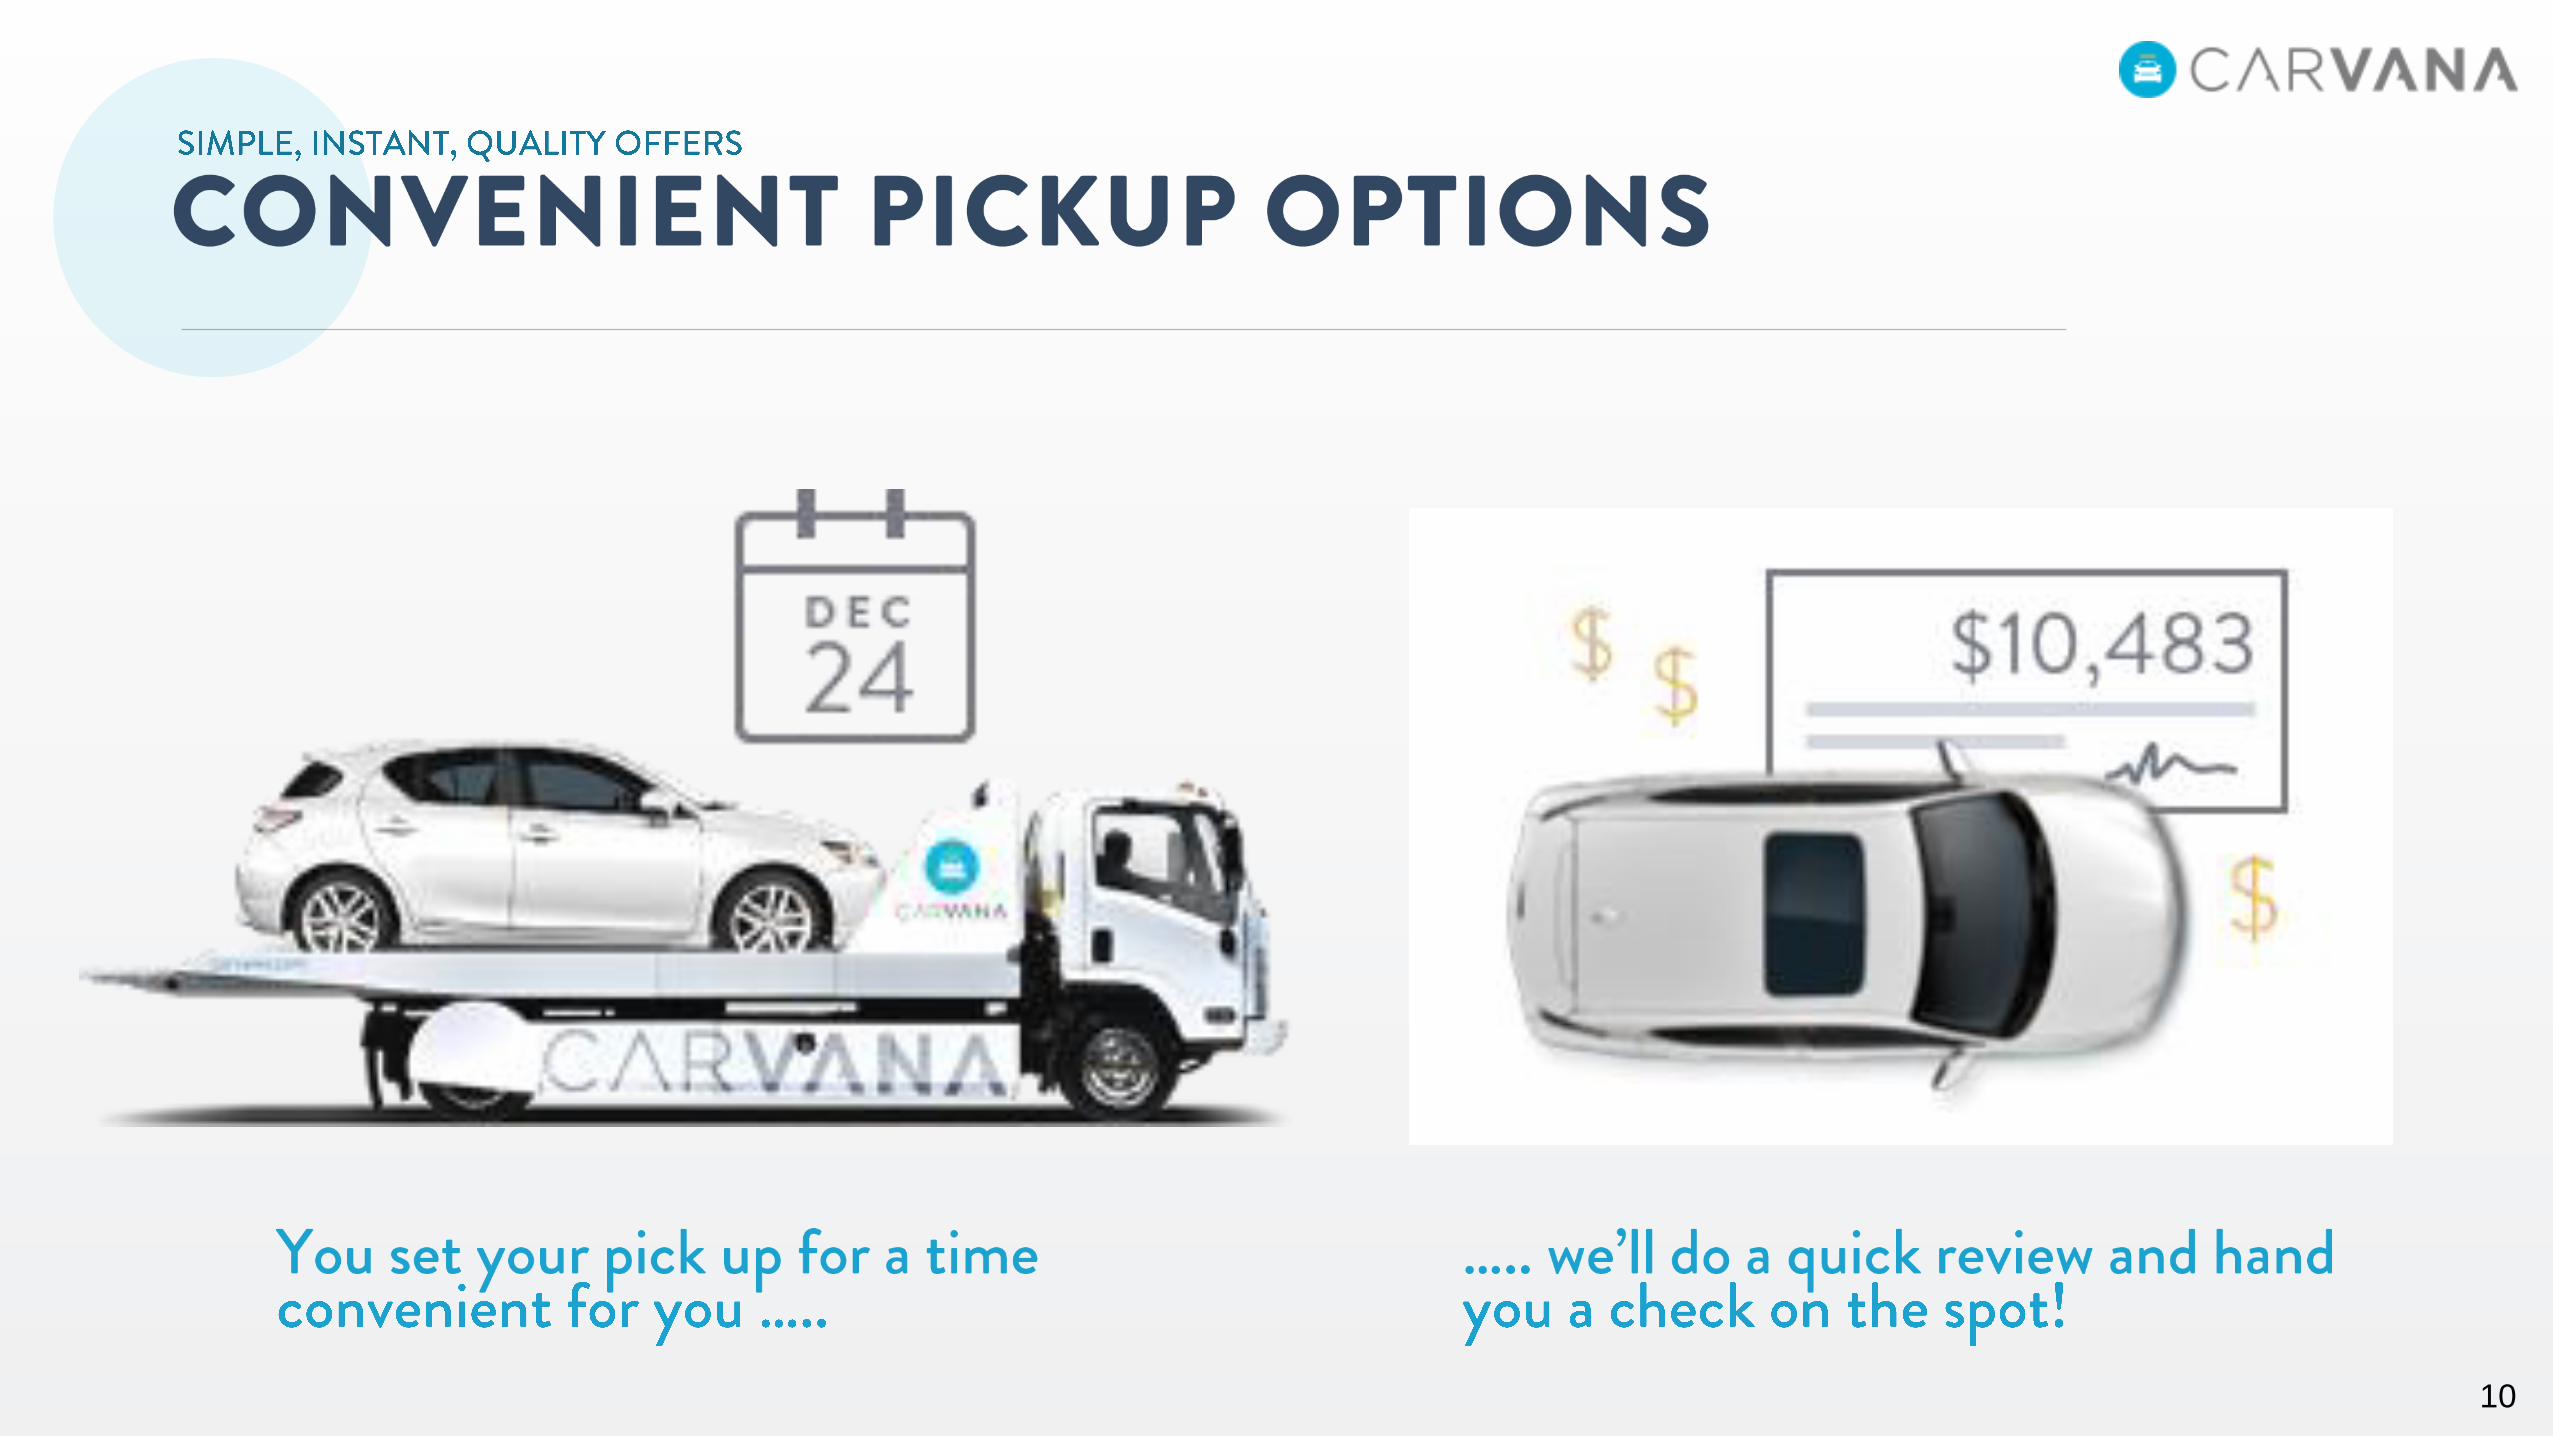
10
11
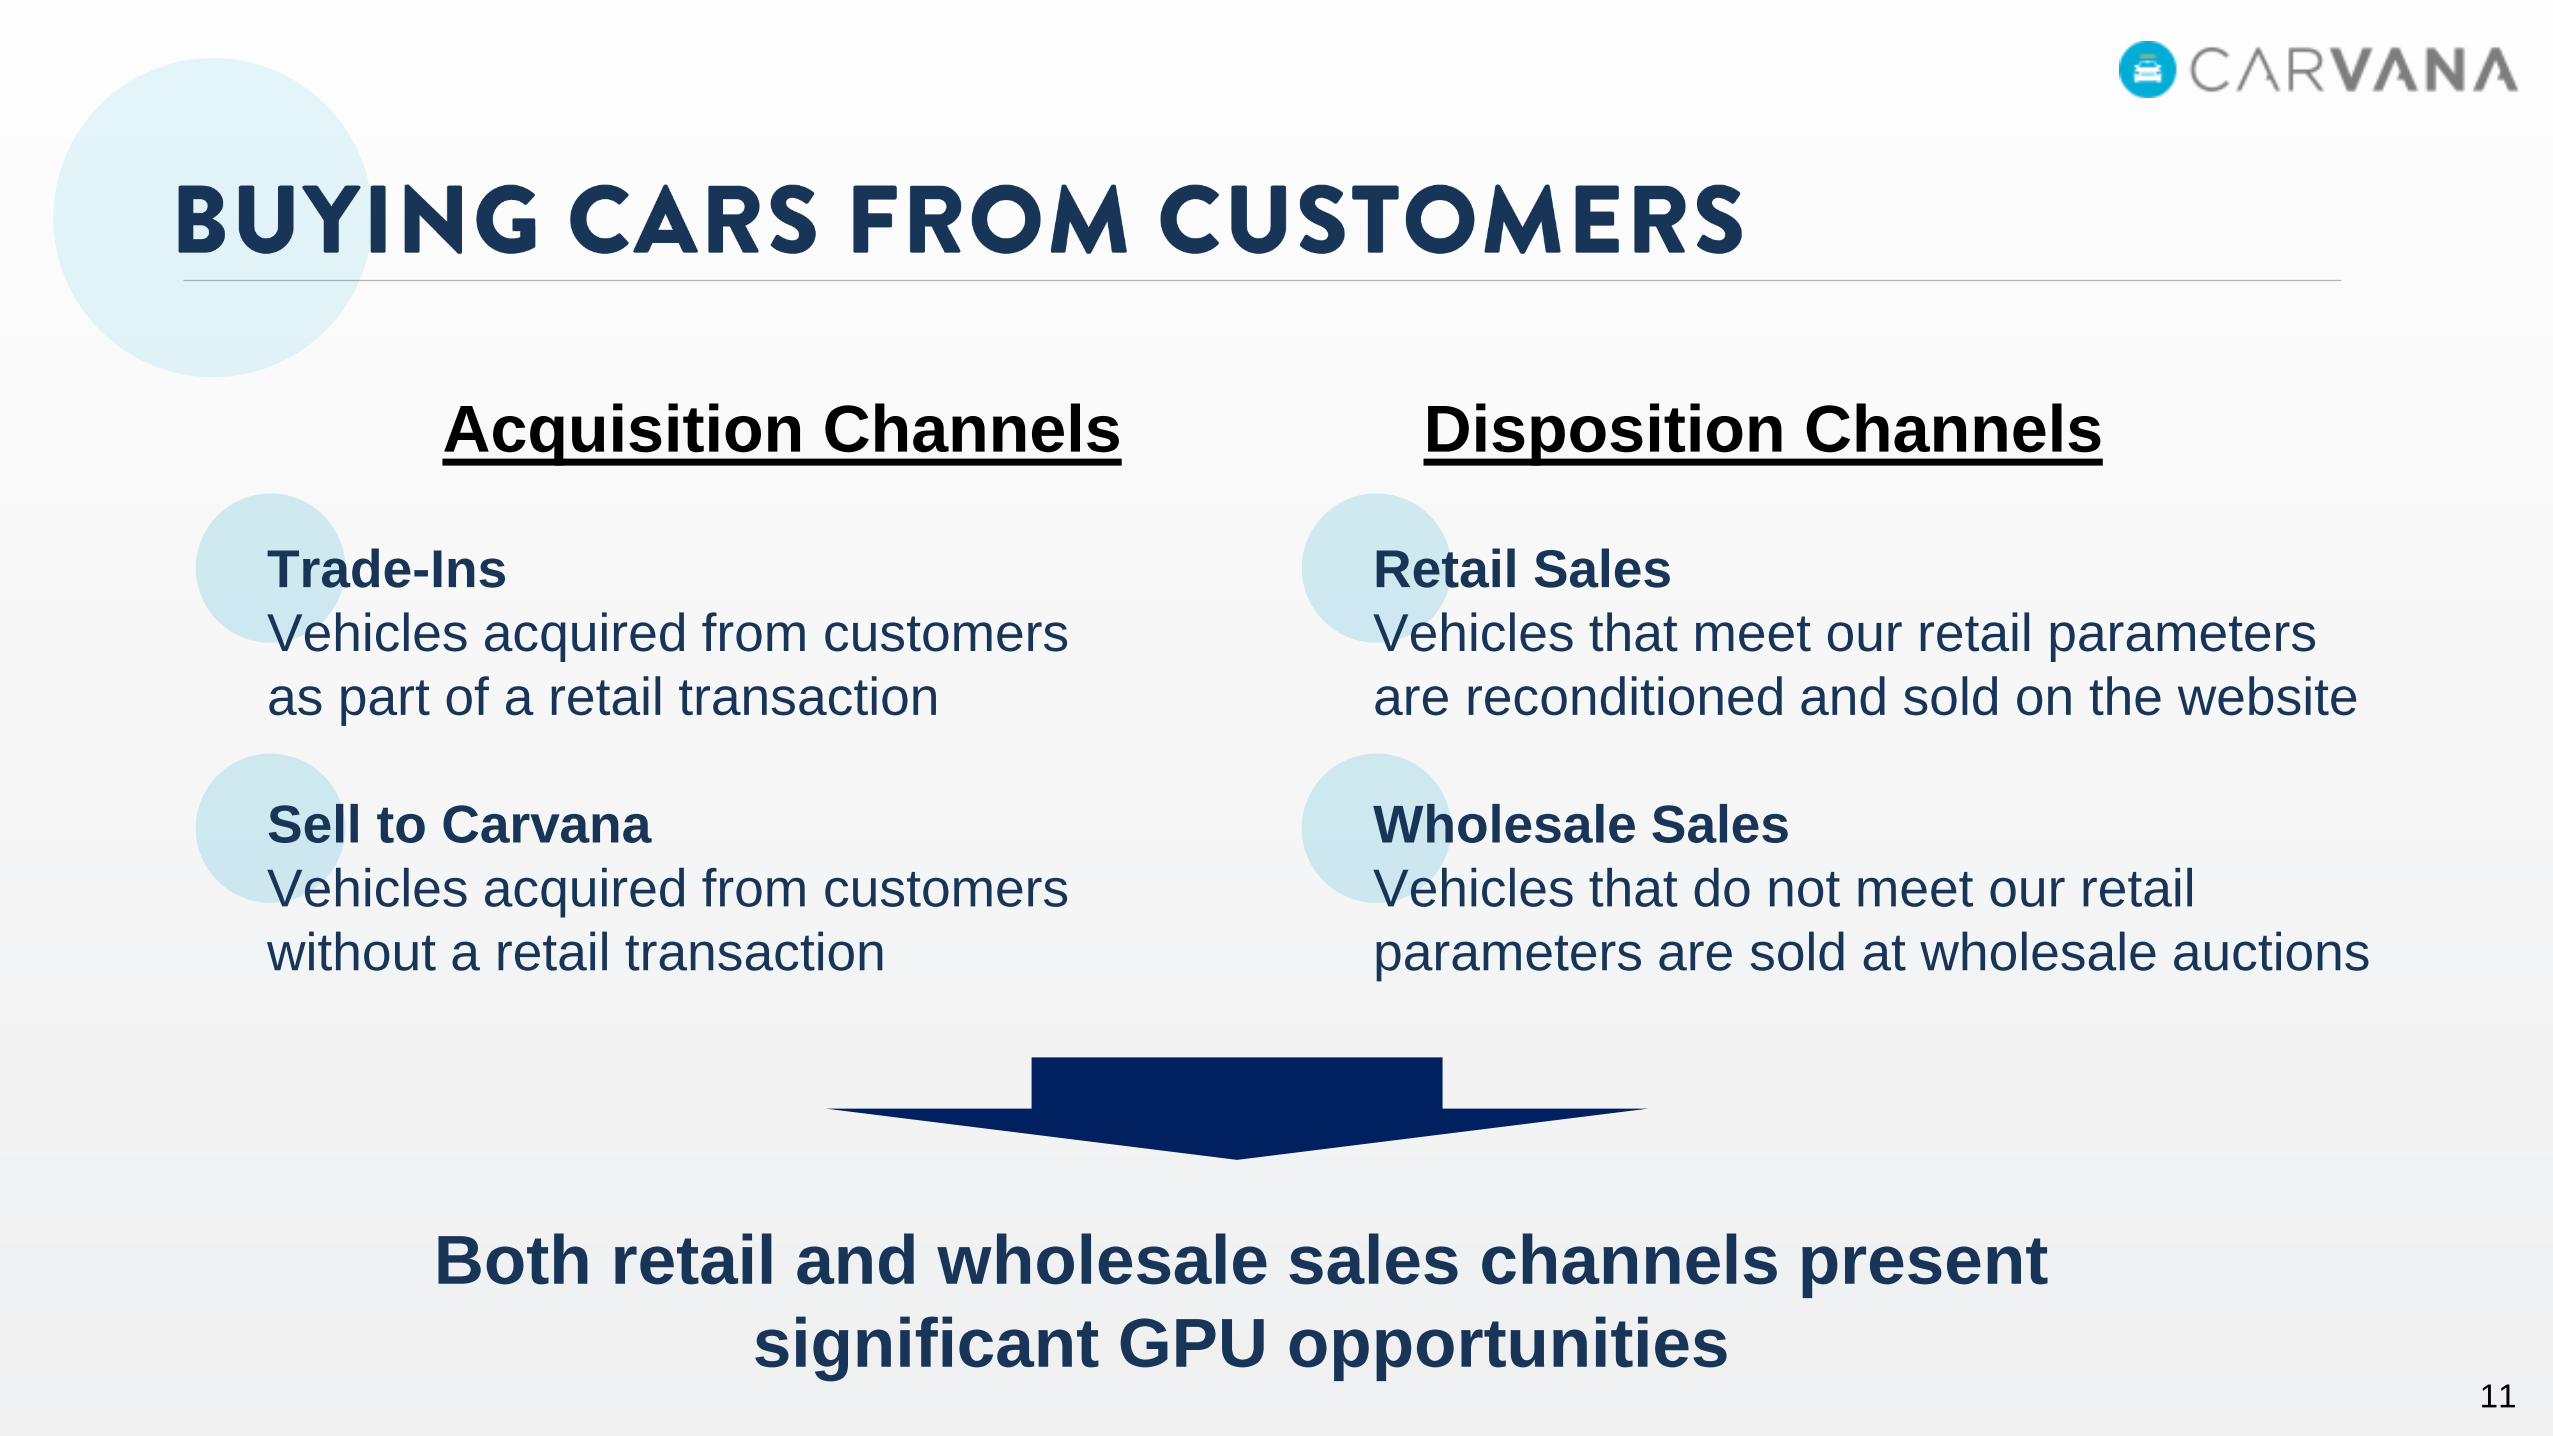
Trade-Ins
Vehicles acquired from customers
as part of a retail transaction
Sell to Carvana
Vehicles acquired from customers
without a retail transaction
Retail Sales
Vehicles that meet our retail parameters
are reconditioned and sold on the website
Wholesale Sales
Vehicles that do not meet our retail
parameters are sold at wholesale auctions
Acquisition Channels Disposition Channels
Both retail and wholesale sales channels present
significant GPU opportunities

12
Customer Vehicles Purchased vs. Retail Units (2)Total Vehicles Purchased From Customers (1)
232% YoY
Growth
13
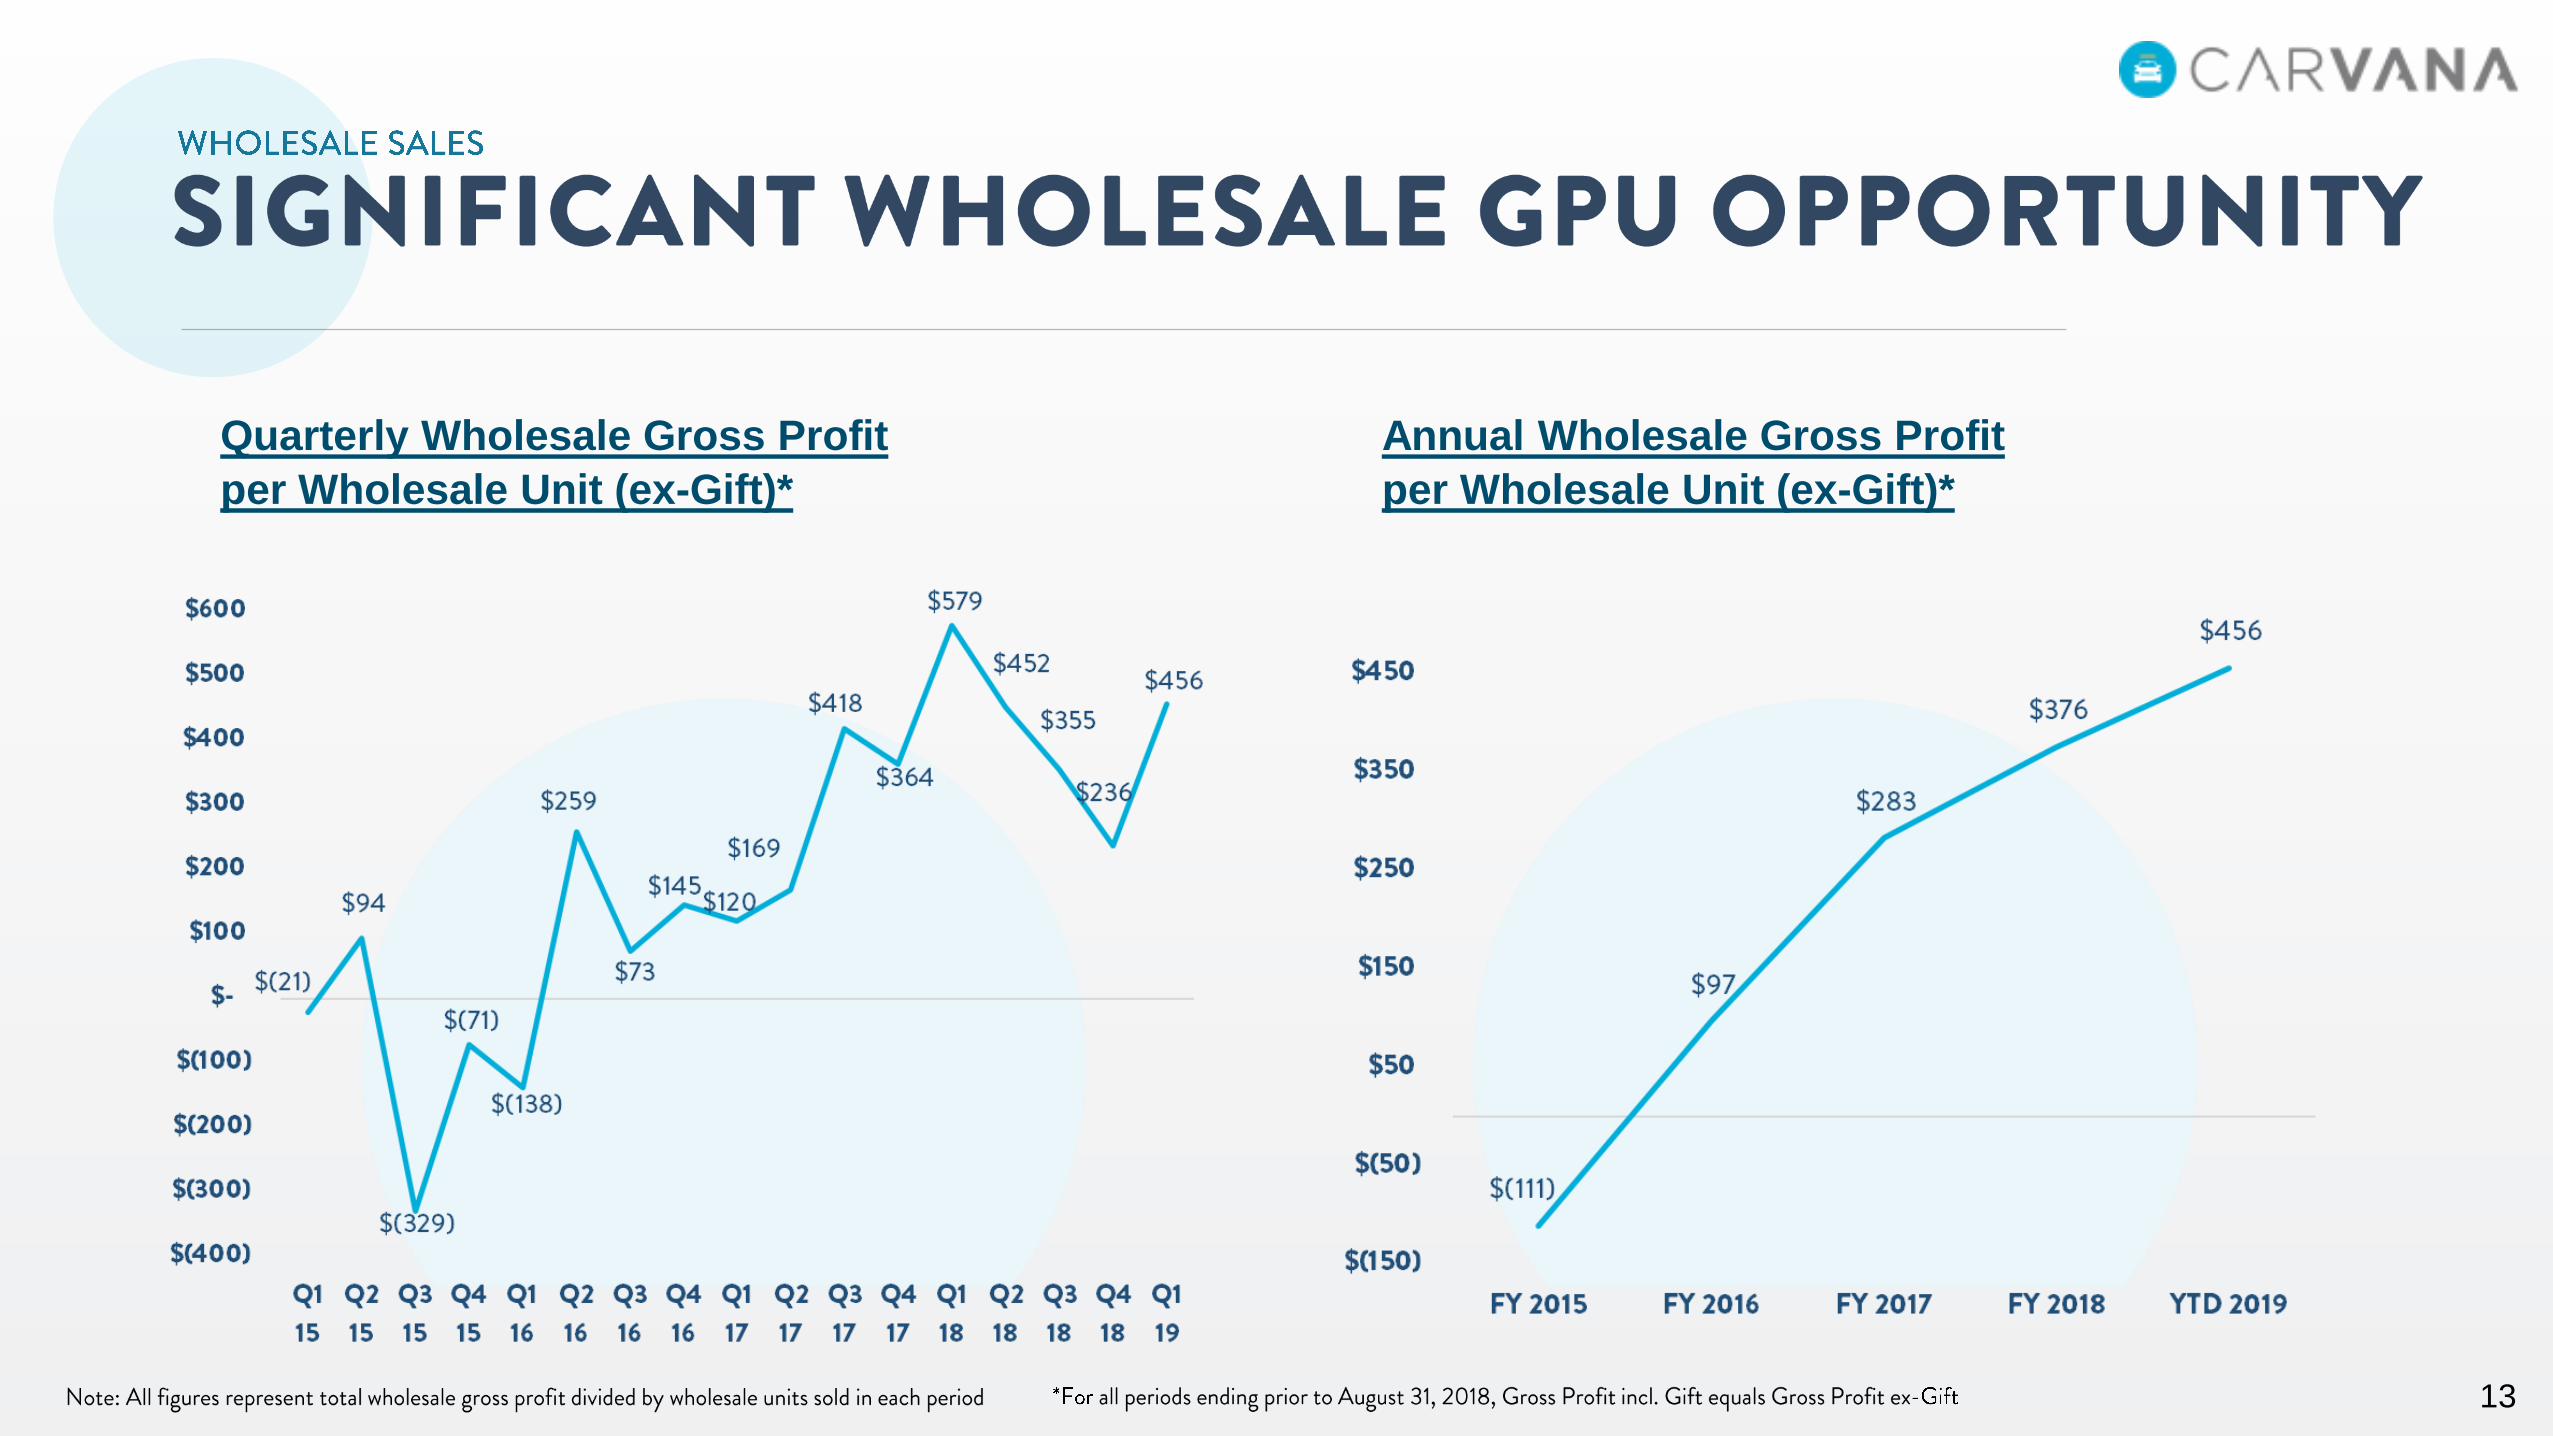
Annual Wholesale Gross Profit
per Wholesale Unit (ex-Gift)*
Quarterly Wholesale Gross Profit
per Wholesale Unit (ex-Gift)*
14
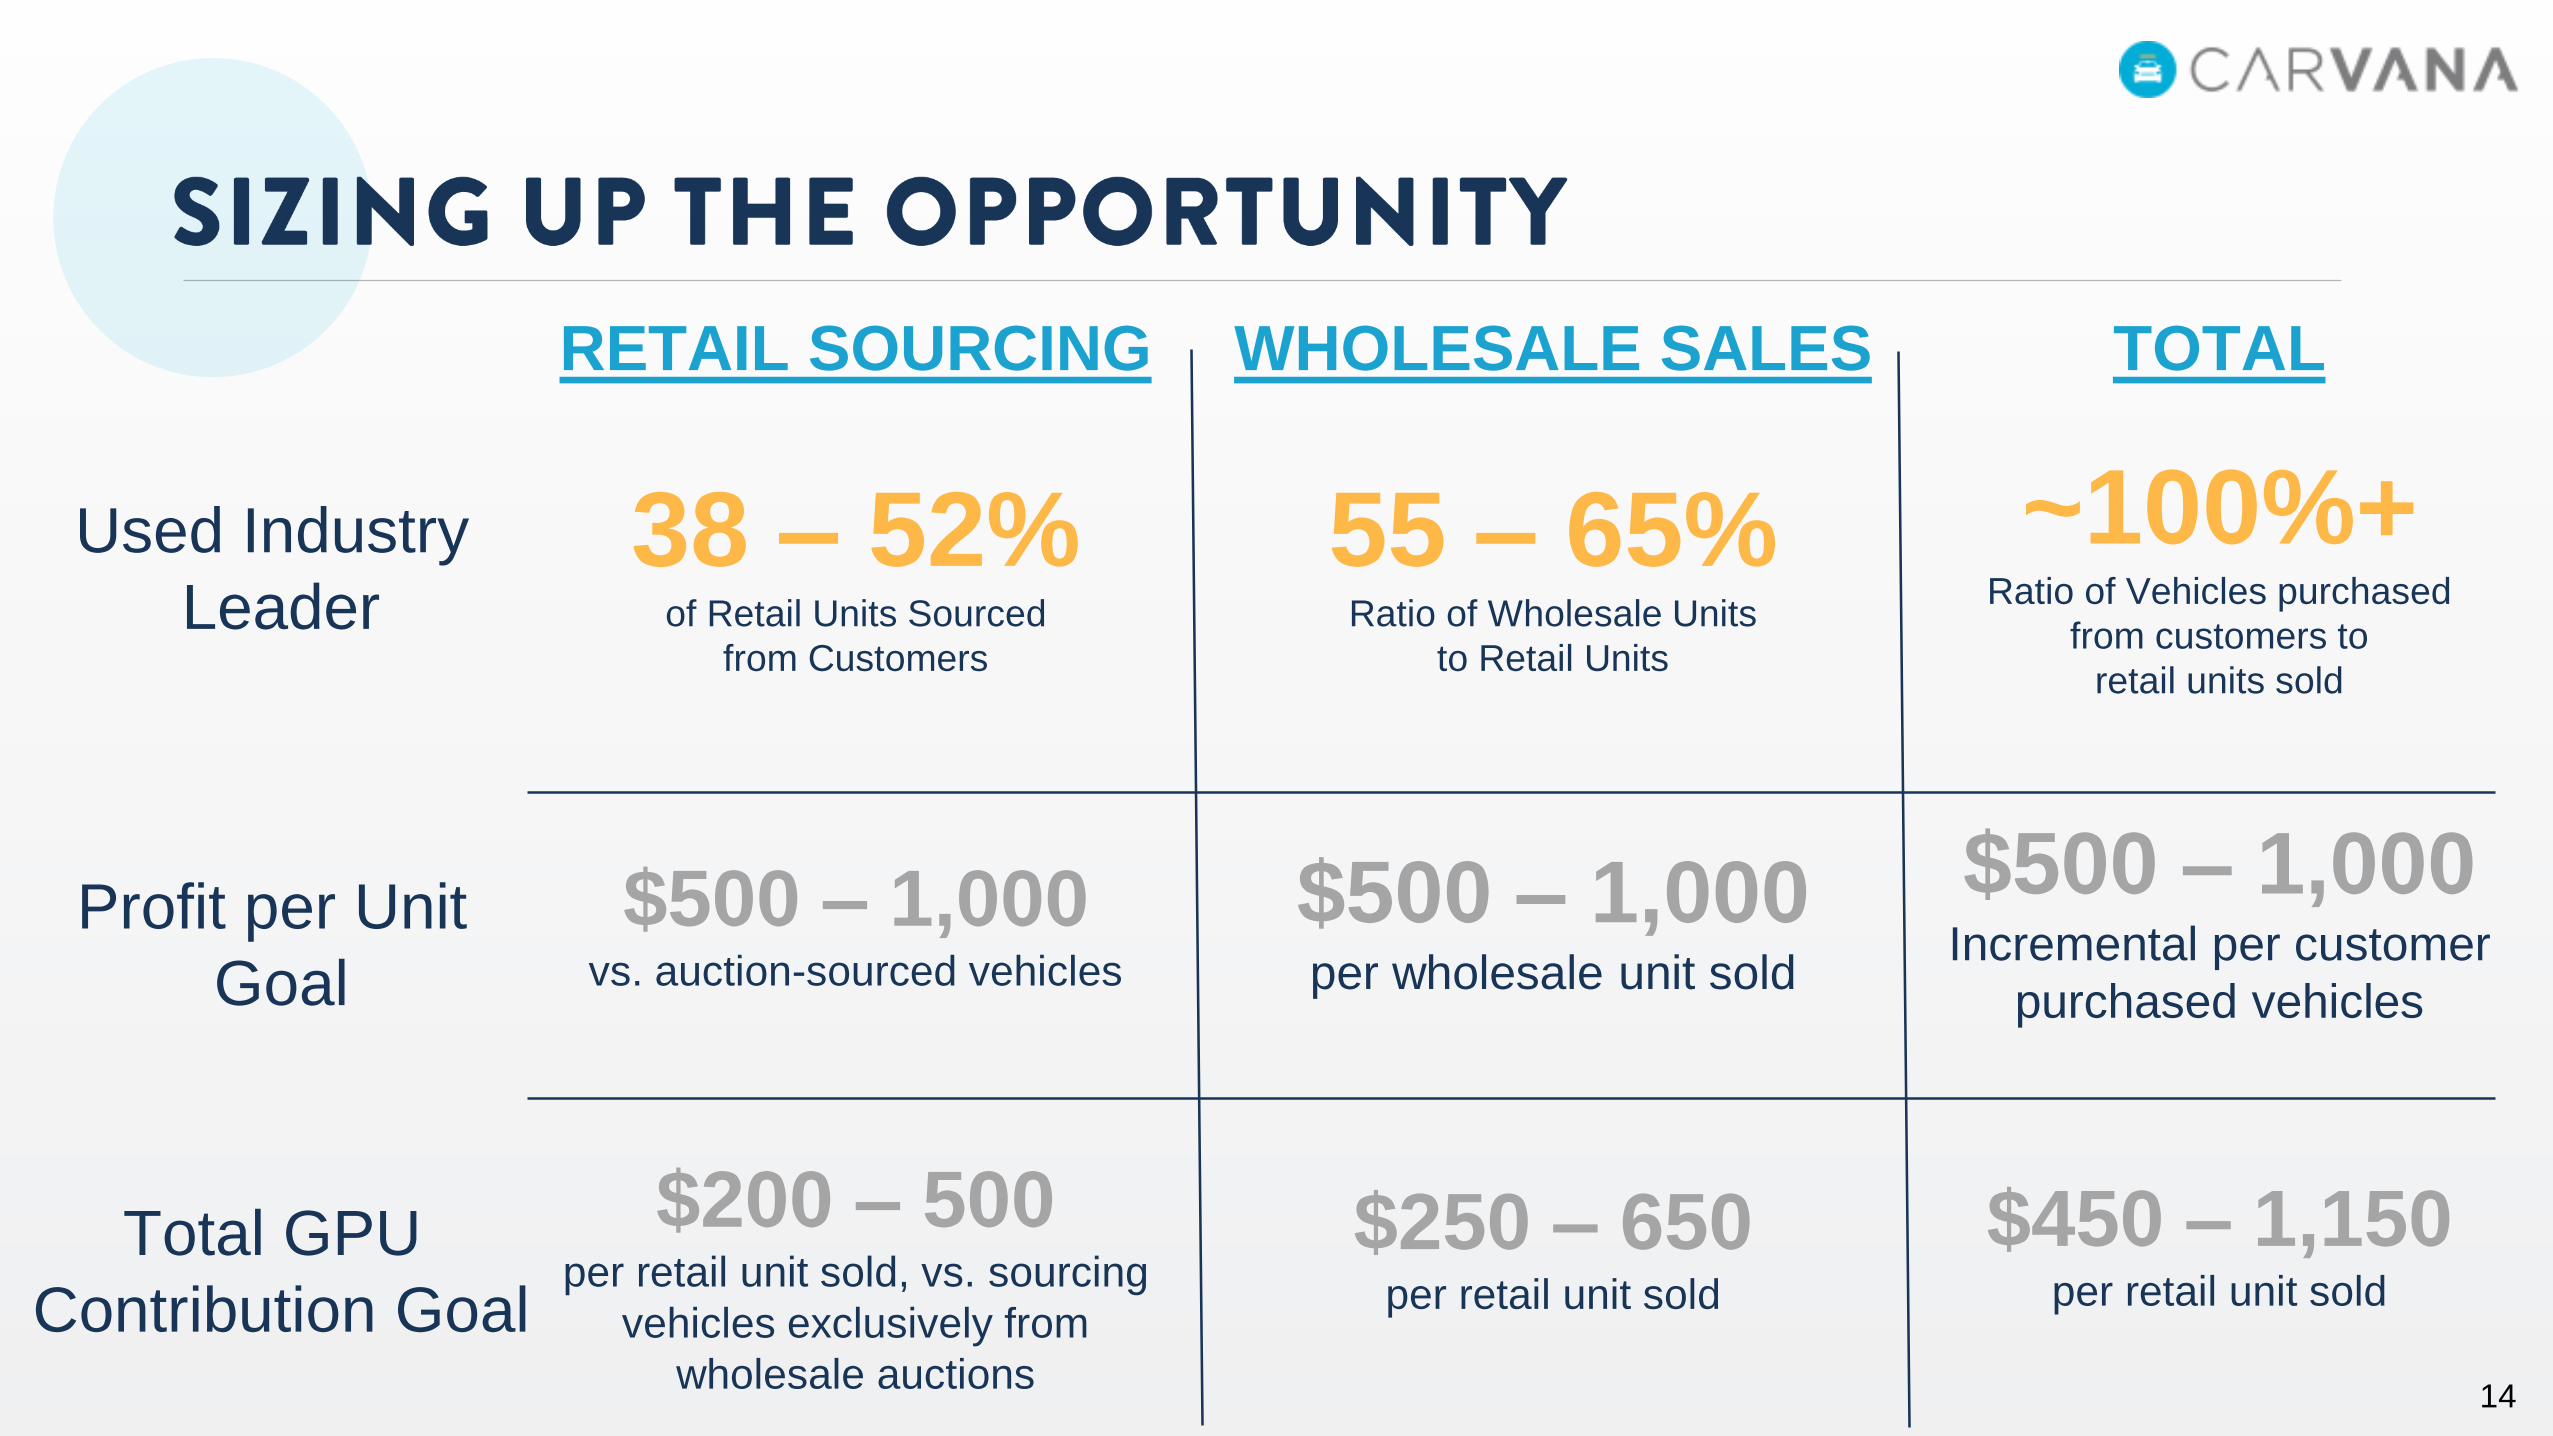
38 – 52% of Retail Units Sourced
from Customers
$500 – 1,000vs. auction-sourced vehicles
$200 – 500per retail unit sold, vs. sourcing
vehicles exclusively from
wholesale auctions
55 – 65% Ratio of Wholesale Units
to Retail Units
$500 – 1,000per wholesale unit sold
$250 – 650per retail unit sold
Profit per Unit
Goal
Total GPU
Contribution Goal
Used Industry
Leader
RETAIL SOURCING WHOLESALE SALES
~100%+ Ratio of Vehicles purchased
from customers to
retail units sold
$500 – 1,000Incremental per customer
purchased vehicles
$450 – 1,150per retail unit sold
TOTAL
15
Customer inputs license plate or VIN and answers a few questions
Our vehicle data and valuation technology enable strong profit per unit
We pick up the car using our last-mile delivery network
Our artificial intelligence algorithms determine offer for the customer in real-time
2 minutes
232%
$456
4.9 / 5.0
16
17
FY 2017 YTD 2018
Long Term Target
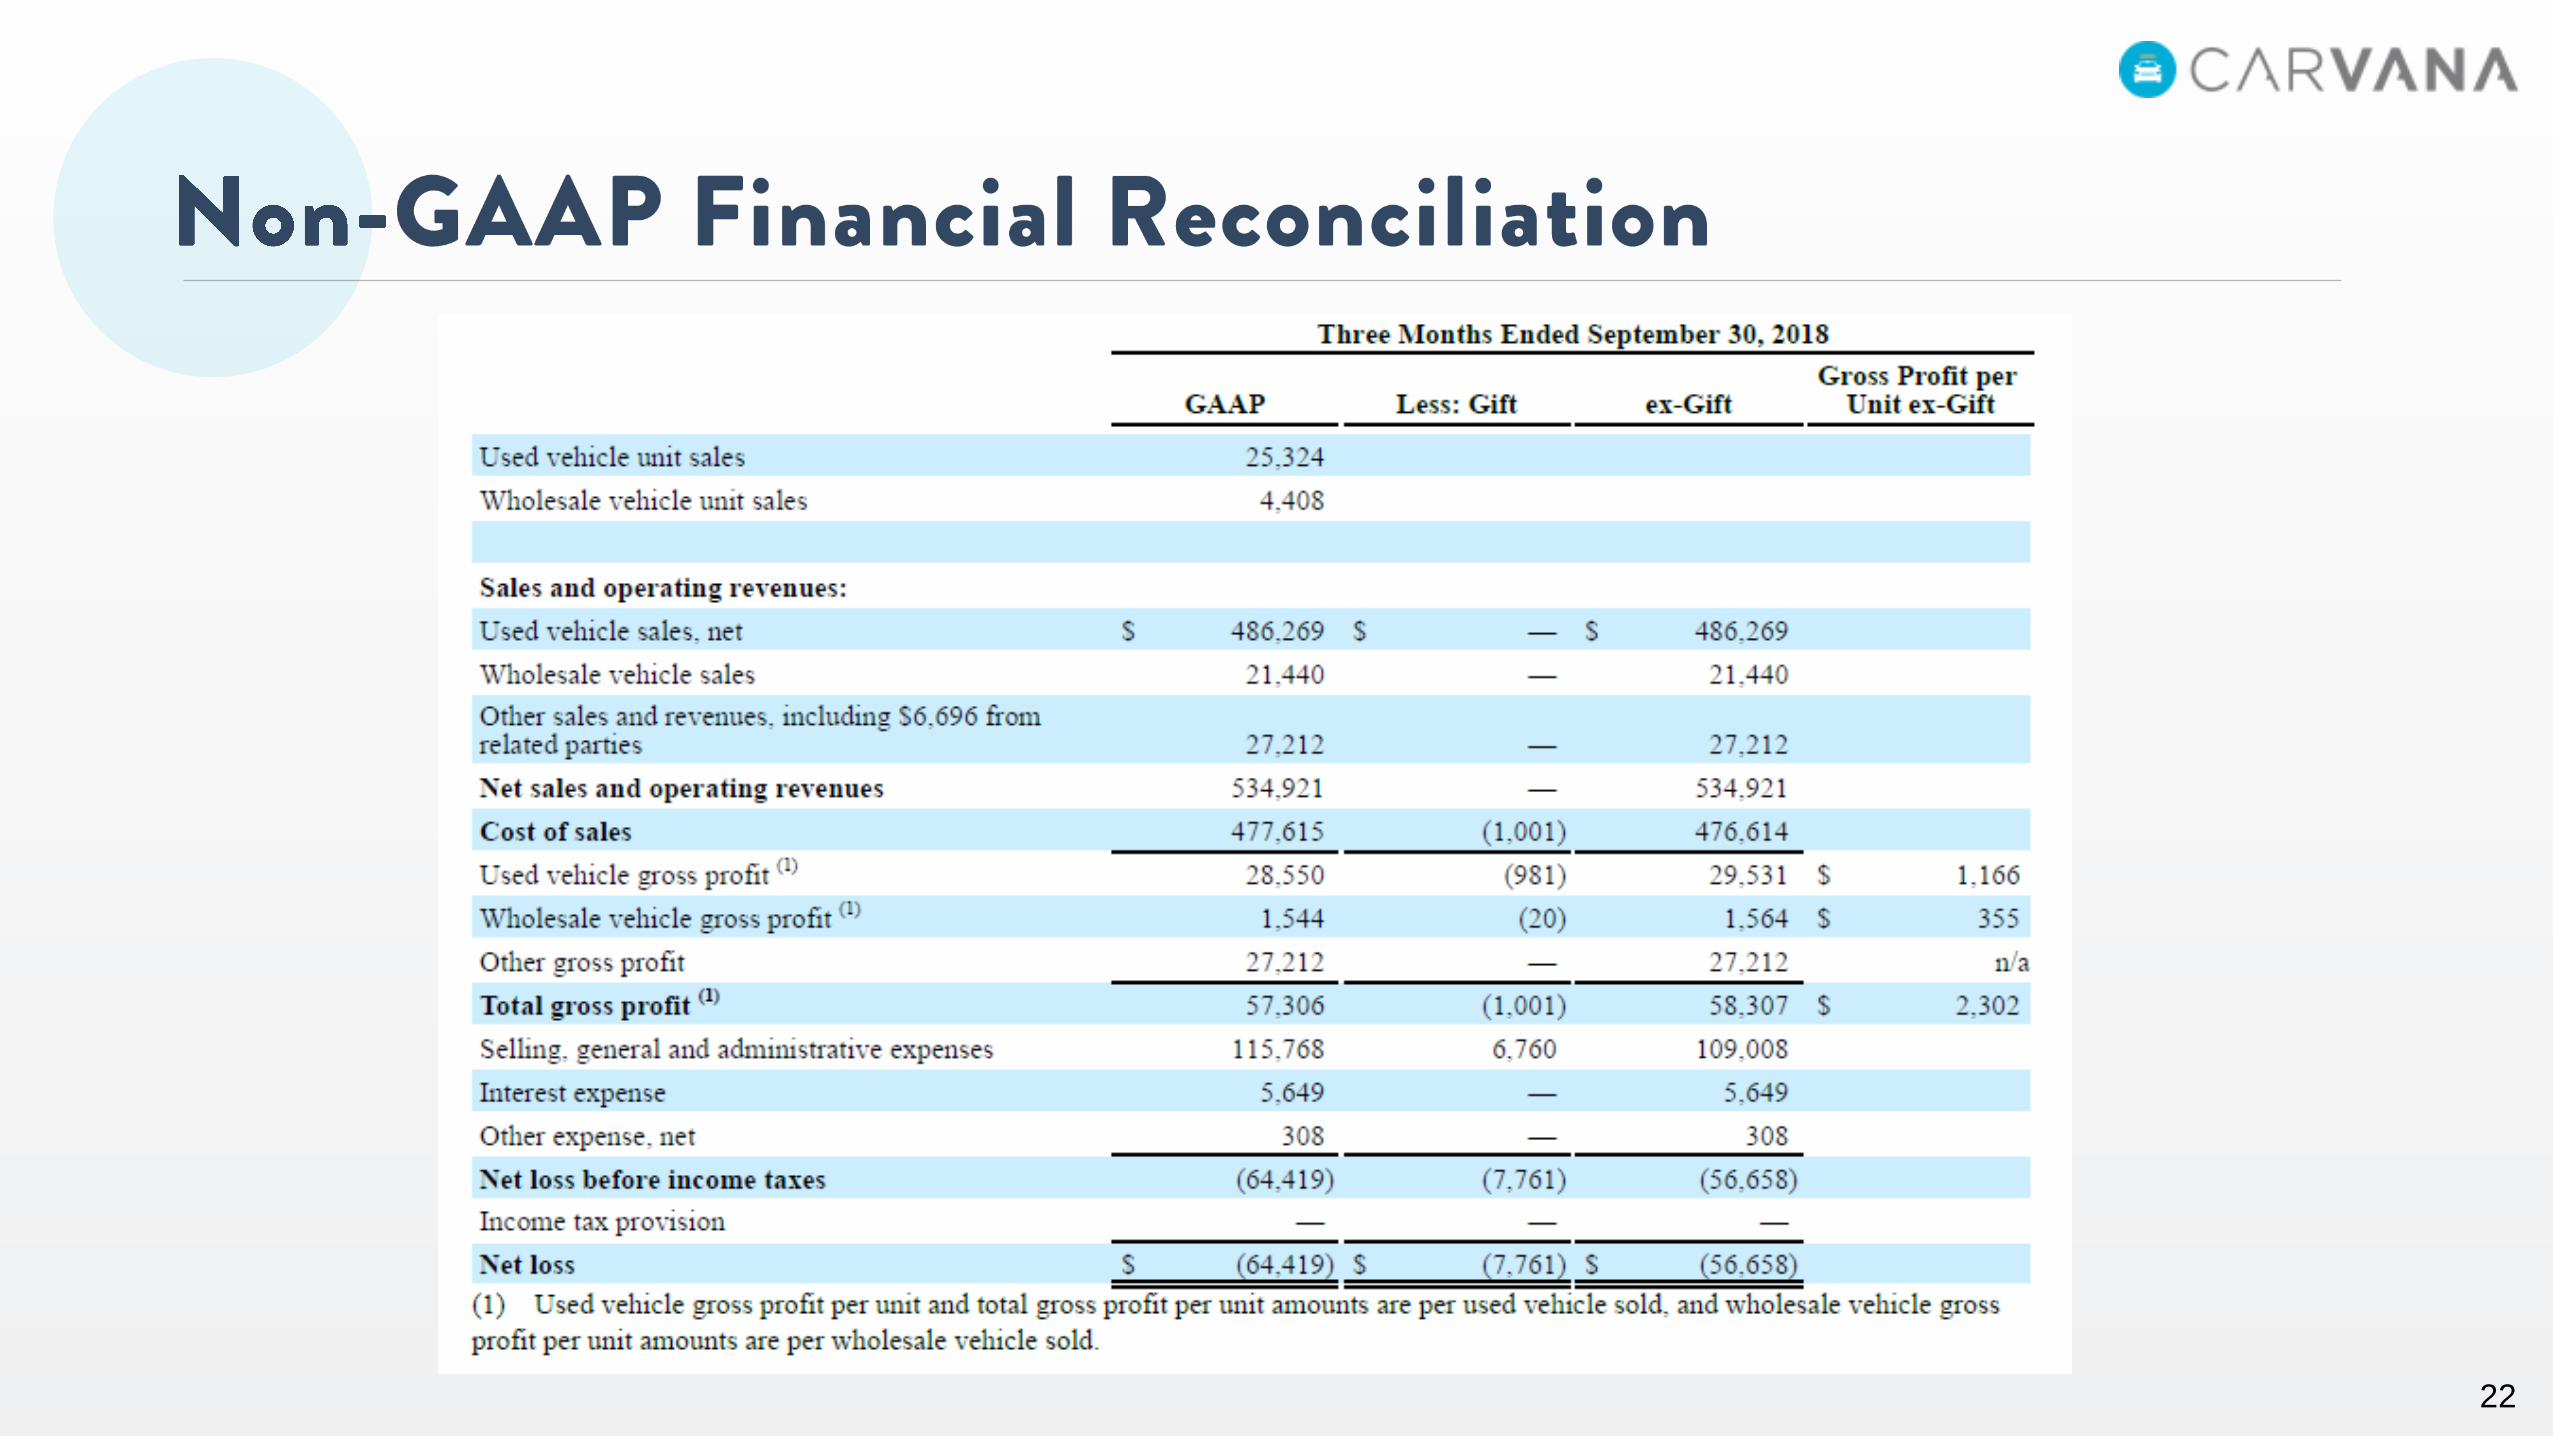
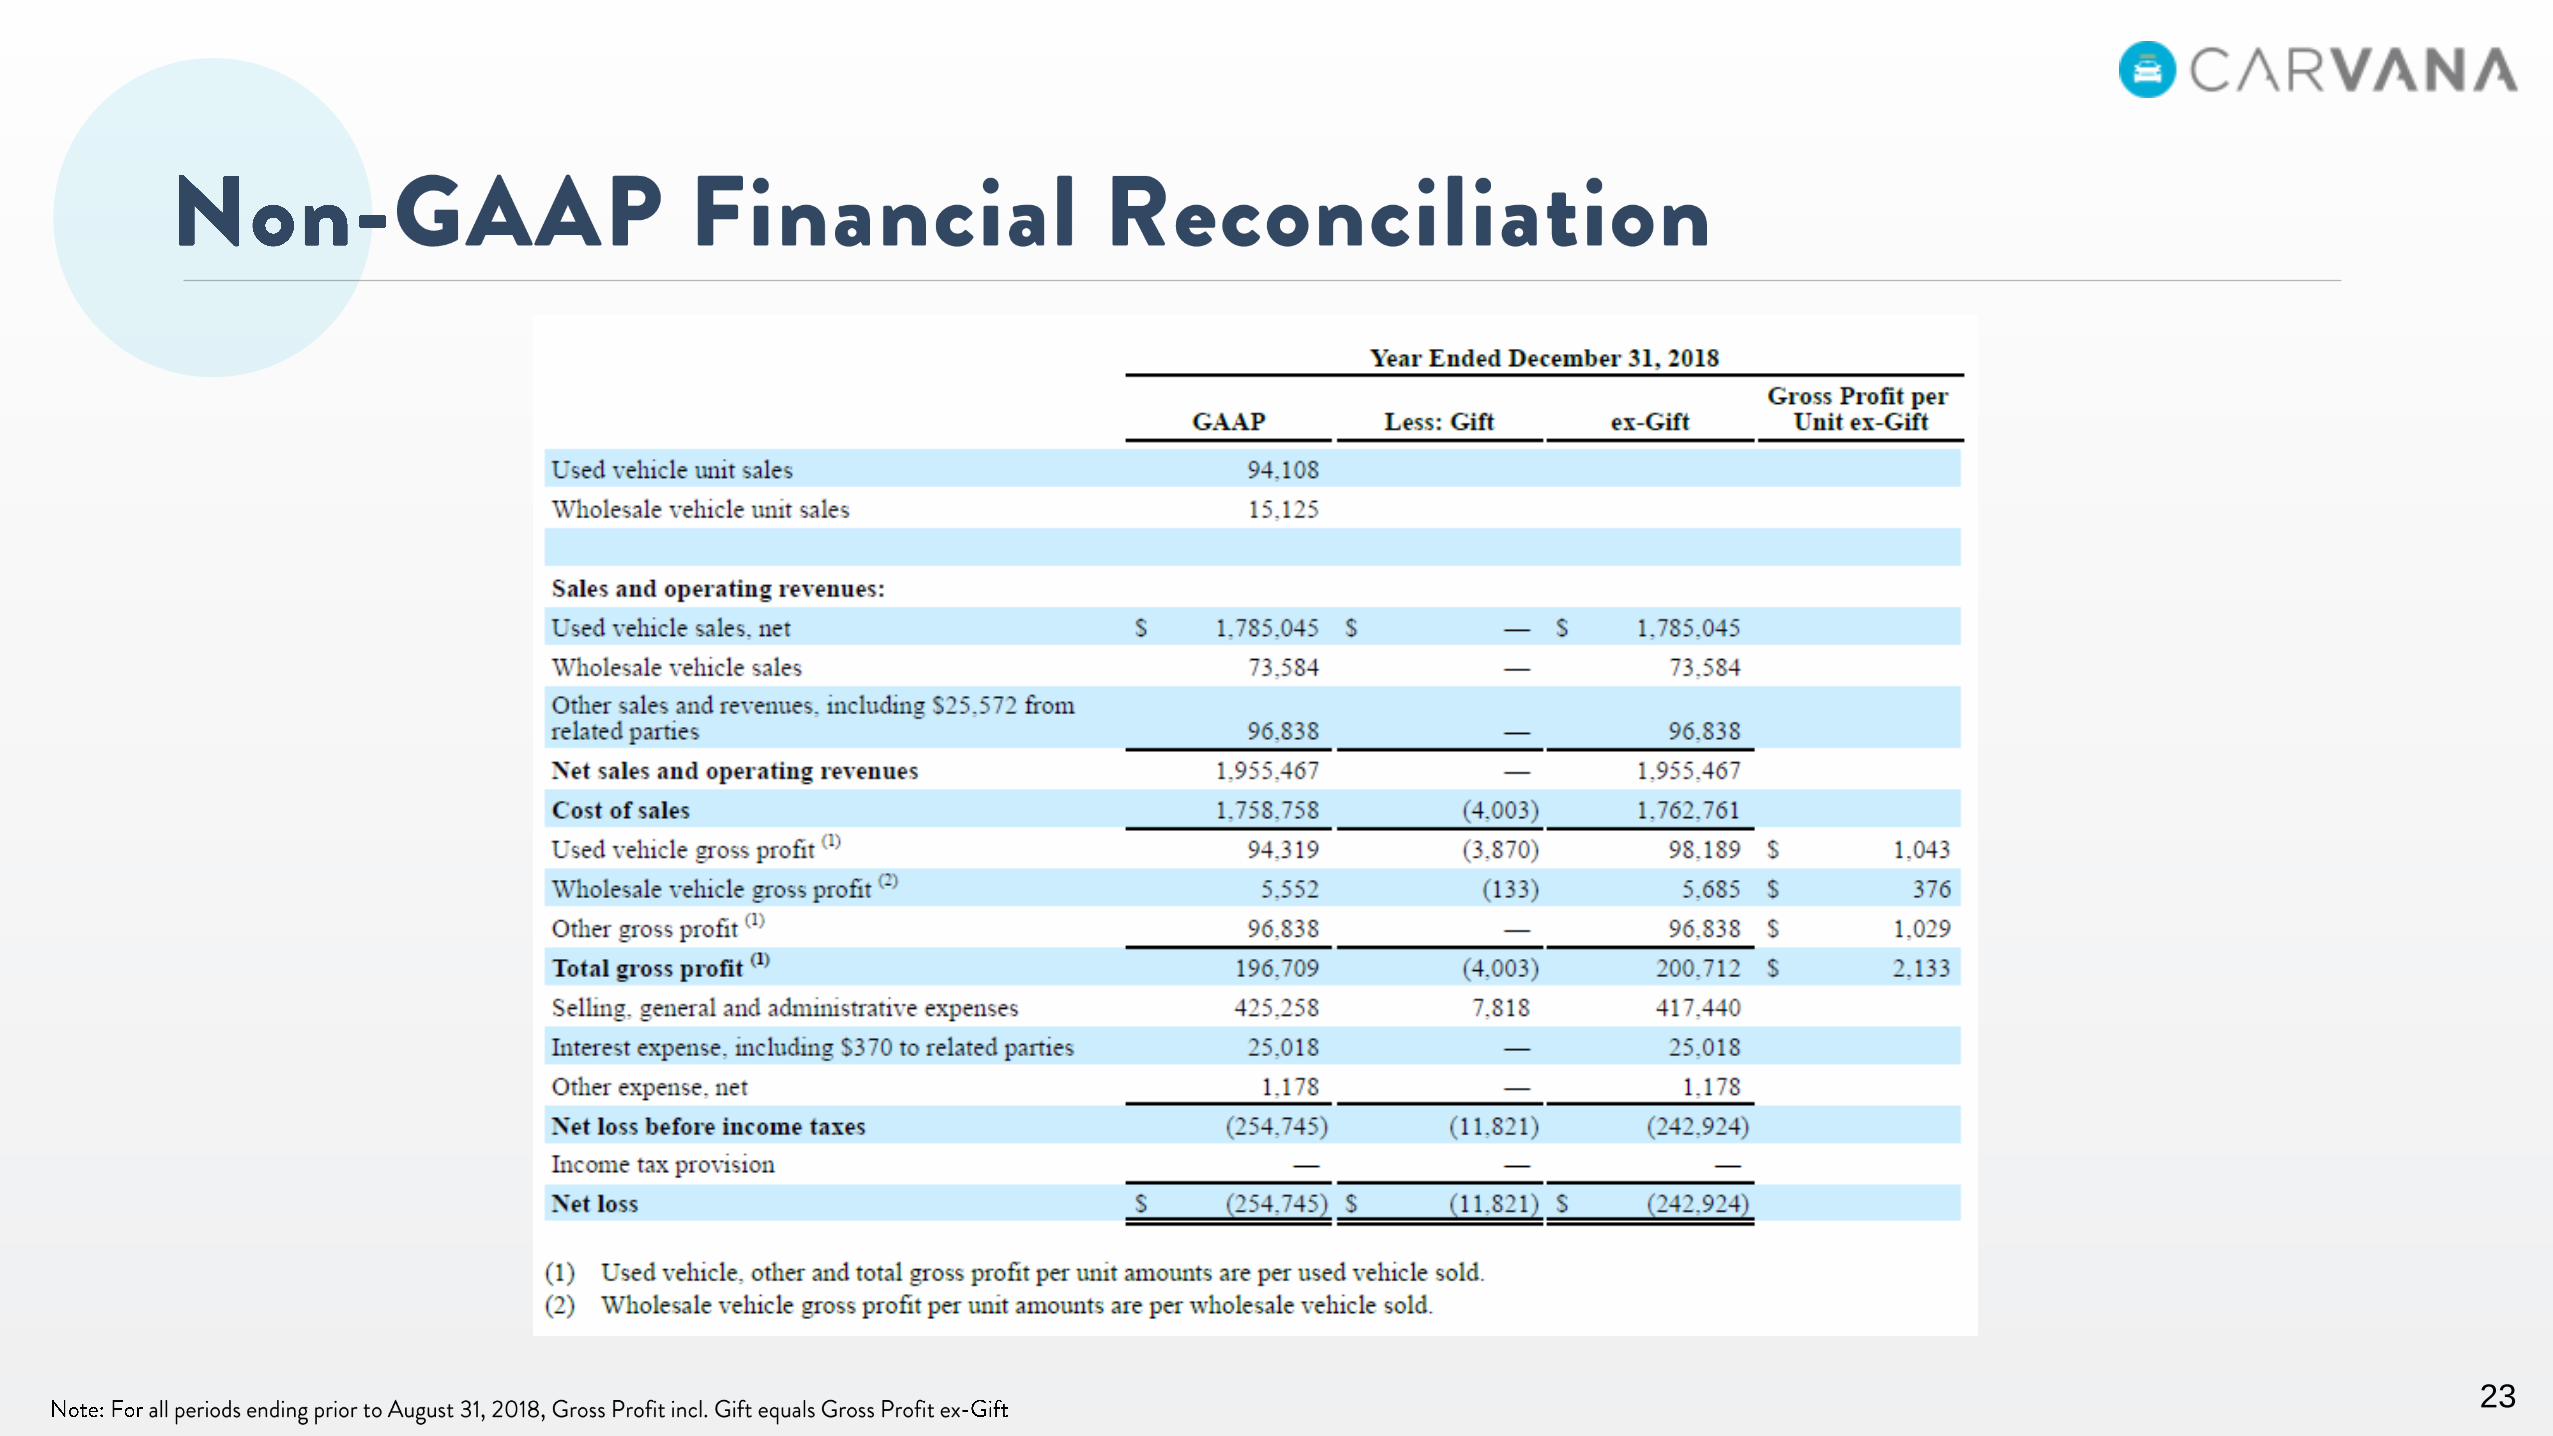
100K Milestone Gift
Gross Profit ex-Gift and Gross Profit per Unit ex-Gift
18
FY 2017 YTD 2018
Long Term Target
EBITDA ex-Gift and EBITDA Margin ex-Gift
19
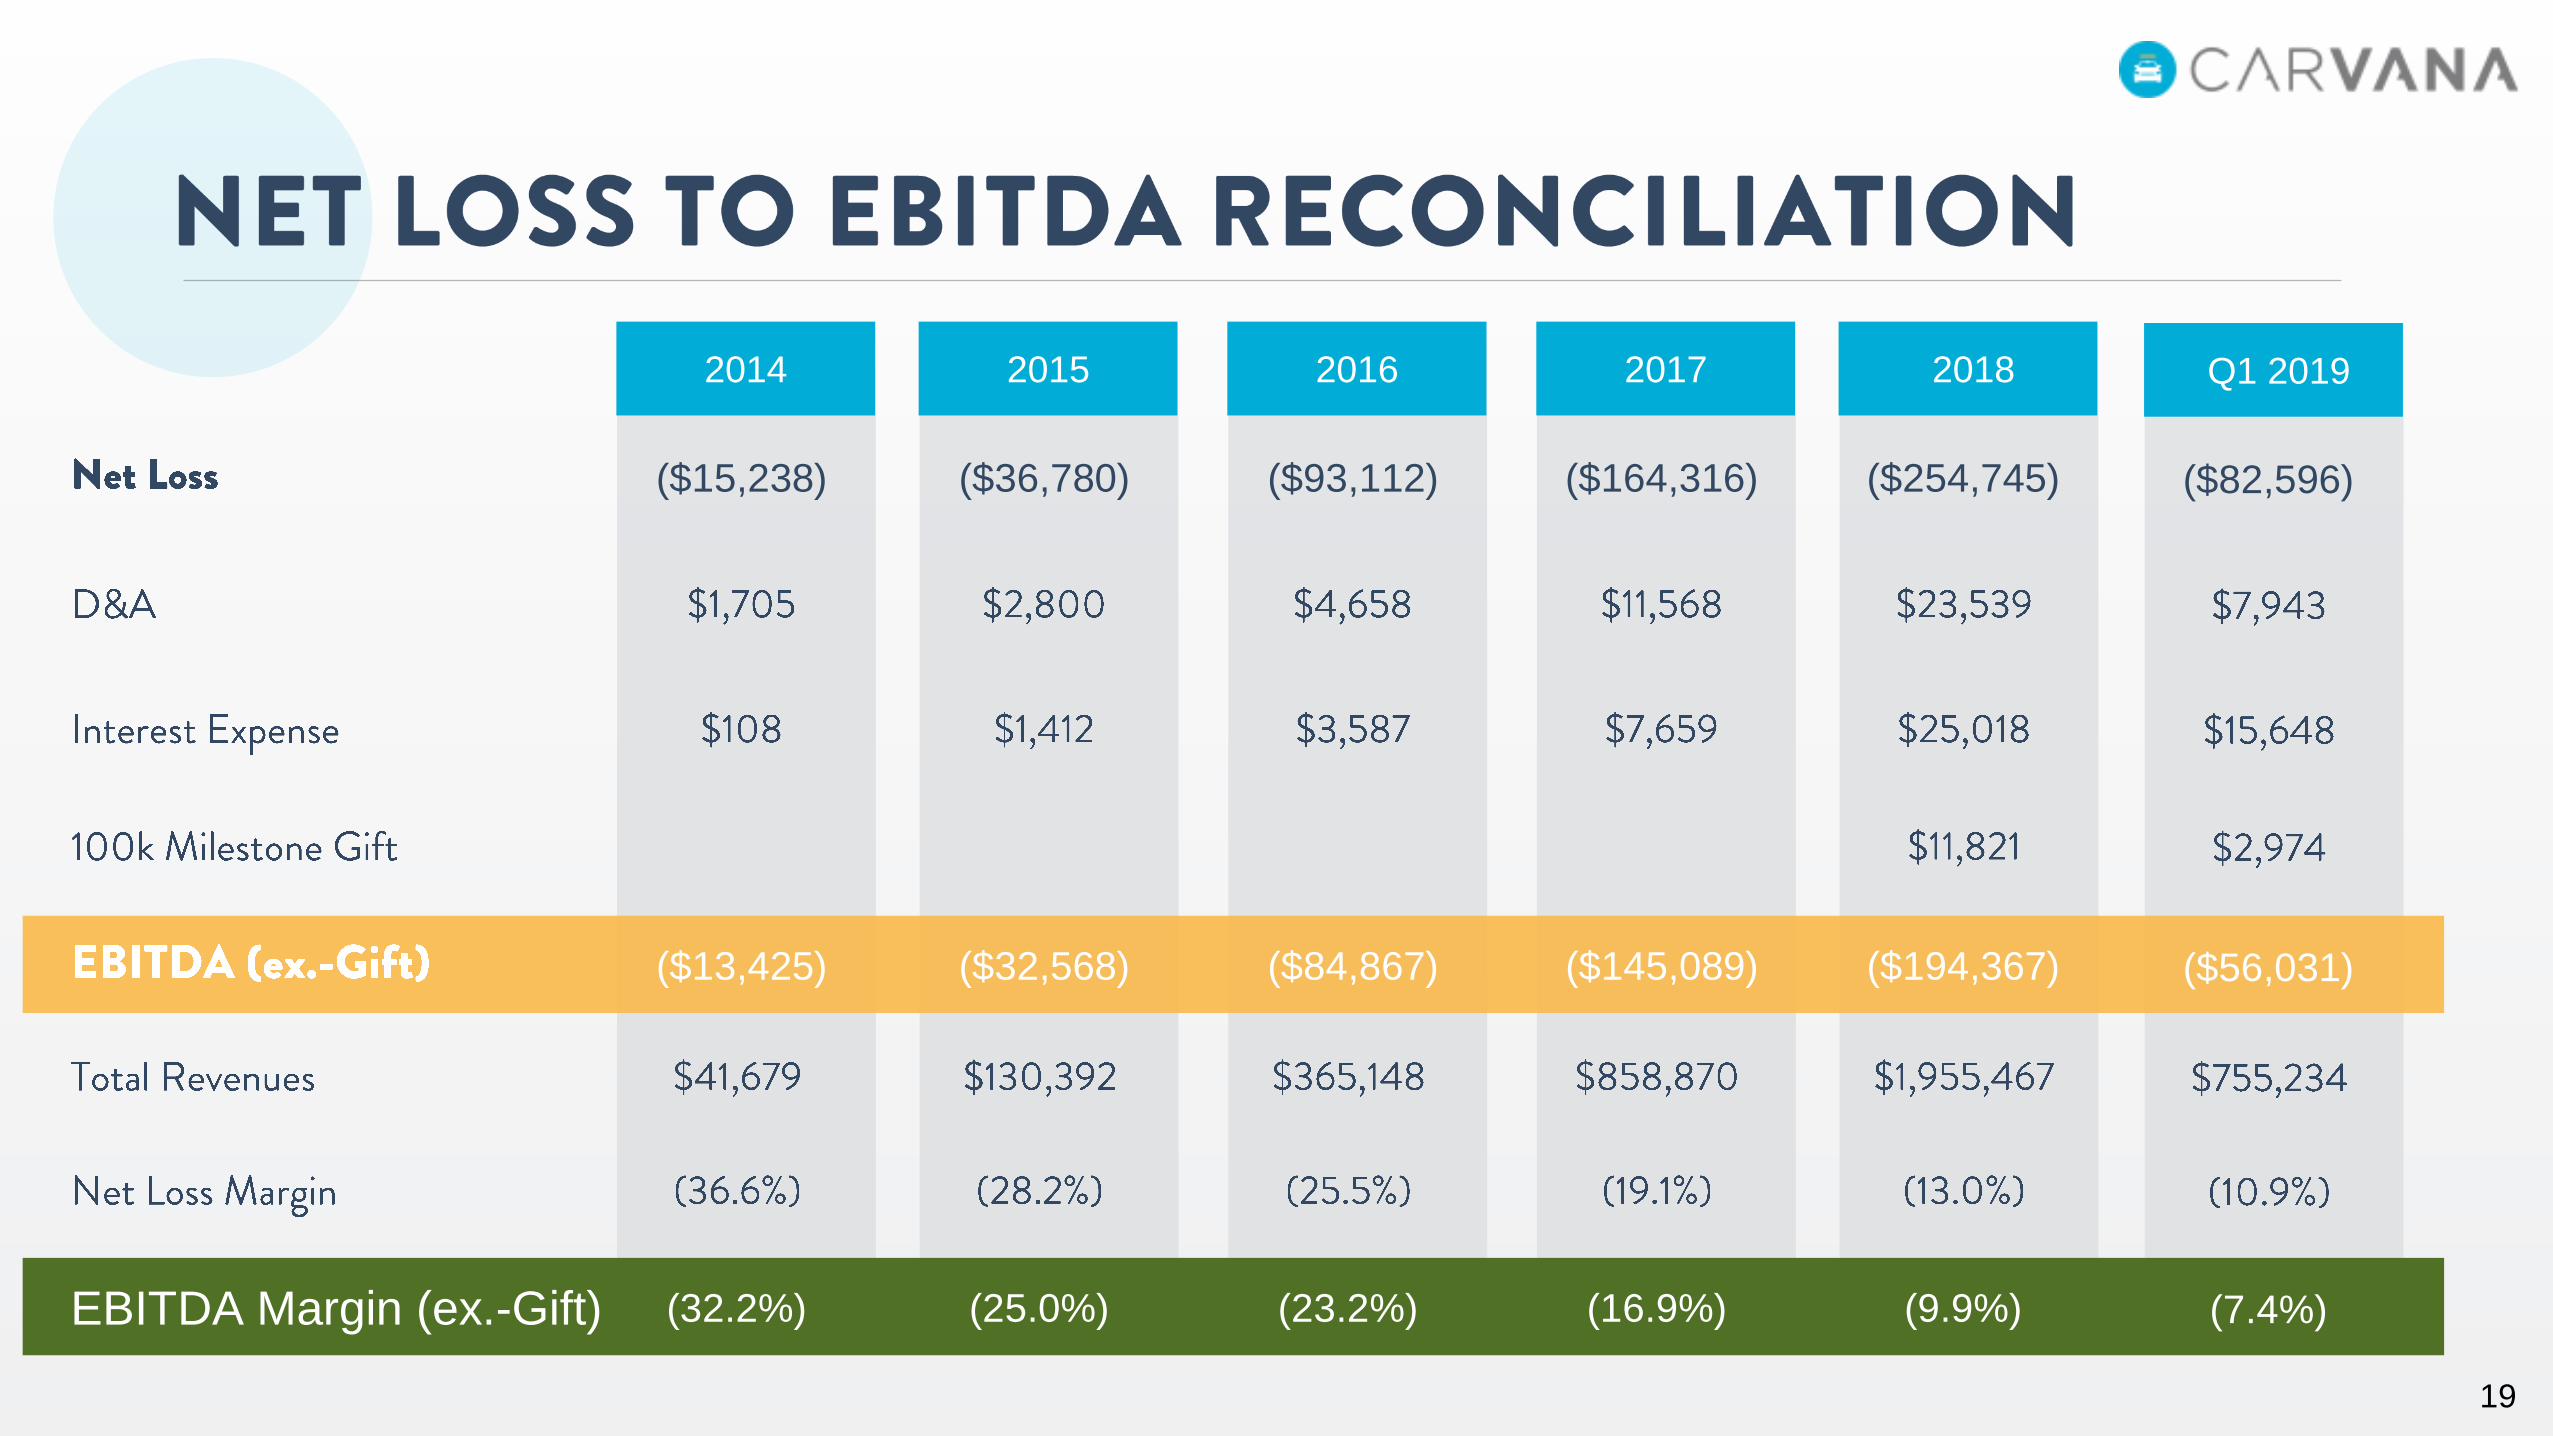
EBITDA Margin (ex.-Gift)
2015
($36,780)
($32,568)
(25.0%)
2016
($93,112)
($84,867)
(23.2%)
2017
($164,316)
($145,089)
(16.9%)
2018
($254,745)
($194,367)
(9.9%)
2014
($15,238)
($13,425)
(32.2%)
Q1 2019
($82,596)
($56,031)
(7.4%)
20
21
22
23