william blair & company 26th annual growth stock conference
TRANSCRIPT

1
Best Buy Co., Inc.
William Blair Growth Stock Conference
June 27, 2006

2
Ryan Robinson Senior Vice President –Treasury & Corporate Development
3
Safe Harbor
Cautionary Statement Pursuant to the Private Securities Litigation Reform Act of 1995
This presentation may contain forward-looking statements, which are subject to risk and uncertainty. A variety of factorscould cause our actual results to differ materially from the anticipated results expressed in such forward-looking statements, including, among other things, factors listed in our Current Report on Form 10-K filed with the SEC on 5/10/06. That 10-K describes additional factors that could cause actual results to differ materially from those contemplated by the forward-looking statements made in this presentation.

4
• 30-percent earnings growth in fiscal 2006
• Revenue exceeded $30B, net earnings exceeded $1B
• Expanding into new markets-services, small businesses, international
$30.8$27.4
$24.5$20.9
$17.7
FY02 FY03 FY04 FY05 FY06
($ in billions)
15% Compounded growth
Revenue Growth
Strong History of Growth
$2.27
$1.75$1.44
$1.11$1.07
FY02 FY03 FY04 FY05 FY06
25%Compounded growthEPS1
1Pro-forma adjusted for FAS 123 expense
FY02 FY03 FY04 FY05 FY06
5
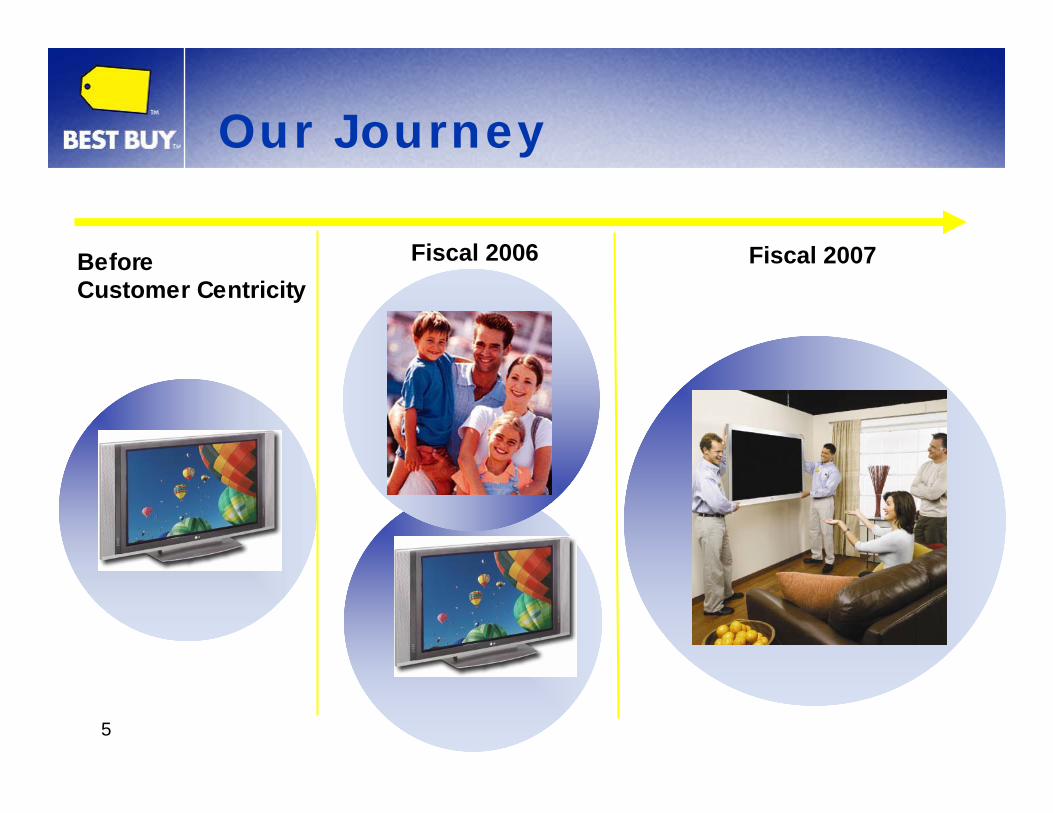
BeforeCustomer Centricity
Fiscal 2006 Fiscal 2007
Our Journey
6
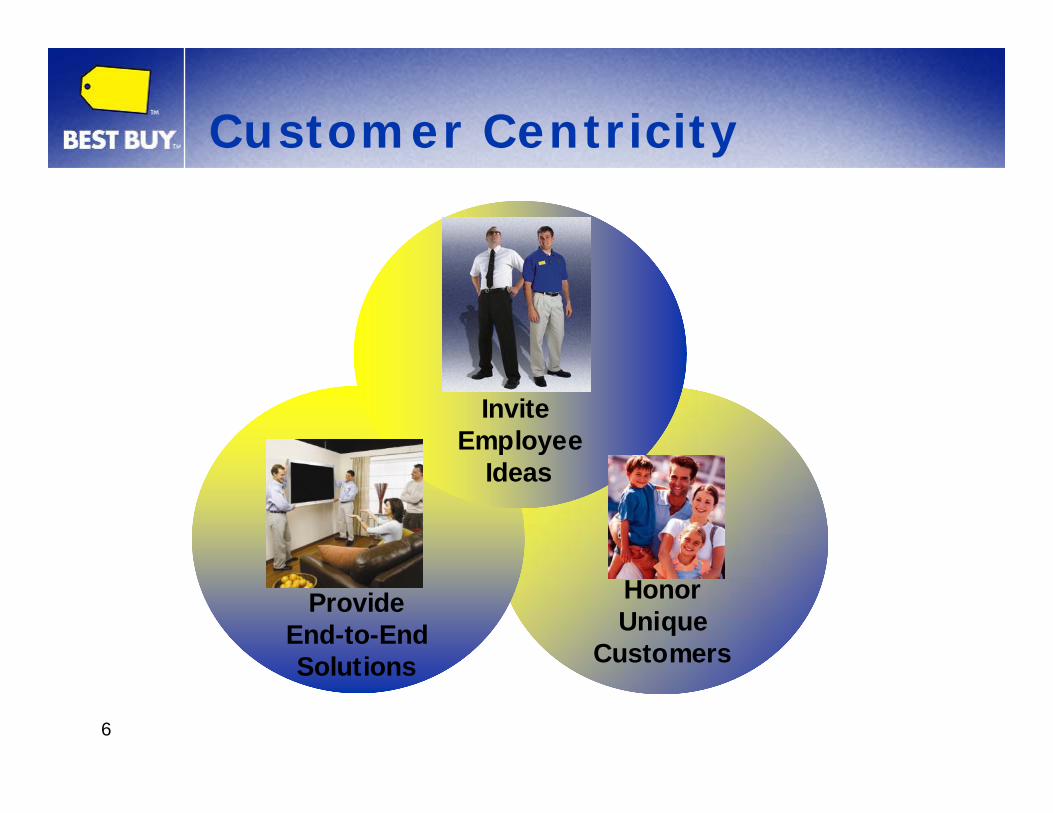
HonorUnique
Customers
ProvideEnd-to-EndSolutions
Invite Employee
Ideas
Customer Centricity
7
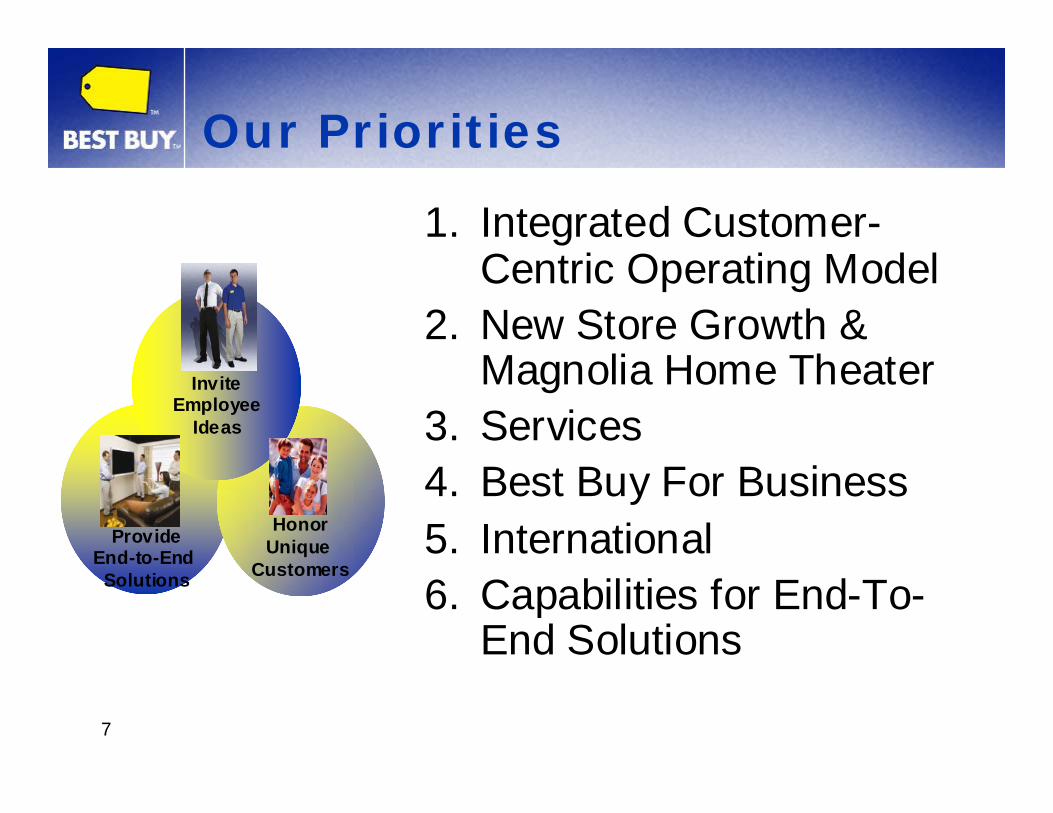
ProvideEnd-to-End
Solutions
HonorUnique
Customers
Our Priorities
1. Integrated Customer-Centric Operating Model
2. New Store Growth & Magnolia Home Theater
3. Services4. Best Buy For Business5. International6. Capabilities for End-To-
End Solutions
InviteEmployee
Ideas
8
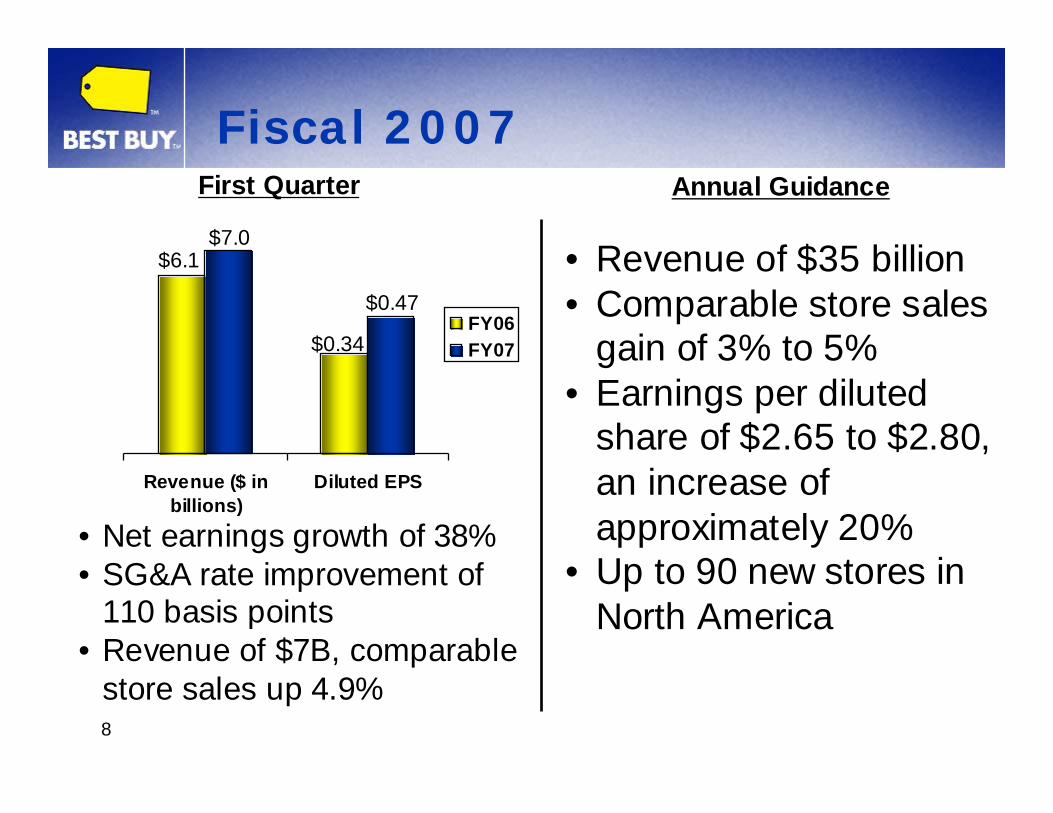
Fiscal 2007Annual Guidance
• Revenue of $35 billion• Comparable store sales
gain of 3% to 5%• Earnings per diluted
share of $2.65 to $2.80, an increase of approximately 20%
• Up to 90 new stores in North America
Revenue ($ inbillions)
Diluted EPS
FY06FY07
$6.1$7.0
$0.34
$0.47
First Quarter
• Net earnings growth of 38% • SG&A rate improvement of
110 basis points• Revenue of $7B, comparable
store sales up 4.9%
9
HonorUnique
Customers
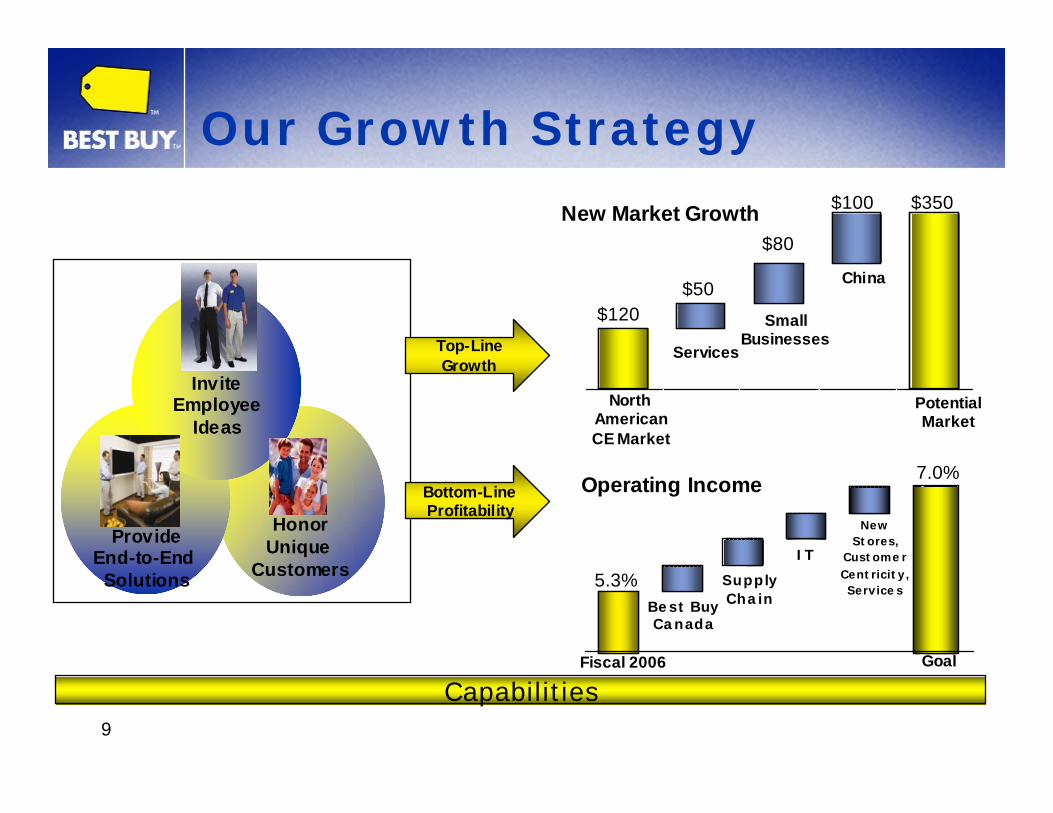
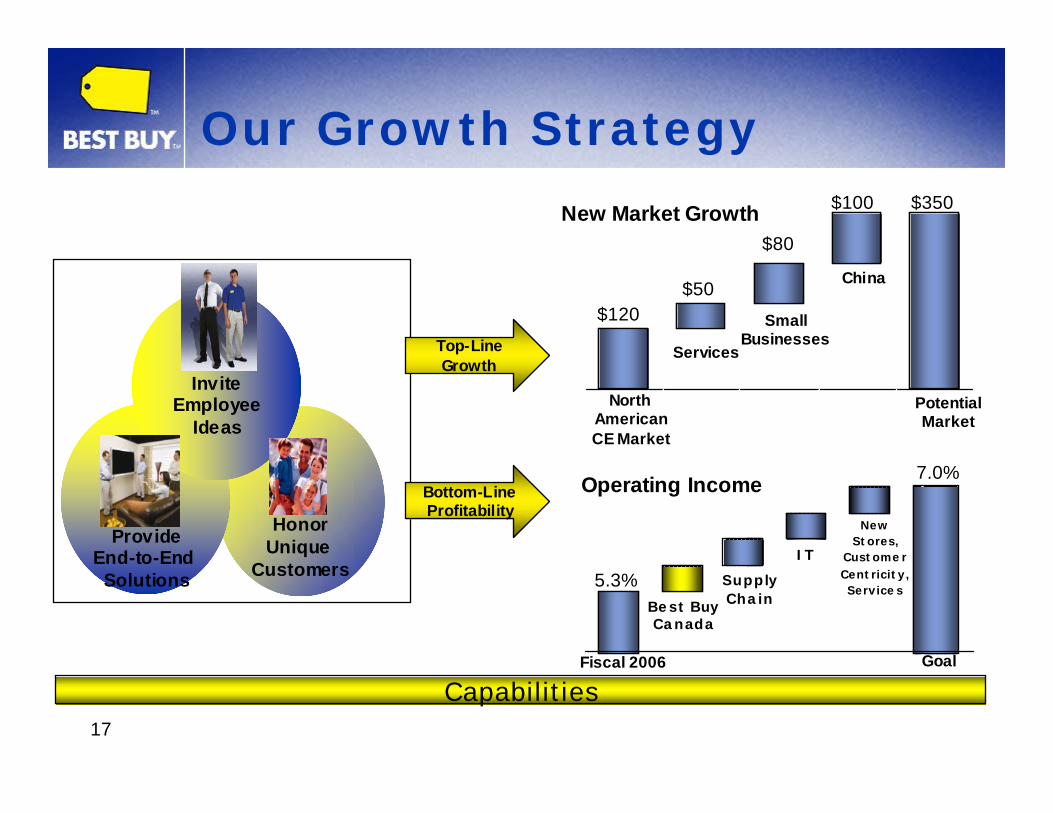
Our Growth Strategy
New Market Growth
Operating Income
NorthAmericanCE Market
$120$50
$80
$100 $350
Services
SmallBusinesses
China
PotentialMarket
Best Buy Canada
Supply Chain
IT
New Stores,
CustomerCentricity,Services
5.3%
7.0%
Fiscal 2006 Goal
Capabilities
Bottom-LineProfitability
Top-LineGrowth
ProvideEnd-to-End
Solutions
InviteEmployee
Ideas

10
Kevin LaydenPresident & Chief Operating OfficerBest Buy Canada
11
Number of Stores
104 108 114 118
1930
95
44
8
FY02 FY03 FY04 FY05 FY06
Future Shop Best Buy Canada
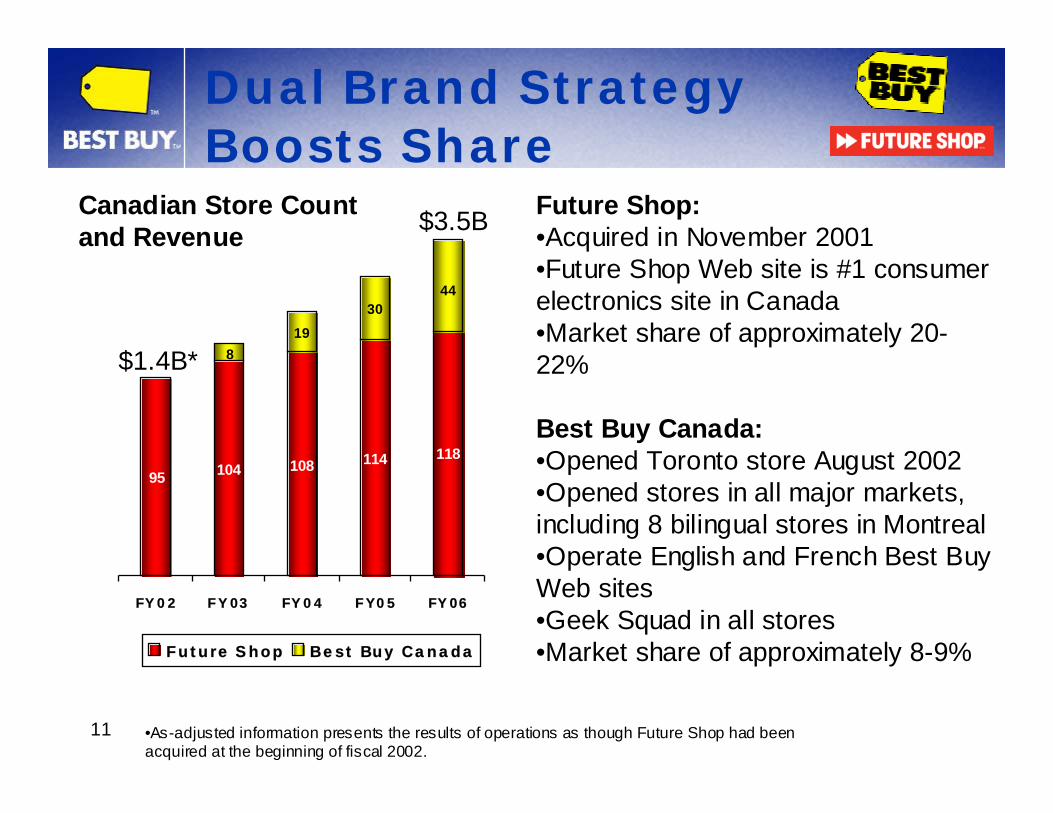
Future Shop:•Acquired in November 2001•Future Shop Web site is #1 consumer electronics site in Canada•Market share of approximately 20-22%
Best Buy Canada:•Opened Toronto store August 2002•Opened stores in all major markets, including 8 bilingual stores in Montreal•Operate English and French Best Buy Web sites•Geek Squad in all stores•Market share of approximately 8-9%
Canadian Store Count and Revenue
Dual Brand Strategy Boosts Share
$1.4B*
$3.5B
•As-adjusted information presents the results of operations as though Future Shop had been acquired at the beginning of fiscal 2002.
12
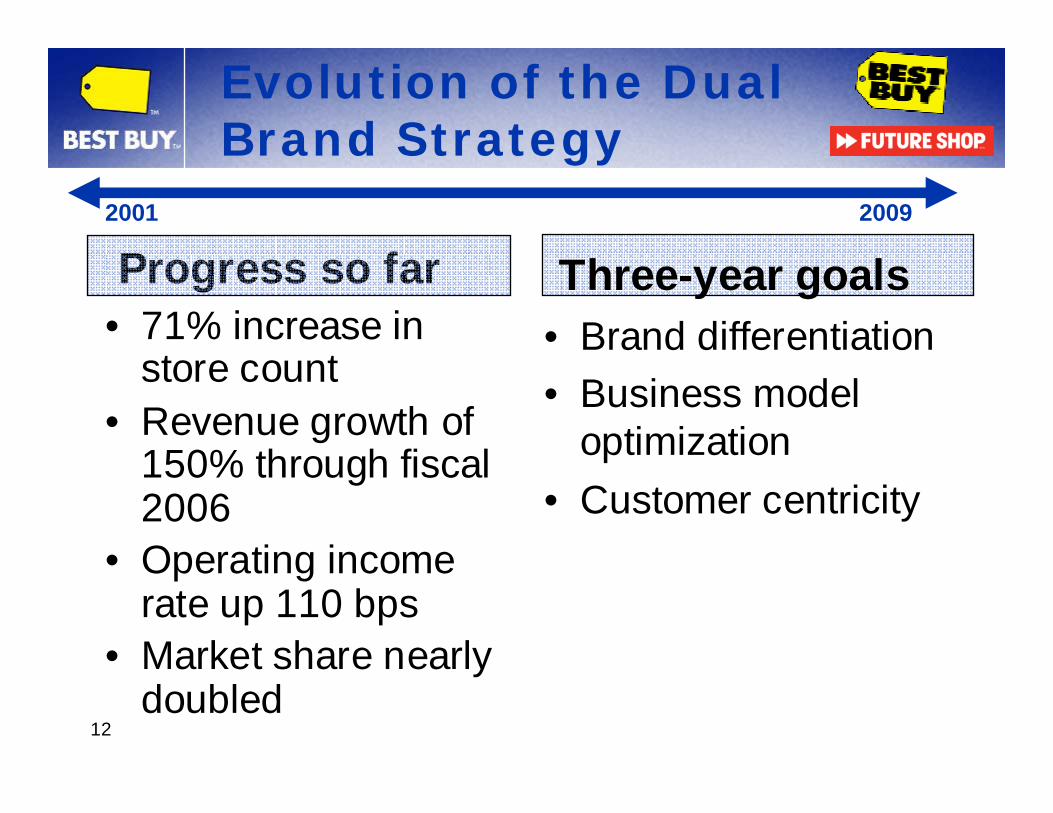
Progress so far• 71% increase in
store count• Revenue growth of
150% through fiscal 2006
• Operating income rate up 110 bps
• Market share nearly doubled
Evolution of the Dual Brand Strategy
Three-year goals• Brand differentiation• Business model
optimization• Customer centricity
2001 2009

13
HonorUnique
Customers
ProvideEnd-to-EndSolutions
Invite Employee
Ideas
Customer Centricity
14
Brand Differentiation
• Guiding principle: replicate U.S. Best Buy brand in Canadian marketplace
• Future Shop brand will retain its own imagery and customer experience
• Changes to dual brand operating structure• Brand architecture project initiated in late fiscal
2006– Develop strategic framework to further differentiate the
brands – Ensure clear differentiation on the customer experience
and employee experience
15
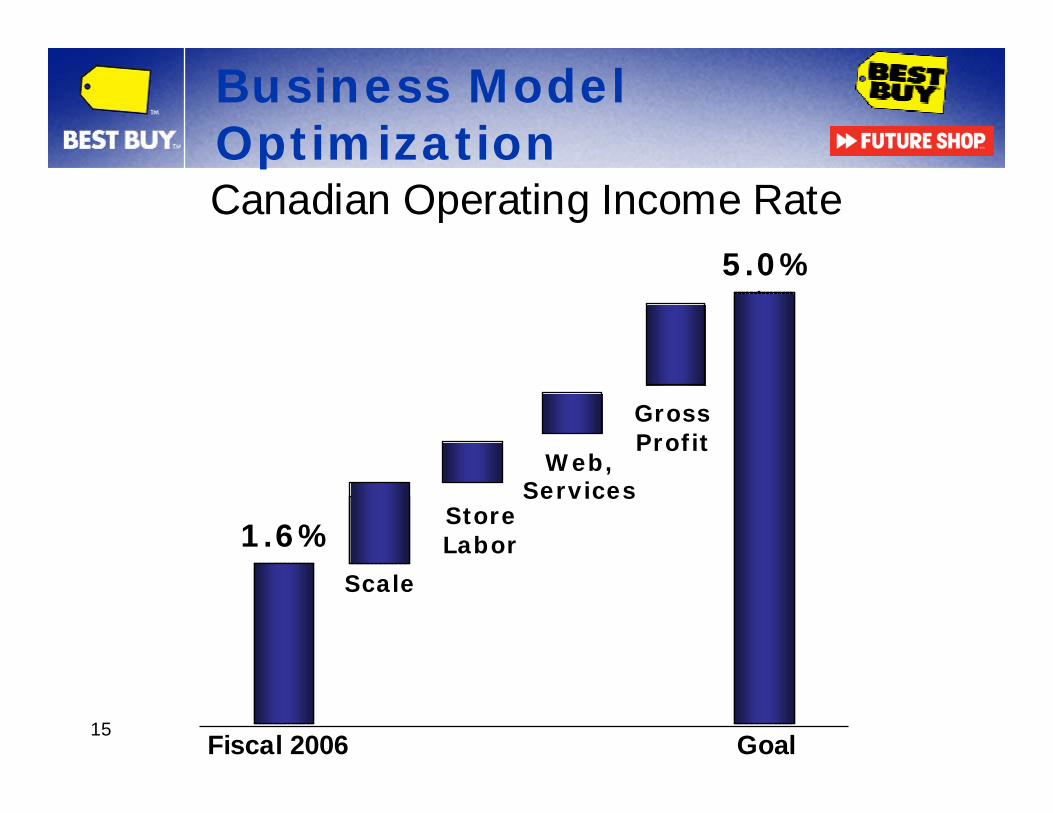
Business Model OptimizationCanadian Operating Income Rate
Fiscal 2006 Goal
1.6%Scale
Store Labor
Web,Services
Gross Profit
5.0%
16
FY06FY07
Revenue Operating Income (Loss)(US$ i
$4
($3)
$626$797
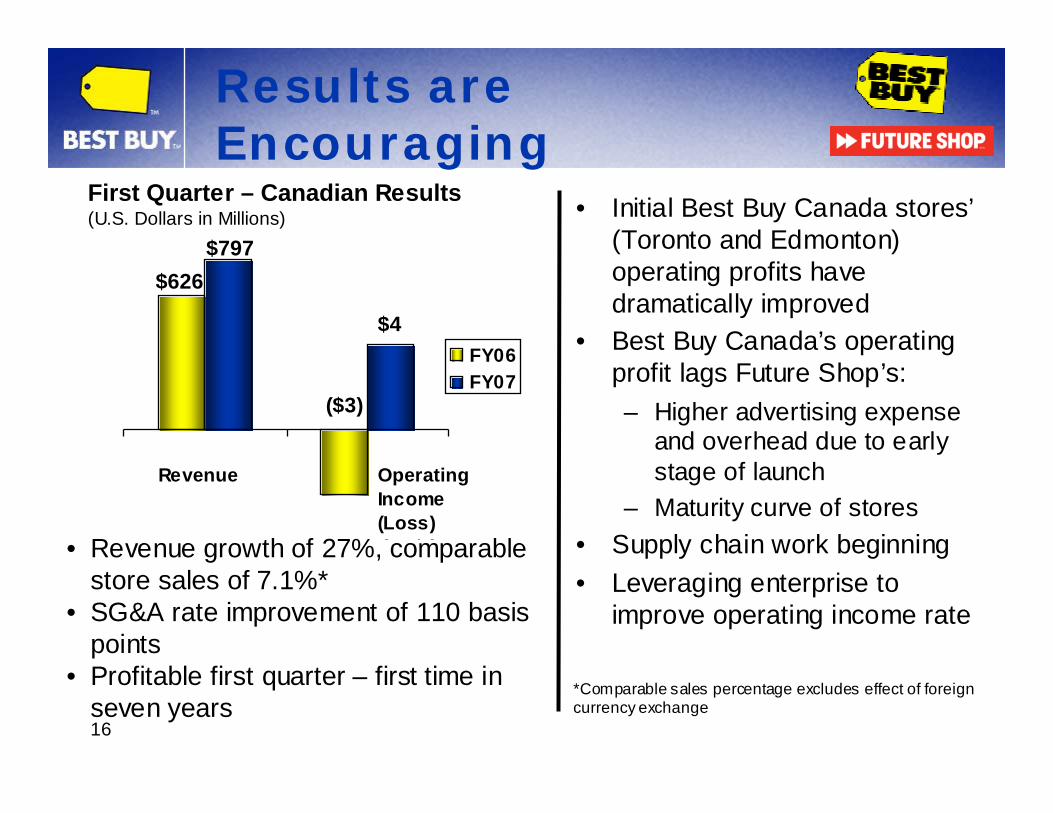
Results are Encouraging
First Quarter – Canadian Results(U.S. Dollars in Millions) • Initial Best Buy Canada stores’
(Toronto and Edmonton) operating profits have dramatically improved
• Best Buy Canada’s operating profit lags Future Shop’s:– Higher advertising expense
and overhead due to early stage of launch
– Maturity curve of stores• Supply chain work beginning• Leveraging enterprise to
improve operating income rate
• Revenue growth of 27%, comparable store sales of 7.1%*
• SG&A rate improvement of 110 basis points
• Profitable first quarter – first time in seven years
*Comparable sales percentage excludes effect of foreign currency exchange
17
HonorUnique
Customers
Our Growth Strategy
New Market Growth
Operating Income
NorthAmericanCE Market
$120$50
$80
$100 $350
Services
SmallBusinesses
China
PotentialMarket
Best Buy Canada
Supply Chain
IT
New Stores,
CustomerCentricity,Services
5.3%
7.0%
Fiscal 2006 Goal
Capabilities
Bottom-LineProfitability
Top-LineGrowth
ProvideEnd-to-End
Solutions
InviteEmployee
Ideas

18
Your Questions