wind energy conversion facility siting
TRANSCRIPT
www.psc.nd.gov
WIND ENERGY AND
ENERGY CONVERSION FACILITY
SITING
www.psc.nd.gov
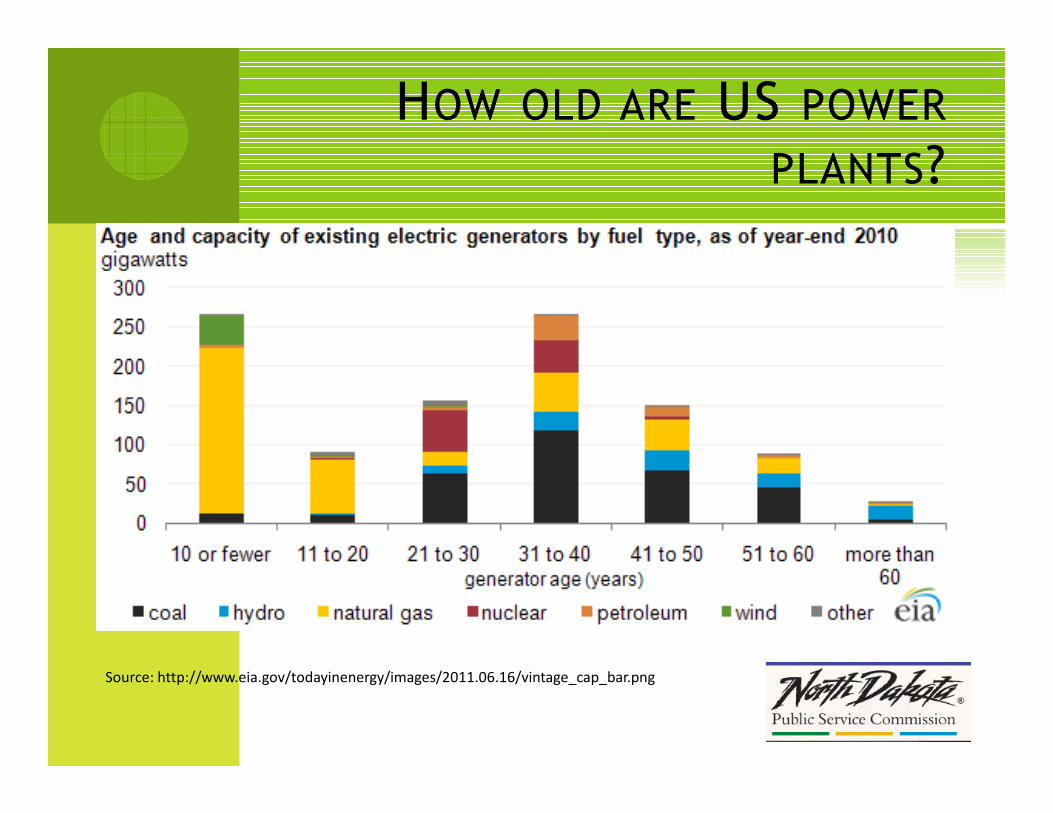
HOW OLD ARE US POWER
PLANTS?
Source: http://www.eia.gov/todayinenergy/images/2011.06.16/vintage_cap_bar.png
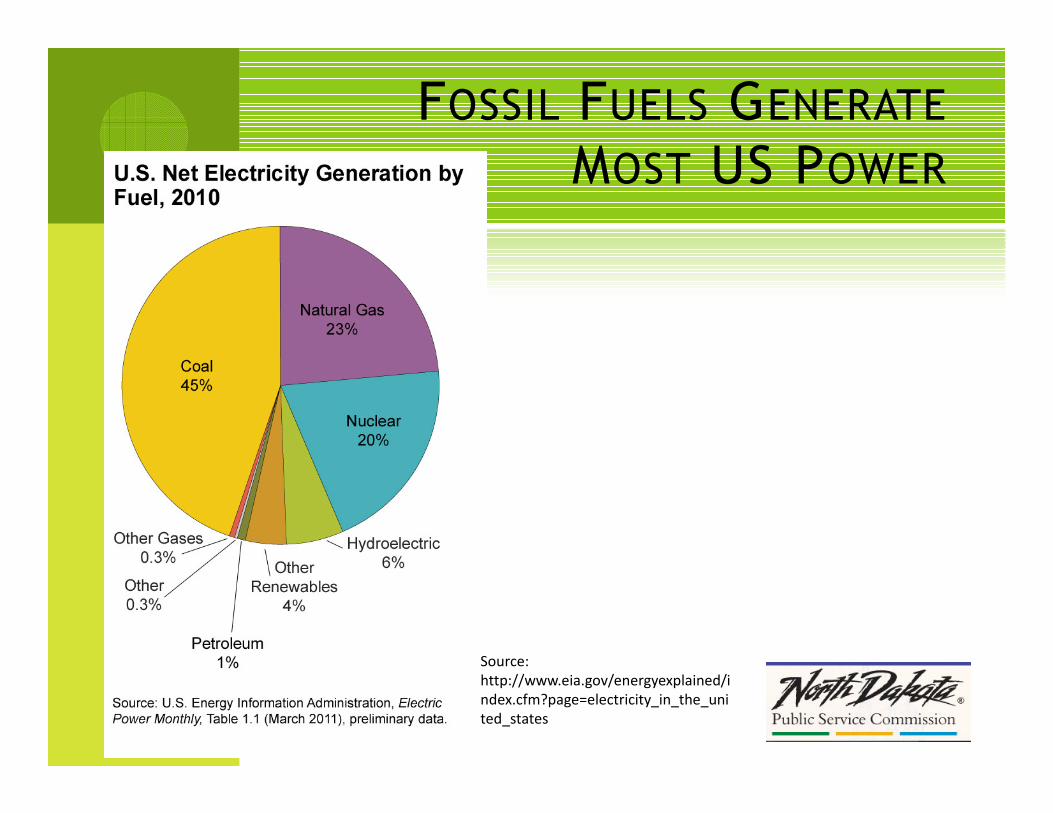
FOSSIL FUELS GENERATE
MOST US POWER
Source:
http://www.eia.gov/energyexplained/i
ndex.cfm?page=electricity_in_the_uni
ted_states
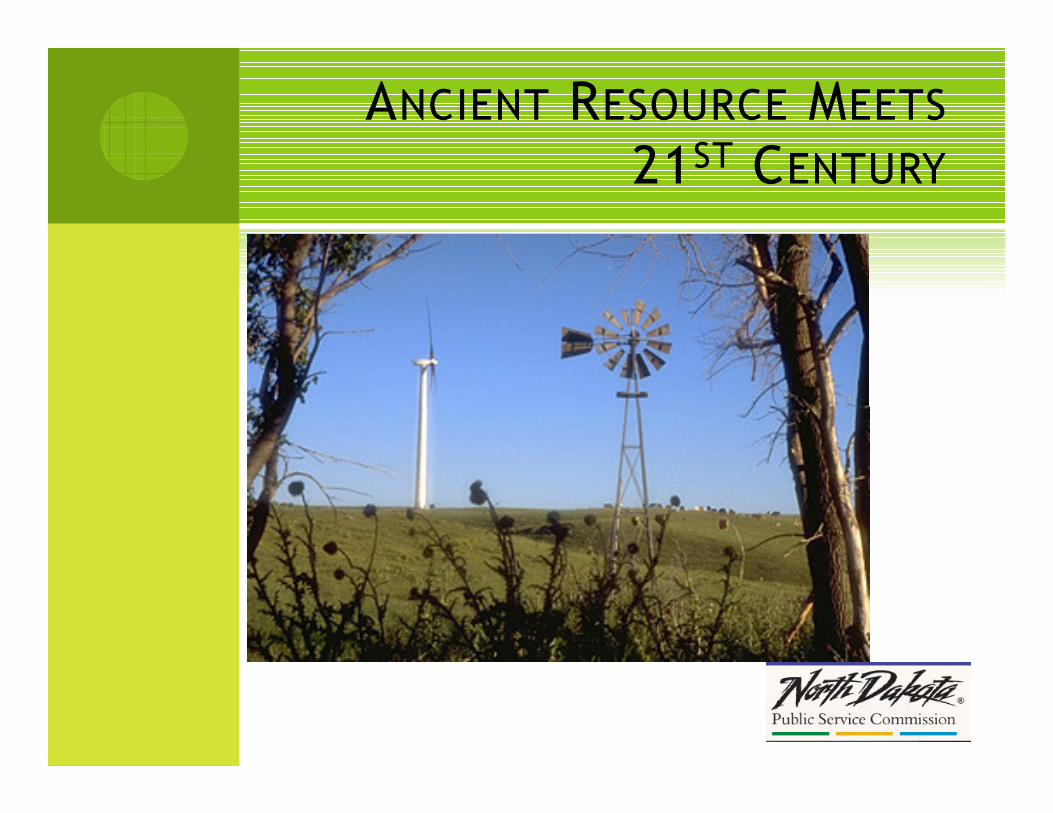
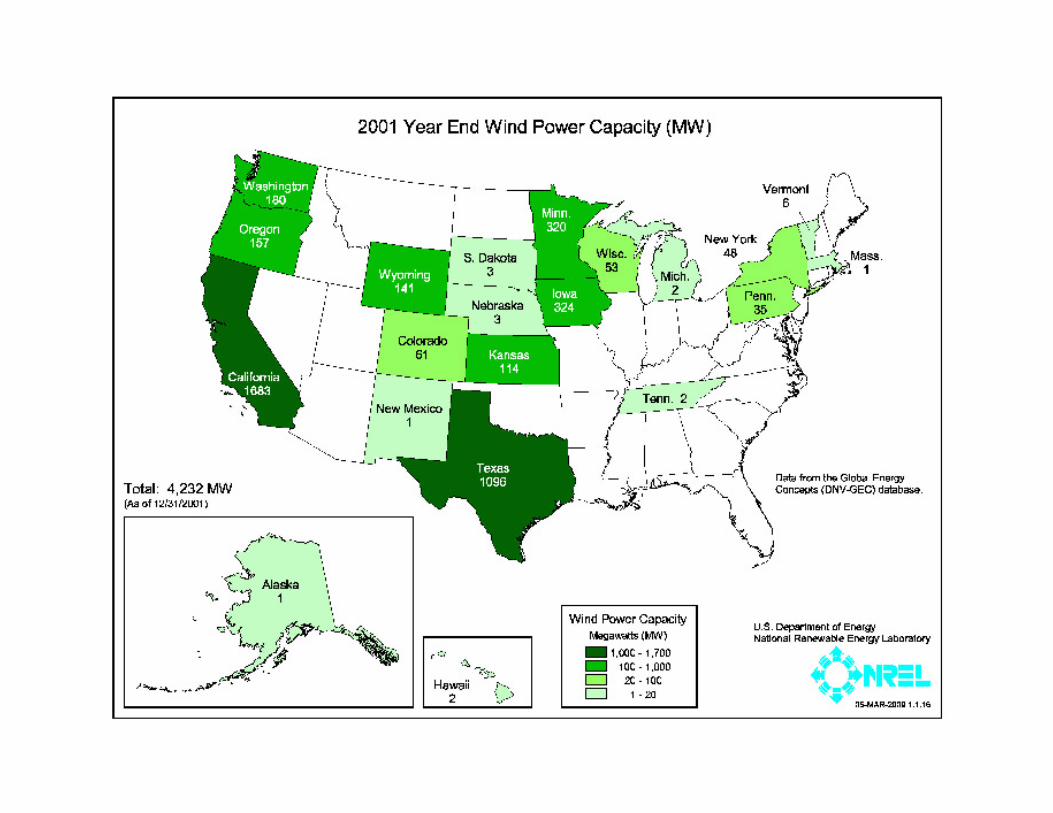
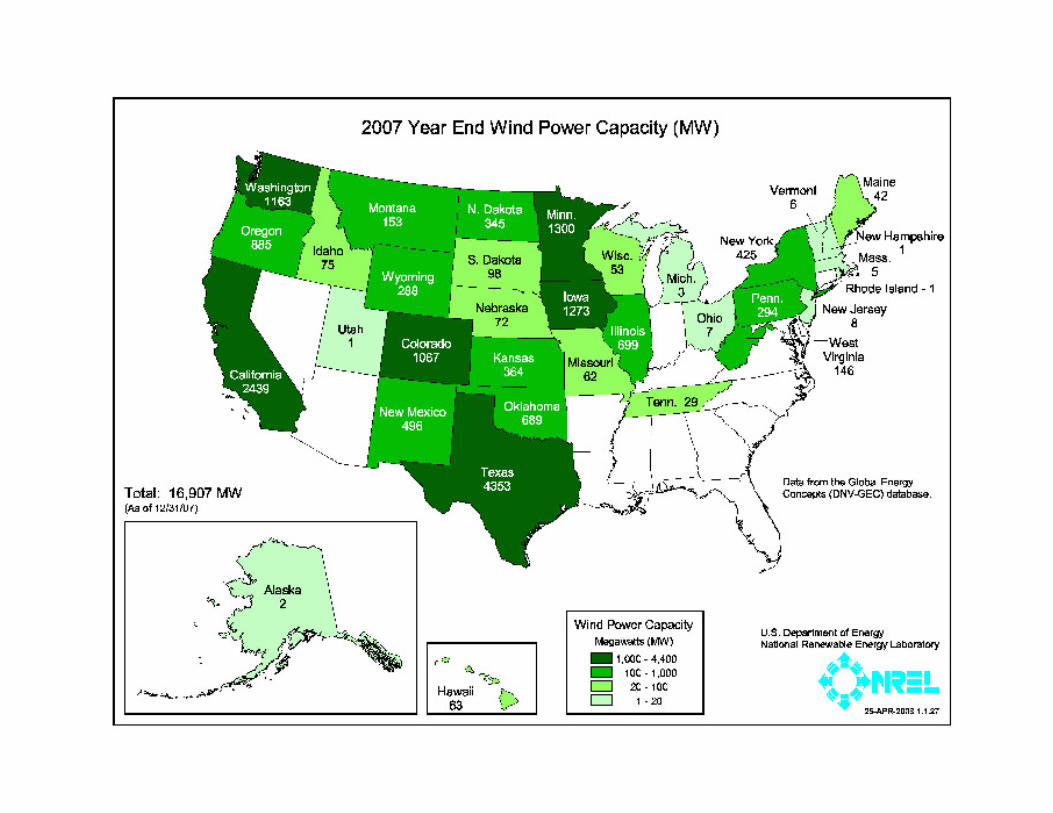
ANCIENT RESOURCE MEETS
21ST CENTURY

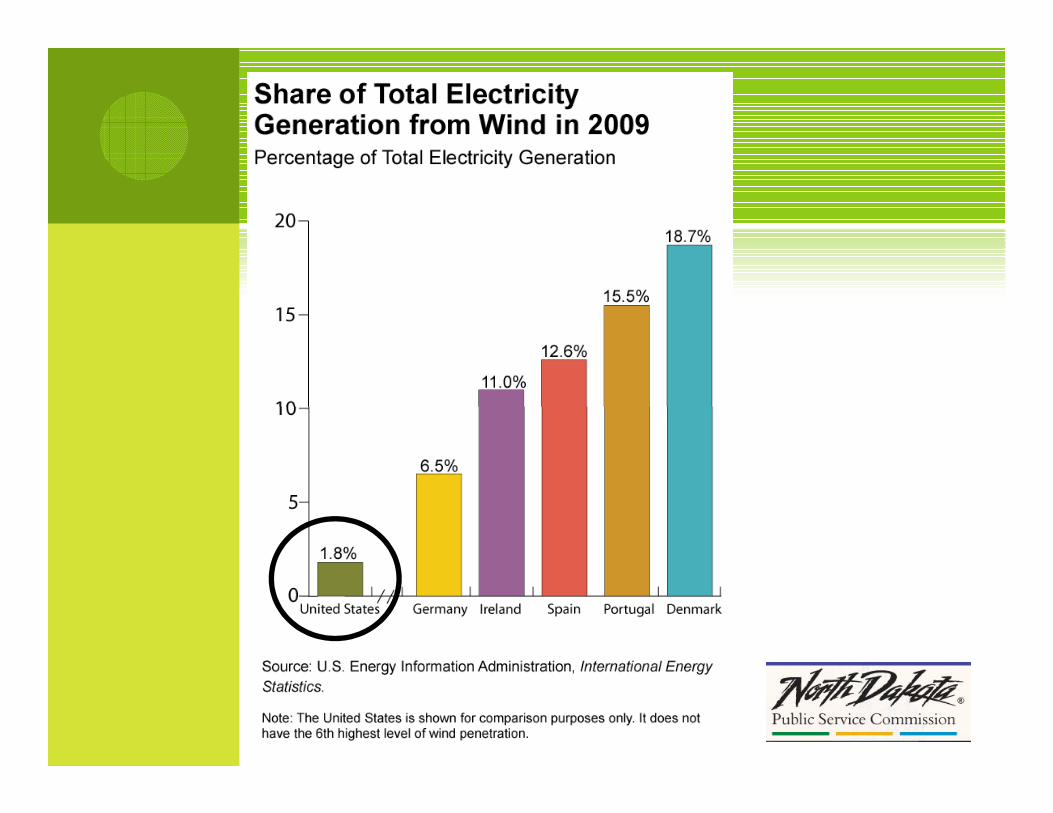
INCREASINGLY SIGNIFICANT
POWER SOURCE
coal
petroleum
Wind could generate 6% of nation’s electricity by 2020.natural gas
nuclear
hydro
other renewables
wind
electricity by 2020.
Wind currently produces less than 2% of the nation’s power. Source: Energy
Information Agency

SITE SELECTION
� Wind resource – minimum annual average wind speed of approximately 11 mph to 13 mph
� Economics
� Available power purchaser or market
� Transmission availability
� Tax incentives
� Financing
� Environmental
WHY NORTH DAKOTA?WHY NORTH DAKOTA?
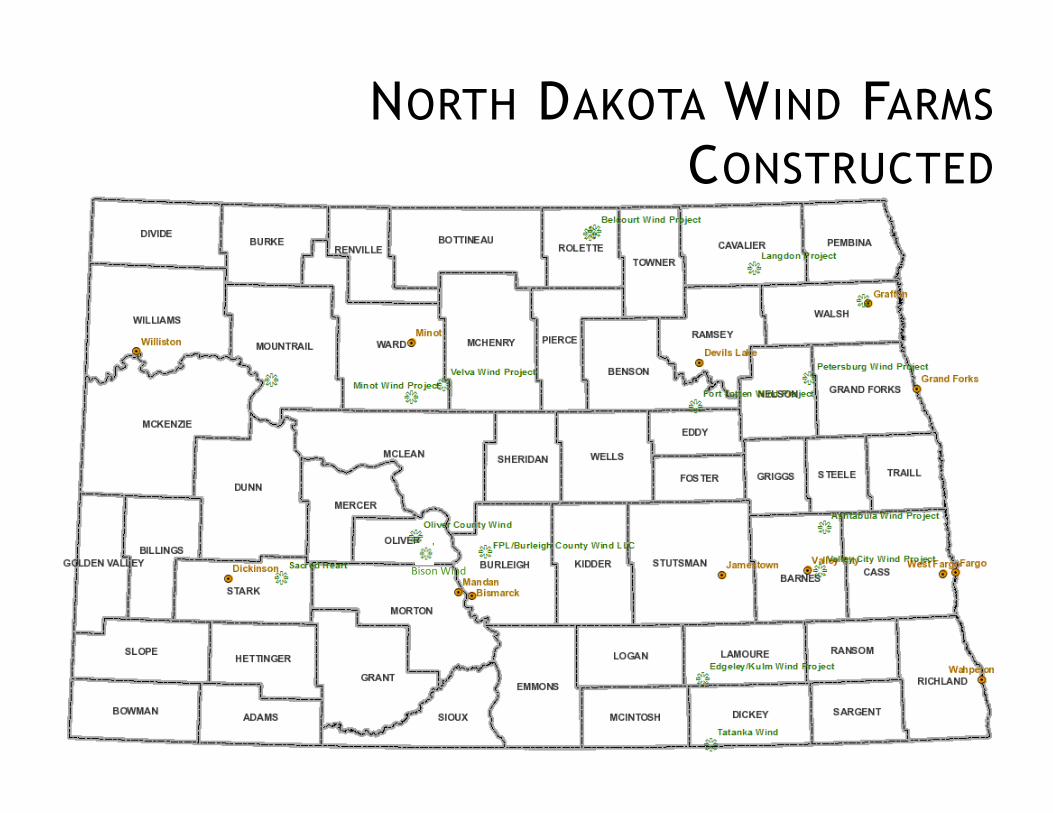
NORTH DAKOTA WIND FARMS
CONSTRUCTED
Bison Wind

WIND FARM LOCATIONS BY
COUNTY
� Adams and Bowman
Counties 1
� Adams County 1
� Barnes County 2
� McIntosh County 1
� Oliver and Morton Counties 3
� Oliver County 1
Pierce County 1
Letter of
Intent or
Application
received by
the PSC
� Burleigh County 1
� Cavalier County 2
� Dickey County 1
� Emmons County 1
� Logan County 1
� McIntosh and Dickey
Counties 1
� Pierce County 1
� Rolette and Towner Counties 1
� Steele County 1
� Ward County 1
� Ward, Burke, and Mountrail
Counties 1
VARIABLES IMPACTING
DEVELOPMENT
� Political
� Renewable mandates
Regulatory restrictions� Regulatory restrictions
� Economic
� Tax incentives
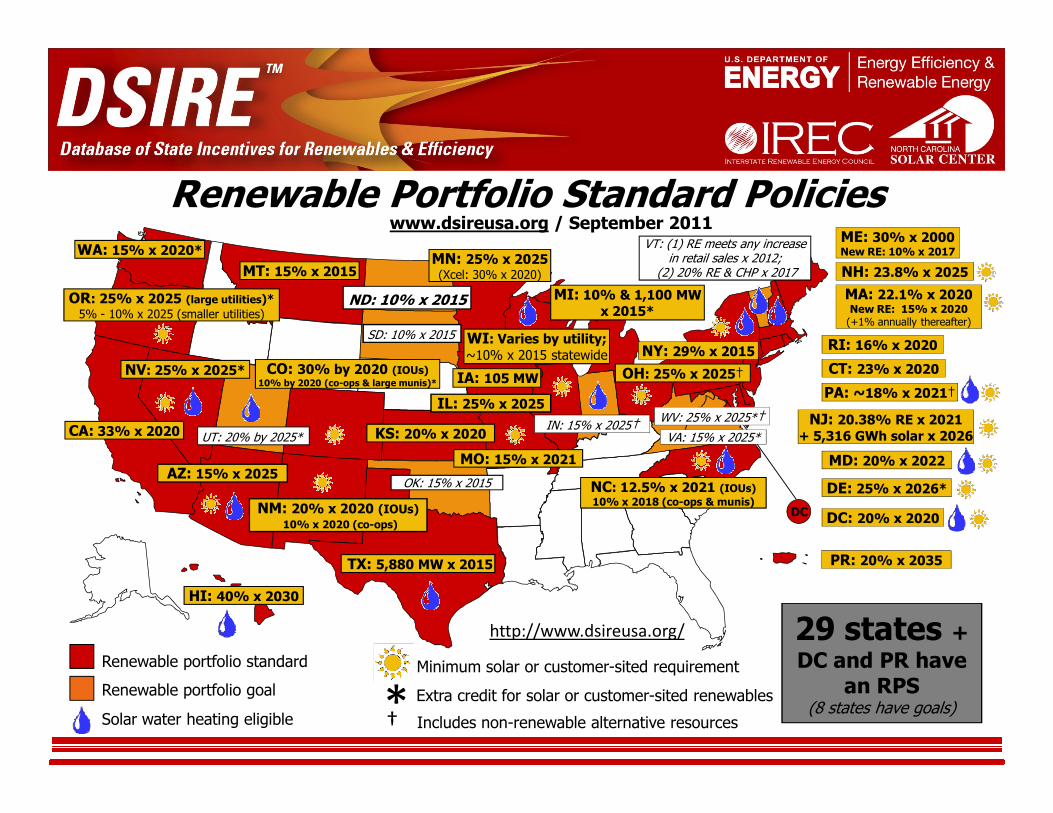
Renewable Portfolio Standard Policieswww.dsireusa.org / September 2011
WA: 15% x 2020*
NV: 25% x 2025* CO: 30% by 2020 (IOUs)10% by 2020 (co-ops & large munis)*
MT: 15% x 2015
ND: 10% x 2015
SD: 10% x 2015
IA: 105 MW
MN: 25% x 2025(Xcel: 30% x 2020)
WI: Varies by utility; ~10% x 2015 statewide
MI: 10% & 1,100 MW x 2015*
OH: 25% x 2025†
ME: 30% x 2000New RE: 10% x 2017
NH: 23.8% x 2025
MA: 22.1% x 2020 New RE: 15% x 2020
(+1% annually thereafter)
RI: 16% x 2020
CT: 23% x 2020NY: 29% x 2015
PA: ~18% x 2021†
VT: (1) RE meets any increase in retail sales x 2012;
(2) 20% RE & CHP x 2017
OR: 25% x 2025 (large utilities)*5% - 10% x 2025 (smaller utilities)
IL: 25% x 2025
Renewable portfolio standard
Renewable portfolio goal
Solar water heating eligible *† Extra credit for solar or customer-sited renewables
Includes non-renewable alternative resources
CA: 33% x 2020
AZ: 15% x 2025
NM: 20% x 2020 (IOUs)10% x 2020 (co-ops)
HI: 40% x 2030
Minimum solar or customer-sited requirement
TX: 5,880 MW x 2015
UT: 20% by 2025*
MO: 15% x 2021
NJ: 20.38% RE x 2021+ 5,316 GWh solar x 2026
MD: 20% x 2022
DE: 25% x 2026*
DC: 20% x 2020
NC: 12.5% x 2021 (IOUs)10% x 2018 (co-ops & munis)
KS: 20% x 2020
IL: 25% x 2025
29 states + DC and PR have an RPS
(8 states have goals)
OK: 15% x 2015
PR: 20% x 2035
WV: 25% x 2025*†
VA: 15% x 2025*
DC
IN: 15% x 2025†
http://www.dsireusa.org/
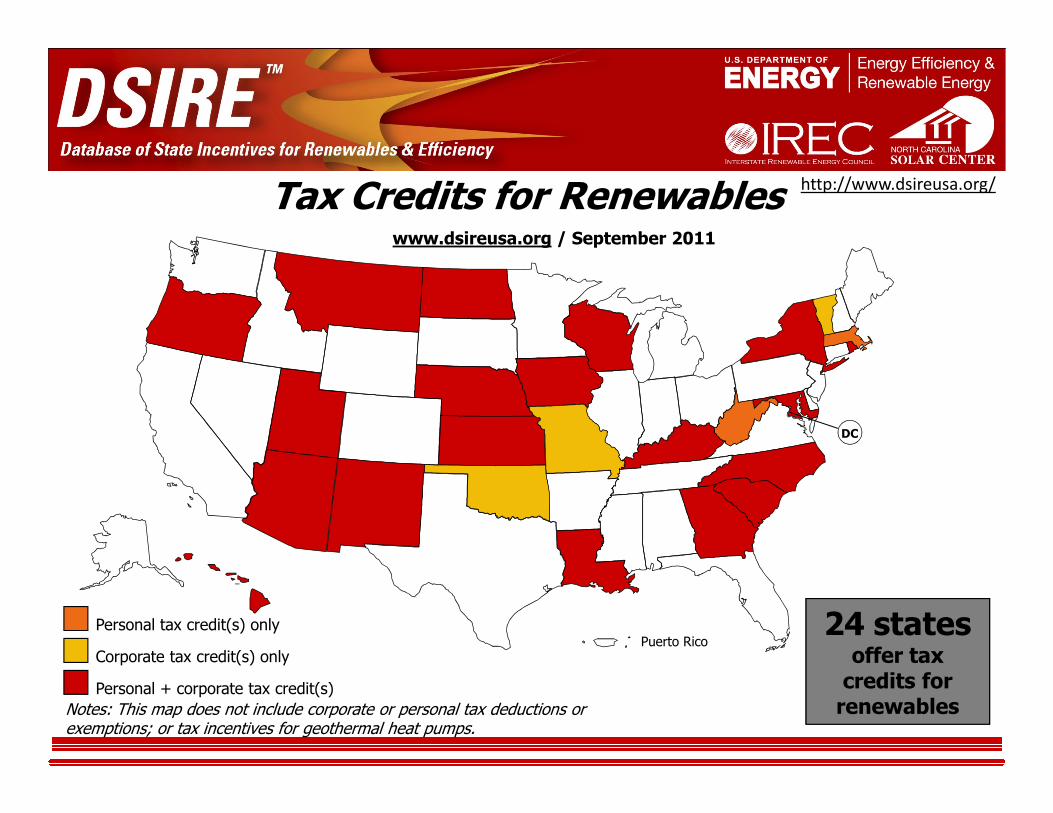
Tax Credits for Renewableswww.dsireusa.org / September 2011
http://www.dsireusa.org/
Corporate tax credit(s) only
Personal + corporate tax credit(s)
Notes: This map does not include corporate or personal tax deductions or exemptions; or tax incentives for geothermal heat pumps.
Personal tax credit(s) onlyPuerto Rico
DC
24 states offer tax credits for renewables
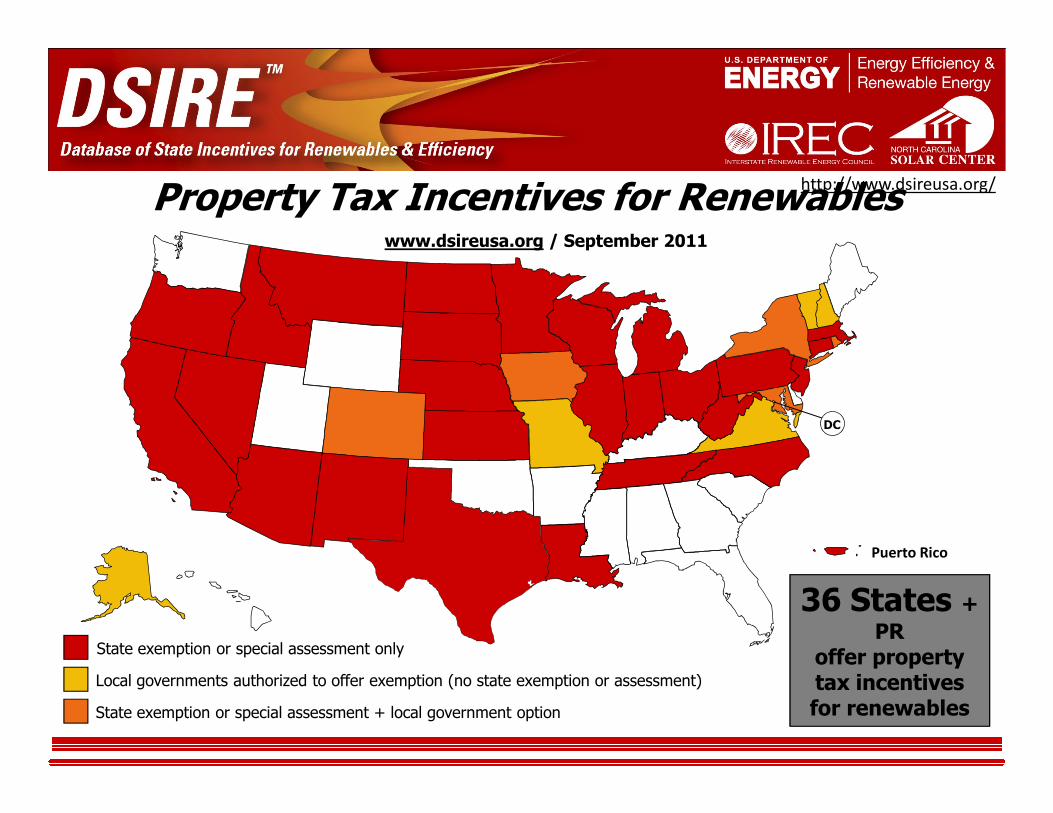
Property Tax Incentives for Renewableswww.dsireusa.org / September 2011
http://www.dsireusa.org/
State exemption or special assessment + local government option
Puerto Rico
Local governments authorized to offer exemption (no state exemption or assessment)
State exemption or special assessment only
36 States + PR
offer property tax incentives for renewables
DC
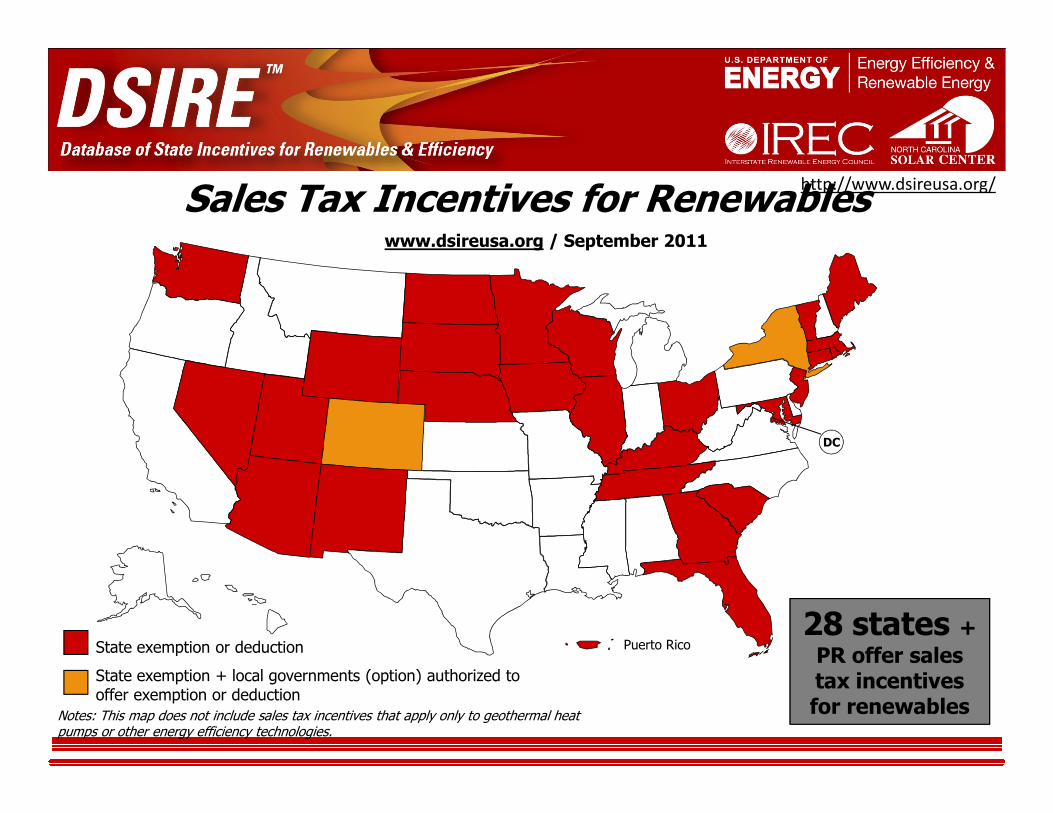
Sales Tax Incentives for Renewableswww.dsireusa.org / September 2011
http://www.dsireusa.org/
Notes: This map does not include sales tax incentives that apply only to geothermal heat pumps or other energy efficiency technologies.
State exemption + local governments (option) authorized to offer exemption or deduction
State exemption or deduction Puerto Rico 28 states + PR offer sales tax incentives for renewables
DC
REGULATORY ISSUES
� State level – Public Service Commission
� Wind farm is an energy conversion facility
PSC has jurisdiction over wind energy conversion � PSC has jurisdiction over wind energy conversion
facilities of .5 MW or greater
� PSC jurisdiction does not preempt local land use
and zoning rules

WHAT DOES THE PUBLIC SERVICE
COMMISSION DO?
� Authority – Energy Conversion and Transmission
Facility Siting Act – North Dakota Century Code
chapter 49-22
� Rules – North Dakota Administrative Code
Chapter 69-06
WHAT DOESN’T THE PUBLIC
SERVICE COMMISSION DO?
� Leasing
� Costs
� Wind rights
� Site Meteorological (MET) Towers
� Legal advice
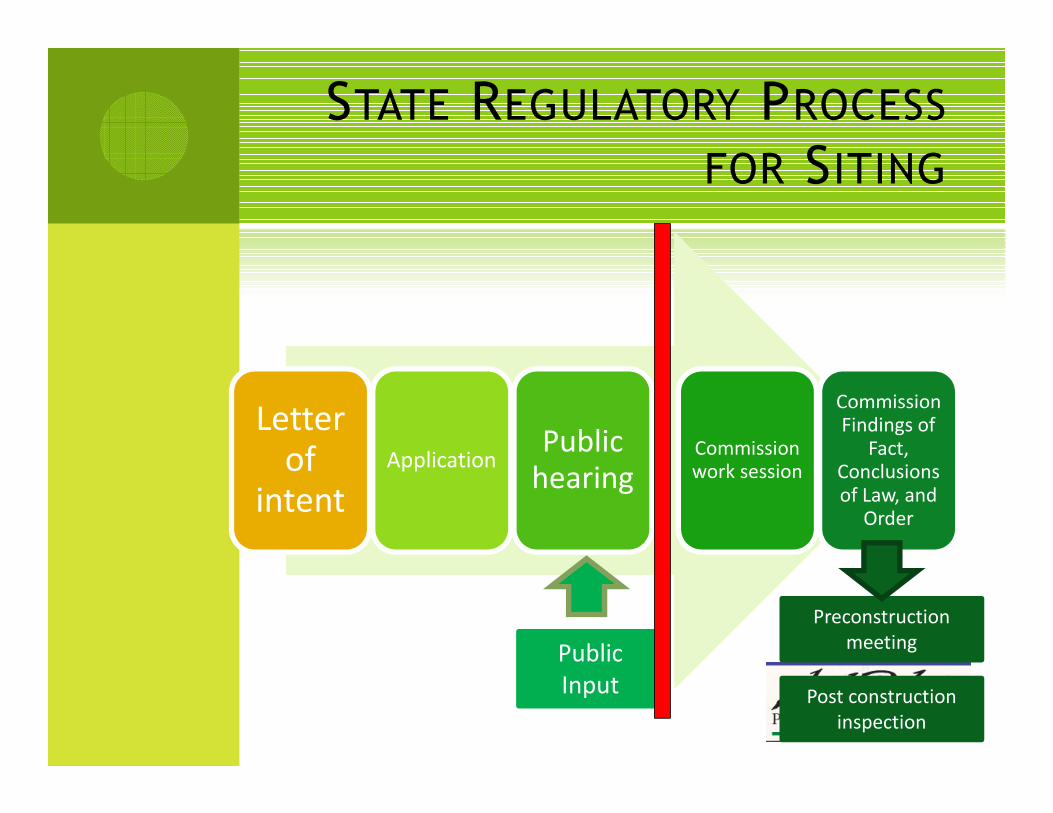
STATE REGULATORY PROCESS
FOR SITING
Letter Commission
Letter of
intent
ApplicationPublic
hearingCommission work session
Commission Findings of
Fact, Conclusions of Law, and
Order
Public
Input
Preconstruction
meeting
Post construction
inspection
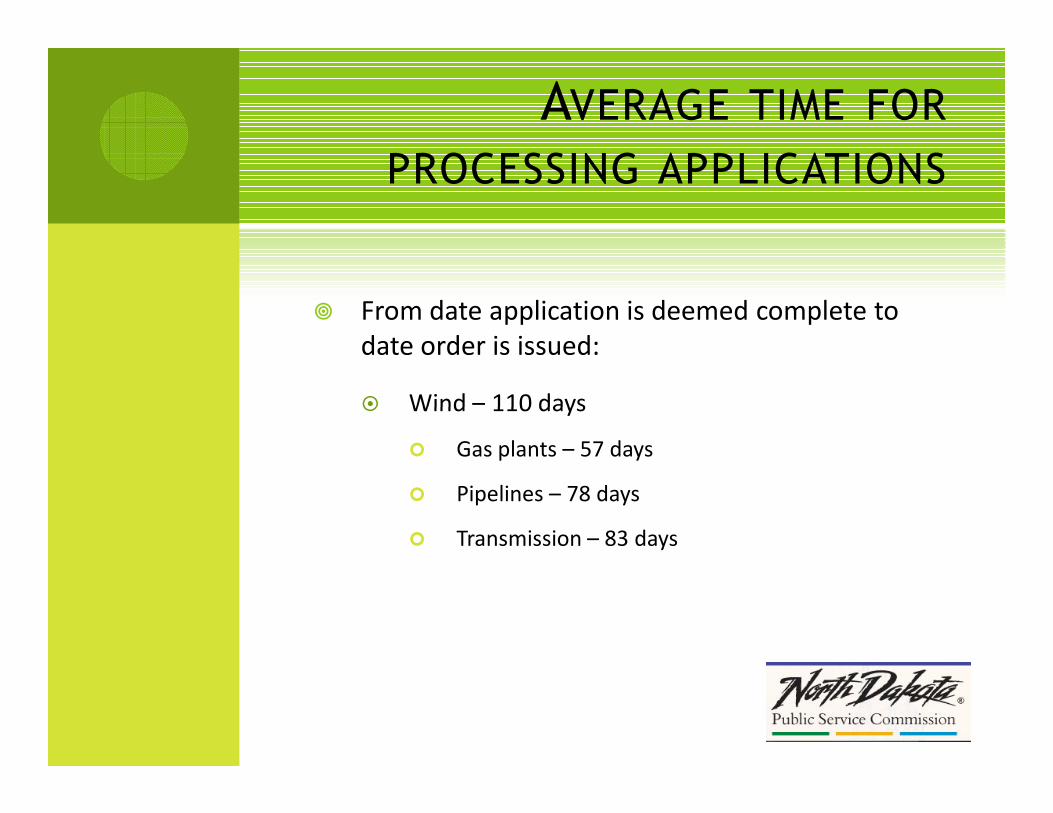
AVERAGE TIME FOR
PROCESSING APPLICATIONS
� From date application is deemed complete to
date order is issued:
� Wind – 110 days� Wind – 110 days
� Gas plants – 57 days
� Pipelines – 78 days
� Transmission – 83 days
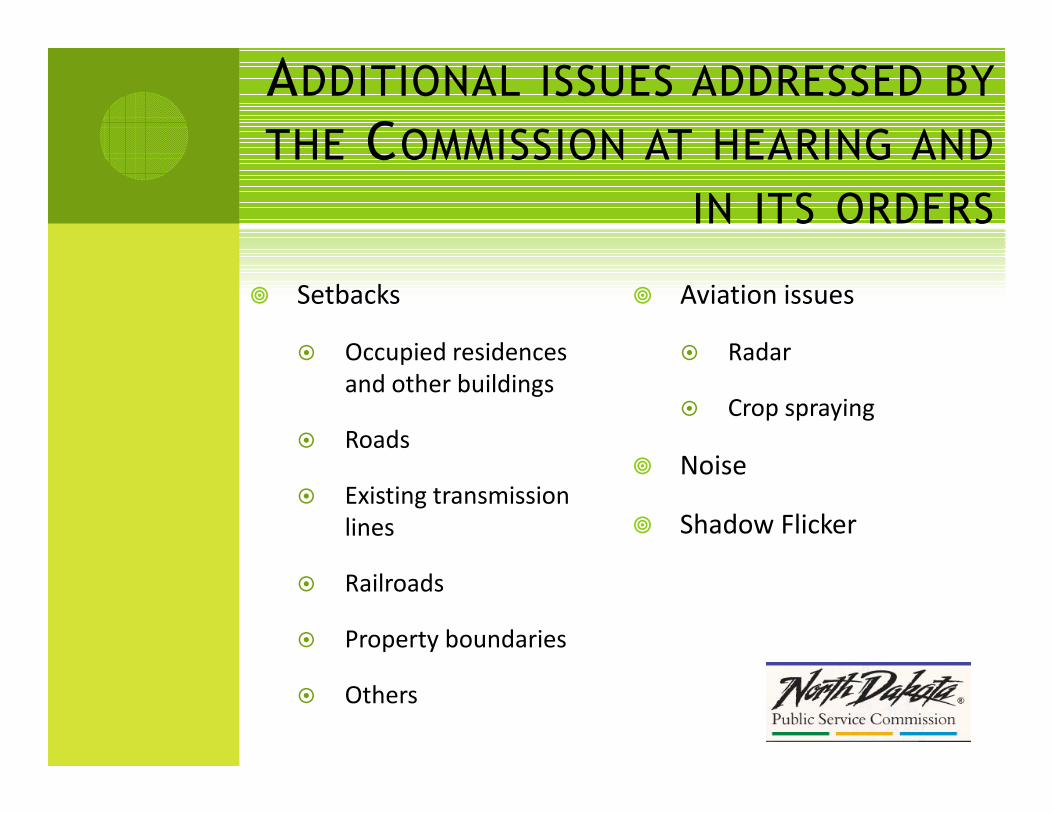
ADDITIONAL ISSUES ADDRESSED BY
THE COMMISSION AT HEARING AND
IN ITS ORDERS
� Setbacks
� Occupied residences
and other buildings
� Aviation issues
� Radar
� Crop spraying
� Roads
� Existing transmission
lines
� Railroads
� Property boundaries
� Others
� Crop spraying
� Noise
� Shadow Flicker

MAJOR FEDERAL LAWS
APPLICABLE TO WIND PROJECTS
� Endangered Species Act
� Migratory Bird Treaty Act
Bald and Golden Eagle Protection Act� Bald and Golden Eagle Protection Act
� Clean Water Act
� National Wildlife Refuge System Improvement Act
� National Environmental Policy Act
� National Historic Preservation Act
MANY OF THESE ARE TRIGGERED
BY FEDERAL NEXUS…
� Examples:
� Federal funding or loans
Interconnection to Federal transmission system� Interconnection to Federal transmission system
� Use of Federal lands
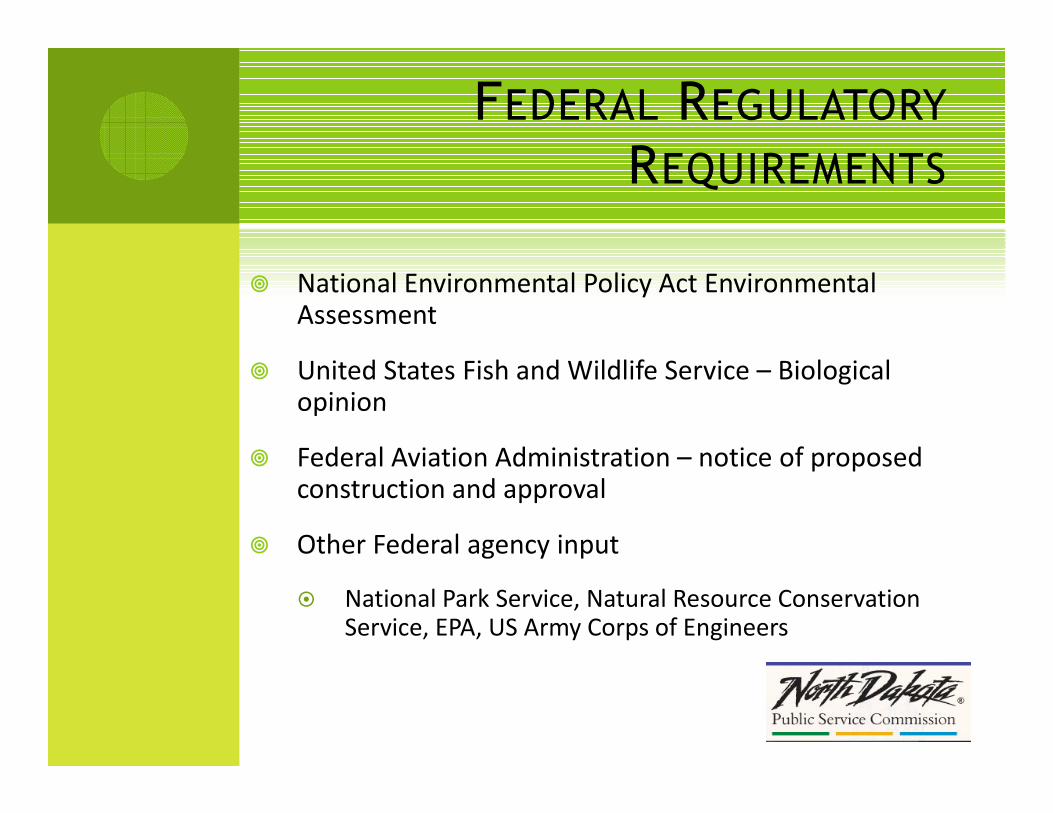
FEDERAL REGULATORY
REQUIREMENTS
� National Environmental Policy Act Environmental Assessment
� United States Fish and Wildlife Service – Biological opinionopinion
� Federal Aviation Administration – notice of proposed construction and approval
� Other Federal agency input
� National Park Service, Natural Resource Conservation Service, EPA, US Army Corps of Engineers
LOCAL REGULATORY
REQUIREMENTS . . .
� Zoning restrictions
� Use permits
� Building permits
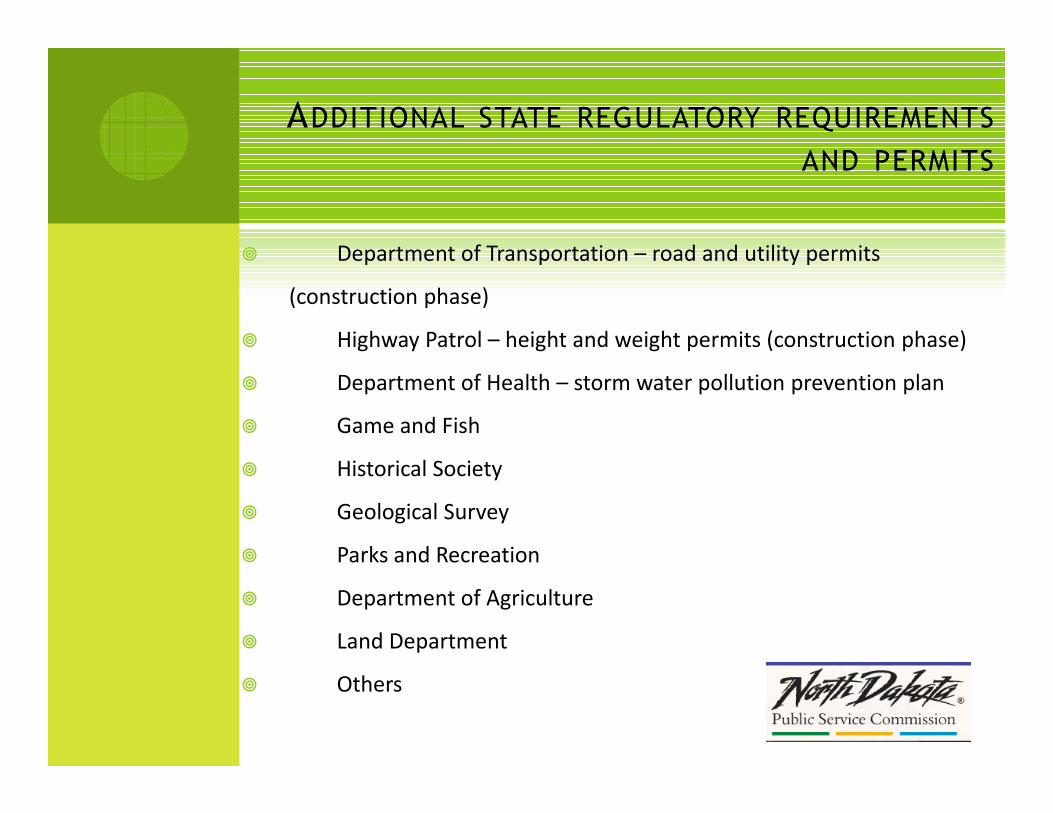
ADDITIONAL STATE REGULATORY REQUIREMENTS
AND PERMITS
� Department of Transportation – road and utility permits
(construction phase)
� Highway Patrol – height and weight permits (construction phase)
� Department of Health – storm water pollution prevention plan
� Game and Fish
� Historical Society
� Geological Survey
� Parks and Recreation
� Department of Agriculture
� Land Department
� Others
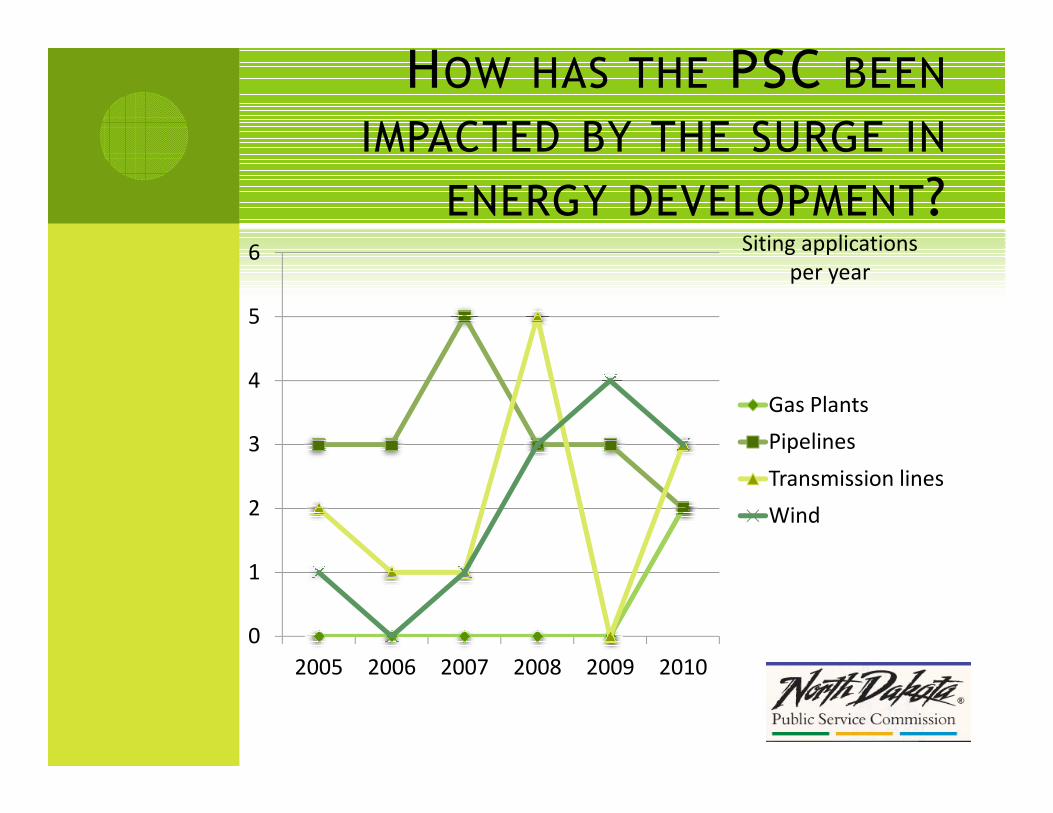
HOW HAS THE PSC BEEN
IMPACTED BY THE SURGE IN
ENERGY DEVELOPMENT?
4
5
6
Gas Plants
Siting applications
per year
0
1
2
3
2005 2006 2007 2008 2009 2010
Gas Plants
Pipelines
Transmission lines
Wind
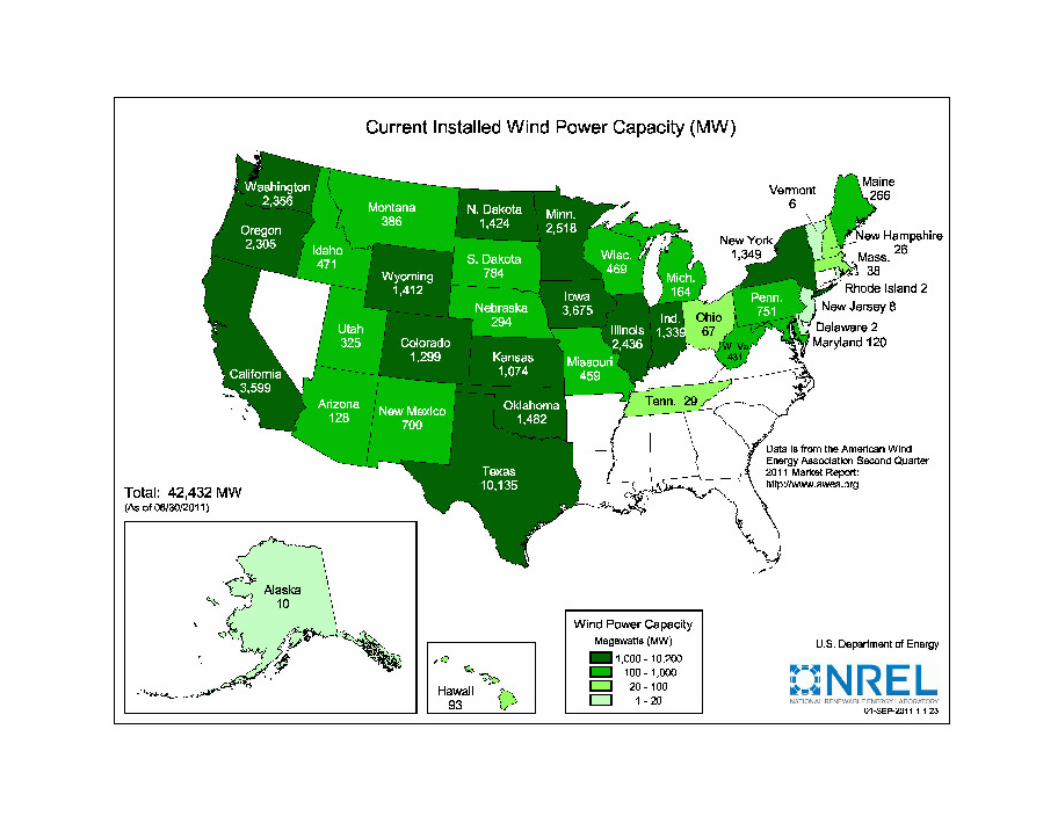
WIND IN NORTH DAKOTA
� The first wind farm was sited by the Commission
in October 2005 near Rugby
� Construction began in 2008, completed 2009� Construction began in 2008, completed 2009
� PPM Energy, Inc (now Iberdrola Renewables, Inc.)
� 71 Suzlon 2.1-MW S88 turbines, totaling 149.1
MW (originally 100 GE 1.5 MW turbines totaling
150 MW)
WIND IN NORTH DAKOTA
� As of October 17, the Commission has letters of
intent or has granted certificates for 7268.5 MW
of wind
� Total estimated investment of $13,179,250,000
� Total estimated investment of completed
projects $5,860,931,000


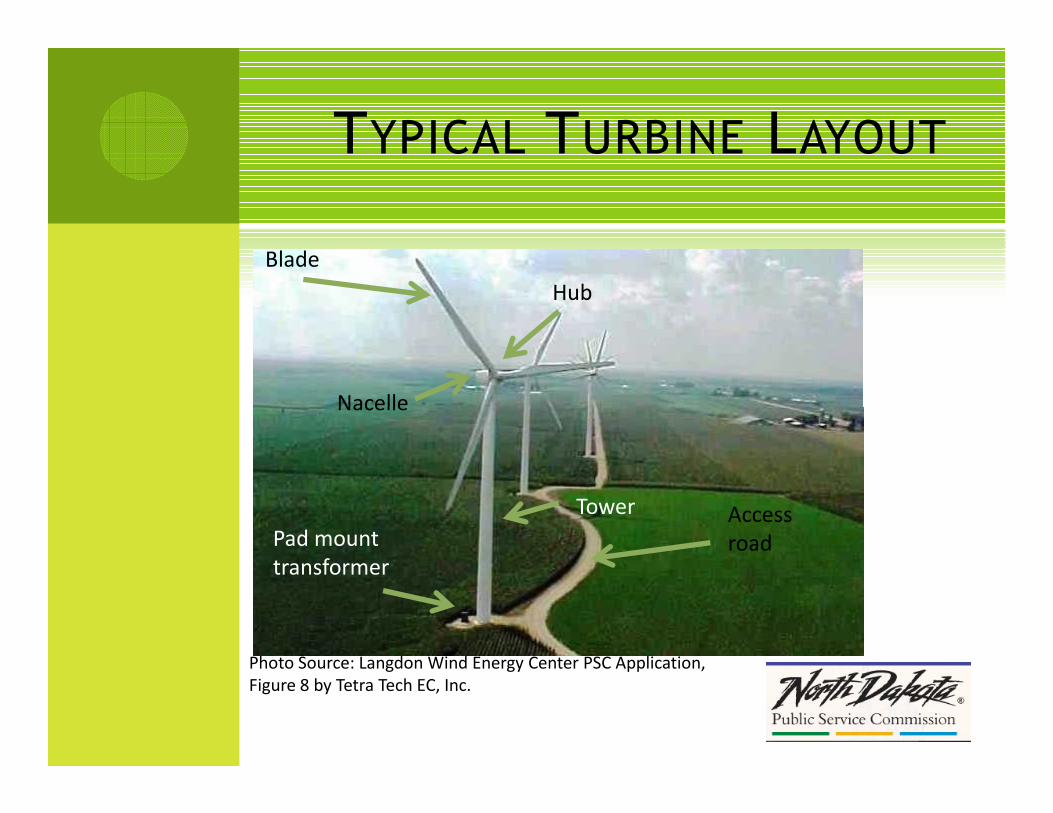
TYPICAL TURBINE LAYOUT
Blade
Hub
Nacelle
Photo Source: Langdon Wind Energy Center PSC Application,
Figure 8 by Tetra Tech EC, Inc.
Nacelle
Pad mount
transformer
Access
road
Tower
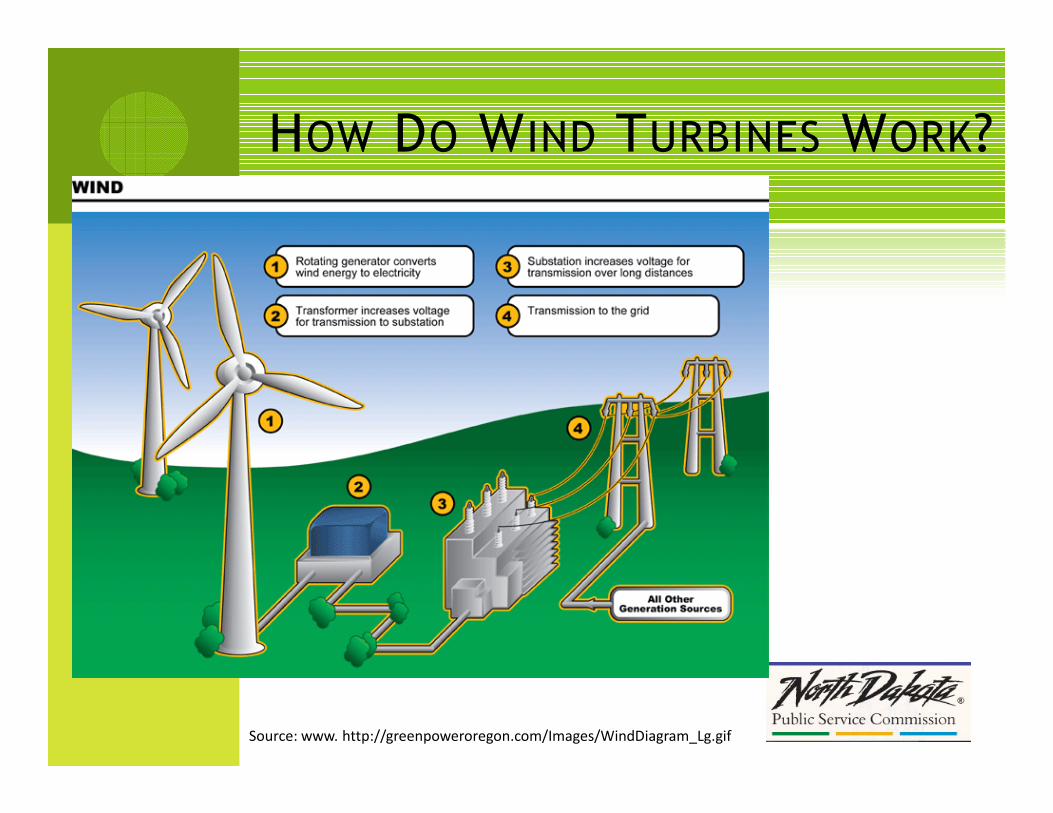
HOW DO WIND TURBINES WORK?
Source: www. http://greenpoweroregon.com/Images/WindDiagram_Lg.gif
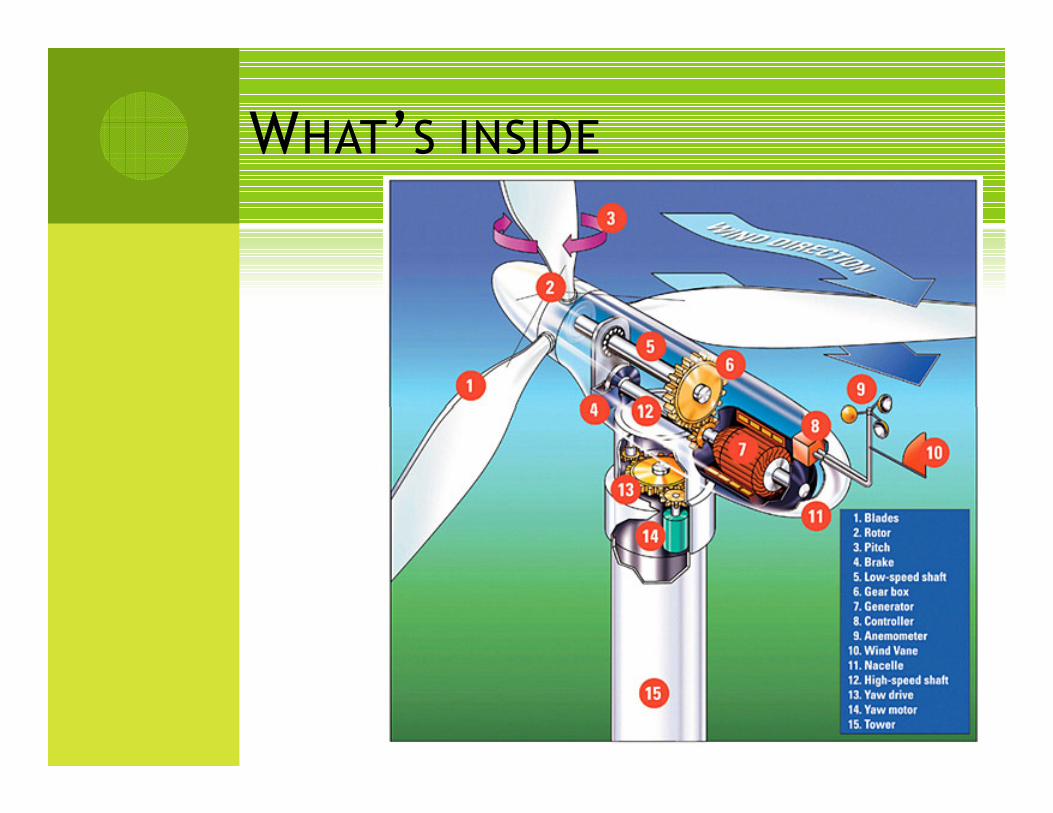
WHAT’S INSIDE

TURBINES CONSTANTLY
IMPROVING
� Larger turbines
� Specialized blade design
� Power electronics
� Computer modeling � Computer modeling
� produces more efficient design
� Manufacturing improvements
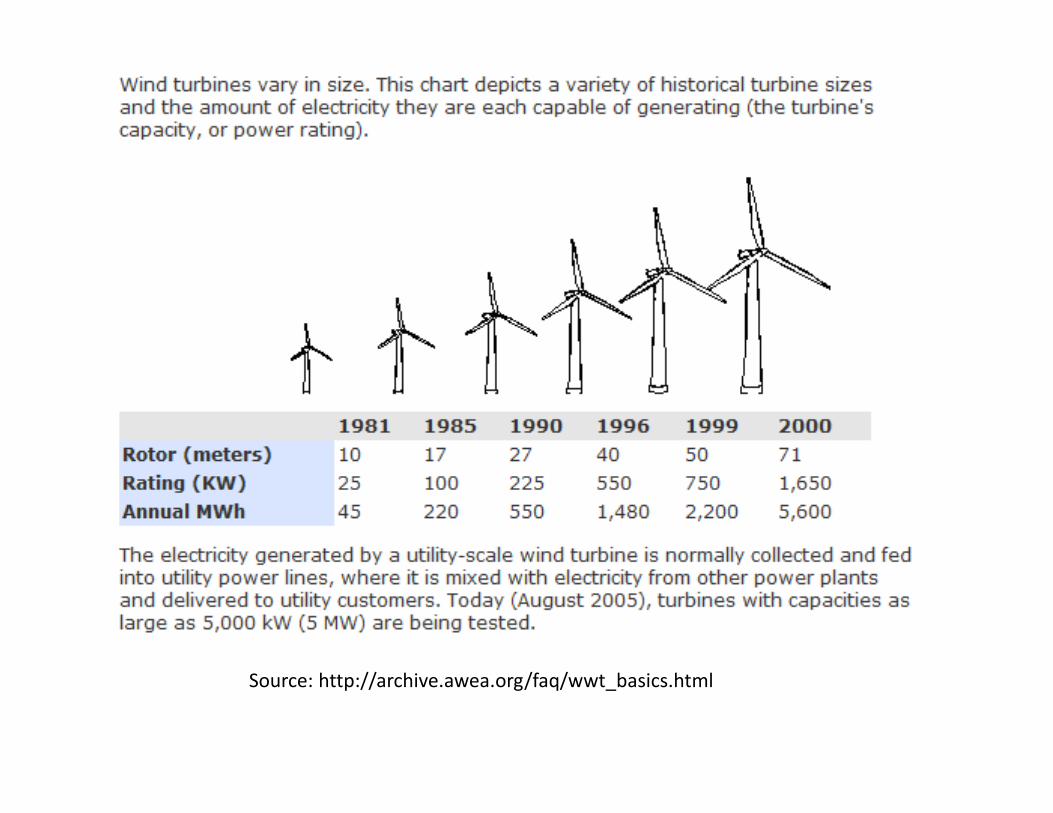
Source: http://archive.awea.org/faq/wwt_basics.html
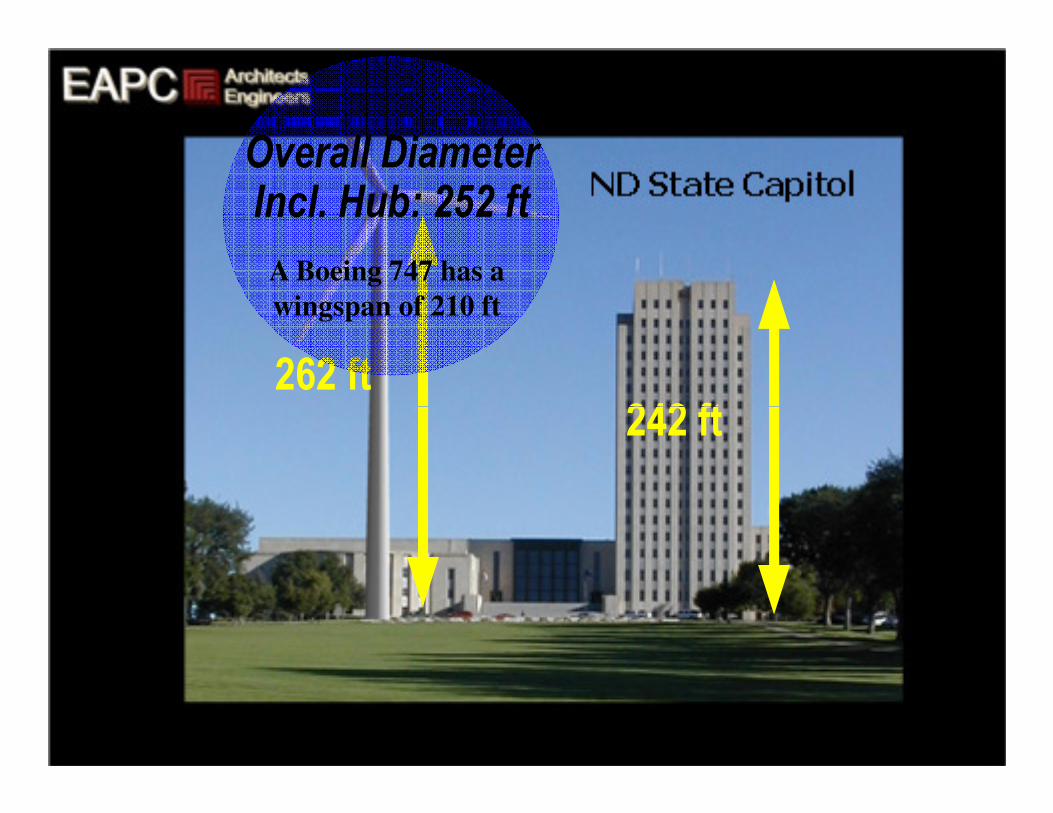
262 ft
242 ft
Overall Diameter
Incl. Hub: 252 ft
A Boeing 747 has a
wingspan of 210 ft
242 ft
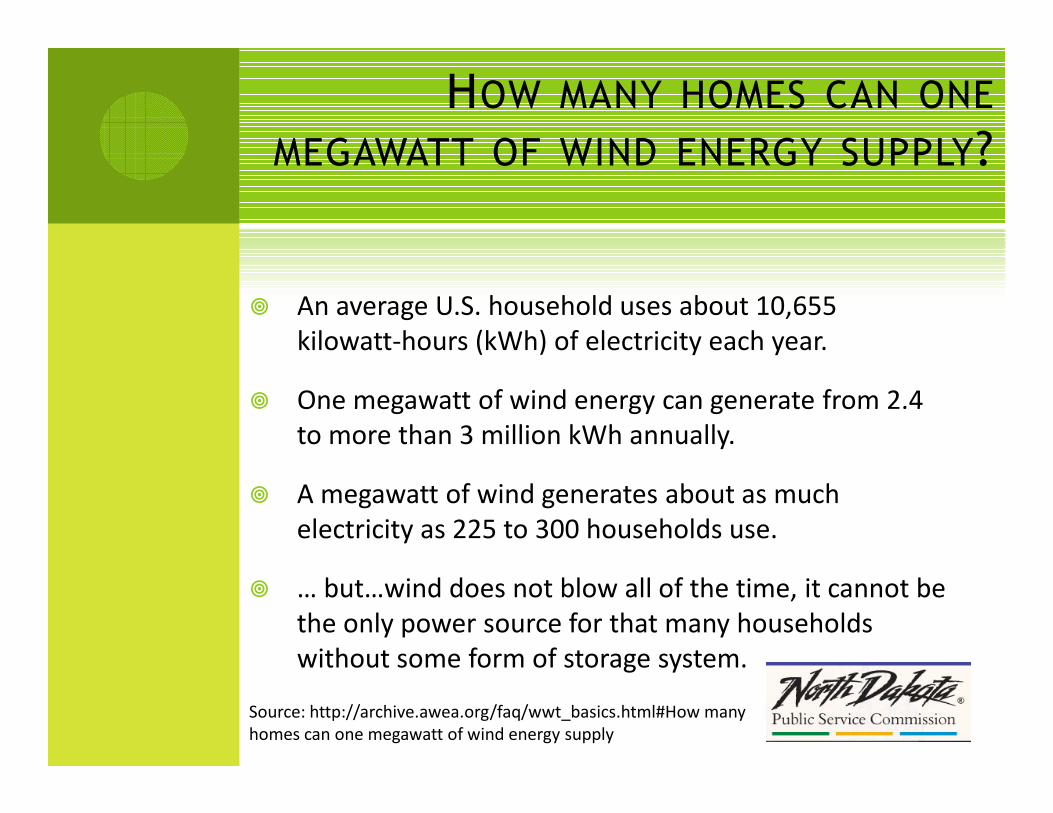
HOW MANY HOMES CAN ONE
MEGAWATT OF WIND ENERGY SUPPLY?
� An average U.S. household uses about 10,655
kilowatt-hours (kWh) of electricity each year.
� One megawatt of wind energy can generate from 2.4 � One megawatt of wind energy can generate from 2.4
to more than 3 million kWh annually.
� A megawatt of wind generates about as much
electricity as 225 to 300 households use.
� … but…wind does not blow all of the time, it cannot be
the only power source for that many households
without some form of storage system.
Source: http://archive.awea.org/faq/wwt_basics.html#How many
homes can one megawatt of wind energy supply
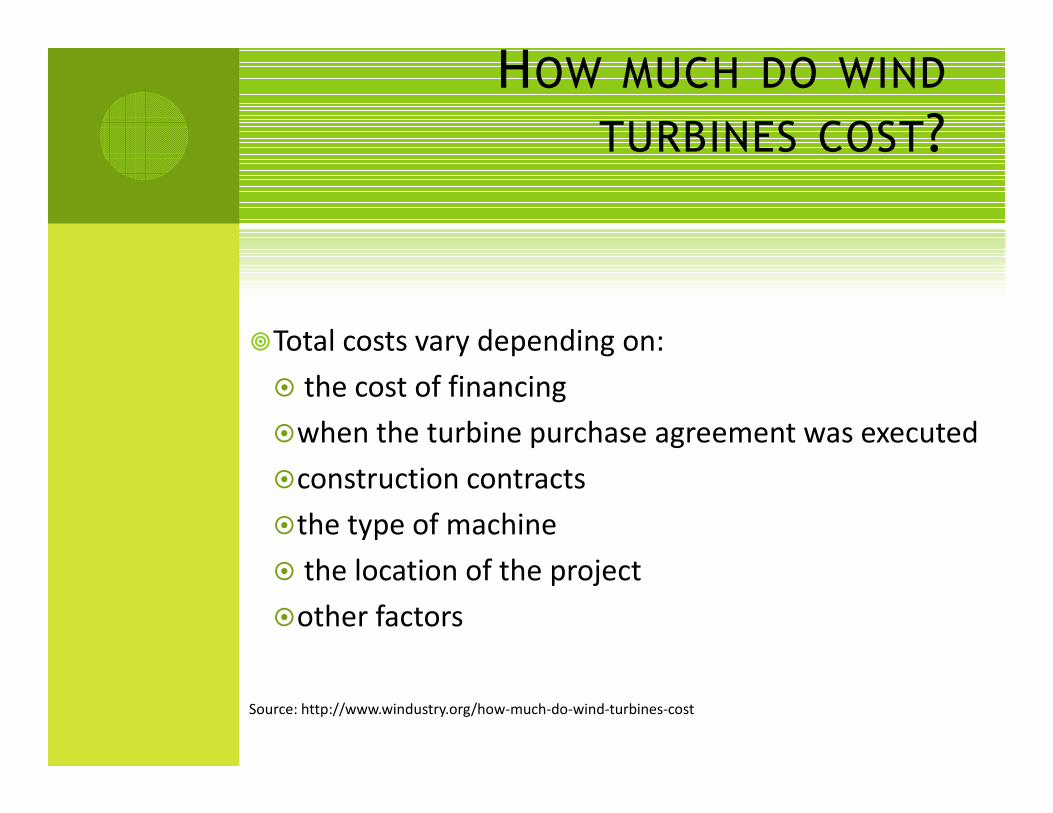
HOW MUCH DO WIND
TURBINES COST?
�Total costs vary depending on:
� the cost of financing
�when the turbine purchase agreement was executed
�construction contracts
�the type of machine
� the location of the project
�other factors
Source: http://www.windustry.org/how-much-do-wind-turbines-cost
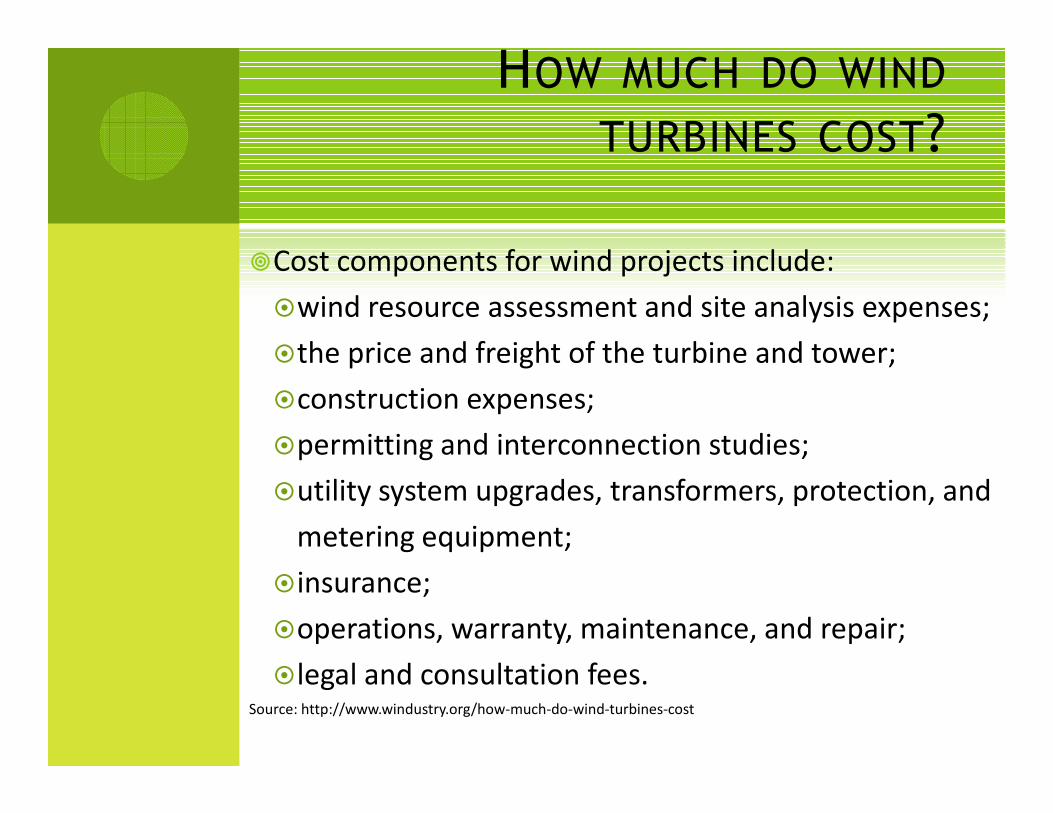
HOW MUCH DO WIND
TURBINES COST?
�Cost components for wind projects include:
�wind resource assessment and site analysis expenses;
�the price and freight of the turbine and tower;
�construction expenses; �construction expenses;
�permitting and interconnection studies;
�utility system upgrades, transformers, protection, and
metering equipment;
�insurance;
�operations, warranty, maintenance, and repair;
�legal and consultation fees. Source: http://www.windustry.org/how-much-do-wind-turbines-cost
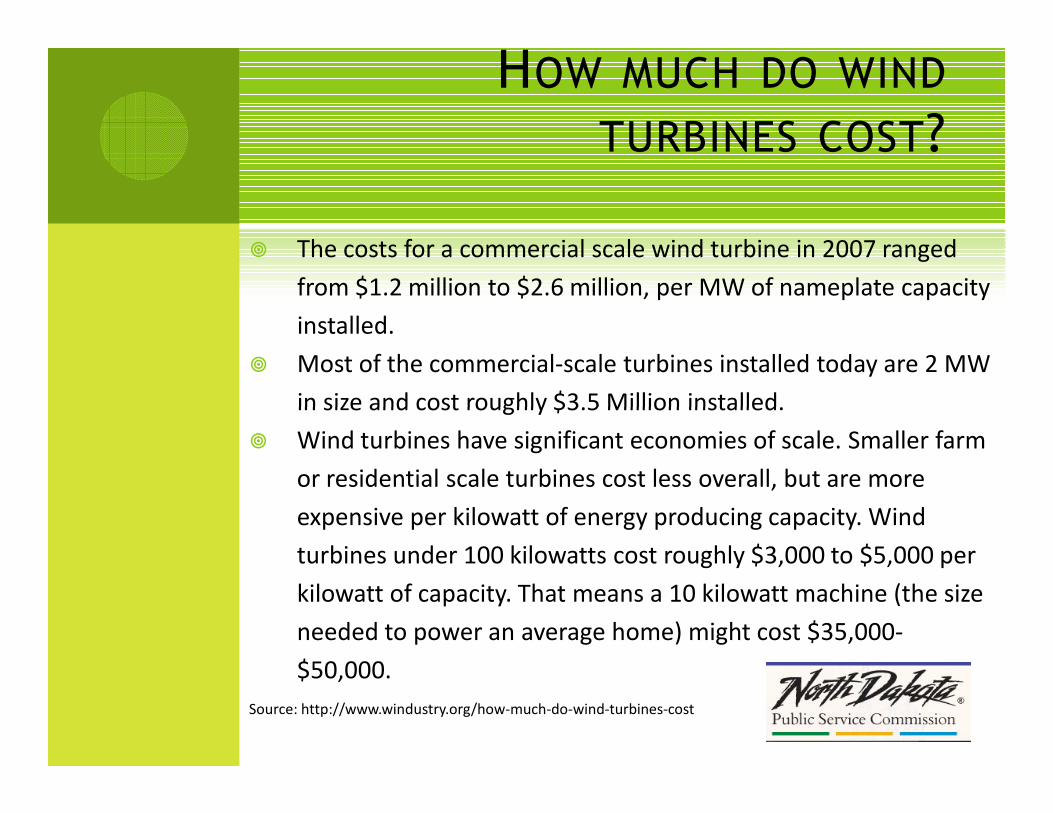
HOW MUCH DO WIND
TURBINES COST?
� The costs for a commercial scale wind turbine in 2007 ranged
from $1.2 million to $2.6 million, per MW of nameplate capacity
installed.
� Most of the commercial-scale turbines installed today are 2 MW
in size and cost roughly $3.5 Million installed. in size and cost roughly $3.5 Million installed.
� Wind turbines have significant economies of scale. Smaller farm
or residential scale turbines cost less overall, but are more
expensive per kilowatt of energy producing capacity. Wind
turbines under 100 kilowatts cost roughly $3,000 to $5,000 per
kilowatt of capacity. That means a 10 kilowatt machine (the size
needed to power an average home) might cost $35,000-
$50,000.
Source: http://www.windustry.org/how-much-do-wind-turbines-cost
POTENTIAL LEGISLATIVE
ISSUES
� Allocation of wind rights
� Setbacks
� Bonding
� Decommissioning
� Leasing requirements
WIND LEASES
� North Dakota has statutory requirements – North
Dakota Century Code chapter 17-04
� Severance of wind rights precluded
� Five year development period to maintain lease
� Statutory lease provisions

QUESTIONS?
North Dakota Public Service Commission
Tony Clark, Commissioner
Brian P. Kalk, Commissioner
Kevin Cramer, Commissioner
www.psc.nd.gov
701-328-2400