wine market value chain profile 2011-12. · pdf filea profile of the south african wine market...
TRANSCRIPT

A PROFILE OF THE SOUTH AFRICAN WINE MARKET VALUE CHAIN
2011
Directorate Marketing Private Bag X 15
Arcadia 0007
Tel: 012 319 8455 Fax: 012 319 8131
E-mail: [email protected] www.daff.gov.za
2
RECENT DEVELOPMENTS For the most part of the first decade of the second millennium, the wine industry in South Africa experienced a significant swing towards red wine production – moving from 18% of planting in 1996 to 44% in 2008. This gave rise to a surplus production position putting downward pressure on producer prices. Given that the local demand for wine, red wine in particular, did not match the increased supply, the local industry was forced to enter the export market in a much more aggressive way than ever before. No wonder then the export, as percentage of local production increased from 21% in 1999 to 54% in 2008. Despite fluctuations in the rand exchange rates over this period, the general trend was downwards, helping to maintain export profitability. The inflationary conditions coupled with pressure on disposable income have resulted in consumers trading down. This obviously became much more price conscious. The South African wine consumer in general is regarded as more price conscious and less likely to venture into the higher priced products. In 2008 the demand for white wine has weakened whilst red wine sales showed a moderate increase. However, as far as red wine is concerned, the supply / demand position has since moved into equilibrium.

3
Table of Contents
1. DESCRIPTION OF THE INDUSTRY 5
1.1 Production areas 6
1.2 Production 13
1.3 Deregulation of markets and re-regulation of labor 15
1.4 Consumption 16
2. MARKET STRUCTURE 17
2.1 Domestic markets and prices 19
3. EXPORTS VOLUMES 21
3.1 Provincial and district export values of South African wines 25
3.2 Share analysis 40
4. MARKET INTELIGENCE 47
4.1 Competitiveness of South African wine exports 55
5. MARKET ACCESS 67
5.1 Tariff, quotas and the price entry system 67
5.2 The EU-South Africa wine agreement and its implications 87 5.2.1 Rules on additives, processes and what is natural wine 88 5.2.2 Voluntary standards 89 5.2.3 British Retailer Consortium (BRC) Global Standard – Food 90 5.2.4 The Integrated Production of Wine (IPW) Scheme 91
5.3 Entry barriers and rules of participation in the UK retail market 91 5.3.1 Elements of an industrial convention: Delivering basic quality 91 5.3.2 Elements of a market convention: Delivering price and promotions 93
5.4 Entry barriers and rules of participation in other end-markets 93
5.4.1 Netherlands 93 5.4.2 Sweden 93 5.4.3 Germany 94 5.4.4 USA 94

4
6. REGULATORY FRAMEWORKS 95
6.1 The wine of Origin Scheme 95 6.1.1 Origin 95 6.1.2 Cultivar 98 6.1.3 Certification system 98
7. THE VALUE CHAIN FOR WINE IN SOUTH AFRICA 99
8. ORGANIZATIONAL ANALYSES 104
8.1 FORMAL INSTITUTIONS AND ORGANIZATIONS 104
8.2 The Official SAWIS picture 110
8.3 Strengths, Weaknesses Opportunities and Threats (SWOT) analysis 112
8.4 Business opportunities and challenges 113
9. EMPOWERMENT & TRANSFORMATION IN THE SECTOR 113
9.1 The transformation of the industry 113
9.2 BEE in the wine industry 115
10. ACKNOWLEDGEMENTS 118
5
1. DESCRIPTION OF THE INDUSTRY The wine industry in South African context is much wider than signified by the ordinary meaning of the word “wine”. Brandy and its building blocks (wine for brandy and distilling wine) have always formed a significant part of South African wine industry. In recent years, grape juice concentrate for use in non-alcoholic beverages, and not just for sweetening of wine, have come to the fore. The South African wine industry thus encompasses wine (natural, fortified and sparkling), wine for brandy, distilling wine, brandy and other spirits distilled from distilling wine, and grape juice and grape juice concentrate for use in non-alcoholic products. Wine products includes the following
• Natural wine is a non fortified and non sparkling wine, including perle wine which is wine carbonated to the extend that the pressure in the container in which it is sold is between 75 and 300 kPa. It includes any grape juice or must and grape juice or must concentrate used in the sweetening of such natural wine.
• Fortified wine is a non-sparkling wine which has been fortified with wine spirit. It includes the volume of wine spirit used in the fortification process.
• Sparkling wine is carbonated (either by fermentation or by impregnation with carbon dioxide) to the extent that the pressure in the container in which it is sold is more than 300 kPa. It includes any grape juice or must and grape juice or must concentrate used in the sweetening of such sparkling wine.
Wine for brandy is wine specially prepared for double distillation in a pot still and then, as distillate, matured for a period of at least three years in oak casks with capacity of more than 340 litres. Distilling wine is wine specially prepared for distillation of spirits intended for use in brandy or other spirits, for fortification of wine for industrial purposes. Grape juice concentrate and grape juice refers to unfermented, undiluted or concentrated juice from grapes destined for use in non-alcoholic products such as fruit juices. The wine industry in the Western Cape (excluding tourism) supported almost 200 000 jobs in 2008. The industry contributed R14, 214 billion to the Western Cape economy. This amounted to approximately 7.3% of the total provincial Gross Domestic Product of the Western Cape. When assessing the contribution that was made to the national economy’s GDP, an amount of R26, 223 billion or 1,95% was added to the South African economy. The wine industry is an important contributor to the economy of the Western Cape region of South Africa. Perhaps, even more important than the direct economic impact of employment and foreign exchange generation is the unique position of wine (and to some extend wine tourism) in generating images of South Africa abroad.
6
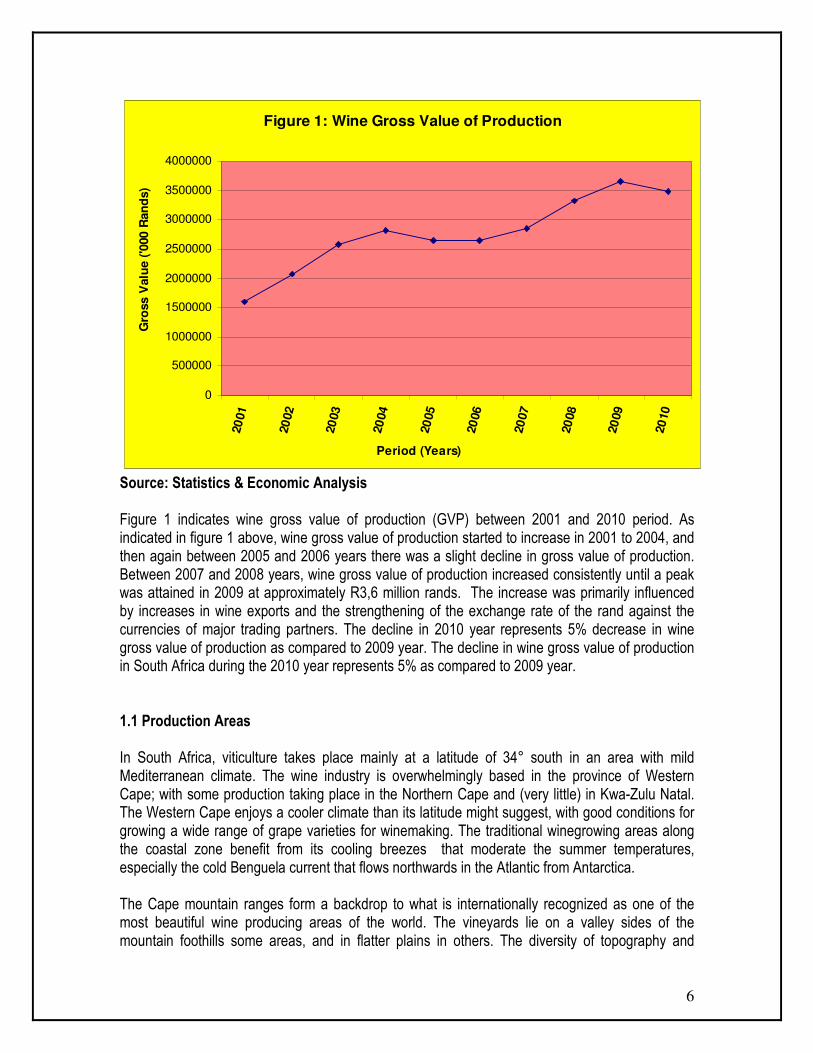
Figure 1: Wine Gross Value of Production
0
500000
1000000
1500000
2000000
2500000
3000000
3500000
4000000
20
01
20
02
20
03
20
04
20
05
20
06
20
07
20
08
20
09
20
10
Period (Years)
Gro
ss V
alu
e (
'000 R
an
ds)
Source: Statistics & Economic Analysis Figure 1 indicates wine gross value of production (GVP) between 2001 and 2010 period. As indicated in figure 1 above, wine gross value of production started to increase in 2001 to 2004, and then again between 2005 and 2006 years there was a slight decline in gross value of production. Between 2007 and 2008 years, wine gross value of production increased consistently until a peak was attained in 2009 at approximately R3,6 million rands. The increase was primarily influenced by increases in wine exports and the strengthening of the exchange rate of the rand against the currencies of major trading partners. The decline in 2010 year represents 5% decrease in wine gross value of production as compared to 2009 year. The decline in wine gross value of production in South Africa during the 2010 year represents 5% as compared to 2009 year. 1.1 Production Areas In South Africa, viticulture takes place mainly at a latitude of 34° south in an area with mild Mediterranean climate. The wine industry is overwhelmingly based in the province of Western Cape; with some production taking place in the Northern Cape and (very little) in Kwa-Zulu Natal. The Western Cape enjoys a cooler climate than its latitude might suggest, with good conditions for growing a wide range of grape varieties for winemaking. The traditional winegrowing areas along the coastal zone benefit from its cooling breezes that moderate the summer temperatures, especially the cold Benguela current that flows northwards in the Atlantic from Antarctica. The Cape mountain ranges form a backdrop to what is internationally recognized as one of the most beautiful wine producing areas of the world. The vineyards lie on a valley sides of the mountain foothills some areas, and in flatter plains in others. The diversity of topography and
7
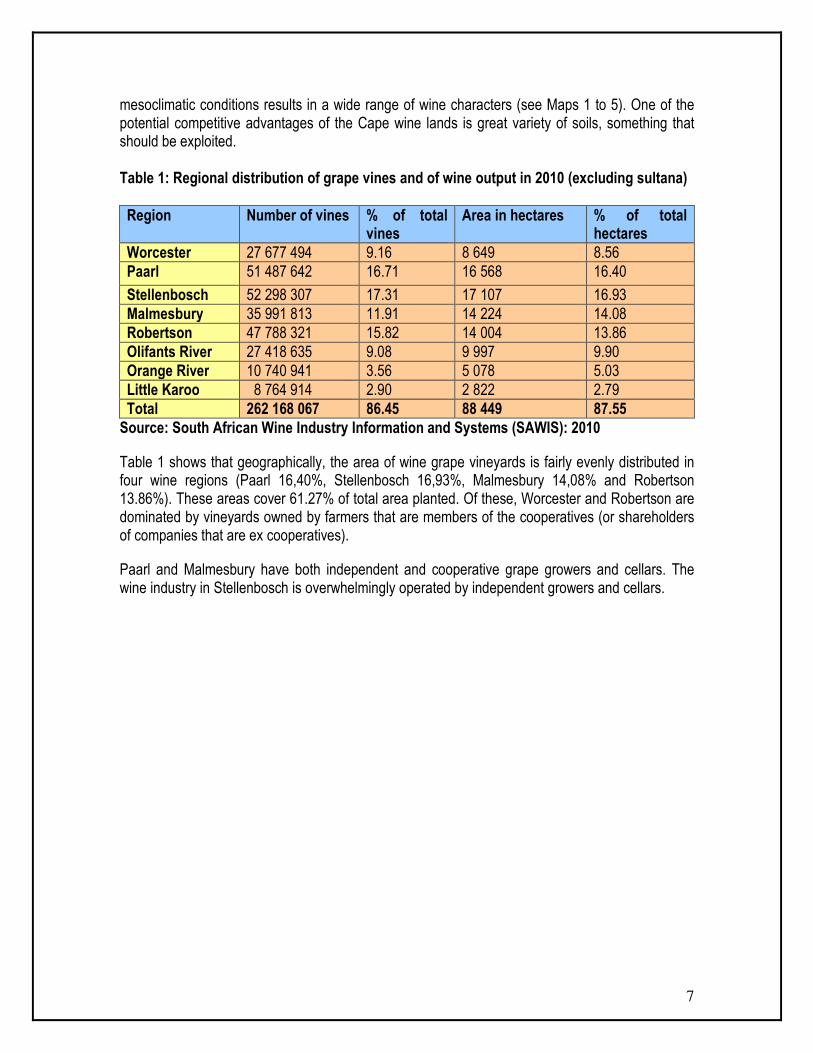
mesoclimatic conditions results in a wide range of wine characters (see Maps 1 to 5). One of the potential competitive advantages of the Cape wine lands is great variety of soils, something that should be exploited. Table 1: Regional distribution of grape vines and of wine output in 2010 (excluding sultana) Region Number of vines % of total
vines Area in hectares % of total
hectares Worcester 27 677 494 9.16 8 649 8.56 Paarl 51 487 642 16.71 16 568 16.40
Stellenbosch 52 298 307 17.31 17 107 16.93 Malmesbury 35 991 813 11.91 14 224 14.08 Robertson 47 788 321 15.82 14 004 13.86 Olifants River 27 418 635 9.08 9 997 9.90 Orange River 10 740 941 3.56 5 078 5.03 Little Karoo 8 764 914 2.90 2 822 2.79 Total 262 168 067 86.45 88 449 87.55 Source: South African Wine Industry Information and Systems (SAWIS): 2010
Table 1 shows that geographically, the area of wine grape vineyards is fairly evenly distributed in four wine regions (Paarl 16,40%, Stellenbosch 16,93%, Malmesbury 14,08% and Robertson 13.86%). These areas cover 61.27% of total area planted. Of these, Worcester and Robertson are dominated by vineyards owned by farmers that are members of the cooperatives (or shareholders of companies that are ex cooperatives).
Paarl and Malmesbury have both independent and cooperative grape growers and cellars. The wine industry in Stellenbosch is overwhelmingly operated by independent growers and cellars.

8
Map 1: Production areas of South Africa – Geographical Units
Source: SAWIS Map 2: Production areas of South Africa – Regions

9
Source: SAWIS

10
Map 3: Production areas of South Africa – Districts

11
Source: SAWIS Map 4: Production areas of South Africa – Wards (Western Cape)
Source: SAWIS

12
Map 5: Production areas of South Africa – Wards (Northern Cape) Source: SAWIS

13
1.2 Production
Figure 2: Area under wine grape vineyards (excluding sultana)
Figure 2: Total area under wine grape vineyards
(Excluding Sultana)
90000
92000
94000
96000
98000
100000
102000
104000
20
01
20
02
20
03
20
04
20
05
20
06
20
07
20
08
20
09
20
10
Period (Years)
Are
a p
lan
ted
(h
a)
Source: SAWIS Figure 2 illustrates total area under wine grape vineyards (excluding sultana) between 2001 and 2010 period. The graph further illustrates that the total area planted under wine grape vineyards (excluding sultana) has increased dramatically in the last decade, from 94 500 ha in 2001 to 102 00 ha in 2006 year and 101 000 ha in 2010 year. The figure also illustrates that between 2007 and 2010 years, there was a slight decline in the total area under wine grape vineyards. The figure further illustrates that in 2006 a peak was attained in total area under wine grape vineyards at approximately 102 000 ha. The decline in total area under wine grape vineyards during the 2010 year represents 0.24% as compared to 2009 year.
14
Figure 3: Total production of wine products
0
100000000
200000000
300000000
400000000
500000000
600000000
700000000
800000000
9000000002
00
1
20
02
20
03
20
04
20
05
20
06
20
07
20
08
20
09
20
10
Period (Years)
Win
e p
rod
uc
ts (
Gro
ss
lit
res
)
Natural wine (Gross litres) Wine for Brandy (Gross litres)
Distilling wine (Gross litres) Grape juice concentrate (Gross litres)
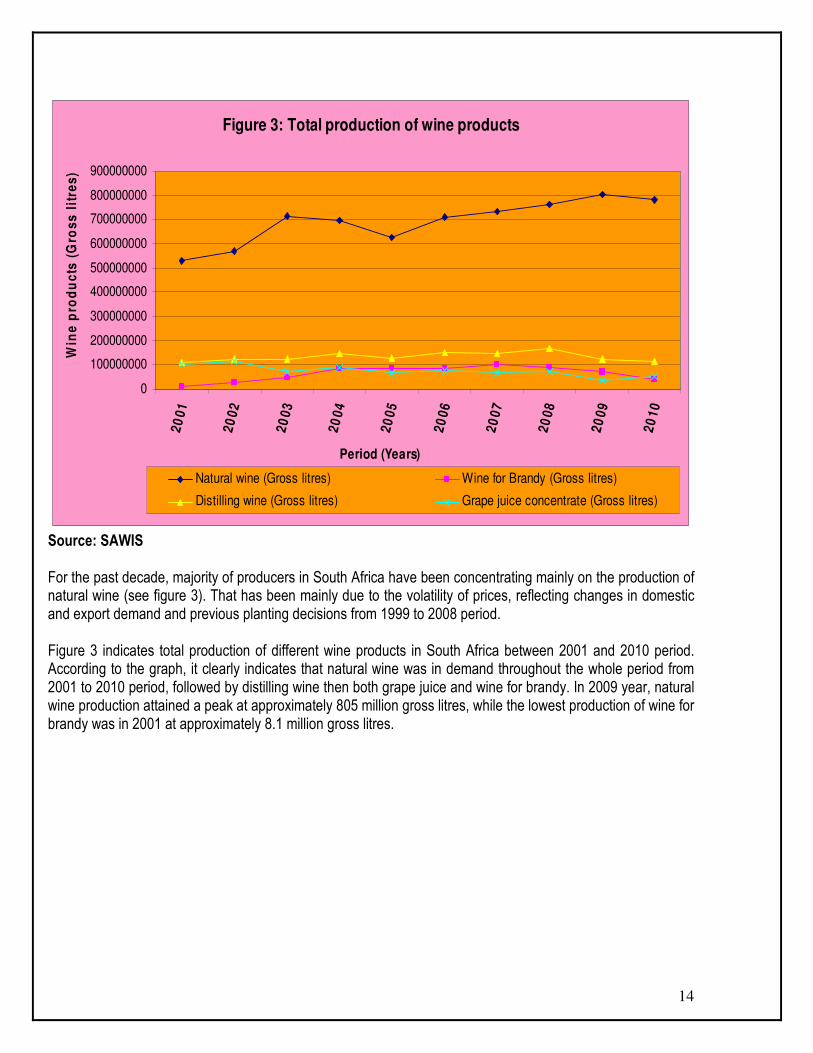
Source: SAWIS For the past decade, majority of producers in South Africa have been concentrating mainly on the production of natural wine (see figure 3). That has been mainly due to the volatility of prices, reflecting changes in domestic and export demand and previous planting decisions from 1999 to 2008 period. Figure 3 indicates total production of different wine products in South Africa between 2001 and 2010 period. According to the graph, it clearly indicates that natural wine was in demand throughout the whole period from 2001 to 2010 period, followed by distilling wine then both grape juice and wine for brandy. In 2009 year, natural wine production attained a peak at approximately 805 million gross litres, while the lowest production of wine for brandy was in 2001 at approximately 8.1 million gross litres.
15
Figure 4: Good wine production vs. Average wine producer prices
0
100000000
200000000
300000000
400000000
500000000
600000000
700000000
800000000
90000000020
01
20
02
20
03
20
04
20
05
20
06
20
07
20
08
20
09
20
10
Period (Years)
pro
du
cti
on
(G
ros
s l
itre
s)
0
5000
10000
15000
20000
25000
Av
era
ge
pro
du
ce
r p
ric
es
(Ce
nts
/lit
re)
Good wine production (Gross litres) Average producer prices (Cents/litre)
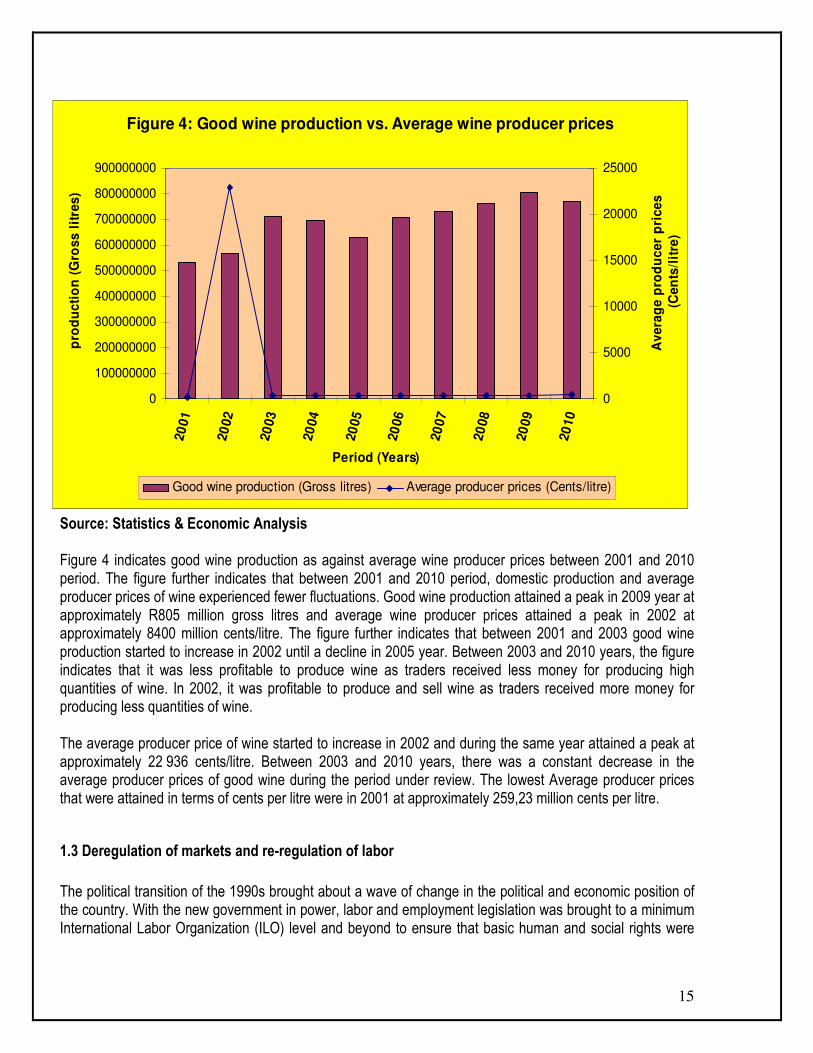
Source: Statistics & Economic Analysis Figure 4 indicates good wine production as against average wine producer prices between 2001 and 2010 period. The figure further indicates that between 2001 and 2010 period, domestic production and average producer prices of wine experienced fewer fluctuations. Good wine production attained a peak in 2009 year at approximately R805 million gross litres and average wine producer prices attained a peak in 2002 at approximately 8400 million cents/litre. The figure further indicates that between 2001 and 2003 good wine production started to increase in 2002 until a decline in 2005 year. Between 2003 and 2010 years, the figure indicates that it was less profitable to produce wine as traders received less money for producing high quantities of wine. In 2002, it was profitable to produce and sell wine as traders received more money for producing less quantities of wine. The average producer price of wine started to increase in 2002 and during the same year attained a peak at approximately 22 936 cents/litre. Between 2003 and 2010 years, there was a constant decrease in the average producer prices of good wine during the period under review. The lowest Average producer prices that were attained in terms of cents per litre were in 2001 at approximately 259,23 million cents per litre.
1.3 Deregulation of markets and re-regulation of labor The political transition of the 1990s brought about a wave of change in the political and economic position of the country. With the new government in power, labor and employment legislation was brought to a minimum International Labor Organization (ILO) level and beyond to ensure that basic human and social rights were

16
afforded to all the workers under the law. The extension of Labor Relations Act of 1995 and the free movement of unions in the sector led to bursts of union activity in agriculture. The extension of basic human, social and economic rights to farm workers resulted, inter alia, in increased levels of casualization and externalization – which were carried out to mitigate the consequences of increased labour costs and the costs of complying with labour legislation. This did not take place overnight, by the mid-1990s, farmers had developed new technologies as a result of industry restructuring (deregulation, opening of the export market), but that labour practices had remained unchanged. It was also found out that employment had grown in wine farms (due to the major new plantings that took place in the 1990s) and that there was no apparent decrease in the size of permanent labour force, despite the passing of new labour legislation. At that time, wine farms were said to be still stuck in a low productivity and low wage model, with no formal contracts between farm workers and owners, no middle management (except in larger farms), and very low levels of unionization. The first signs of labour restructuring had emerged in some farms, where owners had cut their permanent work force, adopted technologies that minimized the need for such workforce, and were restricting the security of occupation on farms by hiring younger workers. These practices were to become the norm of labour management in wine farms in the following decade. In the mid-2000s, they characterized the changes in the wine industry resulting from deregulation, opening of export markets and regulation of labour a ‘double divide’. The first divide entails the winners and losers among cellars and farmers, depending on how positioned they are to make use of global export opportunities. The second divide is among the workers that remain in the permanent workforce (usually skilled ones) and those who have been casualized and externalized, and are now hired through labour contractors. This movement towards the minimization of a permanent labour force and the casualization of unskilled and low-skilled labour is not confined to the wine industry, but it is part of a wider process taking place in the Western Cape and elsewhere in South Africa, especially in labour-intensive farms. These casual workers are excluded from the basic entitlements that permanent workers have now gained. Despite reporting wages that may not be lower than permanent workers, casual workers face higher livelihood vulnerability and insecurity.
1.4 Consumption

17
Table 2: Per capita consumption of wine products on the domestic markets in 2010 year Year
Wine consumption – litres per capita
Natural wine Sparkling wine Fortified wine Total
2001 8.19 0.15 0.66 9.00 2002 8.03 0.17 0.68 8.88 2003 7.00 0.18 0.68 7.86 2004 6.73 0.18 0.68 7.59 2005 6.40 0.18 0.68 7.26 2006 6.31 0.19 0.71 7.21 2007 6.53 0.21 0.71 7.45 2008 6.43 0.21 0.69 7.33 2009 6.04 0.17 0.68 6.89 2010 6.18 0.18 0.67 7.03 Source: SAWIS Table 2 depicts per capita consumption of wine products in the domestic markets during the 2010 year. The table further depicts that the local consumption of wine has slightly declined in 2010 despite a rapid growth in the volume of exports in the last couple of years. South Africans have continued to consume all types of alcohol and have consumed increasing amounts of beer and spirits. At the same time the consumption of wine is hardly growing. The wine industry will therefore struggle to maintain a share in the market for alcoholic beverages in both the global and local markets.
2. MARKET STRUCTURE
The South African wine industry has gone through a tough period of major changes over the past decade, as largely reflected by the changes in its economic structure and institutional framework. Its re-introduction into the world trade setup has brought huge opportunities, as reflected by the increase in exports but on the other hand has brought pressure on its competitiveness, both locally and abroad. Table 3: Extend of the total South African wine industry Grapes crushed in tons
2008 2009 2010 2010/2009 TREND
White varieties 885 044 864 933 812 894 94.0 Red varieties 454 833 427 650 375 236 87.7 Table grapes 85 735 55 037 73 179 133.0 Total 1 425 612 1 347 620 1 261 309 3 147

18
Production in million litres
2008 2009 2010 2010/2009 TREND
Natural wine 763.30 805.1 780.7 97.0
Wine for brandy 86.6 71.4 39.6 55.5 Distilling wine 166.6 122.1 113.3 92.8 Grape juice concentrate and grape juice
72.5 34.8 51.2 147.1
Total 1 089.00 1 033.4 984.8 95.3 Domestic sales (wine) in million litres
2008 2009 2010 2010/2009 TREND
Natural wine 312.30 296.8 304.4 102.7 Fortified wine 33.70 33.4 33.1 99.1 Sparkling wine 10.1 8.5 8.9 104.7 Brandy @ absolute alcohol
19.3 18.1 17.0 93.9
Total 375.40 356.8 363.4 400.4 Exports (wine) in million litres
2008 2009 2010 2010/2009 TREND
Natural wine 407.4 389.1 371.0 95.3 Fortified wine 0.40 0.3 0.4 133.3 Sparkling wine 4.00 6.2 7.2 116.1 Total 411.80 395.6 378.6 95.7 Source: SAWIS Table 3 shows the extent of the total South African wine industry between 2008 and 2010 period. Out of a total of 1.26 million tons of grapes crushed in 2010 year, the trend in terms of percentages was 94.0% of white varieties, 87.7% were red varieties and 133% were table grapes. Total production was slightly over 1 billion litres, of which 97.0% was natural wine and the brandy was (55.5%), distilling wine (92.8%) and Grape juice concentrate and grape juice (147.1%). Natural wine sales constitute the vast majority of sales in both the domestic market (102.7%) and in the export market (95.3%). Reds make up 93.3% of domestic sales, even though they account for 55.5% of production. Fortified wines and sparkling wines are relatively small niches and sell almost exclusively on the domestic market.
By comparison, the industry in 2008 exhibited similar levels of grape production and similar make up in terms of production wine; rebate/distilling wine and non-alcoholic. However, natural wine exports represented approximately 95.5% of total sales (by volume) as the industry had just started to gear up for the international wine markets following the end of sanctions.

19
2.1 Domestic markets and prices
There is an extensive distribution of wholesalers and retailers, as well as producer cellars, estates and other organizations which market wine directly. They ensure that the product reach consumers around the country. The opposite picture applies to private cellars and producing wholesalers. Table 4: Varieties utilized for total wine making purposes during 2010
% of variety crushed by Variety Total Tons Private Wine
Cellars Producer Cellars
Producing Wholesalers
Chenin Blanc 270 391 9.2 88.1 2.7 Colombar(d) 266 504 3.9 95.7 0.4 Muscat dÁlexandrie
30 021 9.1 `90.3 0.6
Sauvignon Blanc 85 025 32.4 52.4 15.2 Cape Riesling 8 123 12.5 84.9 2.6 Chardonnay 71 543 21.8 69.9 8.4 Weisser Riesling 998 46.7 39.5 13.8 Semillon 14 620 22.9 69.8 7.3 Other white varieties
65 668 17.4 79.4 3.2
Table grapes 52 286 13.2 81.0 5.8 Total white varieties
865 180 12.0 84.0 3.9
Cabernet Sauvignon
84 863 27.8 52.0 20.1
Cinsaut 26 140 9.8 86.8 3.4
Pinotage 53 473 21.9 68.5 9.5 Merlot 58 479 28.8 52.7 18.4 Shiraz 87 882 25.2 59.8 15.0 Ruby Cabernet 30 396 6.9 91.7 1.3 Cabernet Franc 6 429 44.2 34.2 21.6 Pinot Noir 4 053 63.8 6.0 30.2 Other red varieties
23 520 42.3 45.4 12.3
Table grapes 20 893 0.1 99.9 - Total red varieties 396 129 23.8 62.8 13.4 Total white and red
1 261 309 15.7 77.4 6.9
Source: SAWIS Table 4 illustrates that cooperatives and ex-cooperatives (producer cellars) still crush approximately 80% of all grapes used for wine making locally. Along with a few producing wholesalers, they are the ones that can

20
provide economies of scale, competitive pricing and large volumes. These are essential requirements for supermarket chains to place wines on the shelf. The fact that cooperatives focus on run of the mill wines is an open secret, although it is perhaps insufficiently remarked in industry publications how much they have improved in the last decade in terms of quality – the result of technical improvements in both wine making and viticulture. Cooperatives crush a much higher proportion of white varieties than red, and a much lower proportion of their average share of highly sought varieties such as Sauvignon Blanc, Cabernet Sauvignon and Shiraz. Yet, they are still responsible for crushing over half of the production of these varieties, with the exception of Sauvignon Blanc. This is mainly due to climatic reasons as well as many cooperative farmers are located in warmer areas that are not friendly to this grape variety Table 5: Average prices of wine sold in bulk in South Africa
Varieties Cent per litre 2005 2006 2007 2008 2009 2010
All varieties 338.35 338.42 334.87 340.67 384.21 413.48 Cabernet Sauvignon 596.76 476.23 430.49 451.74 539.66 583.72 Merlot 471.33 426.29 396.68 417.67 495.26 556.81 Pinotage 443.73 392.88 396.68 410.15 472.69 535.38 Shiraz 548.21 514.37 458.12 471.89 560.82 601.86 All red varieties 440.49 406.02 374.41 386.75 459.08 502.97 Chardonnay 494.22 495.11 474.14 481.54 523.90 530.75 Sauvignon Blanc 522.11 547.53 517.21 519.00 546.06 538.00 Colombar 277.70 293.68 297.46 297.23 314.72 328.17 Chenin Blanc 304.43 317.27 323.17 321.45 350.23 367.89 All white varieties 297.57 310.51 314.46 314.71 345.44 364.98 NB. Price excludes added wine spirit
Cent per litre Concentrate/Sweet must for sweetening
2005 2006 2007 2008 2009 2010 240.21 236.43 262.13 293.28 362.17 365.57
Cent per litre @ 10% ALC/VOL
Wine for brandy 2005 2006 2007 2008 2009 29010 207.30 210.59 222.43 225.45 236.33 261.14
Cent per litre @ 10% ALC/VOL
Distilling wine 2005 2006 2007 2008 2009 2010 97.43 94.10 93.36 95.50 97.83 109.66
Table 5 shows average prices of wine sold in bulk in South Africa between 2005 and 2010 period. Table 5 further shows the global red wine glut that started in 2005 and has continued in the following 5 years. Chenin Blanc in 2009 was trading at 367.89 cents per litre as compared to 350.23 cents per litre in 2009. The price of wine for brandy has increased at an increasing rate from 2005 to 2010 and the price of distilling wine declined in 2006, 2007. In 2008 the price of distilling wine started to increase to 95.50 cents per litre until a peak was

21
attained in 2010 at approximately 109.66 cents per litre. Some cooperatives indicated that in 2010, they were profiting more from a hectare of vineyard that was being managed to produce distilling wine than from a hectare managed for table wine production. Globally, the wine industry is generally highly price responsive. Price movements, especially in global context, characterized by over production, high subsidized regimes, surplus removal schemes and export promotion support, fluctuate considerably, causing uncertainty and instability.
3. EXPORTS OF WINE OF FRESH GRAPES
This is a review of world level trade data for wines of fresh grapes, including fortified wines by South Africa between 2002 and 2010 period.
Figure 5: Exports volumes of wine of fresh grapes
(including fortfied wines) to various regions
0
1000000
2000000
3000000
4000000
5000000
Period (Years)
Exp
ort
s V
olu
mes
('000 l
itre
s)
Africa 1393702 751594 944000 961411 886602 1689415 2878630 3901246 3989565
Americas 93845 99752 144357 203269 174805 175863 194361 359172 333890
Asia 62165 92295 96295 98875 130751 1176662 270321 2317799 514215
Europe 871863 1643881 863465 941060 851457 1476093 962457 2798610 2826065
Oceania 39403 59410 25529 22356 12350 67639 103718 333004 294430
2002 2003 2004 2005 2006 2007 2008 2009 2010
Source: Quantec Figure 5 depicts exports volumes of wines of fresh grapes (including fortified wines) from South Africa to various regions between 2002 and 2010 period. The figure further depicts that the major export market for wines of fresh grapes from South Africa to the world was Africa followed by Europe and Asia. Exports of wine of fresh grapes from South Africa to Africa started to increase in 2002, with a slight decline between 2003 and 2006 years. In 2007 to 2009 years, exports of wine of fresh grapes from South Africa to Africa experienced an increase until a peak was attained in 2010 year at approximately 3.9 million litres. The figure also depicts that exports of wine of fresh grapes from South Africa to Europe attained a peak in 2010 year at approximately 2.8 million litres. The increase in exports of wines of fresh grapes from South Africa to Africa in the year 2010 represents 2.2% as compared to 2009 year.

22
Natural wine as a category makes up almost 99% of exports with the rest accounted by sparkling wine and fortified wines. Given the small size of exports of fortified wine, it is curious that the European Union (EU) forcefully insisted that South Africa drop the use of names ‘port’ and ‘sherry’ from exported products and that almost brought down the negotiations with South Africa on a bilateral trade agreement. Table 6: Types of exported wine and other liquor products (2010) in litres Types of wines and spirits
Bottled Bulk Total litres Litres AS % of
total per variety
Litres AS % of total per variety
2010
Chardonnay 14 827 514 63.07 8 681 086 36.93 23 508 600 Sauvignon Blanc 17 104 738 78.77 4 610 663 21.23 21 715 401 Chenin Blanc 18 693 288 40.41 27 562 503 59.59 46 255 791 Other white wine 39 911 240 57.37 29 658 367 42.63 69 569 607 Blanc de Noir and Rose
13 343 179 51.32 12 657 825 48.68 26 001 004
Cabernet Sauvignon
14 710 723 73.48 5 309 867 26.52 20 020 590
Shiraz 15 389 874 81.78 3 428 003 18.22 18 817 877 Pinotage 9 021 816 60.93 5 784 561 39.07 14 806 377 Merlot 9 521 362 82.05 2 082 310 17.95 11 603 672 Other red wine 69 808 694 58.82 48 865 714 41.18 118 674 408 Subtotal natural wine
222 332 428 59.93 148 640 899 40.07 370 973 327
Fortified wine 401 700 100.00 - - 401 700 Sparkling wine 7 174 873 100.00 - - 7 174 873 Total wine 229 909 001 60.73 148 640 899 39.27 378 549 900
Source: SAWIS According to table 6, of the total exports in 2010, 60.73% was bottled wine and 39.27% was bulk wine. The varieties with the highest bottled-to-bulk export ratio are not surprisingly, noble varieties such as Shiraz, Cabernet Sauvignon, Sauvignon Blanc, Merlot and Chardonnay. The highest proportion of bulk exports is under ‘other red wines’. Table 7: Bottled and bulk natural wine exports by country in litres (2010)
Country Total (Bottled and bulk) White Red Blanc de
Noir/Rosé Total % of total
exports
UK 48 224 807 45 663 402 11 044 246 104 932 455 28.1 Germany 28 307 937 38 352 301 5 651 713 72 311 951 19.2 Sweden 13 484 770 24 104 596 687 540 38 276 906 9.4 Netherlands 10 729 053 12 339 834 3 771 053 26 839 940 8.4 Denmark 3 980 170 12 751 177 602 080 17 333 427 4.3 Canada 8 069 149 5 852 346 116 550 14 038 045 4.2
23
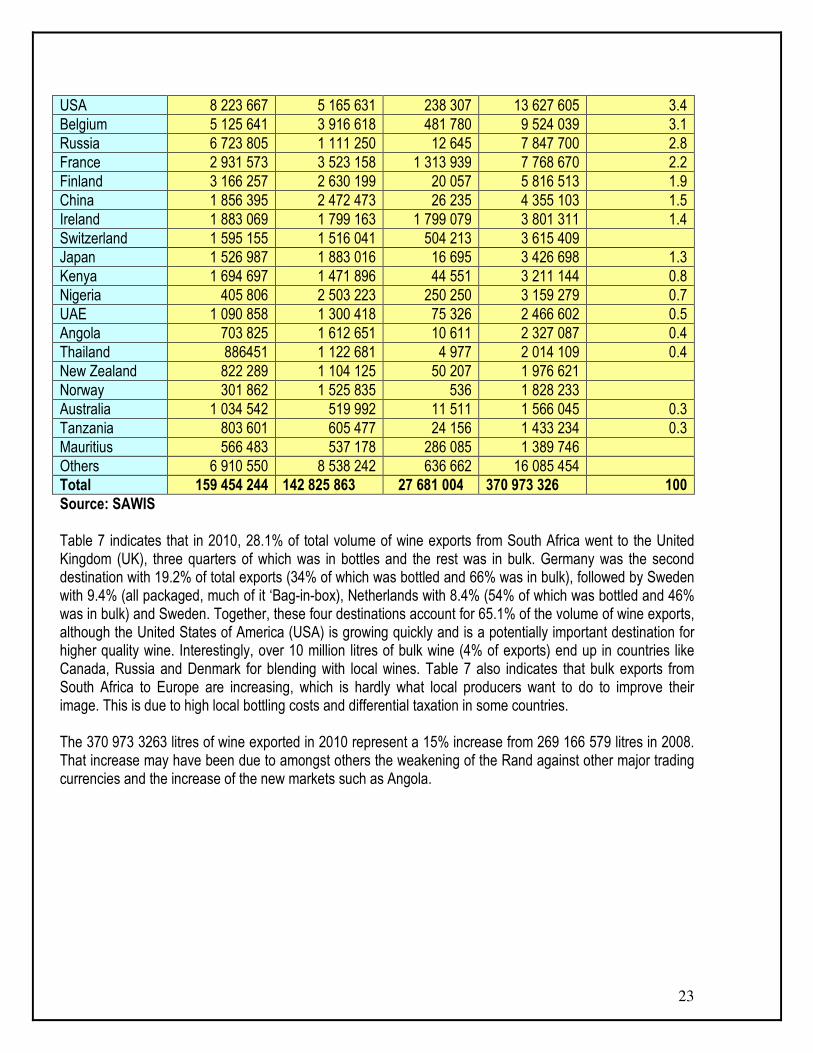
USA 8 223 667 5 165 631 238 307 13 627 605 3.4 Belgium 5 125 641 3 916 618 481 780 9 524 039 3.1 Russia 6 723 805 1 111 250 12 645 7 847 700 2.8 France 2 931 573 3 523 158 1 313 939 7 768 670 2.2 Finland 3 166 257 2 630 199 20 057 5 816 513 1.9 China 1 856 395 2 472 473 26 235 4 355 103 1.5 Ireland 1 883 069 1 799 163 1 799 079 3 801 311 1.4 Switzerland 1 595 155 1 516 041 504 213 3 615 409 Japan 1 526 987 1 883 016 16 695 3 426 698 1.3 Kenya 1 694 697 1 471 896 44 551 3 211 144 0.8 Nigeria 405 806 2 503 223 250 250 3 159 279 0.7 UAE 1 090 858 1 300 418 75 326 2 466 602 0.5 Angola 703 825 1 612 651 10 611 2 327 087 0.4 Thailand 886451 1 122 681 4 977 2 014 109 0.4 New Zealand 822 289 1 104 125 50 207 1 976 621 Norway 301 862 1 525 835 536 1 828 233 Australia 1 034 542 519 992 11 511 1 566 045 0.3 Tanzania 803 601 605 477 24 156 1 433 234 0.3 Mauritius 566 483 537 178 286 085 1 389 746 Others 6 910 550 8 538 242 636 662 16 085 454 Total 159 454 244 142 825 863 27 681 004 370 973 326 100 Source: SAWIS Table 7 indicates that in 2010, 28.1% of total volume of wine exports from South Africa went to the United Kingdom (UK), three quarters of which was in bottles and the rest was in bulk. Germany was the second destination with 19.2% of total exports (34% of which was bottled and 66% was in bulk), followed by Sweden with 9.4% (all packaged, much of it ‘Bag-in-box), Netherlands with 8.4% (54% of which was bottled and 46% was in bulk) and Sweden. Together, these four destinations account for 65.1% of the volume of wine exports, although the United States of America (USA) is growing quickly and is a potentially important destination for higher quality wine. Interestingly, over 10 million litres of bulk wine (4% of exports) end up in countries like Canada, Russia and Denmark for blending with local wines. Table 7 also indicates that bulk exports from South Africa to Europe are increasing, which is hardly what local producers want to do to improve their image. This is due to high local bottling costs and differential taxation in some countries. The 370 973 3263 litres of wine exported in 2010 represent a 15% increase from 269 166 579 litres in 2008. That increase may have been due to amongst others the weakening of the Rand against other major trading currencies and the increase of the new markets such as Angola.
24
Figure 6: Exports volumes of wine of fresh grapes
(including fortified wines) to Africa
0
500000
1000000
1500000
2000000
2500000
3000000
3500000
4000000
Period (Years)
Exp
ort
s v
olu
mes
('000 l
itre
s)
Eastern Africa Rest 279460 71031 136991 162928 122940 226715 173440 913457 233058
Middle Africa Rest 19374 4013 2169 2221 8685 10609 7009 17694 22261
Northern Africa 0 0 0 0 36 18 999 0 1035
Western Africa 15238 20405 19780 34396 21489 45068 95660 212567 211788
SADC 1079630 656145 785060 761866 733452 1407005 2601522 2757528 3521423
2002 2003 2004 2005 2006 2007 2008 2009 2010
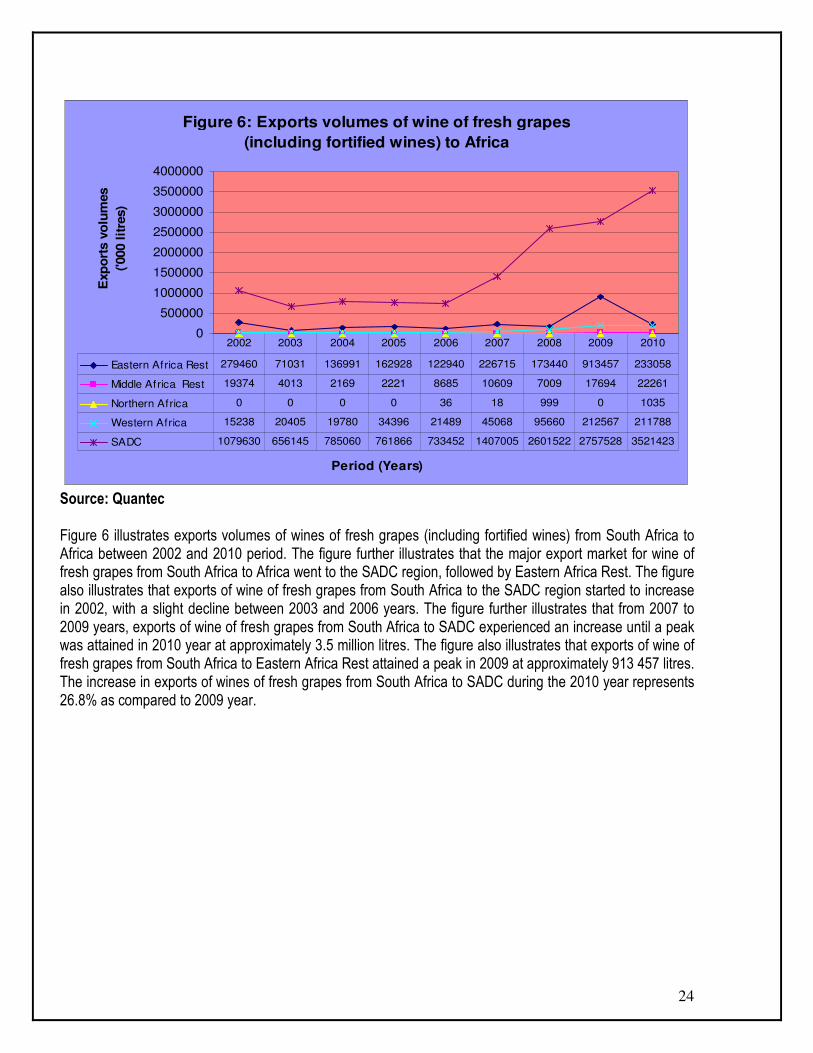
Source: Quantec Figure 6 illustrates exports volumes of wines of fresh grapes (including fortified wines) from South Africa to Africa between 2002 and 2010 period. The figure further illustrates that the major export market for wine of fresh grapes from South Africa to Africa went to the SADC region, followed by Eastern Africa Rest. The figure also illustrates that exports of wine of fresh grapes from South Africa to the SADC region started to increase in 2002, with a slight decline between 2003 and 2006 years. The figure further illustrates that from 2007 to 2009 years, exports of wine of fresh grapes from South Africa to SADC experienced an increase until a peak was attained in 2010 year at approximately 3.5 million litres. The figure also illustrates that exports of wine of fresh grapes from South Africa to Eastern Africa Rest attained a peak in 2009 at approximately 913 457 litres. The increase in exports of wines of fresh grapes from South Africa to SADC during the 2010 year represents 26.8% as compared to 2009 year.
25
Figure 7: Exports volumes of wines of fresh grapes
(including fortified wines) to SADC
0
500000
1000000
1500000
2000000
2500000
3000000
Period (Years)
Exp
ort
s V
olu
mes
('000 l
itre
s)
Angola 37819 167565 150129 430912 445079 975155 1973730 18312942574273
Democratic Republic of the Congo 7192 11334 43877 10365 7572 124510 43945 31034 65252
Mauritius 47379 53325 171171 61137 55834 64151 62569 107749 120985
Malaw i 35257 78510 88745 19374 6175 12107 21398 84374 153699
Mozambique 817658 202260 200818 133610 122689 105372 292448 139338 191404
Seychelles 15923 23465 34386 53122 12824 29490 17658 23857 27744
2002 2003 2004 2005 2006 2007 2008 2009 2010
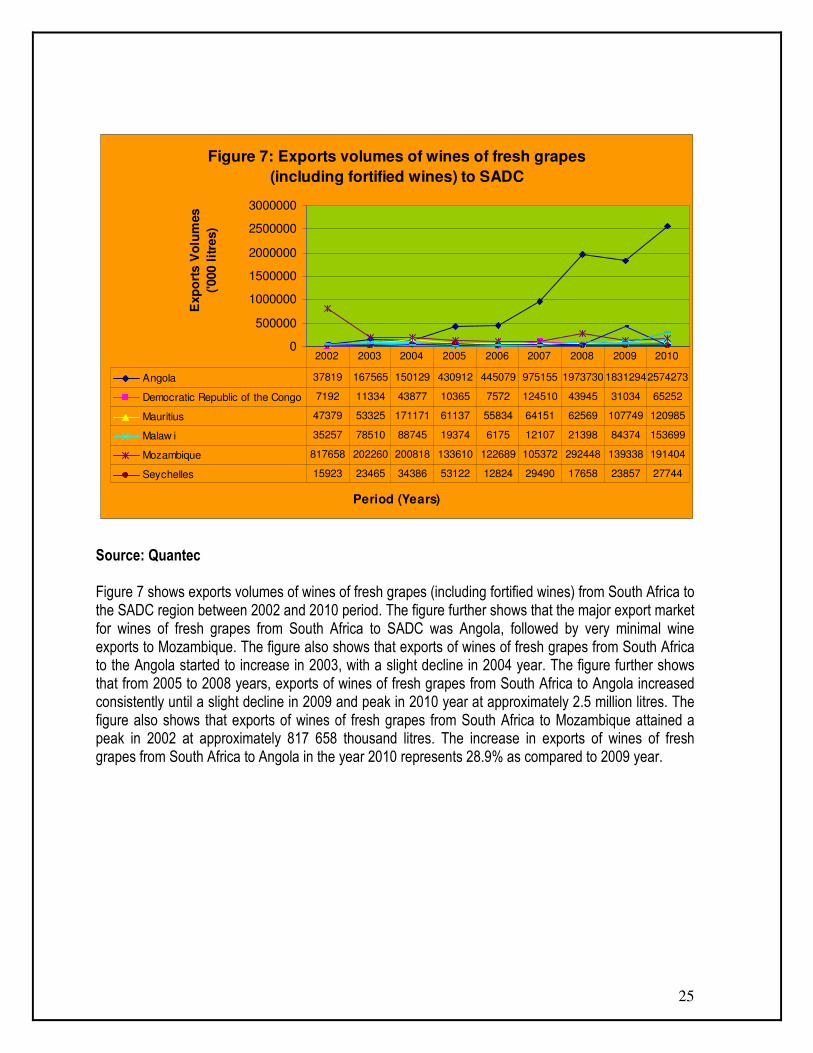
Source: Quantec Figure 7 shows exports volumes of wines of fresh grapes (including fortified wines) from South Africa to the SADC region between 2002 and 2010 period. The figure further shows that the major export market for wines of fresh grapes from South Africa to SADC was Angola, followed by very minimal wine exports to Mozambique. The figure also shows that exports of wines of fresh grapes from South Africa to the Angola started to increase in 2003, with a slight decline in 2004 year. The figure further shows that from 2005 to 2008 years, exports of wines of fresh grapes from South Africa to Angola increased consistently until a slight decline in 2009 and peak in 2010 year at approximately 2.5 million litres. The figure also shows that exports of wines of fresh grapes from South Africa to Mozambique attained a peak in 2002 at approximately 817 658 thousand litres. The increase in exports of wines of fresh grapes from South Africa to Angola in the year 2010 represents 28.9% as compared to 2009 year.

26
Figure 8: Exports volumes of wines of fresh grapes
(including fortified wines) to the Americas
0
50000
100000
150000
200000
250000
300000
350000
Period (Years)
Exp
ort
s v
olu
mes
('000 l
itre
s)
Caribbean 16568 23958 34627 42691 24750 46276 46395 29588 40410
Central America 81 18 9 316 0 9 22 0 0
Northern America 0 45 90 0 0 0 0 0 0
South America 13396 10495 13055 73360 2717 1683 2483 11520 14433
NAFTA 63800 65236 96576 86902 147338 127895 145461 318064 279047
2002 2003 2004 2005 2006 2007 2008 2009 2010
Source: Quantec Figure 8 illustrates exports volumes of wines of fresh grapes (including fortified wines) from South Africa to the Americas between 2002 and 2010 period. The figure further illustrates that the major market for wines of fresh grapes from South Africa to the Americas was mainly NAFTA, followed by South America. The figure also illustrates that exports of wines of fresh grapes from South Africa to NAFTA has been generally increasing between 2002 and 2010 period, a peak was attained in 2009 at approximately 318 064 litres. The figure also illustrates that exports of wines of fresh grapes from South Africa to South America attained a peak in 2005 at approximately 73 360 litres. The decline in exports of wines of fresh grapes from South Africa to NAFTA in the year 2010 represents 14.8% as compared to 2009 year.

27
Figure 9: Exports volumes of wines of fresh grapes
(including fortified wines) to Asia
0
500000
1000000
1500000
2000000
2500000
Period (Years)
Exp
ort
s v
olu
mes
('000 l
itre
s)
Eastern Asia 54951 63709 65269 65121 75792 1114614 173855 2188709 395609
South-central Asia 1876 9538 4039 3740 10867 11172 12863 12674 17112
South-eastern Asia 2633 3592 5018 5556 7322 8643 24775 49586 26375
Western Asia 2705 15456 21969 24458 36770 42233 58828 66830 75119
2002 2003 2004 2005 2006 2007 2008 2009 2010
Source: Quantec Figure 9 indicates exports volumes of wines of fresh grapes (including fortified wines) from South Africa to Asia between 2002 and 2010 period. The figure further indicates that the major market for wines of fresh grapes from South Africa to Asia was mainly Eastern Asia. The three other Asia regions had very minimal exports of wines of fresh grapes from South Africa during the period under review. The figure also indicates that exports of wines of fresh grapes from South Africa to Eastern Asia attained a peak in 2009 at approximately 2.1 million litres. The figure further indicates that in 2010 year, there was a dramatic decline in wine exports of fresh grapes from South Africa to Eastern Asia. The dramatic decline in exports of wines of fresh grapes from South Africa to Eastern Asia in the year 2010 represents 453% as compared to 2009 year.

28
Figure 10: Exports volumes of wines of fresh grapes
(including fortified wines) to Europe
0
500000
1000000
1500000
2000000
2500000
3000000
Period (Years)
Exp
ort
s v
olu
mes
('000 l
itre
s)
Eastern Europe 5625 9729 10203 25209 39447 45743 71896 48150 90778
Northern Europe 45 810 1233 720 855 738 3217 6462 3601
Southern Europe 0 0 0 5 0 0 792 515 0
Western Europe Rest 9770 31972 20956 39225 18491 19694 26269 30435 24693
European Union 856423 1601370 831073 875901 792664 1409918 860283 2713048 2706993
2002 2003 2004 2005 2006 2007 2008 2009 2010
Source: Quantec Figure 10 depicts exports volumes of wines of fresh grapes (including fortified wines) from South Africa to Europe between 2002 and 2010 period. The figure further depicts that the major market for wines of fresh grapes from South Africa to Europe was mainly European Union. The other four European regions had very low levels of wine exports from South Africa during the period under scrutiny. The figure also depicts that exports of wines of fresh grapes from South Africa to the European Union attained a peak in 2009 at approximately 2.7 million litres. The figure also depicts that in 2010, there was a slight decline in wine exports of fresh grapes from South Africa to the European Union. The slight decline in exports of wines of fresh grapes from South Africa to the European Union in the year 2010 represents 0.2% as compared to 2009 year.
29
Figure 11: Exports volumes of wines of fresh grapes
(including fortified wines) to Oceania
0
50000
100000
150000
200000
250000
300000
350000
Period (Years)
Exp
ort
s v
olu
mes (
'000 l
itre
s)
Australia and New Zealand 39403 59410 25529 22356 12350 67639 103718 333004 293962
Melanesia 0 0 0 0 0 0 0 0 468
2002 2003 2004 2005 2006 2007 2008 2009 2010
Source: Quantec
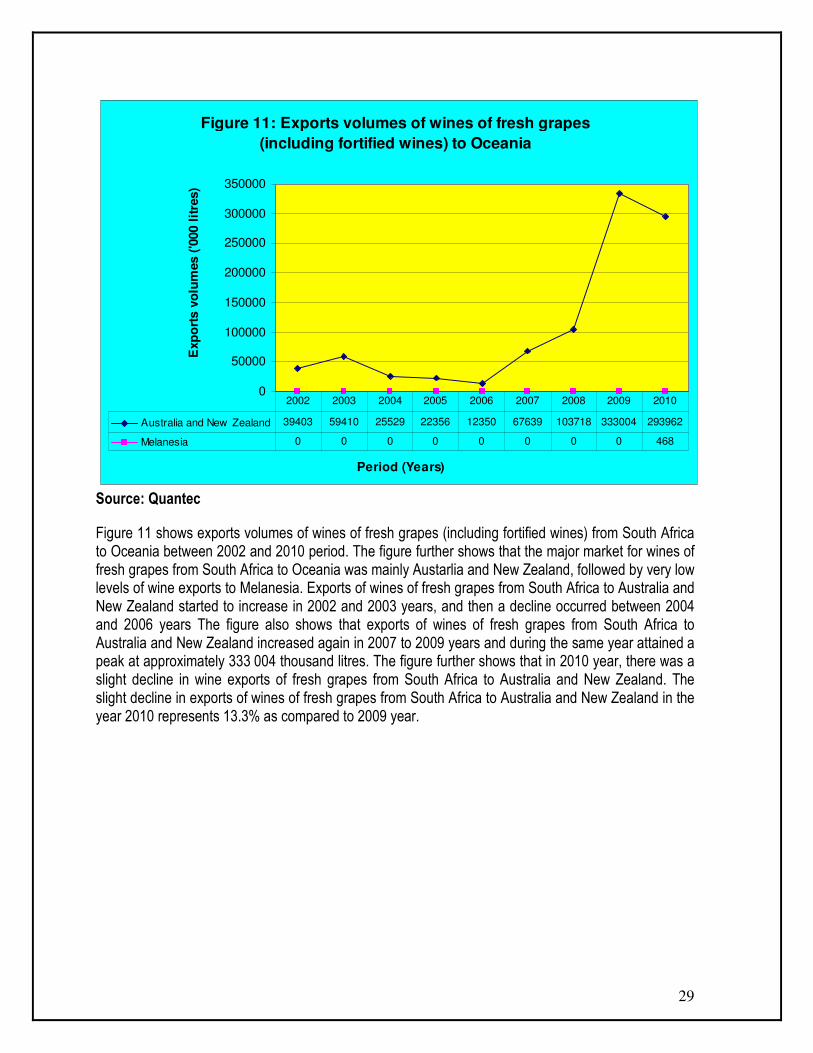
Figure 11 shows exports volumes of wines of fresh grapes (including fortified wines) from South Africa to Oceania between 2002 and 2010 period. The figure further shows that the major market for wines of fresh grapes from South Africa to Oceania was mainly Austarlia and New Zealand, followed by very low levels of wine exports to Melanesia. Exports of wines of fresh grapes from South Africa to Australia and New Zealand started to increase in 2002 and 2003 years, and then a decline occurred between 2004 and 2006 years The figure also shows that exports of wines of fresh grapes from South Africa to Australia and New Zealand increased again in 2007 to 2009 years and during the same year attained a peak at approximately 333 004 thousand litres. The figure further shows that in 2010 year, there was a slight decline in wine exports of fresh grapes from South Africa to Australia and New Zealand. The slight decline in exports of wines of fresh grapes from South Africa to Australia and New Zealand in the year 2010 represents 13.3% as compared to 2009 year.

30
3.1 Provincial and district export values of South African wines A review of provincial level trade data shows that the Western Cape Province had high export values over the past decade. This can be attributed to the fact that the province is firstly the leader in both the production and export of the wine. Secondly, the registered exporters are based in the province and thirdly, the province has the Cape Town harbour that serves as an exit point for wine products. Figure 5 below depicts the value of wine exports from each province of South Africa.
Figure 12: Value of wine exports by Provinces
0
2000000000
4000000000
6000000000
8000000000
10000000000
12000000000
14000000000
Period (Years)
Ex
po
rt V
alu
e (
Ra
nd
s)
Western Cape 3821713735 5791908707 6145611294 6696146174 7326168443 6966343604 9194101729 122255948381182021285811102800919
Eastern Cape 8223271 15691922 16407118 14180636 8648680 12051222 16922156 12545574 15089793 22082640
Northern Cape 719164 6146720 3086187 8459123 13490440 3202212 4728185 7417316 2269996 5713192
Free State 11658 198476 90874 1354226 397086 2835833 287851 911565 578 1470
Kw azulu-Natal 10860663 13460852 13268941 14129983 19708725 21352378 33498644 37761478 28309107 45644345
North West 109751 3179 800924 73936 410524 879842 708414 345299 3248665 2686491
Gauteng 98846763 173123292 122128937 139047537 239621909 119584708 210859906 173421635 133542430 189174221
Mpumalanga 124270 69086 213066 457068 1470594 0 127722 53432 781767 154110
Limpopo 1983462 19235 1600 107933 3642950 756261 2649352 2089 27420488 75377503
2001 2002 2003 2004 2005 2006 2007 2008 2009 2010
Source: Quantec Figure 12 shows the value of wine exports by provinces of South Africa to the world between 2001 and 2010 period. The graph further shows that between 2001 and 2010 period, Western Cape Province was the top wine exporting province in South Africa followed by Gauteng and KwaZulu-Natal Provinces. During the same period under examination, exports of wine from the Western Cape Province attained a peak in 2008 at approximately R122 billion. The graph also shows that there were fewer fluctuations in terms of the exports of wine by the Western Cape Province during the period
31
under review. Other provinces featured intermittently but usually registered very low values in terms of trade. The slight decline in exports of wine from the Western Cape Province to the world in the year 2010 represents 6.5% as compared to 2009 year. The Western Cape Province is generally a major producer and exporter of wine in South Africa.
The following figures (13 – 21) shows the value of wine exports from the various districts in the nine provinces of South Africa.
Figure 13: Value of wine exports by Western Cape Province
0
1000000000
2000000000
3000000000
4000000000
5000000000
6000000000
7000000000
8000000000
9000000000
10000000000
Period (Years)
Ex
po
rt V
alu
e (
Ra
nd
s)
City of Cape Tow n Metropolitan Municipality 1816518736 3099250518 3041303317 2458479098 1492630418 1199518925 1541024014 1901289223 1671829128 2117026794
West Coast District municipality 209326616 308222118 309052423 328687767 309161284 330127113 553480241 746537973 620295039 739906059
Cape Winelands District Municipality 1748683772 2330832572 2697351942 3772218576 5324853392 5131471125 6676696773 8750171285 8435482201 8087780207
Overberg District municipality 44604679 49857455 94063746 131591615 189942174 298666207 412931967 806122889 928427832 128132253
Eden District municipality 2579931 3746044 3839866 3679885 7486626 4529520 7186394 20486476 162077891 29117054
Central Karoo District municipality 0 0 0 1489234 2094548 2030713 2782340 986992 2100766 838552
2001 2002 2003 2004 2005 2006 2007 2008 2009 2010
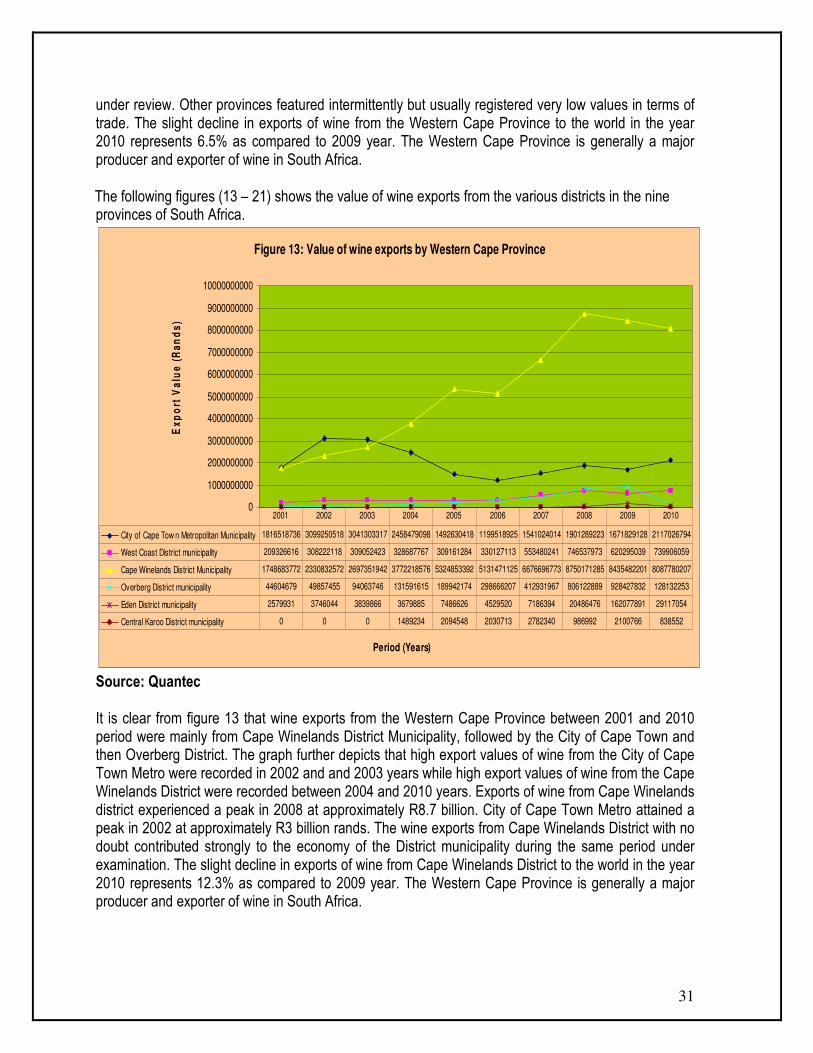
Source: Quantec It is clear from figure 13 that wine exports from the Western Cape Province between 2001 and 2010 period were mainly from Cape Winelands District Municipality, followed by the City of Cape Town and then Overberg District. The graph further depicts that high export values of wine from the City of Cape Town Metro were recorded in 2002 and and 2003 years while high export values of wine from the Cape Winelands District were recorded between 2004 and 2010 years. Exports of wine from Cape Winelands district experienced a peak in 2008 at approximately R8.7 billion. City of Cape Town Metro attained a peak in 2002 at approximately R3 billion rands. The wine exports from Cape Winelands District with no doubt contributed strongly to the economy of the District municipality during the same period under examination. The slight decline in exports of wine from Cape Winelands District to the world in the year 2010 represents 12.3% as compared to 2009 year. The Western Cape Province is generally a major producer and exporter of wine in South Africa.
32
Figure 14: Value of wine exports by Eastern Cape Province
0
2000000
4000000
6000000
8000000
10000000
12000000
14000000
Period (Years)
Ex
po
rt V
alu
e (
Ra
nd
s)
Cacadu District municipality 2409531 8309990 9342359 8708188 3849928 7762255 8036242 9810604 12875076 11465796
Amatole District municipality 5493849 6132174 4568741 4152154 3412080 3598487 7340938 2184562 343678 8275608
Chris Hani District municipality 888 0 17435 48043 0 0 0 0 0 0
O.R.Tambo District municipality 0 294968 1272806 982625 1301495 627444 1533983 477778 0 0
Nelson Mandela Metropolitan Municipality 319003 954790 1205778 289625 85177 63036 10994 72630 1871039 2341237
2001 2002 2003 2004 2005 2006 2007 2008 2009 2010
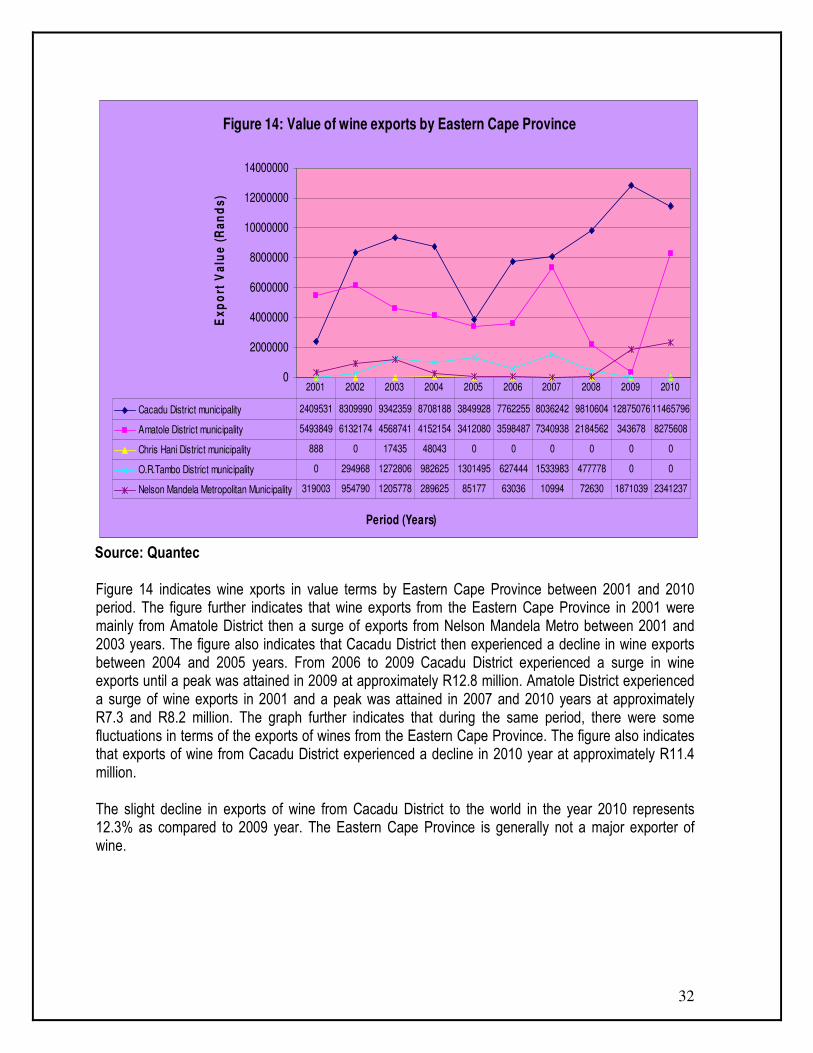
Source: Quantec Figure 14 indicates wine xports in value terms by Eastern Cape Province between 2001 and 2010 period. The figure further indicates that wine exports from the Eastern Cape Province in 2001 were mainly from Amatole District then a surge of exports from Nelson Mandela Metro between 2001 and 2003 years. The figure also indicates that Cacadu District then experienced a decline in wine exports between 2004 and 2005 years. From 2006 to 2009 Cacadu District experienced a surge in wine exports until a peak was attained in 2009 at approximately R12.8 million. Amatole District experienced a surge of wine exports in 2001 and a peak was attained in 2007 and 2010 years at approximately R7.3 and R8.2 million. The graph further indicates that during the same period, there were some fluctuations in terms of the exports of wines from the Eastern Cape Province. The figure also indicates that exports of wine from Cacadu District experienced a decline in 2010 year at approximately R11.4 million. The slight decline in exports of wine from Cacadu District to the world in the year 2010 represents 12.3% as compared to 2009 year. The Eastern Cape Province is generally not a major exporter of wine.

33
Figure 15: Value of wine exports by Northern Cape Province
0
2000000
4000000
6000000
8000000
10000000
12000000
14000000
Period (Years)
Exp
ort
Valu
e (
Ran
ds)
Pixley ka Seme District municipality 0 2226149 0 383552 411315 1019 0 0 0 1361381
Siyanda District municipality 440840 3271354 2644739 8075571 13079125 3201193 4728185 7417316 2269996 4351811
Frances Baard District municipality 278324 649216 441449 0 0 0 0 0 0 0
2001 2002 2003 2004 2005 2006 2007 2008 2009 2010
Source: Quante It is clear from figure 15 that wine exports from the Northern Cape Province were mainly from Siyanda District Municipality between 2001 and 2010 period. The figure further illustrates that high export values of wine for the leading municipality were recorded in 2002, 2005, 2008 and 2010 years. The figure also illustrates that exports of wine from Siyanda District attained a peak in 2005 year at approximately R13 million rands. The graph also illustrates that Pixley ka Seme District was the second with higher values of wine exports during the period under scrutiny. The graph further illustrates that there were a number of declines in exports of wine from Siyanda District in 2003, 2006 and 2009 years. In 2010 year, exports of wine from Siyanda District started to increase again at approximately R4.3 million rands. The increase in exports of wine from Siyanda District to the world in the year 2010 represents 47.8% as compared to 2009 year. The Northern Cape Province is generally not a major wine exporter.
34
Figure 16: Value of wine exports by Free State Province
0
200000
400000
600000
800000
1000000
1200000
1400000
1600000
1800000
2000000
Period (Years)
Ex
po
rt v
alu
e (
Ra
nd
s)
Xhariep District municipality 847 0 0 0 0 1835254 284901 911565 0 0
Motheo District municipality 10811 196979 90874 0 0 1720 2950 0 578 1470
Lejw eleputsw a District municipality 0 1497 0 0 465 1810 0 0 0 0
Thabo Mofutsanyane District municipality 0 0 0 1354226 396622 997048 0 0 0 0
2001 2002 2003 2004 2005 2006 2007 2008 2009 2010
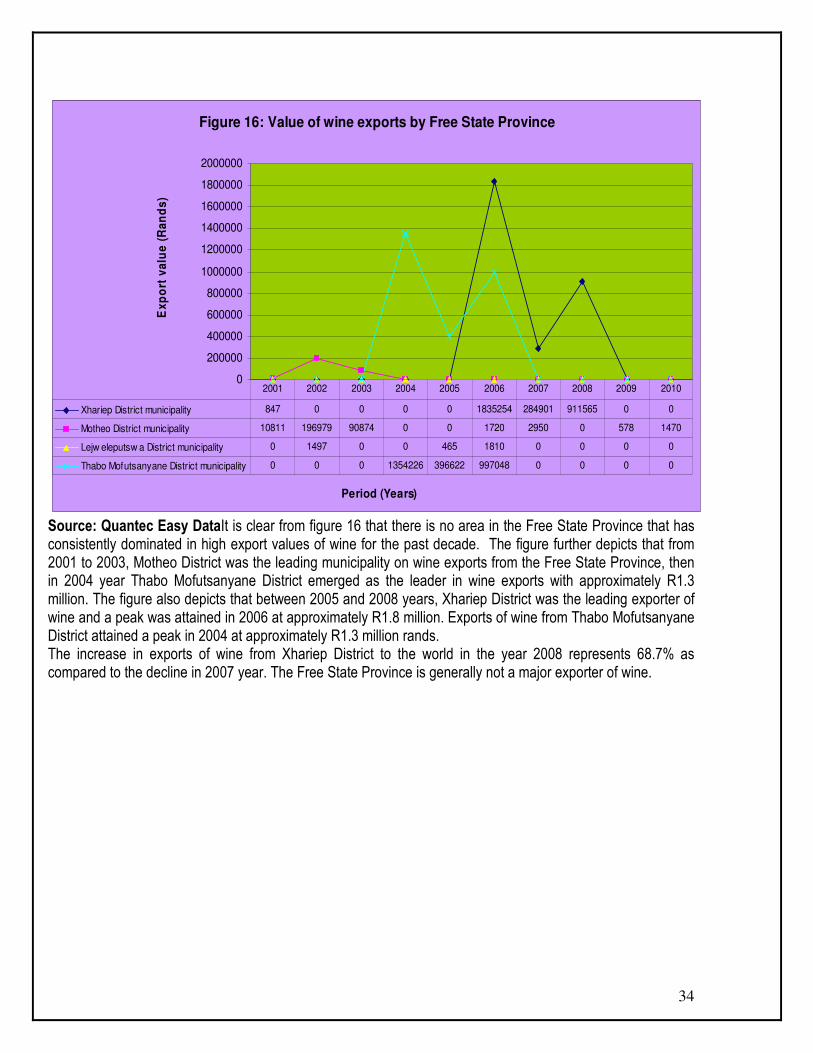
Source: Quantec Easy DataIt is clear from figure 16 that there is no area in the Free State Province that has consistently dominated in high export values of wine for the past decade. The figure further depicts that from 2001 to 2003, Motheo District was the leading municipality on wine exports from the Free State Province, then in 2004 year Thabo Mofutsanyane District emerged as the leader in wine exports with approximately R1.3 million. The figure also depicts that between 2005 and 2008 years, Xhariep District was the leading exporter of wine and a peak was attained in 2006 at approximately R1.8 million. Exports of wine from Thabo Mofutsanyane District attained a peak in 2004 at approximately R1.3 million rands. The increase in exports of wine from Xhariep District to the world in the year 2008 represents 68.7% as compared to the decline in 2007 year. The Free State Province is generally not a major exporter of wine.
35
Figure 17: Value of wine exports by KwaZulu-Natal Province
0
5000000
10000000
15000000
20000000
25000000
30000000
35000000
40000000
45000000
50000000
Period (Years)
Exp
ort
Valu
e (
Ran
ds)
Ugu District municipality 149273 482956 775302 1165607 1015686 55447 0 0 0 0
UMgungundlovu District municipality 1241712 294251 57684 11231 7883 1544 23398 59896 5964 17036
Uthukela District municipality 0 9267 0 45849 45336 55681 171661 0 0 59018
Umzinyathi District municipality 0 0 0 0 0 0 0 0 0 3369
Uthungulu District municipality 29448 95021 68032 68187 92059 3319 0 0 64024 20005
iLembe District municipality 0 0 1033 1062 1161355 0 5373 0 0 0
eThekw ini Metropolitan Municipality 9440230 12579358 12366891 12838048 17386406 21236386 33298212 37701582 28239119 45544917
2001 2002 2003 2004 2005 2006 2007 2008 2009 2010
Source: Quantec
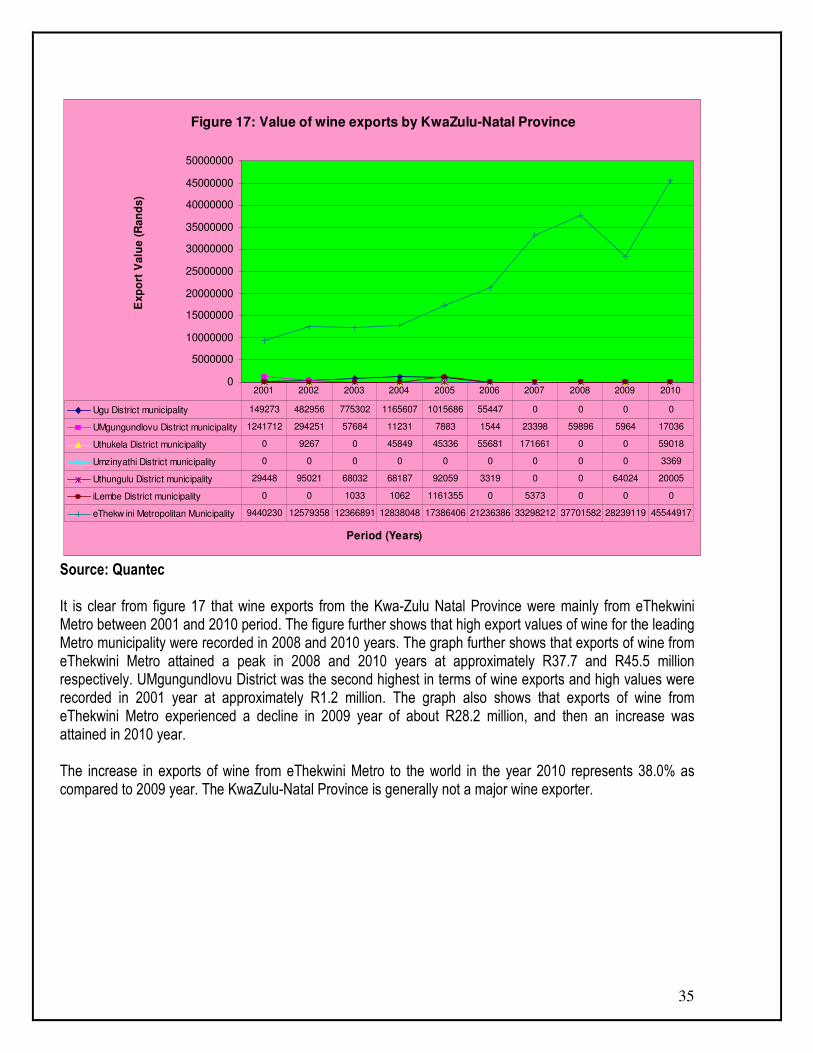
It is clear from figure 17 that wine exports from the Kwa-Zulu Natal Province were mainly from eThekwini Metro between 2001 and 2010 period. The figure further shows that high export values of wine for the leading Metro municipality were recorded in 2008 and 2010 years. The graph further shows that exports of wine from eThekwini Metro attained a peak in 2008 and 2010 years at approximately R37.7 and R45.5 million respectively. UMgungundlovu District was the second highest in terms of wine exports and high values were recorded in 2001 year at approximately R1.2 million. The graph also shows that exports of wine from eThekwini Metro experienced a decline in 2009 year of about R28.2 million, and then an increase was attained in 2010 year. The increase in exports of wine from eThekwini Metro to the world in the year 2010 represents 38.0% as compared to 2009 year. The KwaZulu-Natal Province is generally not a major wine exporter.

36
Figure 18: Value of wine exports by North West Province
0
500000
1000000
1500000
2000000
2500000
3000000
3500000
Period (Years)
Ex
po
rt v
alu
e (
Ra
nd
s)
Bojanala District municipality 109512 1909 381967 4297 409167 85447 0 35601 0 49618
Central District municipality 0 0 418857 69639 0 790149 685773 305703 0 0
Southern District municipality 239 1270 101 0 1358 4246 22641 3995 3248665 2636873
2001 2002 2003 2004 2005 2006 2007 2008 2009 2010
Source: Quantec
Figure 18 indicates values of wine exports from North West Province between 2001 and 2010 period. During the same period under examination, the graph indicates that exports of wine from North West were mainly from Southern District, followed by Central and Bojanala Districts. The figure also indicates that exports of wine from Southern District started to increase in 2009 year, and during the same year attained a peak at approximately R3.2 million. High export values for the leading municipality were recorded in 2009 and 2010 years. Exports of wine from Central District started to increase in 2003, and then a decline occurred in 2004 and 2005 years until a peak was attained in 2006 at approximately R790 149. In 2010 year, exports of wine from Southern District experienced a decline of about R2.6 million.
The sharp decline in exports of wine from Southern District to the world in the year 2010 represents 23.2% as compared to 2009 year. The North West Province is generally not a major wine exporter.

37
Figure 19: Value of wine exports by Gauteng Province
0
20000000
40000000
60000000
80000000
100000000
120000000
140000000
160000000
180000000
200000000
Period (Years)
Ex
po
rt V
alu
e (
Ra
nd
s)
Sedibeng District municipality 1921431 29609347 772757 702933 273337 551 60141 1200000 36003 198
Metsw eding District Municipality 0 4707 278696 0 31638 0 100 0 822005 17324
West Rand District Municipality 611775 265874 354958 348765 570856 310475 423550 1320486 5077630 787670
Ekurhuleni Metropolitan Municipality 59480308 94908832 64428088 46019445 178256077 52717999 148404961 63287571 67519719 82628321
City of Johannesburg Metropolitan Municipality 35124295 46876826 55310749 90399592 55620462 65012561 61014040 105752354 59077655 102952611
City of Tshw ane Metropolitan Municipality 1708955 1457705 983690 1576802 4869539 1543122 957113 1861225 1009417 2788098
2001 2002 2003 2004 2005 2006 2007 2008 2009 2010
Source: Quantec
Figure 19 illustrates values of wine exports by Gauteng Province between 2001 and 2010 period. Wine exports as illustrated in figure 19 originated mainly from Ekurhuleni Metro followed closely by the City of Johannesburg Metro. During the period under scrutiny, wine exports from Ekurhuleni Metro attained a peak in 2005 at approximately R178 million. City of Johannesburg Metro also contributed strongly to the economy of Gauteng Province during the same period under examination. The figure further illustrates that wine exports from the City of Johannesburg Metro attained a peak in 2005 at approximately R105 million. The figure also illustrates that there was a decline in wine exports from Ekurhuleni Metro to the world in 2003, 2004, 2006 and 2008 years. The graph also illustrates that in 2009 and 2010 years, wine exports started to increase again to approximately R82 million. The increase in exports of wine from Ekurhuleni Metro to the world in the year 2010 represents 18.3% as compared to 2009 year. The Gauteng Province is generally not a major wine exporter.

38
Figure 20: Value of wine exports by Mpumalanga Province
0
200000
400000
600000
800000
1000000
1200000
1400000
1600000
Period (Years)
Ex
po
rt V
alu
e (
Ra
nd
s)
Gert Sibande District municipality 0 0 94590 0 0 0 0 0 7798 2198
Nkangala District municipality 200 0 0 3334 126137 0 0 698 773322 0
Ehlanzeni District municipality 124070 69086 118477 453734 1344457 0 127722 52734 647 151912
2001 2002 2003 2004 2005 2006 2007 2008 2009 2010
Source: Quantec Figure 20 indicates values of wine exports from Mpumalanga Province to the world between 2001 and 2010 period. It is further clear from figure 20 that wine exports from the Mpumalanga Province were mainly from Ehlanzeni District during the period under examination. The graph also indicates that Nkangala District came second in terms of wine exports from Mpumalanga Province. Exports of wine from Ehlanzeni District attained a peak in 2005 at approximately R1.3 million, while exports of wine from Nkangala district attained a peak in 2009 at approximately R773 322. The graph also indicates that there was a surge of wine exports from 2004 to 2005 years. Exports of wine from Ehlanzeni district declined dramatically in 2009, and a slight increase occurred in 2010 year. The increase in exports of wine from Ehlanzeni District to the world in the year 2010 represents 99.6% as compared to 2009 year. The Mpumalanga Province is generally not a major wine exporter.

39
Figure 21: Value of wine exports by Limpopo Province
0
10000000
20000000
30000000
40000000
50000000
60000000
70000000
80000000
Period (Years)
Ex
po
rt V
alu
e (
Ra
nd
s)
Mopani District municipality 0 2401 1600 0 88671 0 0 2089 0 0
Vhembe District municipality 1983462 11657 0 0 4226 756261 2352185 0 26961717 74422047
Capricorn District municipality 0 0 0 105321 3550054 0 0 0 0 0
Waterberg District municipality 0 5176 0 2612 0 0 297167 0 451236 955457
Greater Sekhukhune District Municipality 0 0 0 0 0 0 0 0 7535 0
2001 2002 2003 2004 2005 2006 2007 2008 2009 2010
Source: Quantec Figure 21 depicts values of wine exports by Limpopo Province between 2001 and 2010 period. The figure further depicts that wine exports from Limpopo Province were mainly from Vhembe District followed by very low levels of wine exports from Capricorn District. The graph also depicts that Vhembe District attained a peak in wine exports in 2010 at approximately R74 million. However, Capricorn District has emerged as a second wine exporter in the province between 2001 and 2010 period. The increase in exports of wine from Vhembe District to the world in the year 2010 represents 63.7% as compared to 2009 year. The Limpopo province is generally not a major wine exporter.
40
3.2 Share analysis
Table 9: Share of Provincial wine exports to the total RSA wine exports (%) Years Province
2001
2002
2003
2004
2005
2006
2007
2008
2009
2010
Western Cape
96.93 96.52 97.52 97.41 96.23 97.75 97.15 98.13 98.25 97.02
Eastern Cape
0.21 0.26 0.26 0.21 0.11 0.17 0.18 0.10 0.13 0.19
Northern Cape
0.02 0.10 0.05 0.12 0.18 0.05 0.05 0.06 0.02 0.05
Free State
0.00 0.00 0.00 0.02 0.01 0.04 0.00 0.01 4.80 1.28
Kwazulu- Natal
0.28 0.22 0.21 0.21 0.26 0.30 0.35 0.30 0.24 0.40
North West
0.00 5.30 0.01 0.00 0.01 0.01 0.01 0.00 0.03 0.02
Gauteng
2.51 2.89 1.94 2.03 3.15 1.68 2.23 1.39 1.11 1.65
Mpumalanga
0.00 0.00 0.00 0.01 0.02 0.00 0.00 0.00 0.01 0.00
Limpopo
0.05 0.00 2.54 0.00 0.05 0.01 0.03 1.68 0.23 0.66
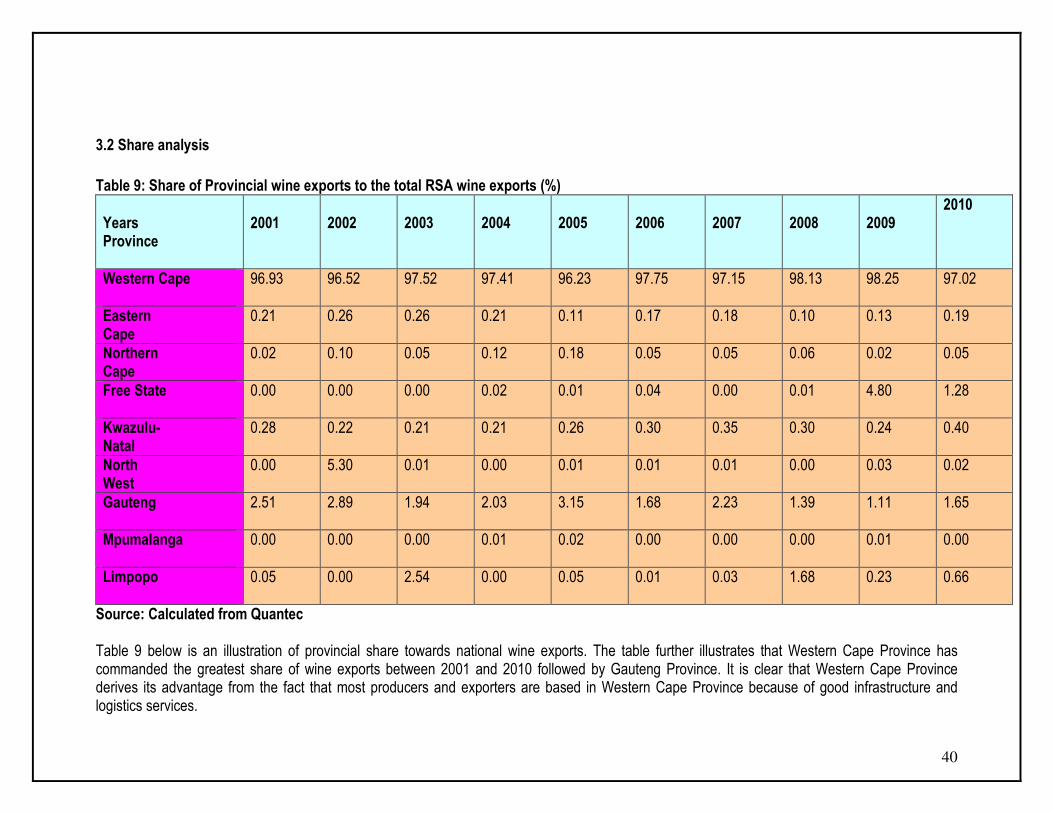
Source: Calculated from Quantec Table 9 below is an illustration of provincial share towards national wine exports. The table further illustrates that Western Cape Province has commanded the greatest share of wine exports between 2001 and 2010 followed by Gauteng Province. It is clear that Western Cape Province derives its advantage from the fact that most producers and exporters are based in Western Cape Province because of good infrastructure and logistics services.
41
Table 10: Share of district wine exports to the total Western Cape provincial wine exports (%) Years District
2001
2002
2003
2004
2005
2006
2007
2008
2009
2010
City of Cape Town
47.53 53.51 49.49 36.71 20.37 17.22 16.76 15.55 14.14 19.07
West Coast 5.48 5.32 5.02 4.91 4.22 4.74 6.02 6.11 5.25 6.66 Cape Winelands
45.76 40.24 43.89 56.33 72.68 73.66 72.62 71.57 71.36 72.84
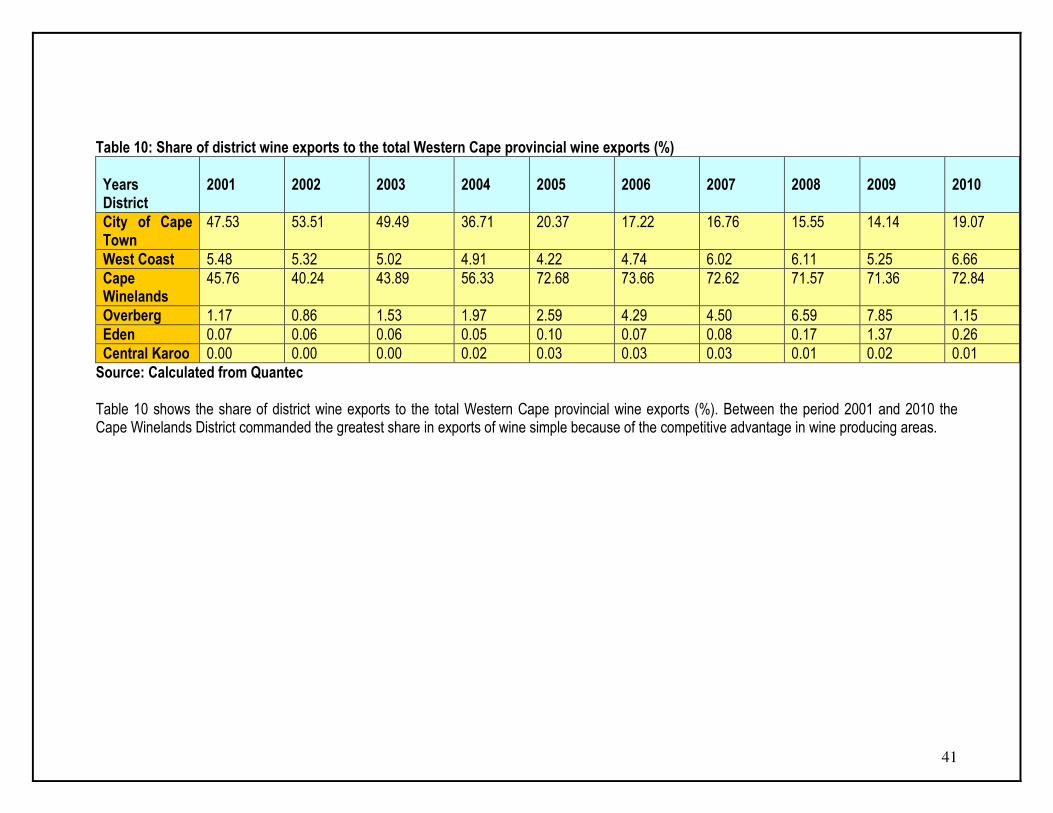
Overberg 1.17 0.86 1.53 1.97 2.59 4.29 4.50 6.59 7.85 1.15 Eden 0.07 0.06 0.06 0.05 0.10 0.07 0.08 0.17 1.37 0.26 Central Karoo 0.00 0.00 0.00 0.02 0.03 0.03 0.03 0.01 0.02 0.01 Source: Calculated from Quantec Table 10 shows the share of district wine exports to the total Western Cape provincial wine exports (%). Between the period 2001 and 2010 the Cape Winelands District commanded the greatest share in exports of wine simple because of the competitive advantage in wine producing areas.
42
Table 11: Share of district wine exports to the total Gauteng provincial wine exports (%) Years District
2001
2002
2003
2004
2005
2006
2007
2008
2009
2010
Sedibeng 1.94 17.10 0.63 0.51 0.11 0.00 0.03 0.69 0.03 0.00 Metsweding 0.00 0.00 0.23 0.00 0.01 0.00 4.74 0.00 0.62 0.01 West Rand 0.62 0.15 0.29 0.25 0.24 0.26 0.20 076 3.80 0.42 Ekurhuleni Metro
60.17 54.82 52.75 33.10 74.39 44.08 70.38 36.49 50.56 43.68
City of Johannesburg
35.53 27.08 45.29 65.01 23.21 54.37 28.94 60.98 44.24 54.42
City of Tshwane
1.73 0.84 0.81 1.1 2.03 1.29 0.45 1.07 0.76 1.47
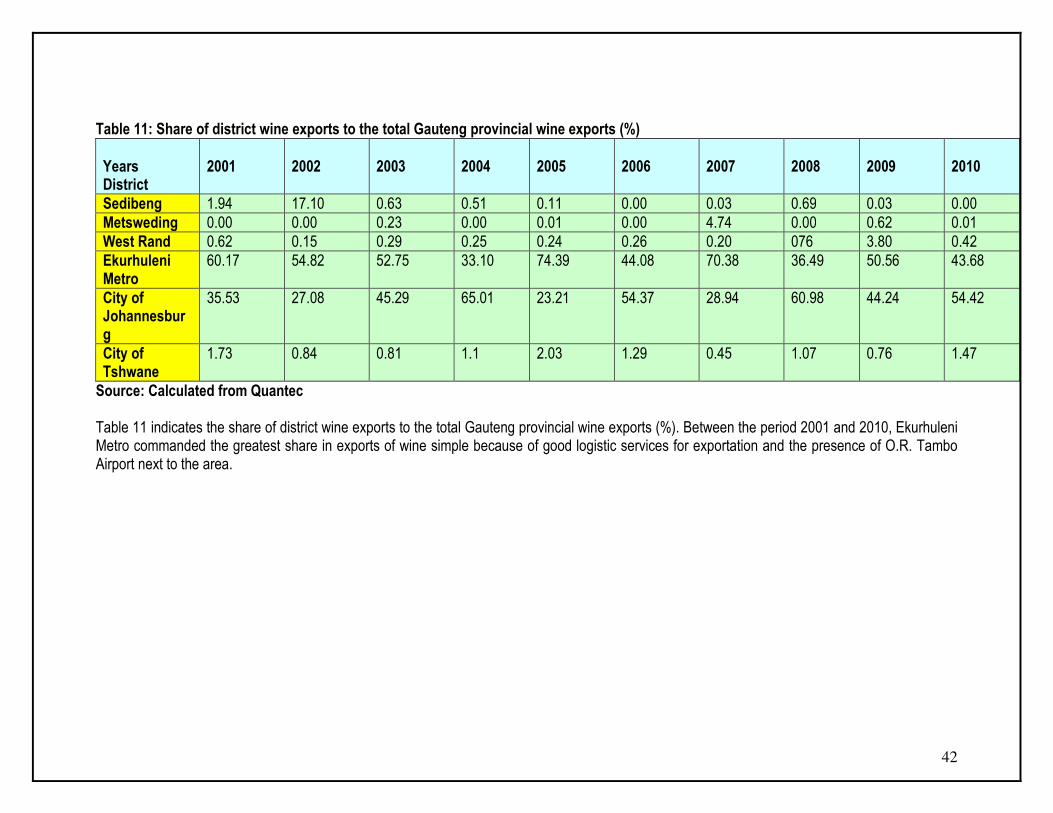
Source: Calculated from Quantec Table 11 indicates the share of district wine exports to the total Gauteng provincial wine exports (%). Between the period 2001 and 2010, Ekurhuleni Metro commanded the greatest share in exports of wine simple because of good logistic services for exportation and the presence of O.R. Tambo Airport next to the area.

43
Table 12: Share of district wine exports to the total Kwa-Zulu Natal provincial wine exports (%) Years District
2001
2002
2003
2004
2005
2006
2007
2008
2009
2010
Ugu District 1.37 3.59 5.84 8.25 5.15 0.26 0.00 0.00 0.00 0.00 Umgungundlovu
11.43 2.19 0.43 0.08 0.04 0.01 0.01 0.16 0.02 0.04
Uthukela 0.00 0.07 0.00 0.32 0.23 0.26 0.51 0.00 0.00 0.13 Umzinyathi 0.00 0.00 0.00 0.00 0.00 0.00 0.00 0.00 0.00 0.01 Uthungulu 0.27 0.71 0.51 0.48 0.47 0.02 0.00 0.00 0.23 0.04 Ilembe District
0.00 0.00 0.01 0.01 5.89 0.00 0.02 0.00 0.00 0.00
eThekwini 86.92 93.45 93.20 90.86 88.22 99.46 99.40 99.84 99.75 99.78 Source: Calculated from Quantec Table 12 illustrates the share of district wine exports to the total Kwazulu-Natal provincial wine exports (%). Between the period 2001 and 2010, the eThekwini Metro commanded the greatest share in exports of wine simple because of the competitive advantage in exportation and the presence of Durban harbour.

44
Table 13: Share of district wine exports to the total Eastern Cape provincial wine exports (%) Years District
2001
2002
2003
2004
2005
2006
2007
2008
2009
2010
Cacadu 29.30 52.96 56.94 61.41 44.51 64.41 47.49 78.20 85.32 51.92 Amatole 66.81 39.08 27.85 29.28 39.45 29.86 43.38 17.41 2.28 37.48 Chris Hani 0.01 0.00 0.11 0.34 0.00 0.00 0.00 0.00 0.00 0.00 OR Tambo 0.00 1.88 7.76 6..93 15.05 5.21 9.06 3.81 0.00 0.00 Nelson Mandela
3.88 6.08 7.35 2.04 0.98 0.52 0.06 0.58 12.40 10.60
Source: Calculated from Quantec Table 13 illustrates the share of district wine exports to the total Eastern Cape provincial wine exports (%). Between the period 2001 and 2010, Cacadu District commanded the greatest share in exports of wine simple because of the presence of Port Elizabeth harbour that makes it easy to ship the wine products. Table 14: Share of district wine exports to the total Northern Cape provincial wine exports (%) Years District
2001
2002
2003
2004
2005
2006
2007
2008
2009
2010
Pixley ka Seme
0.00 36.22 0.00 4.53 3.05 0.03 0.00 0.00 0.00 23.83
Siyand District
61.30 53.22 85.70 95.47 96.95 99.97 100 100 100 76.17
Frances Baard
38.70 10.56 14.30 0.00 0.00 0.00 0.00 0.00 0.00 0.00
Source: Calculated from Quantec Table 14 illustrates the share of district wine exports to the total Northern Cape provincial wine exports (%). Between the period 2001 and 2010, Siyanda District commanded the greatest share in exports of wine in the Northern Cape Province.

45
Table 15: Share of district wine exports to the total Limpopo provincial wine exports (%) Years District
2001
2002
2003
2004
2005
2006
2007
2008
2009
2010
Mopani 0.00 12.48 100 0.00 2.43 0.00 0.00 100 0.00 0.00 Vhembe 100 60.61 0.00 0.00 0.12 100 88.78 0.00 98.33 98.73 Capricorn 0.00 0.00 0.00 97.58 97.45 0.00 0.00 0.00 0.00 0.00 Waterberg 0.00 26.91 0.00 2.42 0.00 0.00 11.22 0.00 1.65 1.27 Greater Sekhukhune
0.00 0.00 0.00 0.00 0.00 0.00 0.00 0.00 0.01 0.00
Source: Calculated from Quantec Table 15 illustrates the share of district wine exports to the total Limpopo provincial wine exports (%). Between the period 2001 and 2010, Vhembe District commanded the greatest share in exports of wine in that province. Table 16: Share of district wine exports to the total Mpumalanga provincial wine exports (%) Years District
2001
2002
2003
2004
2005
2006
2007
2008
2009
2010
Gert Sibande 0.00 0.00 44.39 0.00 0.00 0.00 0.00 0.00 0.99 1.43 Nkangala 0.16 0.00 0.00 0.73 8.58 0.00 0.00 1.31 98.92 0.00 Ehlanzeni 99.83 100 55.61 99.27 91.42 0.00 100 98.69 0.08 98.57 Source: Calculated from Quantec Table 16 illustrates the share of district wine exports to the total Mpumalanga provincial wine exports (%). Between the period 2001 and 2010, Ehlanzeni District commanded the greatest share in exports of wine in that province.

46
Table 17: Share of district wine exports to the total North West provincial wine exports (%) Years District
2001
2002
2003
2004
2005
2006
2007
2008
2009
2010
Bojanala 99.78 60.05 47.69 5.81 99.67 9.71 0.00 10.31 0.00 1.85 Central District 0.00 0.00 52.30 94.19 0.00 89.81 96.80 88.53 0.00 0.00 Southern District
0.22 39.95 0.01 0.00 0.33 0.48 3.20 1.16 100 98.15
Source: Calculated from Quantec Table 17 shows the share of district wine exports to the total North West provincial wine exports (%). Between the period 2001 and 2010, Bojanala District commanded the greatest share in exports of wine in that province. Table 18: Share of district wine exports to the total Free State provincial wine exports (%) Years District
2001
2002
2003
2004
2005
2006
2007
2008
2009
2010
Xhariep 7.27 0.00 0.00 0.00 0.00 64.72 98.98 100 0.00 0.00 Motheo 92.73 99.25 100 0.00 0.00 0.06 1.02 0.00 100 100 Lejweleputswa
0.00 0.75 0.00 0.00 0.12 0.06 0.00 0.00 0.00 0.00
Thabo Mofutsanyane
0.00 0.00 0.00 100 99.88 35.16 0.00 0.00 0.00 0.00
Source: Calculated from Quantec

47
Table 18 depicts the share of district wine exports to the total Free State provincial wine exports (%). Between the period 2001 and 2010, Motheo District commanded the greatest share in exports of wine in that province. 4. IMPORTS OF WINES OF FRESH GRAPES
Figure 22: Imports volumes of wines of fresh grapes (including
fortified wines) from various regions
0
100000
200000
300000
400000
500000
Period (Years)
Imp
ort
s v
olu
mes
('000 l
itre
s)
Africa 1265 3229 42 28 321 329 4081 1937 63726 4558
Americas 877 107 470 336 266 424 255 213 426 1831
Asia 5 73 2 22520 111 704 2102 17 2160 85
Europe 117778 134155 171972 203854 351772 409769 423807 426344 333571 375788
Oceania 99 101 131 852 1099 180 325 146 123 187
2001 2002 2003 2004 2005 2006 2007 2008 2009 2010
Source: Quantec Figure 22 depicts imports volumes of wines of fresh grapes (including fortified wines) from various regions into South Africa between 2001 and 2010 period. The figure further depicts that the major import market for wines of fresh grapes from the world into South Africa originated from Europe, followed by minimal imports of wines from Africa and Asia. The figure also depicts that imports of wines of fresh grapes from Europe into South Africa started to increase in 2002 with a dramatic increase between 2005 and 2008 years. The graph further depicts that in 2008 year, imports of wines of fresh grapes from Europe into South Africa experienced a peak in 2008 at approximately 426 344 litres. In 2009 imports of wines of fresh grapes from Europe experienced a slight decline, and then in 2010 wine imports slightly increased to approximately 375 788 litres. The increase in imports of wines of fresh grapes from Europe into South Africa in the year 2010 represents 11.2% as compared to 2009 year.
48
Figure 23: Imports volumes of wines of fresh grapes (including
fortified wines) from Africa
0
10000
20000
30000
40000
50000
60000
70000
Period (Years)
Imp
ort
s v
olu
mes
('000 l
itre
s)
Eastern Africa Rest 0 0 0 18 0 1 0 0 0 16
Middle Africa Rest 0 0 0 0 0 0 0 0 0 18
Western Africa 0 16 0 0 68 185 100 101 17 0
SADC 1265 3213 42 10 253 143 3981 1836 63709 4524
2001 2002 2003 2004 2005 2006 2007 2008 2009 2010
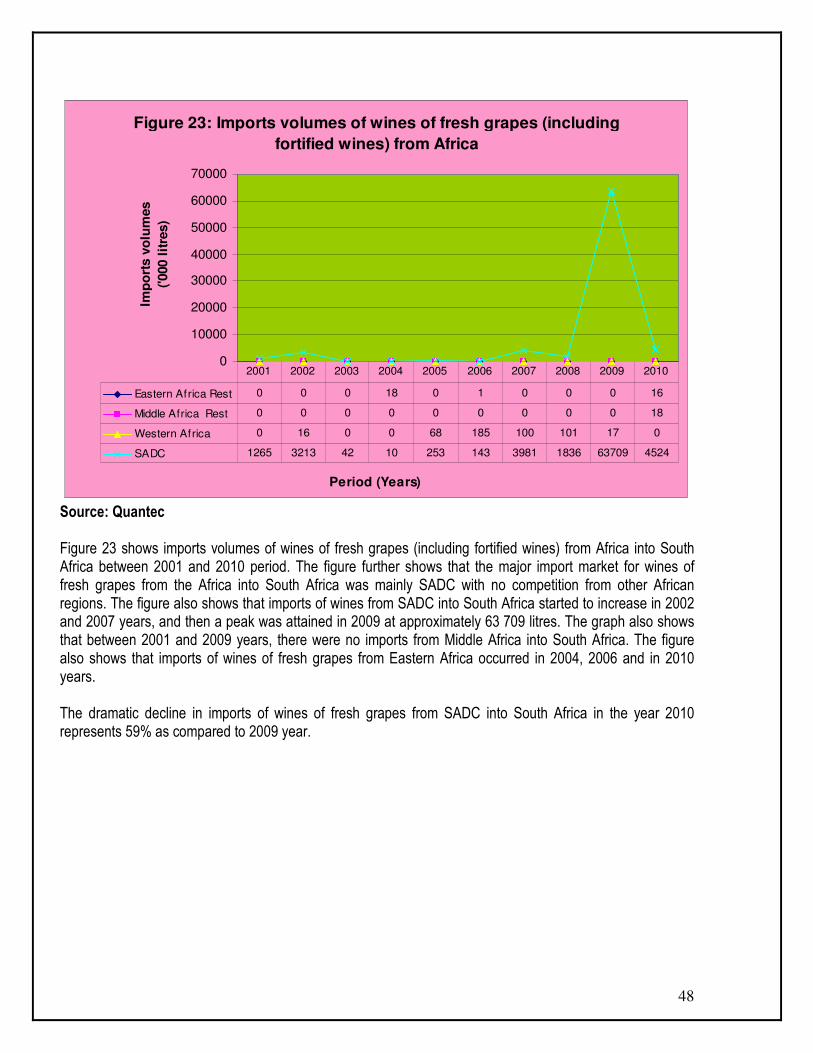
Source: Quantec Figure 23 shows imports volumes of wines of fresh grapes (including fortified wines) from Africa into South Africa between 2001 and 2010 period. The figure further shows that the major import market for wines of fresh grapes from the Africa into South Africa was mainly SADC with no competition from other African regions. The figure also shows that imports of wines from SADC into South Africa started to increase in 2002 and 2007 years, and then a peak was attained in 2009 at approximately 63 709 litres. The graph also shows that between 2001 and 2009 years, there were no imports from Middle Africa into South Africa. The figure also shows that imports of wines of fresh grapes from Eastern Africa occurred in 2004, 2006 and in 2010 years. The dramatic decline in imports of wines of fresh grapes from SADC into South Africa in the year 2010 represents 59% as compared to 2009 year.
49
Figure 24: Imports volumes of wines of fresh grapes (including
fortified wines) from SADC region
0
500
1000
1500
2000
Period (Years)
Imp
ort
s v
olu
mes
('000 l
itre
s)
Angola 0 0 0 0 0 0 3 4 0 0
Mauritius 157 0 0 0 0 7 460 0 36 0
Malaw i 0 0 0 0 0 1 0 0 0 0
Mozambique 0 0 0 0 0 2 0 0 0 0
United Republic of Tanzania 0 0 0 0 0 0 0 0 0 6
Zimbabw e 0 57 3 4 0 34 0 1800 0 0
2001 2002 2003 2004 2005 2006 2007 2008 2009 2010
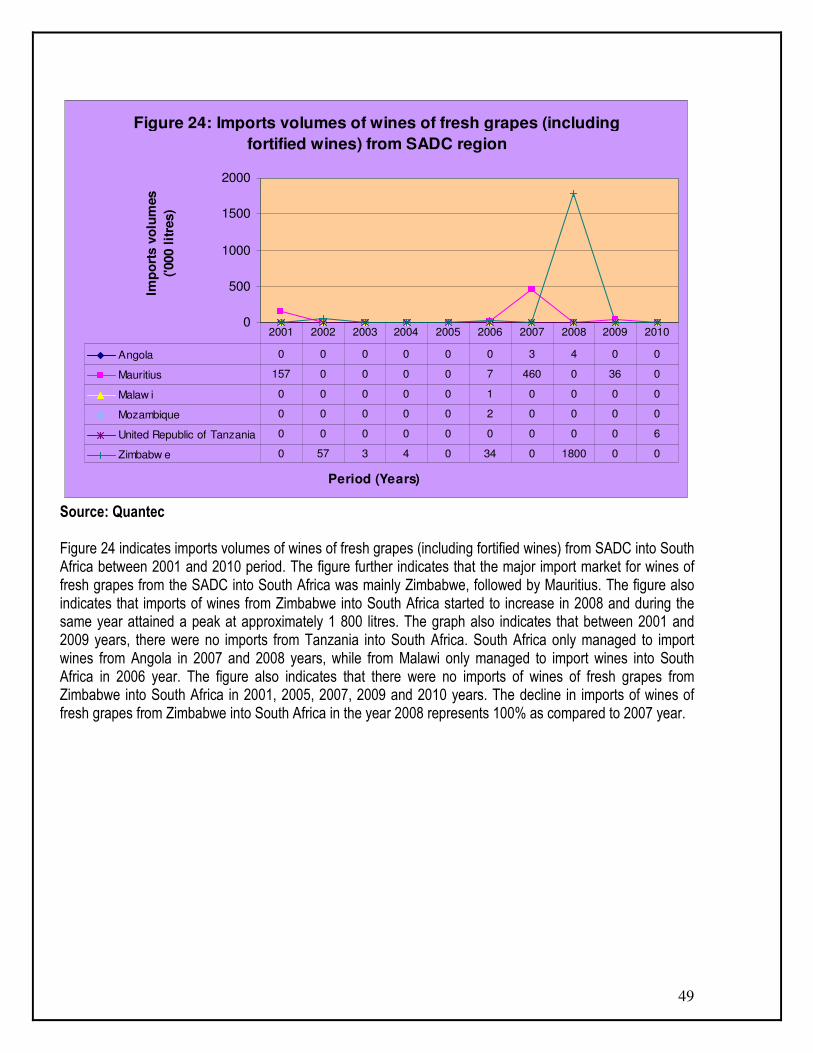
Source: Quantec Figure 24 indicates imports volumes of wines of fresh grapes (including fortified wines) from SADC into South Africa between 2001 and 2010 period. The figure further indicates that the major import market for wines of fresh grapes from the SADC into South Africa was mainly Zimbabwe, followed by Mauritius. The figure also indicates that imports of wines from Zimbabwe into South Africa started to increase in 2008 and during the same year attained a peak at approximately 1 800 litres. The graph also indicates that between 2001 and 2009 years, there were no imports from Tanzania into South Africa. South Africa only managed to import wines from Angola in 2007 and 2008 years, while from Malawi only managed to import wines into South Africa in 2006 year. The figure also indicates that there were no imports of wines of fresh grapes from Zimbabwe into South Africa in 2001, 2005, 2007, 2009 and 2010 years. The decline in imports of wines of fresh grapes from Zimbabwe into South Africa in the year 2008 represents 100% as compared to 2007 year.
50
Figure 25: Imports volumes of wines of fresh grapes (including
fortified wines) from the Americas
0
200
400
600
800
1000
1200
1400
1600
Period (Years)
Imp
ort
s v
olu
mes
('000 l
itre
s)
Caribbean 0 0 0 0 0 0 0 0 13 9
Central America 0 0 10 0 0 0 0 0 0 2
South America 36 6 252 275 134 141 50 41 41 1340
NAFTA 841 101 208 61 132 283 205 172 372 480
2001 2002 2003 2004 2005 2006 2007 2008 2009 2010
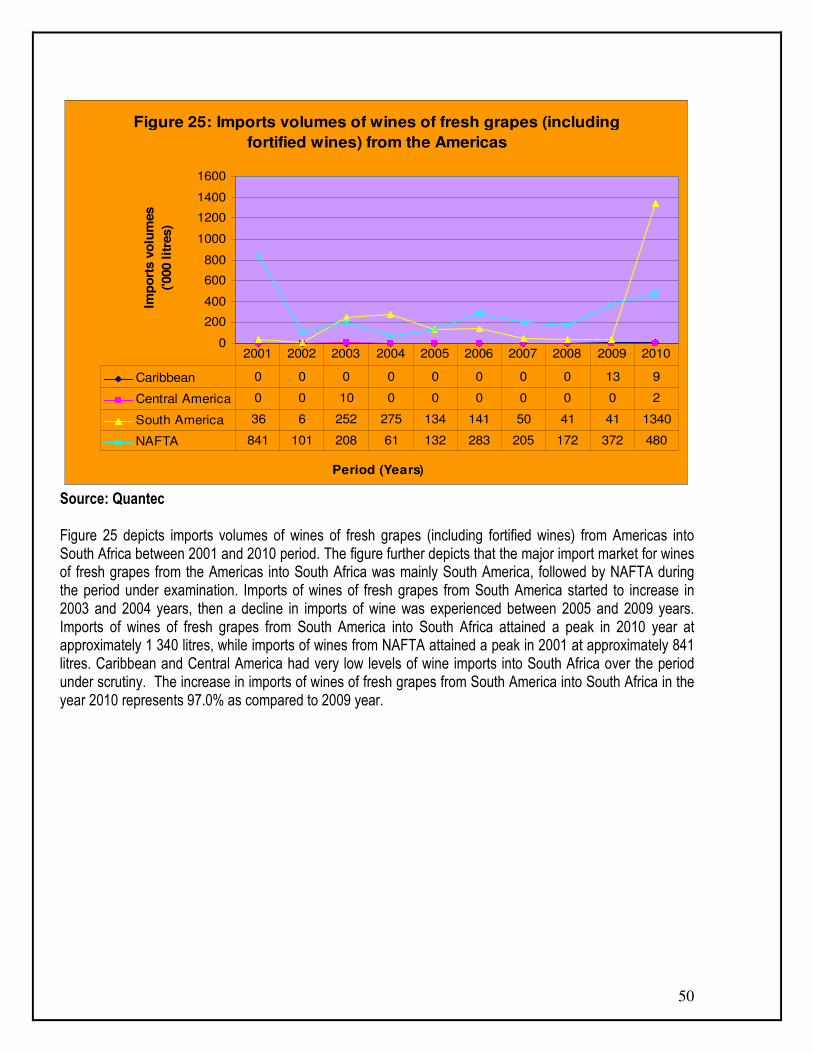
Source: Quantec Figure 25 depicts imports volumes of wines of fresh grapes (including fortified wines) from Americas into South Africa between 2001 and 2010 period. The figure further depicts that the major import market for wines of fresh grapes from the Americas into South Africa was mainly South America, followed by NAFTA during the period under examination. Imports of wines of fresh grapes from South America started to increase in 2003 and 2004 years, then a decline in imports of wine was experienced between 2005 and 2009 years. Imports of wines of fresh grapes from South America into South Africa attained a peak in 2010 year at approximately 1 340 litres, while imports of wines from NAFTA attained a peak in 2001 at approximately 841 litres. Caribbean and Central America had very low levels of wine imports into South Africa over the period under scrutiny. The increase in imports of wines of fresh grapes from South America into South Africa in the year 2010 represents 97.0% as compared to 2009 year.
51
Figure 26: Imports volumes of wines of fresh grapes (including
fortified wines) from Asia
0
5000
10000
15000
20000
25000
Period (Years)
Imp
ort
s v
olu
mes
('000 l
itre
s)
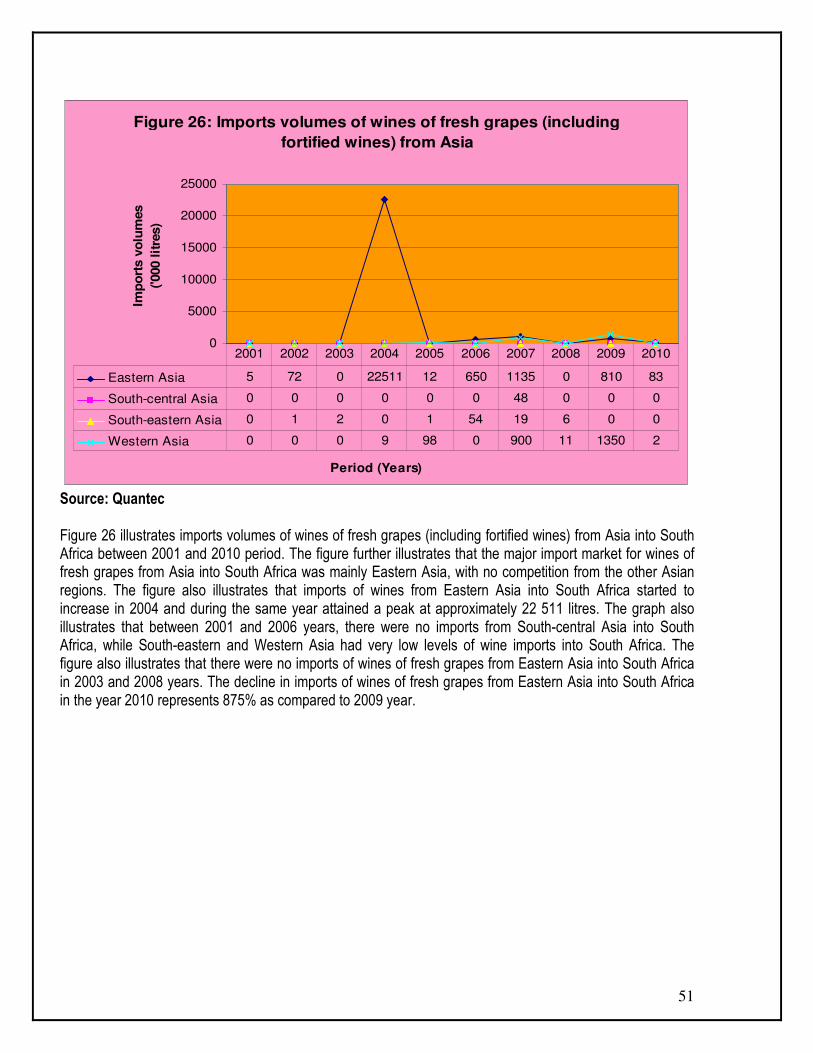
Eastern Asia 5 72 0 22511 12 650 1135 0 810 83
South-central Asia 0 0 0 0 0 0 48 0 0 0
South-eastern Asia 0 1 2 0 1 54 19 6 0 0
Western Asia 0 0 0 9 98 0 900 11 1350 2
2001 2002 2003 2004 2005 2006 2007 2008 2009 2010
Source: Quantec Figure 26 illustrates imports volumes of wines of fresh grapes (including fortified wines) from Asia into South Africa between 2001 and 2010 period. The figure further illustrates that the major import market for wines of fresh grapes from Asia into South Africa was mainly Eastern Asia, with no competition from the other Asian regions. The figure also illustrates that imports of wines from Eastern Asia into South Africa started to increase in 2004 and during the same year attained a peak at approximately 22 511 litres. The graph also illustrates that between 2001 and 2006 years, there were no imports from South-central Asia into South Africa, while South-eastern and Western Asia had very low levels of wine imports into South Africa. The figure also illustrates that there were no imports of wines of fresh grapes from Eastern Asia into South Africa in 2003 and 2008 years. The decline in imports of wines of fresh grapes from Eastern Asia into South Africa in the year 2010 represents 875% as compared to 2009 year.

52
Figure 27: Imports volumes of wines of fresh grapes (including
fortified wines) from Europe
0
100000
200000
300000
400000
500000
Period (Years)
Imp
ort
s v
olu
mes
('000 l
itre
s)
Eastern Europe 0 2 0 0 0 58 4 9 4 16
Northern Europe 0 0 0 4 0 0 0 0 9 2
Southern Europe 0 0 0 0 0 0 1 40 0 0
Western Europe Rest 25 35 12 18 2 9 21 9 62 11
European Union 117753 134118 171960 203832 351770 409702 423781 426286 333496 375759
2001 2002 2003 2004 2005 2006 2007 2008 2009 2010
Source: Quantec Figure 27 depicts imports volumes of wines of fresh grapes (including fortified wines) from Europe into South Africa between 2001 and 2010 period. The figure further depicts that the major import market for wines of fresh grapes from the Europe into South Africa mainly originated from the European Union. The figure also depicts that imports of wines of fresh grapes from the European Union into South Africa started to increase in 2002 with a dramatic increase between 2005 and 2008 years. The graph further depicts that in 2008 imports of wines of fresh grapes from European Union into South Africa experienced a peak in 2008 at approximately 426 286 litres. In 2009 imports of wines of fresh grapes from European Union experienced a slight decline, and then in 2010 wine imports slightly increased to approximately 375 759 litres. The increase in imports of wines of fresh grapes from the European Union into South Africa in the year 2010 represents 11.2% as compared to 2009 year.

53
Figure 28: Imports volumes of wines of fresh grapes (including fortified wines) from
European Union
0
50000
100000
150000
200000
250000
300000
350000
400000
450000
Period (Years)
Import
s v
olu
mes ('0
00 litre
s)
Austria 30 1 10 25 0 0 2 110 4 36
Belgium 1 1049 1971 16 3 1231 1 108 49 35
Czech Republic 0 0 0 0 0 0 36 9 0 0
Germany 2665 269 1084 1201 533 1606 849 380 677 639
Denmark 0 0 0 0 55 0 10 11 4 32
Spain 2562 9382 1910 4645 11494 25325 10610 2311 2119 1654
Finland 0 9 0 4 0 0 75 0 9 28
France 97950 114417 157291 175882 227372 336951 394024 393580 304534 328769
United Kingdom 396 3599 5761 4165 1739 805 913 714 340 1119
Greece 0 1 0 0 0 44 67 21 10 28
Hungary 36 0 0 0 0 0 0 0 0 15
Ireland 0 6 1 9 0 13 10 6 0 6
Italy 6125 5318 3856 17585 68904 43431 17137 28891 24553 42078
Luxembourg 0 1 0 0 4 9 5 1 0 0
Latvia 0 0 0 0 0 0 6 0 3 0
Malta 0 0 0 0 0 0 0 0 229 0
Netherlands 7977 3 4 258 41652 49 9 15 9 2
Poland 0 0 49 0 0 0 0 35 0 0
Portugal 9 56 7 39 1 238 4 35 923 1296
Sw eden 2 7 16 2 11 0 23 59 33 22
Slovenia 0 0 0 1 0 0 0 0 0 0
Slovakia 0 0 0 0 2 0 0 0 0 0
2001 2002 2003 2004 2005 2006 2007 2008 2009 2010
Source: Quantec

54
Figure 28 shows imports volumes of wines of fresh grapes (including fortified wines) from the European Union into South Africa between 2001 and 2010 period. The figure further shows that the major import market for wines of fresh grapes from European Union into South Africa was France. The figure also shows that imports of wines of fresh grapes from the France into South Africa started to increase in 2002 year with a dramatic increase between 2005 and 2007 years. The graph further shows that in 2008 year, imports of wines of fresh grapes from France into South Africa experienced a peak in 2007 at approximately 394 024 litres. In 2008 year, imports of wines of fresh grapes from France experienced a slight decline, and then a dramatic decline in 2009 year. In 2010 year, imports of wines of fresh grapes from France into South Africa slightly increased at approximately 328 769 litres. The increase in imports of wines of fresh grapes from France into South Africa in the year 2010 represents 7.4% as compared to 2009 year.
Figure 29: Imports volumes of wines of fresh grapes (including
fortified wines) from Oceania
0
200
400
600
800
1000
1200
Period (Years)
Imp
ort
s v
olu
mes
('000 l
itre
s)
Australia and New
Zealand
99 101 131 852 1099 180 325 146 123 187
2001 2002 2003 2004 2005 2006 2007 2008 2009 2010
Source: Quantec Figure 29 illustrates imports volumes of wines of fresh grapes (including fortified wines) from Oceania into South Africa between 2001 and 2010 period. The figure further illustrates that the major import market for wines of fresh grapes from Oceania into South Africa was Australia and New Zealand. The figure also illustrates that imports of wines of fresh grapes from Australia and New Zealand started to increase in 2002 and 2003 years, with a dramatic increase in 2004 year until a peak was attained in 2005 year at approximately 1 099 litres. The figure further illustrates that a sharp decline in wine imports from Australia and New Zealand occurred in 2006, and then a slight increase was experienced again in 2007 year. Between 2008 and 2009 years, imports of wines of fresh grapes from Australia and New Zealand slightly declined, a slight increase in wine imports from Australia and New Zealand was experienced again in 2010 year. The slight increase in imports of wines of fresh grapes from Australia and New Zealand into South Africa during the 2010 year represents 34.2% as compared to 2009 year.

55
4. MARKET INTELIGENCE
4.1 Competitiveness of South African wine exports Competitiveness is described as an industry’s capacity to create superior value for its customers and improved profits for the stakeholders in the value chain. The driving force in sustaining a competitive position is productivity that is output efficiency in relation to specific inputs with regard to human, capital and natural resources. South African exports for wine of fresh grapes, including fortified wines, and grape must whose fermentation has been arrested by addition of alcohol, in containers of > 2 litres represent 5.8% of world exports and its ranking on the world exports is number 7.

56
Table 19: List of importing markets for grape wines exported by South Africa in 2010
Importers
Trade Indicators Tariff
(estimated) faced by
South Africa (%)
Exported value 2010
(USD thousand)
Share in South Africa's exports (%)
Exported quantity
2010 (tons)
Unit value (USD/unit)
Exported growth in
value between 2006-2010 (%,
p.a.)
Exported growth in quantity
between 2006-2010 (%, p.a.)
Exported growth in value
between 2009-2010 (%, p.a.)
World 202637 100 200009 1013 17 8 16 Sweden 52665 26 30817 1709 17 20 7 6.4 United Kingdom 44837 22.1 47941 935 19 16 41 6.4 Germany 39745 19.6 54331 732 28 25 32 6.4 Denmark 13068 6.4 9422 1387 16 15 21 6.4 Netherlands 5832 2.9 7825 745 -18 -25 -22 6.4 France 5749 2.8 7131 806 5 -7 13 6.4 Finland 4581 2.3 2930 1563 27 20 6 6.4 Belgium 4295 2.1 5377 799 12 8 17 6.4 Canada 4043 2 5344 757 8 1 129 0 Russian Federation 4025 2 6137 656 177 187 13 20 Kenya 3077 1.5 2018 1525 18 26 61 25 United States of America 2624 1.3 3725 704 35 52 -39 0 Switzerland 2237 1.1 2342 955 14 6 -12 58.6 Norway 2088 1 1026 2035 6 2 -16 0 United Arab Emirates 1755 0.9 1366 1285 62 54 47 50 Thailand 1380 0.7 1840 750 207 239 50 60 Source: Trade Map
57
Table 19 illustrates the list of importing markets for grape wines exported by South Africa to the world in 2010. The table further illustrates that Sweden, followed by United Kingdom and Germany imported greater volumes of grape wines from South Africa. Sweden imported 30817 tons, United Kingdom imported 47 941 tons and Germany imported 54 331 tons during the same period under examination. The table also illustrates that Sweden, United Kingdom and Germany imported more than what the world imported from South Africa, both in value and in volume terms between 2006 and 2010. South Africa’s exported growth in value and volume to Sweden increased to approximately 17% and 20% respectively, while South Africa’s exported growth in value and volume to United Kingdom also increased to approximately 16% and 19% respectively. South Africa’s exported growth in value and volume to Germany also increased to approximately 25% and 28% respectively.\ Sweden had a highest share in South Africa’s exports of grape wines at approximately 26%, United Kingdom at approximately 22.1% and Germany at approximately 19.6%. It is interesting to note that Russian Federation was the most competitive import market for South Africa during 2010 period.

58
Figure 16: Growth in demand for the South African grape wine exported in 2010
Source: Trade Map of the International Trade Centre
59
Figure 16 above shows growth in demand for the South African grape wine exported in 2010. The figure further shows that Sweden, United Kingdom and Germany were the biggest markets of grape wines from South Africa between 2006 and 2010 period. During the same period under review, markets such as Russian Federation, China and Thailand had a growing demand for grape wines from South Africa due to the fact that their marketsare dynamic and attract a lot of suppliers from the world. Countries like Netherlands, France, Angoal, Denmark and Canada, their imports from the world of wine from the world have declined during the same period under scrutiny. Russian Federation was the most attractive market (dynamic markets) both in terms of South Africa’s annual growth in exports and the annual growth of partner countries imports from the world followed by China and Thailand. Finland (25% annual growth of South Africa’s exports) and Angola (20% annual growth of South Africa’s exports) were the most attractive markets for South Africa but in a declining market for grape wines.

60
Figure 17: Prospects for market diversification for grape wines exported by South Africa in 2010
Source: Trade Map of the International Trade Centre

61
Figure 17 above depicts prospects for market diversification for grape wines exported by South Africa to the world in 2010 period. The bubble graph further depicts that during the same period under review, Germany, United Kingdom and Sweden were the biggest markets of grape wines exported by South Africa. Sweden commanded the greatest share of approximately 26% per annum in South Africa’s exports of grape wines, while it’s annual growth of partner countries imports of grape wine from the rest of the world were approximately10% per annum between 2006 and 2010 period. The bubble graph futher depicts that if South Africa were to diversify its exports of grape wines, the most attractive market for diversification would be Russian Federation, followed by Thailand and China.

62
Table 20: List of supplying markets for grape wines imported by South Africa in 2010
Exporters
Trade Indicators Tariff
(estimated) applied by South Africa
(%)
Imported value 2010
(USD thousand)
Share in South Africa's
imports (%)
Imported quantity
2010 (tons)
Unit value (USD/unit)
Imported growth in value
between 2006-2010 (%, p.a.)
Imported growth in quantity between 2006-2010 (%, p.a.)
Imported growth in value
between 2009-2010 (%, p.a.)
World 792 100 284 2789 -14 -42 11 France 438 55.3 1 438000 6157 2.8 South Africa 293 37 259 1131 -4 -5 Portugal 39 4.9 17 2294 7 -11 290 2.8 Italy 17 2.1 5 3400 36 7 55 2.8 United Kingdom 3 0.4 0 0 2.8 Source: TradeMap Table 20 indicates the list of supplying markets for grape wines imported by South Africa from the world in 2010. The table further indicates that South Africa is a net exporter of grape wines. The table also indicates that greater volumes of grape wines from the world into South Africa were from Portugal, followed by Italy during the period under review. Portugal supplied South Africa with 17 tons of grape wines to South Africa, while Italy supplied South Africa with 5 tons of grape wines. Interesting to note was that France had a highest share in South Africa’s imports of grape wines although France supplied small quantities of grape wines to South Africa during the 2010 period. The table further indicates that South Africa supplied its self with 259 tons of grape wines with its share of approximately 37%. The world average exports of grape wines to South Africa in value and volume terms were negative between 2006 and 2010 period, the imported growth in value between 2009 and 2010 period increased to approximately 11% per annum.

63
Figure 18: Competitiveness of suppliers to South Africa for grape wines imports in 2010
Source: Trade Map of the International Trade Centre

64
Figure 18 above confirms competitiveness of suppliers to South Africa for grape wines imported by South Africa from the world in 2010. The bubble graph further confirms that South Africa and United Kingdom were the biggest markets for grape wines during the period under review. The bubble graph also confirms that between 2006 and 2010 period, Italy was the most competitive supplier of grape wines to South Africa with an annual growth of South Africa’s imports of 37%. Portugal was the second most competitive market in terms of the annual growth of its wine exports to South Africa between 2006 and 2010 with an annual groth of South Africa’s imports of 8%.

65
Figure 19: Prospects for diversification of suppliers for grape wines imported by South Africa in 2010
Source: Trade Map of the International Trade Centre

66
Figure 19 above illustrates prospects for diversification of suppliers for grape wines imported by South Africa in 2010. The figure further illustrates that South Africa and United Kingdom were the biggest markets for grape wines during the period under review. The figure also illustrates that France was the smallest market compared to South Africa and and United Kingdom, but its share of partner countries in South Africa’s imports of grape wines increased at approximately 55% between 2006 and 2010 period. The bubble graph also illustrates that if South Africa were to diversify its suppliers of grape wines , small but attractive markets exist in France, Bahrain, Barbados and Brazil during the period under review.

67
5. MARKET ACCESS
Barriers to trade can be divided into tariff barriers (including quotas, ad valorem tariffs, specific tariffs and entry price systems) and non tariff barriers (sanitary and phytosanitary measures, labels, etc). The main markets for wine employ various measures, both tariff and non tariff to protect the domestic industries. Whilst many of the non tariff measures can be justified under the auspices of issues such as health and standards, the tariff measures are increasingly under the scrutiny of the World Trade Organization (WTO), and as such are gradually being phased out. Nevertheless, exporters need to be aware of all the barriers that they may encounter when trying to get their produce on foreign shelves.
5.1 Tariff, quotas and the price entry system
Tariffs are either designed to earn government revenue from products being imported or to raise the price of imports so as to render local produce more competitive and protect domestic industries. Quotas can be used to protect domestic industries from excessive imports originating from areas with some form of competitive advantage (which can therefore produce lower cost produce). Tariffs and quotas are often combined, allowing the imports to enter at a certain tariff rate up to a specified quantity. Thereafter, imports from that particular region will attract higher tariffs, or will not be allowed at all. The entry price system, which is used in many northern hemisphere markets, makes use of multiple tariff rates during different periods when domestic producers are trying to sell their produce, and lower the tariffs during their off-season. Alternatively, the tariff rate can be a function of a market price – if the produce enters at a price which is too low (and therefore likely to be too competitive), it qualifies for a higher tariff schedule. Whilst tariff regulations can be prohibitive and result in inferior market access, it is often the non tariff barriers that restrict countries like South from successfully entering the large developed markets. Many of these barriers revolve around different types of standards, including sanitary and phytosanitary standards (SPS), food health and safety issues, food labeling and packaging, organic produce certification, quality assurance and other standards and grades. Table 21: Tariffs applied by EU markets to wine of fresh grapes, including fortified wines, and grape must whose fermentation has been arrested by addition of alcohol, in containers of > 2 litres from South Africa
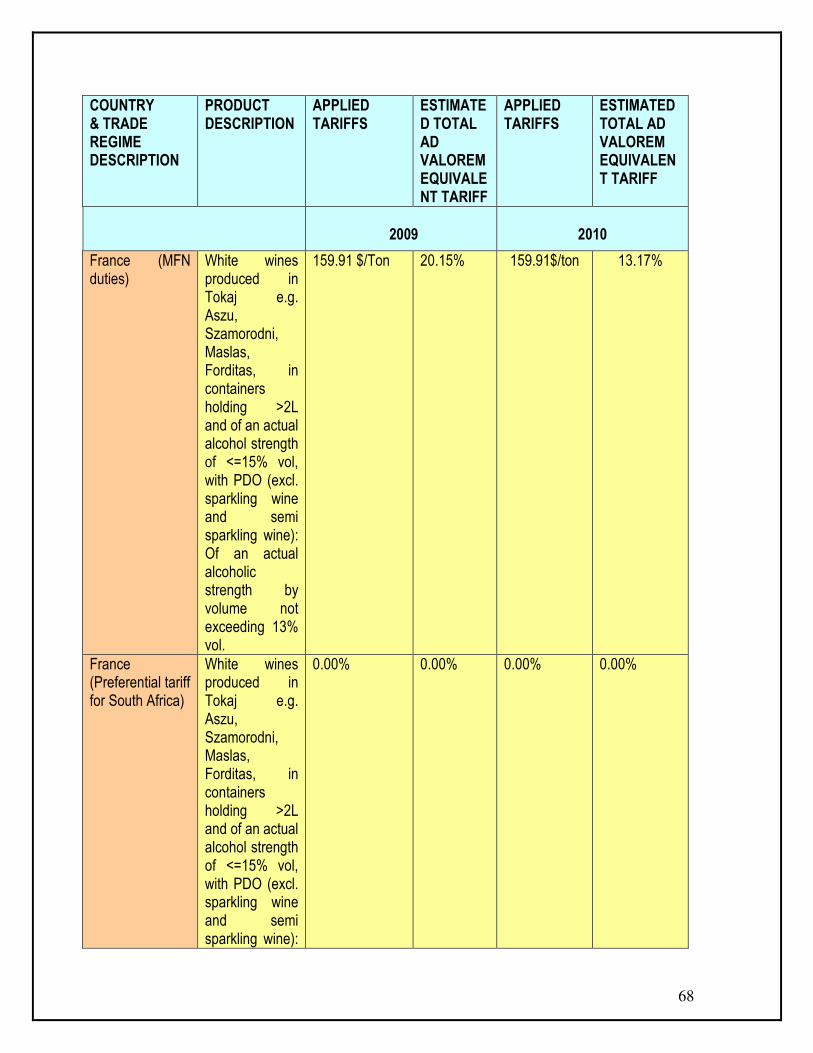
68
COUNTRY & TRADE REGIME DESCRIPTION
PRODUCT DESCRIPTION
APPLIED TARIFFS
ESTIMATED TOTAL AD VALOREM EQUIVALENT TARIFF
APPLIED TARIFFS
ESTIMATED TOTAL AD VALOREM EQUIVALENT TARIFF
2009
2010
France (MFN duties)
White wines produced in Tokaj e.g. Aszu, Szamorodni, Maslas, Forditas, in containers holding >2L and of an actual alcohol strength of <=15% vol, with PDO (excl. sparkling wine and semi sparkling wine): Of an actual alcoholic strength by volume not exceeding 13% vol.
159.91 $/Ton
20.15%
159.91$/ton 13.17%
France (Preferential tariff for South Africa)
White wines produced in Tokaj e.g. Aszu, Szamorodni, Maslas, Forditas, in containers holding >2L and of an actual alcohol strength of <=15% vol, with PDO (excl. sparkling wine and semi sparkling wine):
0.00%
0.00%
0.00% 0.00%
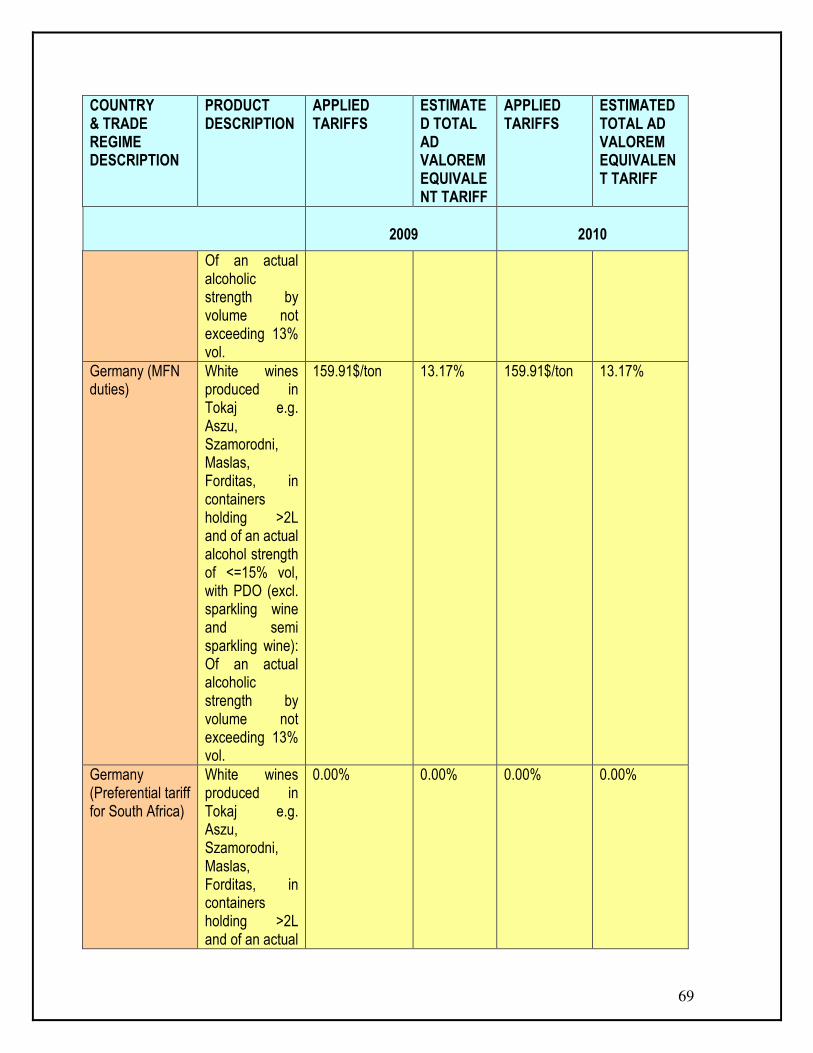
69
COUNTRY & TRADE REGIME DESCRIPTION
PRODUCT DESCRIPTION
APPLIED TARIFFS
ESTIMATED TOTAL AD VALOREM EQUIVALENT TARIFF
APPLIED TARIFFS
ESTIMATED TOTAL AD VALOREM EQUIVALENT TARIFF
2009
2010
Of an actual alcoholic strength by volume not exceeding 13% vol.
Germany (MFN duties)
White wines produced in Tokaj e.g. Aszu, Szamorodni, Maslas, Forditas, in containers holding >2L and of an actual alcohol strength of <=15% vol, with PDO (excl. sparkling wine and semi sparkling wine): Of an actual alcoholic strength by volume not exceeding 13% vol.
159.91$/ton 13.17% 159.91$/ton 13.17%
Germany (Preferential tariff for South Africa)
White wines produced in Tokaj e.g. Aszu, Szamorodni, Maslas, Forditas, in containers holding >2L and of an actual
0.00% 0.00%
0.00% 0.00%

70
COUNTRY & TRADE REGIME DESCRIPTION
PRODUCT DESCRIPTION
APPLIED TARIFFS
ESTIMATED TOTAL AD VALOREM EQUIVALENT TARIFF
APPLIED TARIFFS
ESTIMATED TOTAL AD VALOREM EQUIVALENT TARIFF
2009
2010
alcohol strength of <=15% vol, with PDO (excl. sparkling wine and semi sparkling wine): Of an actual alcoholic strength by volume not exceeding 13/% vol.
Italy (MFN duties)
White wines produced in Tokaj e.g. Aszu, Szamorodni, Maslas, Forditas, in containers holding >2L and of an actual alcohol strength of <=15% vol, with PDO (excl. sparkling wine and semi sparkling wine): Of an actual alcoholic strength by volume not exceeding 13% vol.
159.91 $/Ton
13.17% 159.91$/ton 13.17%
Italy (Preferential tariff for South Africa)
White wines produced in Tokaj e.g. Aszu,
0.00%
0.00% 0.00% 0.00%

71
COUNTRY & TRADE REGIME DESCRIPTION
PRODUCT DESCRIPTION
APPLIED TARIFFS
ESTIMATED TOTAL AD VALOREM EQUIVALENT TARIFF
APPLIED TARIFFS
ESTIMATED TOTAL AD VALOREM EQUIVALENT TARIFF
2009
2010
Szamorodni, Maslas, Forditas, in containers holding >2L and of an actual alcohol strength of <=15% vol, with PDO (excl. sparkling wine and semi sparkling wine): Of an actual alcoholic strength by volume not exceeding 13/% vol.
United Kingdom (MFN duties)
White wines produced in Tokaj e.g. Aszu, Szamorodni, Maslas, Forditas, in containers holding >2L and of an actual alcohol strength of <=15% vol, with PDO (excl. sparkling wine and semi sparkling wine): Of an actual alcoholic strength by volume not
159.45 $/Ton
13.17% 159.91$/ton 13.17%
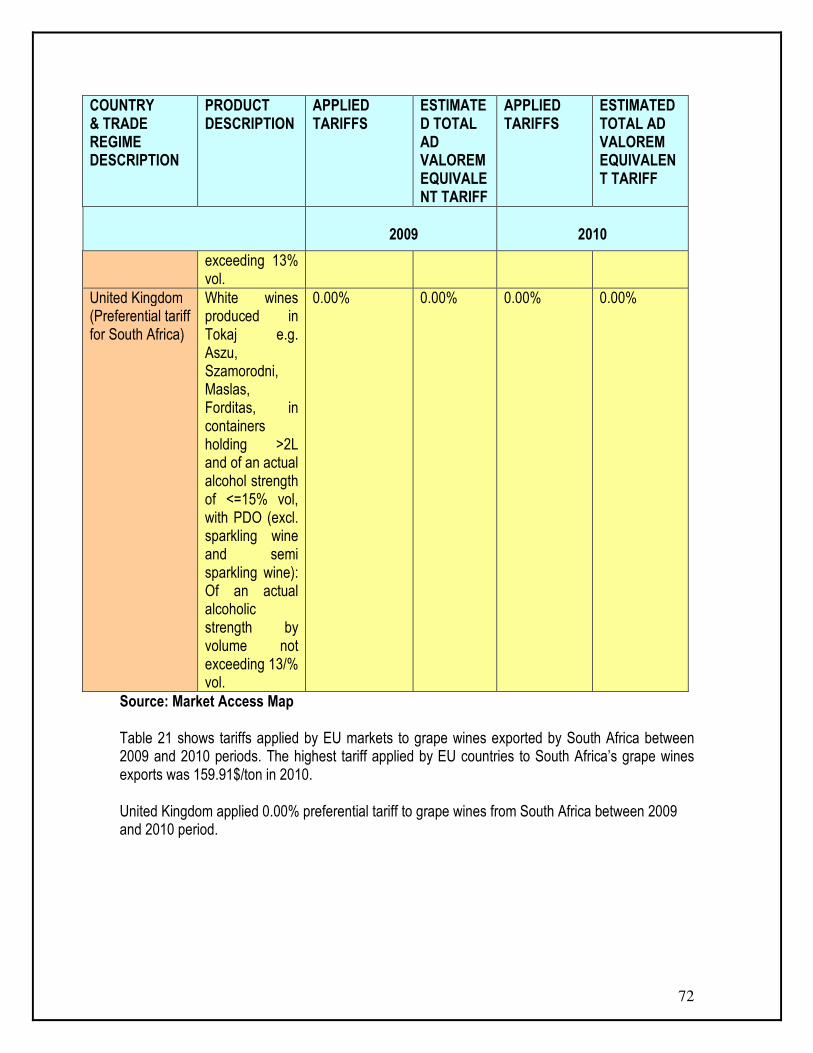
72
COUNTRY & TRADE REGIME DESCRIPTION
PRODUCT DESCRIPTION
APPLIED TARIFFS
ESTIMATED TOTAL AD VALOREM EQUIVALENT TARIFF
APPLIED TARIFFS
ESTIMATED TOTAL AD VALOREM EQUIVALENT TARIFF
2009
2010
exceeding 13% vol.
United Kingdom (Preferential tariff for South Africa)
White wines produced in Tokaj e.g. Aszu, Szamorodni, Maslas, Forditas, in containers holding >2L and of an actual alcohol strength of <=15% vol, with PDO (excl. sparkling wine and semi sparkling wine): Of an actual alcoholic strength by volume not exceeding 13/% vol.
0.00%
0.00% 0.00% 0.00%
Source: Market Access Map Table 21 shows tariffs applied by EU markets to grape wines exported by South Africa between 2009 and 2010 periods. The highest tariff applied by EU countries to South Africa’s grape wines exports was 159.91$/ton in 2010. United Kingdom applied 0.00% preferential tariff to grape wines from South Africa between 2009 and 2010 period.

73
Table 22: Tariffs applied by USA to wine of fresh grapes, including fortified wines, and grape must whose fermentation has been arrested by addition of alcohol, in containers of > 2 litres from South Africa
COUNTRY & TRADE REGIME DESCRIPTION
PRODUCT DESCRIPTION
APPLIED TARIFFS
ESTIMATED TOTAL AD VALOREM EQUIVALENT TARIFF
APPLIED TARIFFS
ESTIMATED TOTAL AD VALOREM EQUIVALENT TARIFF
2009
2010
USA (Preferential tariff for AGOA countries)
Grape wine, other than sparkling, not over 14% vol. alcohol, in containers holding over 2 litres but not over 4 litres.
84.00$/ton 2.45% 84.00$/ton 2.45%
USA (Preferential tariff for AGOA countries)
Grape wine, other than sparkling, over 14% vol. alcohol, in containers holding over 2 litres but not over 4 litres.
224.00$/ton 1.98% 0.00% 0.00%
USA (Preferential tariff for AGOA countries)
Grape wine, other than sparkling, not over 14% vol. alcohol, in containers holding over 4 litres.
140.00% 13.82% 0.00% 0.00%
USA (Preferential tariff for AGOA countries)
Grape wine, other than sparkling, over 14% vol. alcohol, in containers holding over 4 litres.
224.00$/ton 12.11% 0.00% 0.00%
Source: Market Access Map
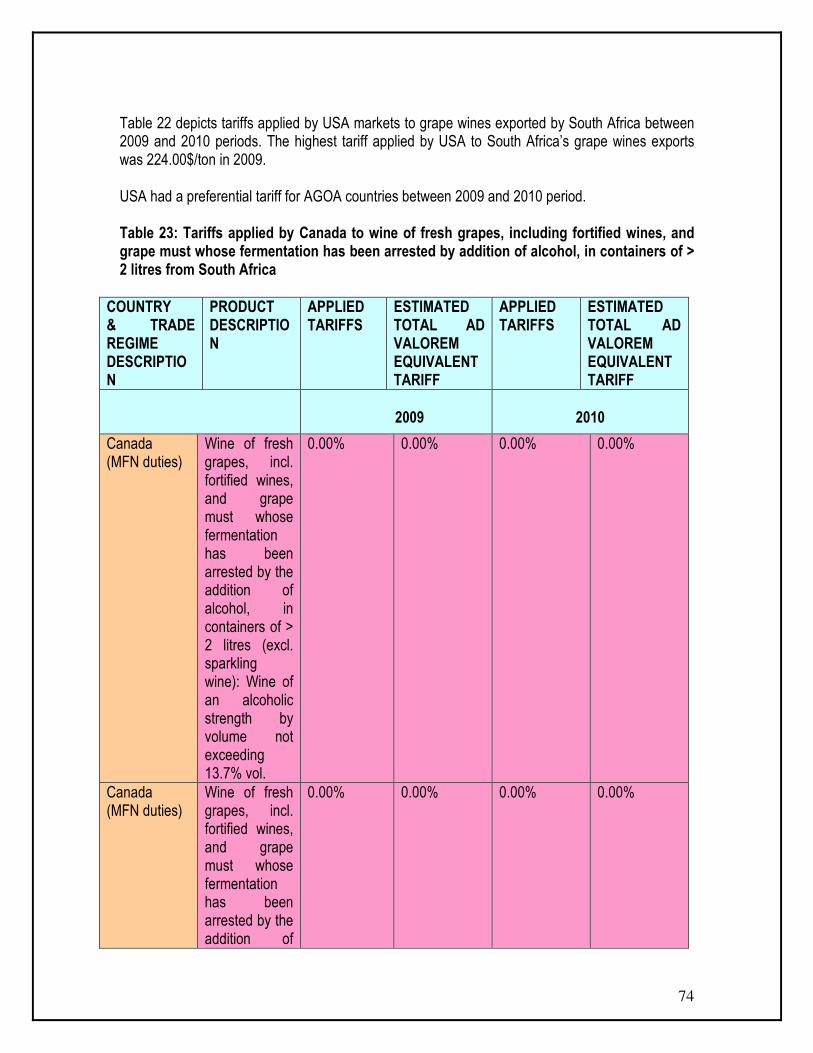
74
Table 22 depicts tariffs applied by USA markets to grape wines exported by South Africa between 2009 and 2010 periods. The highest tariff applied by USA to South Africa’s grape wines exports was 224.00$/ton in 2009. USA had a preferential tariff for AGOA countries between 2009 and 2010 period. Table 23: Tariffs applied by Canada to wine of fresh grapes, including fortified wines, and grape must whose fermentation has been arrested by addition of alcohol, in containers of > 2 litres from South Africa
COUNTRY & TRADE REGIME DESCRIPTION
PRODUCT DESCRIPTION
APPLIED TARIFFS
ESTIMATED TOTAL AD VALOREM EQUIVALENT TARIFF
APPLIED TARIFFS
ESTIMATED TOTAL AD VALOREM EQUIVALENT TARIFF
2009
2010
Canada (MFN duties)
Wine of fresh grapes, incl. fortified wines, and grape must whose fermentation has been arrested by the addition of alcohol, in containers of > 2 litres (excl. sparkling wine): Wine of an alcoholic strength by volume not exceeding 13.7% vol.
0.00% 0.00% 0.00% 0.00%
Canada (MFN duties)
Wine of fresh grapes, incl. fortified wines, and grape must whose fermentation has been arrested by the addition of
0.00% 0.00% 0.00% 0.00%
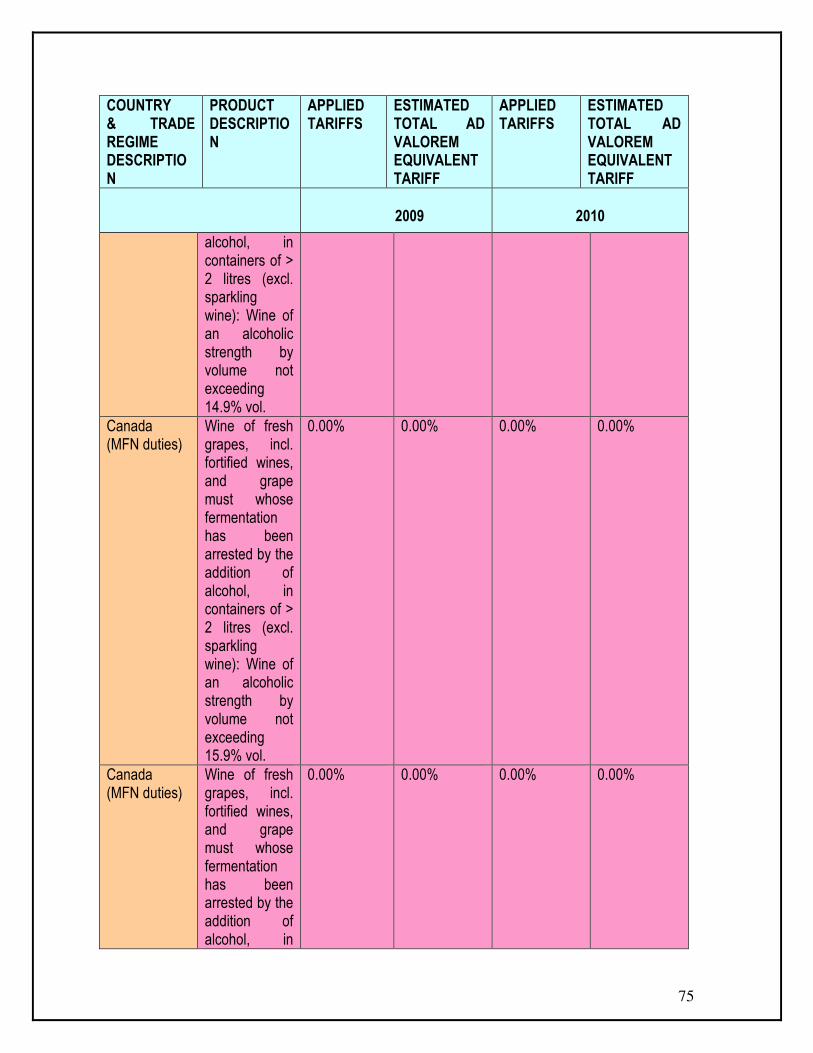
75
COUNTRY & TRADE REGIME DESCRIPTION
PRODUCT DESCRIPTION
APPLIED TARIFFS
ESTIMATED TOTAL AD VALOREM EQUIVALENT TARIFF
APPLIED TARIFFS
ESTIMATED TOTAL AD VALOREM EQUIVALENT TARIFF
2009
2010
alcohol, in containers of > 2 litres (excl. sparkling wine): Wine of an alcoholic strength by volume not exceeding 14.9% vol.
Canada (MFN duties)
Wine of fresh grapes, incl. fortified wines, and grape must whose fermentation has been arrested by the addition of alcohol, in containers of > 2 litres (excl. sparkling wine): Wine of an alcoholic strength by volume not exceeding 15.9% vol.
0.00% 0.00% 0.00% 0.00%
Canada (MFN duties)
Wine of fresh grapes, incl. fortified wines, and grape must whose fermentation has been arrested by the addition of alcohol, in
0.00% 0.00% 0.00% 0.00%

76
COUNTRY & TRADE REGIME DESCRIPTION
PRODUCT DESCRIPTION
APPLIED TARIFFS
ESTIMATED TOTAL AD VALOREM EQUIVALENT TARIFF
APPLIED TARIFFS
ESTIMATED TOTAL AD VALOREM EQUIVALENT TARIFF
2009
2010
containers of > 2 litres (excl. sparkling wine): Wine of an alcoholic strength by volume not exceeding 16.9% vol.
Canada (MFN duties)
Wine of fresh grapes, incl. fortified wines, and grape must whose fermentation has been arrested by the addition of alcohol, in containers of > 2 litres (excl. sparkling wine): Wine of an alcoholic strength by volume not exceeding 17.9% vol.
0.00% 0.00% 0.00% 0.00%
Canada (MFN duties)
Wine of fresh grapes, incl. fortified wines, and grape must whose fermentation has been arrested by the addition of alcohol, in containers of >
0.00% 0.00% 0.00% 0.00%

77
COUNTRY & TRADE REGIME DESCRIPTION
PRODUCT DESCRIPTION
APPLIED TARIFFS
ESTIMATED TOTAL AD VALOREM EQUIVALENT TARIFF
APPLIED TARIFFS
ESTIMATED TOTAL AD VALOREM EQUIVALENT TARIFF
2009
2010
2 litres (excl. sparkling wine): Wine of an alcoholic strength by volume not exceeding 18.9% vol.
Canada (MFN duties)
Wine of fresh grapes, incl. fortified wines, and grape must whose fermentation has been arrested by the addition of alcohol, in containers of > 2 litres (excl. sparkling wine): Wine of an alcoholic strength by volume not exceeding 19.9% vol.
0.00% 0.00% 0.00% 0.00%
Canada (MFN duties)
Wine of fresh grapes, incl. fortified wines, and grape must whose fermentation has been arrested by the addition of alcohol, in containers of > 2 litres (excl.
0.00% 0.00% 0.00% 0.00%
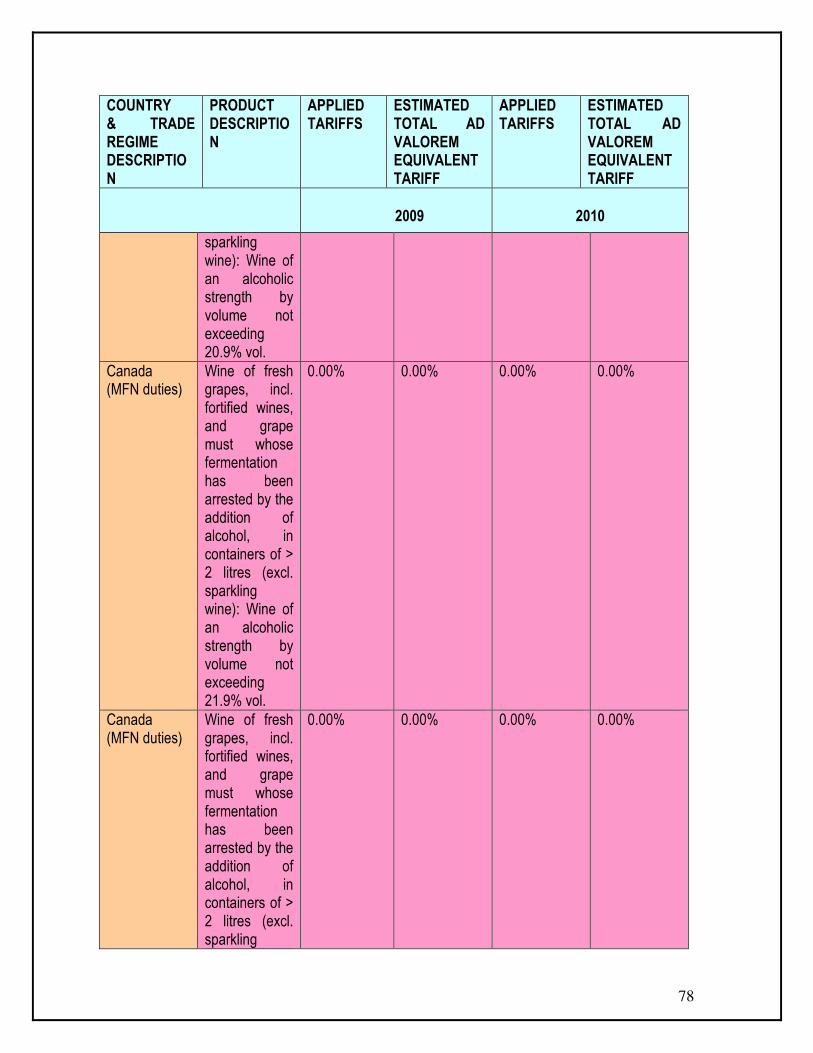
78
COUNTRY & TRADE REGIME DESCRIPTION
PRODUCT DESCRIPTION
APPLIED TARIFFS
ESTIMATED TOTAL AD VALOREM EQUIVALENT TARIFF
APPLIED TARIFFS
ESTIMATED TOTAL AD VALOREM EQUIVALENT TARIFF
2009
2010
sparkling wine): Wine of an alcoholic strength by volume not exceeding 20.9% vol.
Canada (MFN duties)
Wine of fresh grapes, incl. fortified wines, and grape must whose fermentation has been arrested by the addition of alcohol, in containers of > 2 litres (excl. sparkling wine): Wine of an alcoholic strength by volume not exceeding 21.9% vol.
0.00% 0.00% 0.00% 0.00%
Canada (MFN duties)
Wine of fresh grapes, incl. fortified wines, and grape must whose fermentation has been arrested by the addition of alcohol, in containers of > 2 litres (excl. sparkling
0.00% 0.00% 0.00% 0.00%

79
COUNTRY & TRADE REGIME DESCRIPTION
PRODUCT DESCRIPTION
APPLIED TARIFFS
ESTIMATED TOTAL AD VALOREM EQUIVALENT TARIFF
APPLIED TARIFFS
ESTIMATED TOTAL AD VALOREM EQUIVALENT TARIFF
2009
2010
wine): Wine of an alcoholic strength by volume not exceeding 22.9% vol.
Source: Market Access Map Table 23 shows tariffs applied by Canadian markets to grape wines exported by South Africa between 2009 and 2010 periods. Canadians applied 0.00% tariffs to South Africa’s grape wines exports between 2009 and 2010. Table 24: Tariffs applied by various export markets to wine of fresh grapes, including fortified wines, and grape must whose fermentation has been arrested by addition of alcohol, in containers of > 2 litres from South Africa
COUNTRY & TRADE REGIME DESCRIPTION
PRODUCT DESCRIPTION
APPLIED TARIFFS
ESTIMATED TOTAL AD VALOREM EQUIVALENT TARIFF
APPLIED TARIFFS
ESTIMATED TOTAL AD VALOREM EQUIVALENT TARIFF
2009
2010
Japan (Preferential tariff for GSP countries)
Wine of fresh grapes, incl. fortified wines, and grape must whose fermentation has been arrested by the addition of alcohol, in containers of > 2 litres (excl. sparkling wine): Other
228.34$/ton 28.51% 228.34$/ton 28.51%

80
COUNTRY & TRADE REGIME DESCRIPTION
PRODUCT DESCRIPTION
APPLIED TARIFFS
ESTIMATED TOTAL AD VALOREM EQUIVALENT TARIFF
APPLIED TARIFFS
ESTIMATED TOTAL AD VALOREM EQUIVALENT TARIFF
2009
2010
wine of fresh grapes, including fortified wine, grape must with fermentation prevented or arrested by addition of alcohol
Switzerland (Preferential tariff for GSP countries)
Wine of fresh grapes, incl. fortified wines, and grape must whose fermentation has been arrested by the addition of alcohol, in containers of > 2 litres
0.00% 0.00% 2898.21$/ton 233.585
Switzerland (Preferential tariff for SACU countries)
Wine of fresh grapes, incl. fortified wines, and grape must whose fermentation has been arrested by the addition of alcohol, in containers of > 2 litres
0.00% 0.00% 0.00% 0.00%
Norway (MFN duties)
Wine of fresh grapes, incl. fortified wines;
0.00% 0.00% 0.00% 0.00%

81
COUNTRY & TRADE REGIME DESCRIPTION
PRODUCT DESCRIPTION
APPLIED TARIFFS
ESTIMATED TOTAL AD VALOREM EQUIVALENT TARIFF
APPLIED TARIFFS
ESTIMATED TOTAL AD VALOREM EQUIVALENT TARIFF
2009
2010
grape must other than that of heading 20.09. – other ;grape must with fermentation prevented or arrested by the addition of alcohol: Other: Of an alcoholic strength by volume not exceeding 2.5%
Norway (MFN duties)
Wine of fresh grapes, incl. fortified wines; grape must other than that of heading 20.09. – other ;grape must with fermentation prevented or arrested by the addition of alcohol: Other:
0.00% 0.00% 0.00% 0.00%
Russia (General tariff)
Wine of fresh grapes, incl. fortified wines, and grape must whose fermentation has been arrested by the
20.00% 20.00% 20.00% 20.00%
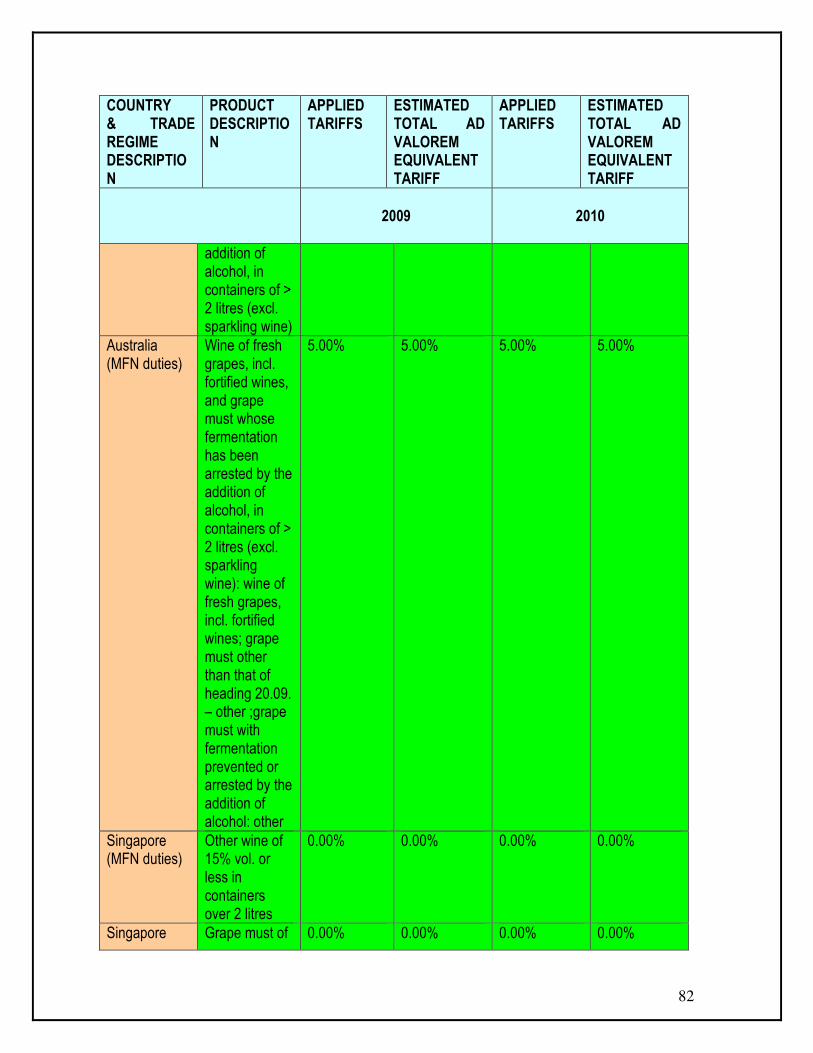
82
COUNTRY & TRADE REGIME DESCRIPTION
PRODUCT DESCRIPTION
APPLIED TARIFFS
ESTIMATED TOTAL AD VALOREM EQUIVALENT TARIFF
APPLIED TARIFFS
ESTIMATED TOTAL AD VALOREM EQUIVALENT TARIFF
2009
2010
addition of alcohol, in containers of > 2 litres (excl. sparkling wine)
Australia (MFN duties)
Wine of fresh grapes, incl. fortified wines, and grape must whose fermentation has been arrested by the addition of alcohol, in containers of > 2 litres (excl. sparkling wine): wine of fresh grapes, incl. fortified wines; grape must other than that of heading 20.09. – other ;grape must with fermentation prevented or arrested by the addition of alcohol: other
5.00% 5.00% 5.00% 5.00%
Singapore (MFN duties)
Other wine of 15% vol. or less in containers over 2 litres
0.00% 0.00% 0.00% 0.00%
Singapore Grape must of 0.00% 0.00% 0.00% 0.00%

83
COUNTRY & TRADE REGIME DESCRIPTION
PRODUCT DESCRIPTION
APPLIED TARIFFS
ESTIMATED TOTAL AD VALOREM EQUIVALENT TARIFF
APPLIED TARIFFS
ESTIMATED TOTAL AD VALOREM EQUIVALENT TARIFF
2009
2010
(MFN duties) with fermentation prevented over 15% vol. in containers over 2 litres
Angola (MFN duties)
Wine of fresh grapes, incl. fortified wines, and grape must whose fermentation has been arrested by the addition of alcohol, in containers of > 2 litres (excl. sparkling wine)
15.00% 15.00% 15.00% 15.00%
Mauritius (MFN duties (Applied)
Wine of fresh grapes, incl. fortified wines, and grape must other than that of heading 20.09.: Other wine, grape must with fermentation prevented or arrested by addition of alcohol: Other: In bulk for bottling.
15.00% 15.00% 15.00% 15.00%
Mauritius (Preferential
Wine of fresh grapes, incl.
15.00% 15.00% 0.00% 0.00%
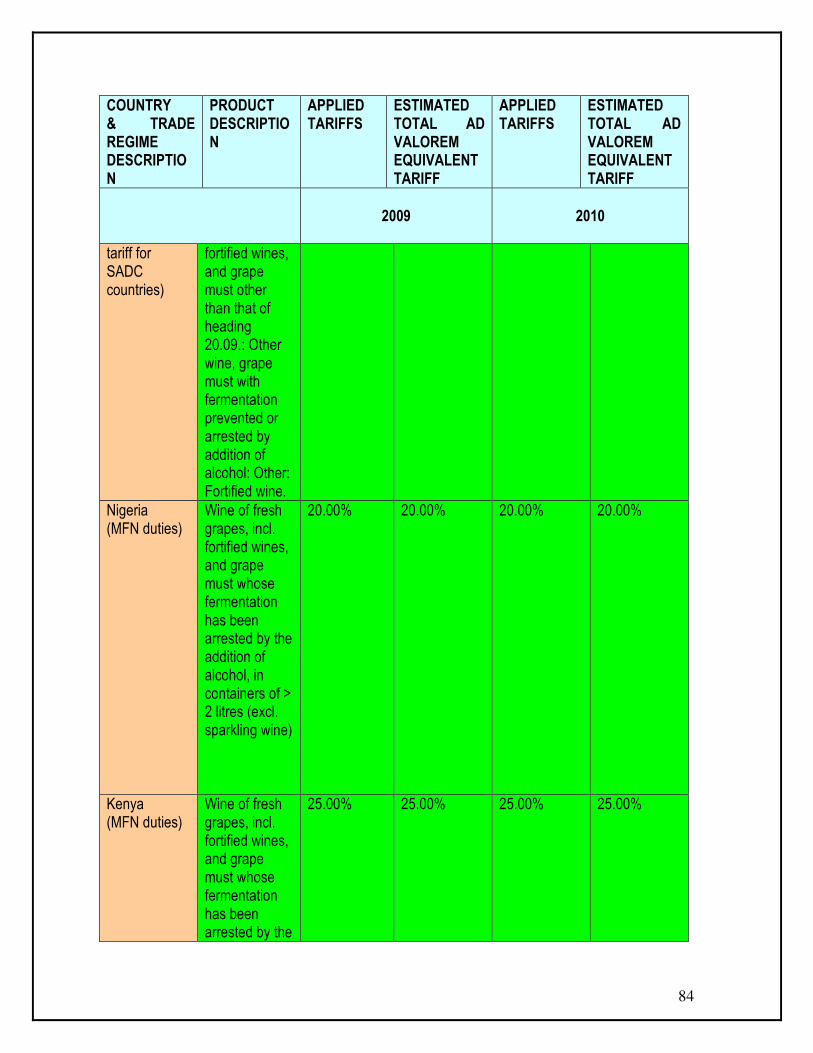
84
COUNTRY & TRADE REGIME DESCRIPTION
PRODUCT DESCRIPTION
APPLIED TARIFFS
ESTIMATED TOTAL AD VALOREM EQUIVALENT TARIFF
APPLIED TARIFFS
ESTIMATED TOTAL AD VALOREM EQUIVALENT TARIFF
2009
2010
tariff for SADC countries)
fortified wines, and grape must other than that of heading 20.09.: Other wine, grape must with fermentation prevented or arrested by addition of alcohol: Other: Fortified wine.
Nigeria (MFN duties)
Wine of fresh grapes, incl. fortified wines, and grape must whose fermentation has been arrested by the addition of alcohol, in containers of > 2 litres (excl. sparkling wine)
20.00% 20.00% 20.00% 20.00%
Kenya (MFN duties)
Wine of fresh grapes, incl. fortified wines, and grape must whose fermentation has been arrested by the
25.00% 25.00% 25.00% 25.00%

85
COUNTRY & TRADE REGIME DESCRIPTION
PRODUCT DESCRIPTION
APPLIED TARIFFS
ESTIMATED TOTAL AD VALOREM EQUIVALENT TARIFF
APPLIED TARIFFS
ESTIMATED TOTAL AD VALOREM EQUIVALENT TARIFF
2009
2010
addition of alcohol, in containers of > 2 litres (excl. sparkling wine)
Tanzania (MFN duties)
Wine of fresh grapes, incl. fortified wines, and grape must whose fermentation has been arrested by the addition of alcohol, in containers of > 2 litres (excl. sparkling wine)
25.00% 25.00% 25.00% 25.00%
New Zealand (MFN duties)
Wine of fresh grapes, incl. fortified wines, and grape must whose fermentation has been arrested by the addition of alcohol, in containers of > 2 litres (excl. sparkling wine)
5.00% 5.00% 5.00% 5.00%
China (MFN duties)
Wine of fresh grapes, incl. fortified wines, and grape must whose fermentation has been
20.00% 20.00% 20.00% 20.00%

86
COUNTRY & TRADE REGIME DESCRIPTION
PRODUCT DESCRIPTION
APPLIED TARIFFS
ESTIMATED TOTAL AD VALOREM EQUIVALENT TARIFF
APPLIED TARIFFS
ESTIMATED TOTAL AD VALOREM EQUIVALENT TARIFF
2009
2010
arrested by the addition of alcohol, in containers of > 2 litres (excl. sparkling wine)
UAE (MFN duties)
Wine of fresh grapes, incl. fortified wines, and grape must whose fermentation has been arrested by the addition of alcohol, in containers of > 2 litres (excl. sparkling wine)
50.00% 50.00% 50.00% 50.00%
Source: Market Access Map Table 24 shows tariffs applied by various markets to grape wines exports from South Africa between 2009 and 2010 period. United Arab Emirates was the most highly protected market for grape wines from South Africa between 2009 and 2010 period at approximately 50.00%, followed by Tanzania at approximately 25.00% over the same period. In reality, the tariffs are likely to be far lower for South Africa when considering the preferential agreements, but at the same time, most tariff structures are particularly complex, with quotas, seasonal tariffs and specific tariffs (an amount per unit than rather than a percentage of value) all contributing to many different tariff lines and often higher duties payable than one might have anticipated initially. One must also bear in mind that most tariffs are designated to protect domestic industries, and as such are likely to discriminate against those attempting to compete with the domestic producers of that country. One can also see that certain countries wishing to protect their local industries (presumably in which they feel vulnerable or where large number of farmers are employed) will raise prohibitive levels. African countries (such as Tanzania, Nigeria, Kenya and Angola), European countries (such

87
as Russia) and Middle East countries (such as United Arab Emirates) have reasonably high tariffs for wines originating from South Africa.
5.2 The EU-South Africa wine agreement and its implications
Many of the South African regulations are built to ensure local compliance with a plethora of regulations that are applied on imports into the EU, US and other countries. Because EU is by far the main export market for South Africa, more emphasis will be on that market. Wine trade between the EU and South Africa is regulated by the 2002 ‘Agreement in wine’, and is part of the overall ‘Trade, Development and Cooperation Agreement’ (TDCA) between the two countries which was finalized in 1999/2000. What is important is to highlight is that the use of geographic origin names (such as ‘port’ and ‘sherry’ almost derailed the whole TDCA. Only by signing separate agreements on wine and spirits was South Africa able to conclude the TDCA. During the TDCA negotiation process, the EU (under pressure from Spain and Portugal) made the case that South African producers should stop using the names ‘port’ and ‘sherry’ for wines of these styles that are produced locally. In order to conclude a draft TDCA agreement, South Africa agreed to phase these names out over a period of five years in export markets and twelve years in domestic market. In exchange, the EU committed to assist South African producers in designing new names for their products. However, the controversy re-surfaced again later in 1999 when the TDCA was been finalized. At that point, Greece and Italy objected to the use of the names ‘grappa’ and ‘ouzo’. It is worth remembering that exports of port and sherry form South Africa are minimal, and that local production of grappa and ouzo is miniscule, with basically no exports. While the TDCA went into force, these specific issues were only resolved in 2002 with the signing of the wine agreement. The agreement provides for the reciprocal protection of geographic names and defines a list of acceptable oenological practices, descriptions and presentations of wine. It includes clauses for the elimination of the use of the names port and sherry, and also grappa and ouzo. The EU eventually agreed to provide South Africa with a duty-free tariff quota for 35.3 million litres of wine, with an additional 6.72 million litres added to the basic allocation each year from 2002 to 2011. Under the agreement, South African exports are required to comply with sanitary, phytosanitary and other technical requirements and the rules of origin as stipulated by the TDCA. The 80% of the first allocation of permits was divided up in proportion of historical market share of exporters, and the rest to the SMMEs. The 2002 agreement unfortunately did not end controversies. The EU later insisted that South Africa gives up the right to trademark names that include geographic locations, such as Nederburg and Roodeberg – two well known brands in South Africa that are exported. Interestingly, these names are not in the 78 page list of EU geographical indications of wine to be protected (as in 2002 wine agreement), no wine is made these two places located in Netherlands and Belgium. Furthermore, the EU started raising problems with the use of descriptors such as ‘ruby’ and ‘tawny’ in port-style wines (which are without the name ‘port’), and descriptors such as ‘claret’ or ‘ripasso’ in wine. This was a consequence of the application of new EU regulations on geographical
88
indications that were supposed to ‘relax’ wine labeling rules for non EU producers. This itself was the result of a successful case brought by the USA against the EU in front of the World Trade Organizations (WTO) Dispute Settlement Board for breaching the Trade Related Aspects of Intellectual Property Rights (TRIPS) and General Agreement on Tariffs and Trade (GATT) agreements. These regulations allow some ‘traditional’ expressions such as ‘classico’ or ‘amarone’ to be used in the non member countries provided that:
• The term has been used in the country for at least ten years, • Is recognized and governed by the rules which apply to wine producers, • Is specific, • Is distinctive and/or enjoys a reputation in that country, • If the expression is in a language other than the official language of the country, the
continual use has to be proven for 25 years.
As a result of continuing disagreements between the EU and South Africa, the wine agreement has actually never been ratified, and the 15 million Euros compensation fund has not been disbursed. The tariff quota system, on the other hand, has been put in operation. Interestingly, tariff quotas have been utilized mainly for exports into the UK. When the tariff quota was first applied, retailers in Europe refused to pass on the import tariff cut to exporters and instead pocketed the difference. Subsequently, under pressure from WOSA, UK retailers agreed to deposit tariff quota savings into a WOSA fund for the generic promotion of South African wine in the UK. Retailers in the Netherlands refused to do so and thus exporters in practice have used licenses for tariff quota exports primarily destined to the UK.
5.2.1 Rules on additives, processes and what is natural wine
The International Organization of Vine and Wine (OIV) is the international industry body in charge of approving the permitted substances and technical processes to be used in wine production. It is an inter-governmental body, based in Paris, whose resolutions are voluntary. The EU, however, has embedded the OIV list in its own regulations, so all wines exported to the EU needs to conform to the OIV list. In practice, given the importance of the EU New World wine exports, OIV has a quasi-regulatory status. In South Africa, the regulatory power in relation to these additives and processes is vested in Wine and Spirits Board and the Department of Agriculture. Any cellar can apply to have processes or additives registered, as long as they are ‘safe’, not ‘wine foreign’, do not leave undesirable residue and that the process does not alter the substance of wine. Rules and related discussions around ‘what is natural’ in wine are complex and disputed around the world. South Africa has also been at the centre of attention in recent years due to the so-called ‘flavourant scandal’. The process involves the addition of pyrazine to Sauvignon Blanc to impart an extra ‘green pepper’ profile that is highly regarded among the influential wine writers and judges. Sauvignon Blanc is fairly a newcomer to the Cape Peninsula – plantings started only in the 1970s but major expansion is as recent as the late 1990s, when it became a fashionable variety in the white wine markets, supplanting Chardonnay. The Cape Peninsula has areas that are ideal for growing Sauvignon Blanc, including Constantia, Walker Bay and Elim, where it exhibit fresh, herbaceous and green pepper profiles. Warmer

89
climates such as in Robertson can also yield some impressive Sauvignon Blancs, but generally with more tropical notes, and gooseberry and passion fruit ‘nose’. Yet, for years in the early 2000s, these warmer climate wines had expressed high levels of ‘green pepper’ aromas that were out of the ordinary. Technically, it is possible to manipulate wine in many different ways. The French have been legally adding sugar to their wines to increase alcohol level for centuries (and in certain circumstances, also acid), yet appellation rules in some areas prohibit the use of irrigation. It is possible to remove excess alcohol from wine through reverse osmosis (a practice that is legally sanctioned in Australia and now also in South Africa, but so far only for wine not destined to the EU). Concentration of must is in use in most First-Growth Bordeaux estates (and in many other places) to reduce the effect of dilution in rainy vintages (by using reverse osmosis or vacuum evaporators). In Australia, it is possible to extract flavour from grapes through spinning-cone technology and add its essence back to the final product. Vegetarians and/or vegans would probably recoil at knowing what agents are used for fining wine (to clarify and stabilize it) – among others, dried blood, egg white, fish bladder and milk – but they may approve of bentonite clay. While adding sugar is not necessary in South Africa (as a matter of fact, reducing alcohol is, acidification is frequently done and tannin addition increasingly so. All in all, 46 different substances are permitted as additives in wine making in South Africa (not pyrazine though). The key issues in this debate are: What is the level of manipulation that is acceptable for wine and in what historical/local context (and regulation)? Linked to these are the issues of ‘authenticity’ and ‘disclosure’ (the acceptance or not flavour-enhanced or added labeling) and issues of where to draw boundaries. Some observers have argued that ‘flavour-enhanced’ labeling should be adopted for wines that have been tampered with, for example with wood chips and staves, reverse osmosis and concentration devices, and that ‘flavourants added’ labeling should be used when a nature-equivalent flavourant is used. A related aspect is one of logistics. One way of looking at the use of wood chips and staves to stimulate barrel ageing is to consider the wine as needing to be ‘ready’ to be drunk immediately after purchase (overwhelmingly the case if the wine is purchased in supermarkets) in relation to the production costs of maturing wine for longish periods of time in oak barrels. In other words, wines need to be enjoyable at the moment of purchase nowadays, and thus manipulation is carried out at the expense of longetivity. But even in relation to ‘traditional’ techniques, like oak barrel maturation, some observers dissent on how much wooding is needed – too much wood is said to ‘dumb down’ a wine, providing simple, powerful flavouring that the new wine drinker can readily identify (especially if American wood is used, which imparts a clear vanilla character).
5.2.2 Voluntary standards
In addition to the regulations outlined so far, the wine trade is shaped by voluntary standards. These standards cover a wide array of aspects of labour conditions, production, processing, food safety and quality management more generally. Some of the standards are increasingly applied in the industry are the following:
90
• The International Standards Organization (ISO) 9000 and ISO 1400 series of standards on
quality management and environmental management respectively, • Hazard Analysis and Critical Control Point (HACCP) systems for food safety, • Wine Industry Ethical Trade Association (WIETA) code of conduct based on South African
labour legislation, • Fair Trade certification which aims at guaranteeing fair conditions in production and trade, • Organic and biodynamic certifications
Until recently, only few cellars had been certified against the ISO 9000 series of standards and HACCP systems. When done, the stimulus from South African wine industry actors themselves in the quest of improving quality management and therefore reputation with their buyers. HACCP compliance is becoming more important (and driven from outside), as HACCP has been embedded in the British Retail Consortium (BRC) food standard that is increasingly required by the European, especially UK retailers WIETA came into existence as a result of insistence of Ethical Trading Initiative (ETI)-aligned British supermarkets. Originally, it was almost identical copy of the ETI code, which was based on International Labour Organization (ILO) conventions. Following amended, it currently exceeds South African legislation. What kind of ‘attention’ it is attracting from European retailers is not clear. It is however struggling to sign up farms/cellars/firms – so much that it has moved into the fruit industry in order to remain viable. Fair Trade certification of wine was actually designed and implemented for the first time in South Africa and includes a few successful brands (Thandi being the most successful Fair Trade wine brand in the UK). Production of wine made from organic grapes is small but growing in South Africa, with emerging pockets of biodynamic production as well.
5.2.3 British Retailer Consortium (BRC) Global Standard – Food The most important standards for high volume wine exports to EU destinations are the BRC – Global Food Standard and its German equivalent – International Food Standard (IFS). These are a combination of standards on food safety (especially HACCP), Good Manufacturing Practices (GMP) and quality management (see box 1 on BRC) Box 1: BRC Global Standard – Food
Under the terms of the UK Food Safety Act 1990, retailers need to take reasonable precautions and exercise due diligence to avoid ‘failures’ in the development, manufacture, distribution, advertising or sale of food products to the consumer. This involves among other things, the verification of technical performance at food production sites. In much of the 1990s, each UK retailer undertook these activities separately and verified performance against its individual and internally developed standards. In most instances, verification was undertaken by in-house technologists and in other instances, by third party inspection bodies. In 1998, the BRC developed the BRC Food Technical Standard (now called Global Standard – Food). Initially, this was used mainly for the supply of retailers’ own private label products, but in

91
recent years also for food service and ingredients manufacture. It has also been used outside the UK. Since the first issue of the standard in 1998, it has been revised on three occasions. Issue 4 was published in January 2005, and issue 5 was published in January 2008. Third party bodies carrying out assessments must gain accreditation to ISO/IEC Guide 65 Main requirements:
• Implementation of HACCP
• A documented and effective quality management system
• The control of factory environment standards, products, processes and personnel
Source: BRC Global Standard: Food; Issue 4, January 2005
5.2.4 The Integrated Production of Wine (IPW) Scheme The Integrated Production of Wine (IPW) Scheme is a semi regulatory system that was introduced in South Africa in 1998. It provides guidelines for Good Agricultural Practices for farms and Good Manufacturing Practices for cellars to produce wines that are healthy, clean and environmentally friendly. The scheme is officially voluntary, but registered IPW actors represent 97% of harvested grapes in the country. This may be the case if one calculates registration with the system, but the proportion of actually audited farms and cellars is much smaller. The system is still mainly regulated via self monitoring. IPW, together with other stakeholders in the industry, is also promoting a wider initiative to develop a ‘super standard’ (SANS64) that aims at covering quality, food safety, social and worker safety, environmental protection, traceability and Good Agricultural Practices all in one place. The idea is that SANS64, together with the provisions embedded in the Liquor Products Act of 1998, would match the provisions of all other international standards covering these aspects, including ISO 9000, ISO 14000, HACCP, SA8000, EUREP-GAP, BRC and IFS. However, there are those who feel that SANS64 is unlikely to be recognized by the other standards initiatives it is trying to integrate as it is duplicating parts of an international effort to develop the future ISO 22000 standard, which aims at integrating food safety and quality management systems.
5.3 Entry barriers and rules of participation in the UK retail market
5.3.1 Elements of an industrial convention: Delivering basic quality
There are three elements in delivering basic quality in wine that are taken for granted by the UK retailers. They are as follows:
• Intrinsic (basics) and packaging, • Codified solutions to food safety, • logistics

92
UK retailers communicate very specific demands on intrinsic and packaging to their suppliers when buying basic quality wine. They tell them what to bottle, what kind of label and cork to use, the weight and shape of the bottle and the recycling possibilities. Specifications in ‘intrinsic’ at this level of quality can generally be measured or described easily. These include levels of alcohol, total acidity, volatile, sulphur dioxide content, residual sugar content, methods of protein and cold stabilization, a flavour profile and general wooding regime (un-wooded, lightly wooded, etc). According to Company 27, to get listing with a retailer, a supplier needs to deliver on intrinsic at the specific price point, which means fruit ‘forward, clean, easy drinking wine in the right packaging and consistency year by year’. At the beginning of a relationship with a supplier, retailers may operate in a more hands-on manner with their suppliers. They may send samples of what they want, visit the cellars, etc. Usually, after few years, they tend to operate in a more hands-off manner. On the contrary, involvement with producers is much more hands-on for private brands (brands owned by supermarket chains). In recent years, the packaging of ‘basic quality’ that needs to be provided by South African suppliers has become more demanding. One of the main retailers in the UK wants to implement retail-ready packaging in wine, which entails unloading from the pallet to shelf in one move. Retailers are also moving towards screw cap and synthetic closure to minimize returns for ‘corky’ wine. Majority of cooperatives and ex-cooperatives are either going through the process of certification for the BRC Global Standard – ISO 9000 or had enquired about WIETA certification and Fair Trade. Their buyers (marketers and producer wholesalers, sometimes direct retailers in importing countries) had started requiring them to obtain BRC certification within few years. In 2005, BRC certification was essential for bottling plants in South Africa, but not production facilities. At the same time, cooperatives and producer wholesalers were under pressure to certify at least against HACCP and ISO 9000. One marketer argued that this trend is actually good for wineries, because up to late 1990s, retailers used to do audits themselves, which was time and resource consuming because of repetition and overlap of different rules. BRC provides a one-stop solution and ready made ‘industrial convention’ to solve food safety and quality management concerns. The general view in South Africa is that requirements for ISO 9000 and BRC (including HACCP) are tedious, paperwork intensive but not unreasonable. They do not pose serious operational or cost barriers, and can actually help raise efficiency and quality management at the cellars. Some smaller private cellars, whose clients are not major UK retailers, have different views on certifications. A representative of one of them argued that he does not want any certifications and no written down rules. All they want is to treat their workers and motivate them. They don’t want to fill forms and they want to work with people. In terms of logistics, UK retailers are working towards lead times of eight weeks on promotion. As a result, UK based agents and marketers are trying to get more control over logistics. Previously, they sold wine FOB (free on board) ex-Cape Town harbour to retailers. Now, they have started selling ‘in-bond delivery’ in the UK. This way, retailers can place a call with a lead time of three days for delivery. Retailers are seeing themselves increasingly as shelf-space providers; so if you run out of supplies, it is your own problem as a supplier, not theirs. Suppliers can now log in the

93
retailer’s system and see movements in space and stocks. They order replenishments themselves, basically just calling up the buyer and advice them to order. Recently, UK retailers have also started to develop specific policies and codes on social issues, and are increasingly looking at WIETA to provide answers.
5.3.2 Elements of a market convention: Delivering price and promotions South Africa is the 5th largest exporter to the UK market, with approximately 9 million cases (see table 31). The average price of a 75cl bottle is £3.77, lower than that of the top four exporters to UK with the exception of Italy. The highest average price recorded in the UK is for New Zealand wine with 5.92£/75cl. The explicit focus of the South African industry is to ‘break the £5 barrier, where it is having problems in performing, and where margins are healthier.
5.4 Entry barriers and rules of participation in other end-markets
5.4.1 Netherlands Dutch off-trade consumers buy wine mostly on the basis of price, in combination with image/packaging style and reputation of the country as a whole. Brand names are owned either by suppliers or retailers, and they change all the time. There is very little brand loyalty. In the Dutch markets, suppliers have far more leeway on how to make a blend and deliver a product. It is a market less driven by promotions, but it is price sensitive. Different brands are offered to different retailers (a wine can be sold by up to 20 different labels). These ‘disposable brands’ are owned by the supplier, but this means little as the retailer can switch brand names (and suppliers) at will. There are fewer and broader minimum quality demands. Recently, Dutch retailers have started to ask for ISO 9001 certification and IFS. They also accept BRC certification if it is in place already. In short, for basic quality wines, the value chain is highly driven by retailers on the basis of a ‘purer’ market quality convention than in the UK.
5.4.2 Sweden Sweden is a peculiar market because the monopoly agency (Systembolaget) buys on tender for the off-trade market. The tenders specify the variety, a broad profile of the intrinsics, country of origin, price point and volume. Sweden has recently enquired within South Africa about the possibility of supplying Fair Trade wines. WOSA on its part is lobbying for WIETA accreditation instead. Systembolaget operates around 420 stores and 590 agencies. South African suppliers use agents who are specialists in tendering with the monopoly agency. The same agents have a sales force to place wines in the more profitable on-trade market.

94
South Africa has experienced dizzying growth in Sweden (34% increase in sales in 2006), and was expected to become the largest exporter to the country in 2007 (up from position four in 2005). According to Systembolaget’s buyer of South African wines, they (South Africans) deliver good value for money, plus the Swedes are frequent travelers to the Cape. The biggest volume in Sweden by far sold in bag-in-box. The monopoly agency is the lead firm in this value chain, and the composition of industrial and market conventions is similar to the one in the UK, with perhaps a more ‘genuine’ interest in ‘civic’ preoccupations.
5.4.3 Germany The German market is basically split into two segments: the Aldi market (from the name of the dominant discounter there) and the rest. The Aldi market is extremely price sensitive. Wine is shipped in bulk and bottled locally because of lower duty on bulk wine. There is also pressure to keep levels below 13° (as duty is higher over that level). Aldi market controls 30% of the wine market by volume. When dealing with Aldi, the margin is so low that suppliers have to cut down on expenditure all along (cork, lighter bottle, cheaper label). It is important to be in such a market to ‘move volume’. Aldi sells considerable volume of wine at €2/bottle. This means that one has to be able to sell €1/bottle FOB ex-South Africa. The phenomenon known as the ‘Aldi spiral’ means that once you are listed with them your retail price will spiral from €6 to €3 within years.
5.4.4 USA
The USA is a market where South African suppliers see potential for growth. The USA is a new market for South Africa. It is a challenging one because of its fragmentation due to state based regulations and a three tier supply chain. The three tiers are importers, distributors and retailers and in most states the separation of roles is mandated by regulation. Furthermore, there is no role player who can hold more than one two of the three licenses, and most often only hold one. Because of this system, retail prices are 3 to 3.5 times the FOB price ex-Cape Town. It is difficult to get a foothold in the USA market because distributors may have 4 000 wine in their wines in their portfolios and serve 20 retailers. The main challenge is to obtain visibility. Unsurprisingly, the USA market is much more fragmented than the UK, with only three distributors handling over one million cases. Wine trade relations in the USA are much more personal in nature and the personality of winemakers and eccentric wine property owners is also more of a factor than elsewhere. At the same time, brand recognition is also essential. Wine critics in the USA are more influential than elsewhere. Thus, the strand of the value chain for wine is (rather surprising) characterized more by domestic, opinion and inspirational conventions than industrial and market conventions. However, the USA market is also changing, with Wal-Mart now selling substantial amounts of wine and carrying out big in-house promotions. South Africa is not yet a well established geographic category in the USA, therefore big advertising and marketing investments are needed.

95
At the same time, the recent agreement between Gallo (the largest producer/marketer in the USA) and the ex-cooperative Swartland in South Africa may open the door to a more systematized presence of South African wines in the USA. Charles Back’s Fairview winery (also a producer of goat cheese) has had some success in the USA by exploiting anti-French sentiment in the early 2000s. Humour was used as an entry point. It has sold considerable amounts of ‘Goats do Roam’ and ‘Goats Door’ wines in the USA. A French court challenge carried out in the USA claiming that these names were too close to the French appellations ‘Côte du Rhône and Côtes d’Or’ was unsuccessful. Charles Back has now extended its range to Bored Doe (a pun on ‘Brdeaux’), ‘Goats do Roam in villages’ (Côtes du Rhône Villages) and ‘Goats Roti (Côte Rôtie). A southern Italian inspired blend is now sol as ‘The Goatfather’.
6. REGULATORY FRAMEWORKS
6.1 The wine of Origin Scheme The Wine of Origin (WO) scheme in South Africa is a set of regulations that guarantees the origin, cultivar and vintage of wines. It was first introduced in 1973. Currently, all wines for exports need to be certified under the WO scheme while wines for domestic consumption are only subject to these regulations if the producer wants to specify origin, cultivar and/or vintage on the label. The WO scheme is administered by the Wine and Spirits Board (WSB) which performs control functions and carries out sensory analysis of all batches of wine submitted for certification.
6.1.1 Origin The principle behind certifying origin in wine is that the character and quality of a wine are determined more by natural factors (such as soil, climate and location) than by human intervention (cultivar choice, viticultural techniques and wine-making techniques). Such a claim is fiercely disputed in the wine world, with Old World wine making countries (especially France and also Italy and Spain) stating the ‘nature-deterministic case’; and New Countries (especially Australia) arguing that wines of specific character can be replicated almost anywhere in the world with appropriate techniques. Accordingly, France has the oldest and most sophisticated ‘geographic appellation’ system in the world with specific limitations on what cultivars can be planted within certain areas, which viticultural techniques can be used, when the harvest can take place, what the character of grapes needs to be for specific labels and what wine making techniques can be used. Cultivar names are rarely specified on wine and brand names tend to be not as important as in the New World (with the large scale exception of Champagne). The bottle will showcase the name of the individual producer and/or bottler. Australia on the other end of the spectrum relies mostly on brands and cultivar names for consumer recognition and is developing basic Wine of Origin Scheme delimiting areas in response to EU requirements. South Africa stands in the middle of this spectrum, but closer to the New World wine system as far as the WO is concerned. This means that there are several ‘layers’ of

96
geographical indicators, from broad regions to individual vineyards, but that no specific limitations on cultivar, grape quality and viticulture and winemaking techniques are imposed. Table 29: South African production areas defined in terms of the Wine of Origin Scheme
Region District Wards Region District Wards
Breede River Valley
Robertson Agterkliphoogte Bonnievale Boesmansriver Eilandia Hoopsriver Klaasvoogds Le Chasseur McGregor Vinkriver
Coastal Region
Cape Point -
- Constantia
Darling Groenkloof
Paarl Franschhoek Valley Wellington Simonsberg/ Paarl Voor Paardeberg
Worcester Aan-de-Doorns Goudini Nuy Scherpenheuvel Slanghoek
Tygerberg
Durbanville Philadelphia
Swellendam Buffeljags Stormsvlei
Stellenbosch Jonkershoek Valley Papegaaiberg Simonsberg/ Stellenbosch Bottelary Devon Valley Banghoek
Klein Karoo
- -
Montagu Tradouw
Calitzdorp -
Upper Langkloof Outeniqua
Olifants River
Citrusdal Mountain
Piekenierskloof
Swartland Malmesbury Riebeekberg
- Bamboes Bay Tulbagh -
Citrusdal Valley
- No
region Overberg Eglin
Klein River Lutzville Valley
Koekenaap Spruitdrift Vredendal No
region Cape Agulhas Elim
No region
Douglas -

97
Region District Wards Region District Wards
No region
- - - - - - - -
Cederberg Hartswater Herbertsdale Lower Orange Prince Albert Valley Riettiver (FS) Ruiterbosch Swartberg
Source: SAWIS In South Africa, the broadest geographical units, below the generic ‘Wine of South Africa are Western Cape, Northern Cape and the new addition Kwa-Zulu Natal (see Map 1). Most of the wine of high quality is produced in the Western Cape while the drier parts of Northern Cape produces bulk wines of basic quality and wine for distillation. Kwa-Zulu Natal produces a miniscule quantity. In Western Cape, there is a large diversity of geography, climate and soils. These indications are of only very general character. The next layer in the WO system is the regions (such a Coastal Region) which are a combination of several districts, portions of districts and other small regions. They are usually built around a common broad geographic trait such as a river or a plateau (see table 33 and Map 2). Districts are also built around macro characteristics such as mountain ranges and rivers, but with a more specific character than regions. They still encompass a variety of soil types (see Map 3). Stellenbosch is probably the most recognized district internationally. Wards are where soul, climate, ecological factors start to have a distinctive and more recognizable impact on the character of wine. Wards such as Constantia and Franschhoek enjoy a good reputation for high quality wines. There are also emerging areas such as Elim and Elgin for cool climate varieties such as Sauvignon Blanc. Estate wine is wine made up of grapes grown within the borders of one or more bordering farms, as long as they are farmed as a unit and made into wine on a cellar placed within this unit. The regulations on the estate wine have been changed several times and are subject to some debate. Previously, grapes for estate wine could be sourced from non-contagious farms provided that they were farmed as a unit (this, however, was applied only in a few, ‘historically justified’ cases). This provision was eliminated to conform with a more purist approach to estate wine. At the same time, changes were made on the use of names. While in the past the name of the estate could only be used for its ‘estate wine’ (i.e. the name of the farm ‘Sun Valley estate wine’ could only be used together with the ‘estate wine’ indication on the bottle, but other wine produced by the same farm and not sold as ‘estate wine’ had to use different name, e.g. ‘Flower Valley’), subsequent changes allowed estates to sell non estate wines with the same name (‘Sun Valley’). The most recent

98
changes entail that ‘estates’ are no longer recognized by the WO scheme – only ‘estate wines’ and units registered for the production of estate wine. The smallest production unit that can be certified under the WO scheme is single vineyard wine, made with grapes coming from a single cultivar and a single vineyard not exceeding five hectares. This is a new system (the first wines were certified in 2005) and it is still unclear whether it will have many takers among high quality producers. It is specifically inspired from the French idea of the ‘clos’ (a specific vineyard with unique characteristics that was enclosed by a wall). The South African system differs with the French system as there is no requirement that the soil characteristics and structure in the vineyard be uniform. WSB is also considering the development of a certification system for the Terroir Specific Wines (TSW). These wines have to show identifiable and homogeneous characteristics with respect to topographical, climatic, soil and geological patterns (as in the French definition of terroir). This would be a further step in South Africa towards the demarcation of geographic origin according to the European model, but it is unlikely to be backed up by strict rules on quality, cultivar choice and specific viticultural techniques. Finally, recent changes in legislation allow for blending wines and grapes from different Wine of Origin areas, and for indicating all the areas on the label (e.g. Wine of Origin Stellenbosch and Paarl; previously, it would have been labeled as ‘Coastal’, a larger unit).
6.1.2 Cultivar
Cultivars impart distinctive characteristics on the wine made from them. The quality and reputation of, say Sauvignon Blanc and Colombard are very different even though large quality differences may occur within each cultivar due to differences in climate, soils, topography, viticultural and wine making techniques. Therefore, truth-in-labeling regulations are set to protect consumers’ misrepresentation of cultivar content. There are no limitations on which cultivars can be used in specific areas under the South African WO scheme. This differs with the old Wine of Origin schemes. The only limitation is that farmers have to use a cultivar from an approved list, but the list is very long (75 varieties approved). In terms of labeling, if a wine producer decides to place the name of a cultivar on the label, 85% of the content of the wine must originate from that cultivar. If more than one is indicated, they must appear in descending order of blend proportion on the label. A percentage also need to specified for cultivars that make up less than 20% of the blend
6.1.3 Certification system
The seal that accompanies certification in South Africa is a guarantee to the public that the claims made on the container (including bulk wine) are correct, and that the wine was of good basic quality when it was evaluated for certification. The certification system is based mainly on paperwork management for ‘truth in labeling’ purposes.
99
The operators need to provide WSB and SAWIS with number of notices (from harvesting of grapes to certification). The process can require the filling of up to 30 documents. As for the basic quality certification, wine is evaluated by tasting panels of the WSB. Additionally, the Department of Agriculture carries out chemical testing for each wine batch to verify that the wine meets legal requirements in terms of maximum levels of sulphur dioxide, volatile acidity and that the alcohol level declared on the bottle is correct (within a 0.5% error margin). The whole certification system is fully computerized and available to on-line producers. It provides full traceability of wine. Each seal (placed on a bottle or other packaging material) has its own ID number. Sensorial evaluation is carried out by a panel of WSB tasters with part-blind procedure (vintage and variety are known, but not the producer). It provides a minimum guarantee of quality for South African wine and is focused on detecting some basic unacceptable characteristics such as lack of clarity, excessive sediment, faulty colour, insufficient or undesirable flavours/odours and a lack of distinctive varietal character. If a wine is exported to the EU, certification is needed from the Department of Agriculture in relation to substances that can and cannot be added to wine according to a table included in the Liquors Act. According to the Department, it is almost impossible to detect many of these substances chemically.
7. THE VALUE CHAIN FOR WINE IN SOUTH AFRICA
A simplified configuration of the export oriented and domestic segments of the value of the value chain for wine in South Africa is illustrated by figures 20 and 21. The two segments have been separated at only at the graphic level, as in practice the great majority of players operate in both segments simultaneously. What these two figures indicate are the differences in the flow of products in the two segments, while the functional layout and ownership patterns are almost overlapping.
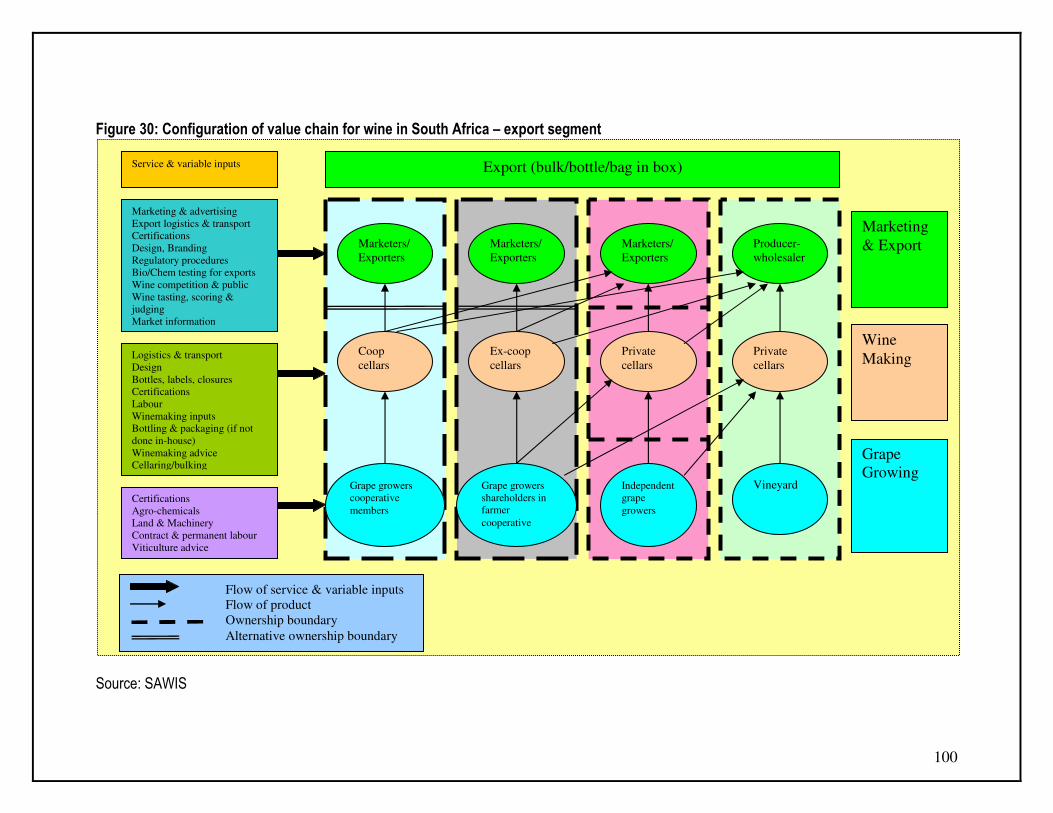
100
Figure 30: Configuration of value chain for wine in South Africa – export segment
Source: SAWIS
Service & variable inputs
Marketing & advertising
Export logistics & transport
Certifications
Design, Branding
Regulatory procedures
Bio/Chem testing for exports
Wine competition & public
Wine tasting, scoring &
judging
Market information
Logistics & transport
Design
Bottles, labels, closures
Certifications
Labour
Winemaking inputs
Bottling & packaging (if not
done in-house)
Winemaking advice
Cellaring/bulking
Certifications
Agro-chemicals
Land & Machinery
Contract & permanent labour
Viticulture advice
Export (bulk/bottle/bag in box)
Marketing
& Export
Wine
Making
Grape
Growing
Marketers/
Exporters
Coop
cellars
Grape growers
cooperative
members
Marketers/
Exporters
Ex-coop
cellars
Grape growers
shareholders in
farmer
cooperative
Marketers/
Exporters
Private
cellars
Independent
grape
growers
Producer-
wholesaler
Private
cellars
Vineyard
Flow of service & variable inputs
Flow of product
Ownership boundary
Alternative ownership boundary
101
Figure 30 delineates the export segment of the value chain for wine in South Africa. The right column defines the boundaries of various functions (grape growing, wine making and marketing/exports). The left column shows the variable inputs and services that are provided to ‘direct actors’ (those who handle grapes and/or wine directly) to make these functions operative. The central part of the figure shows product flows (solid arrows) and ownership patterns (patterns of prevalent ownership boundaries and alternative configurations. This is done to reduce graphic complexity that would entail representing each variation). The bottom part of the figure represents a typology of grape growers. They are as follows:
• Growers that are part of a cooperative or a shareholding company (usually, an ex-cooperative);
• Independent grape growers that do not have wine-making facilities or are not members or shareholders of a cellar;
• Vineyards that are owned by private cellars (which may also form part of a vertically integrated producer-wholesaler configuration.
The differentiation between coop and ex-coop cellars is in that members of a coop cellars are supposed to deliver their entire crop to their cellar. Shareholder growers can (and do) also sell in the open market to private cellars. Independent grape growers sell to private cellars but also to ex-coop cellars. At the level of wine making, we also have three configurations. They are the coop cellars, ex-coop cellars and private cellars. The latter can be fully independent, vertically integrated from vineyards to export, or partly integrated from wine-making to export. At the level of marketing/export, coops and ex-coops until recently sold most of their wine output to producer-wholesalers or marketers/exporters. However, the new trend in the last 5 – 6 years has been for these cellars to join forces between them and with marketers/exporters (sometimes directly with importers) to create dedicated marketing/exporting outfits.

102
Figure 31: Configuration of value chain for wine in South Africa – domestic segment
Source: SAWIS
Service and variable
inputs
Market information
Inventory management
Transport & logistics
Marketing & advertising
Export logistics &
transport
Certifications
Design, Branding
Regulatory procedures
Bio/Chemical testing for
exports
Wine competition &
Logistics & transport
Design
Bottles, labels, closures
Certifications
Labour
Winemaking inputs
Bottling & packaging (if
not done in-house)
Winemaking advice
Cellaring/bulking
Certifications
Agro-chemicals
Land & Machinery
Contract & permanent
labour
Viticulture advice
Retail
Marketing &
Distribution
Wine
Making
Grape
growing
On trade:
restaurants/café/catering
Agents/ distributors
Cooperative
cellars
Grape
growers
cooperative
members
Ex-
Cooperative
members
Grape growers
Shareholders in
farmer
cooperatives
Off trade: supermarket
chains (incl. private
labels, bottle stores,
independent shops, mail
order
Agents/
distributors
Private
Cellars
Independe
nt grape
growers
Producer-
Wholesaler
WT WT WT
Private
cellars
Vineyard
WT
Cellar door wine tourism sales Flow of product
Flow of services & variable inputs ……… Ownership boundary
WT

103
Figure 31 describes the configuration of the value chain for wine consumed domestically. It has the same overall structure as in Figure 19, but with the added function of retail. Retailing can take place at the cellar (wine tourism), in on-trade facilities (restaurants, cafes, etc) and in off-trade facilities (supermarkets, bottle stores, etc). Domestic consumption, it must be remembered, represents more than half of total wine production by volume in South Africa. Supermarkets handle approximately 35% of all wine sales by value in South Africa. Theses are dominated by four chains. They are Pick’ n Pay, Shoprite/Checkers, Spar and Woolworths. Pick’ n Pay is responsible for approximately 37% of wine sales, followed by Shoprite/Checkers, Spar and Woolworths. Woolworths is an upper-segment chain focusing on private labels (following the model of Marks & Spencer in the UK). It is the only chain with a dedicated wine buyer who holds a Cape Wine Master diploma. The other chains have category managers who buy wine but also other products, and they are not trained wine tasters. Woolworths’s bulk of wine business is based on its own private label. It currently holds 110 different wine lines. The wine category manager creates all the blends, which are produced exclusively for Woolworths. The retailer has control over the entire process and also decides on the design of the labels. The wine manager gives specifications to the wine makers at various cellars. The higher the price point, the more detailed are the specifications. Most volume is moved in the price bracket of R13.20 (2005 retail price), with wines exhibiting fruity, easy, accessible and Australian type styles. Woolworths’ business model is to have only one wine for a specific bracket – e.g. only one Sauvignon Blanc at R30.00 – while the other chains might have up to ten on offer (it offers other brands as well, but most of the wine on sale is private label). The idea is that Woolworths does the selection, which entails less stress for the consumers and guidance specifically for those who may not know much about wine (this is especially important outside of the Cape). Woolworths works with 35 suppliers, 10 of which have been with them for 20 years. Since the late 1990s, they have started to have formal contracts with suppliers, with each products supplied under full specifications (bottle, cork, style, how it has to be made, sulphur dioxide and alcohol levels). Prices are re-negotiated every year. On promotion, Woolworths shares the reduction of the margin at the 50-50 level with the supplier. Wine imports constitute only 6% of sales. The retailer’s margins vary from 5% to 40% of selling price, depending on volume and quality. Woolworths has its own auditing system of suppliers, covering hygiene, staffing, labour practices and technology. Suppliers are subjected to one audit a year paid by Woolworths (except for the first one). The chain does not ask the suppliers to conform to other certifications (except for organics, which is carried out externally). Yet, many of Woolworths’ suppliers also hold HACCP and ISO 9000 certifications because they operate in the export market. Pick’ n Pay, Shoprite/Checkers and Spar operate a very different system. These chains mainly sell branded wine. Food safety audits and production sites are only inspected where the suppliers provide wine for own-label wines, which is a small minority of their business. As in the UK, wine promotions are used to sell volume and are planned in advance with selected suppliers. Many of the buying practices of South African retailers resemble closely those applied by UK retailers. Stickers showing that a particular wine has won medals at wine competitions are very important for sales, especially for wines in the mid range prices.
104
Marketing in the rest of the off-trade sector (independent shops) and in the on-trade sector (restaurants, cafes, etc) is done through a complex network of distributors and agents. That is not the case with the bottle store sales (except local name for liquor stores which are organized in a few powerful chains, such as Picardi and Ultra). Among the largest distributors, there are producer-wholesalers such as Distell and DGB. Wine tourism is a well developed industry in the Cape, with of organized wine routes. Cape Town is a part of the Great Capitals of wine network. A good proportion of cellars is open to the public and has tasting facilities on-site. Approximately forty four properties also have restaurants. Scenic beauty and many flagship properties displaying Cape Dutch architecture add flavour to the ‘Cape wine experience’. While wine tourism industry has generated R4.2 billion in 2003, the actual volume of wine sales through direct cellar door sales is not likely to be very significant in absolute terms – with the exception of some flagship properties such as Vergelegen, Boschendal or Constantia based cellar farms.
8. ORGANIZATIONAL ANALYSES
8.1 Formal institutions and organizations
The main characteristics of the official institutions and organizations that make up the South African wine industry are summarized in table 32. Some of these organizations are funded through the statutory levies, which in 2005/06 amounted to R42.6 million. In addition to this funding, there is also a voluntary fund to help nurture responsible drinking (R1.4 million) and a fund (negotiated by WOSA with UK retailers) that collects duty-free savings for a quota of exports to carry out generic promotion of South African wine in the UK. The statutory levies are allocated as follows:
• R20.7 million to WOSA (plus R4 million that WOSA receives from SAWIT • R13.5 million to Winetech • 6.5 million to SAWIS • R1.9 million to DTU (Development and Transformation Unit)
The executive office of SAWIC is partly funded by these levies, but also by members of institutions and organizations that have members on the board of directors.

105
Table 32: Formal institutions and organizations in the South African wine industry Institution Established Members Mission Functions and positions
Industry Association for Responsible Alcohol Use (ARA)
1981 with a different name
SAB, VinPro, Wine Cellars SA, members of SALBA and 50 associate members
Promotion of responsible use of beverage alcohol
Representative authority and policy making body on the social aspects of alcohol consumption, supports stringent age limits on consumption (age 18), moderation in consumption as quality of life factor and medical advice on consumption during pregnancy.
Black Association of the Wine and Spirits Industry (BAWSI)
1998 100 black owned businesses, 48 NGOs under RUDNET (Rural Development Network), 16 labour unions, farm worker co-coordinating council, other organizations and ‘emerging farmers and taverniers’
Transforming the wine industry to make it representative of the South African socie ty
Mobilize individuals and interested parties from historically disadvantaged backgrounds for social upliftment of people on farms; implement fair labour practices and empowerment of members.
Biodiversity and Wine Initiative (BWI)
2004 4 champions, 4 coops, 70 private wineries and conservation partners
Conserving the bio-diversity of the Cape Floral Kingdom
Prevent further loss of biodiversity in the threatened habitat on critical sites in wine areas; set aside areas as natural habitat; promote changes in farming practices that enhance the suitability of vineyards as habitats for biodiversity.
Cape Estate Wine Producers Association (CEWPA)
1968 111 units that are registered for the production of estate wine
To maintain and promote the unique position of the estate as the pinnacle of the Wine of Origin system, and to represent
Management committee with 11 elected and co-opted members, 4 committee meetings a year and 2 general meetings. Lobbied for the establishment of estate demarcations in the 1973 SA Wine of Origin System.

106
Institution Established Members Mission Functions and positions
the interests of its members in industry forums
Cape Winemakers Guild (CWG)
Started by 8 founding members in 1982
Approximately 40 members by invitation only
To nurture and develop members’ winemaking expertise, to serve as benchmark of South African winemaking through showcasing of members’ wines
For nomination a winemaker must have been responsible for producing outstanding wines for 5 years minimum and continue doing so, only those nominated that are voted positively by 2/3 by the AGM can enter, the CWG Auction is the annual showcase.
South African Vintners Alliance (SABVA)
2005 12 black owned wine companies
Creating an enabling environment for emerging black owned wine companies
Linking wine enterprises to business sources, develop a business model to ease entry into wine industry for prospective entrepreneurs.
South African Society for Enology and Viticulture (SASEV)
1979 1 100 members To optimize the quality of South African grapes, wines and related products by distributing scientific knowledge
Membership includes viticulturists, enologists, laboratories, scientists; publishes a scientific journal; organizes meetings an disseminates information.
South African Wine and Brandy Company (SAWB)
2002 - 2006 Organizations representing wine industry constituencies
Enhance the strategic environment for the benefit of the industry
Representative body of the wine industry, drew up the Wine Industry Strategy Plan (WISP), seeks to increase global competitiveness and profitability, generate equitable access and participation in the wine value chain, enable environmentally sustainable production of wine.
South African Wine Industry Council (SAWIC)
2006 Board of Directors has members from VinPro, WCSA, Salba, labour, civil society and
Not available Emerged from the restructuring of SAWB; it includes 4 business units namely: Winetech, SAWIS, WOSA and DTU. It is focusing on the development of a Wine-BEE Charter.
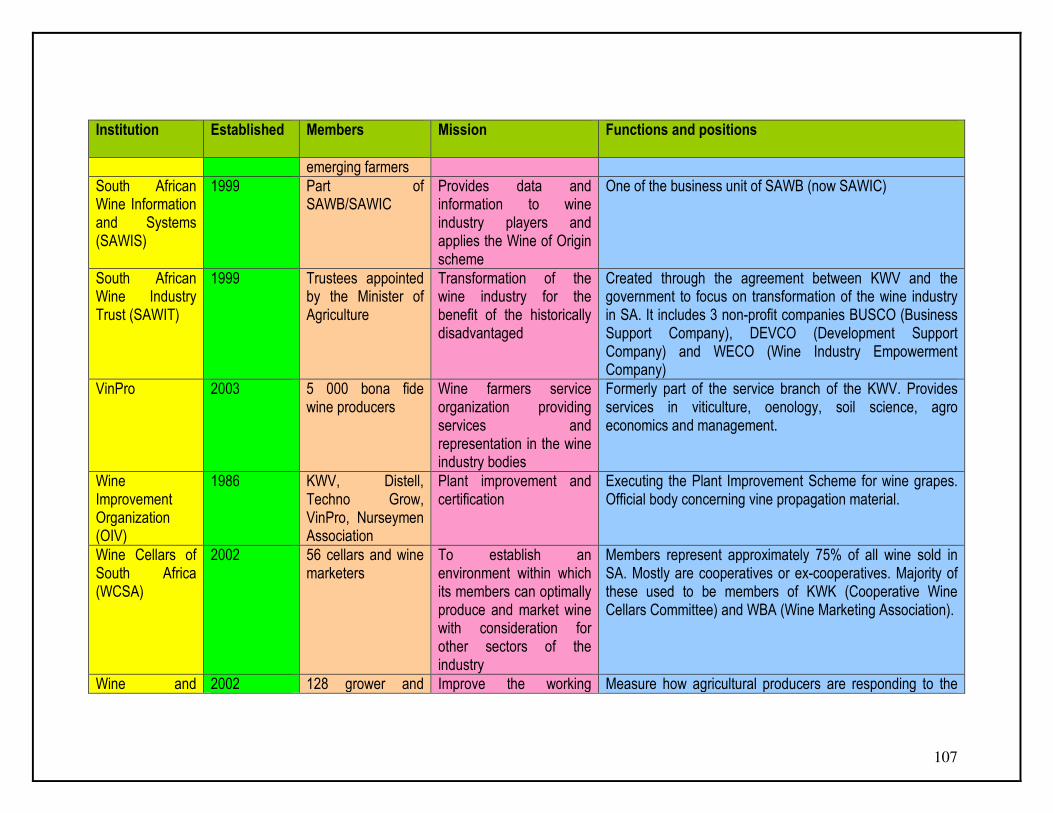
107
Institution Established Members Mission Functions and positions
emerging farmers South African Wine Information and Systems (SAWIS)
1999 Part of SAWB/SAWIC
Provides data and information to wine industry players and applies the Wine of Origin scheme
One of the business unit of SAWB (now SAWIC)
South African Wine Industry Trust (SAWIT)
1999 Trustees appointed by the Minister of Agriculture
Transformation of the wine industry for the benefit of the historically disadvantaged
Created through the agreement between KWV and the government to focus on transformation of the wine industry in SA. It includes 3 non-profit companies BUSCO (Business Support Company), DEVCO (Development Support Company) and WECO (Wine Industry Empowerment Company)
VinPro 2003 5 000 bona fide wine producers
Wine farmers service organization providing services and representation in the wine industry bodies
Formerly part of the service branch of the KWV. Provides services in viticulture, oenology, soil science, agro economics and management.
Wine Improvement Organization (OIV)
1986 KWV, Distell, Techno Grow, VinPro, Nurseymen Association
Plant improvement and certification
Executing the Plant Improvement Scheme for wine grapes. Official body concerning vine propagation material.
Wine Cellars of South Africa (WCSA)
2002 56 cellars and wine marketers
To establish an environment within which its members can optimally produce and market wine with consideration for other sectors of the industry
Members represent approximately 75% of all wine sold in SA. Mostly are cooperatives or ex-cooperatives. Majority of these used to be members of KWK (Cooperative Wine Cellars Committee) and WBA (Wine Marketing Association).
Wine and 2002 128 grower and Improve the working Measure how agricultural producers are responding to the

108
Institution Established Members Mission Functions and positions
Agricultural Ethical Trade Association (WIETA)
producer sites, 94 in wine industry (25 fully accredited
conditions of the employees in agriculture by promoting the adoption of and adherence to a code of good practice
rights and obligations established in the labour legislation introduced after 1994 and assists them in ensuring compliance.
Wine Industry Network for Expertise and Technology (Winetech)
1996, operational from 1999
Part of SAWB/SAWIC
Provide the industry with forefront technology and human resources to strengthen competitiveness and profitability
Support the industry through expertise, training, education technological innovation and scientific network.
Wines of South Africa (WOSA)
1999 350 South African wine exporters
Generic marketing of South African wine abroad (from 2006, also promotion of wine domestically and promotion of wine tourism)
Generic marketing body falling under SAWB (now SAWIC), aims at building ‘Brand South Africa’ for wines, runs wine shows and keeps media informed , brings wine and lifestyle writers to the Cape
Wine and Spirit Board (WSB)
1973 Participants to the Wine of Origin and IPW schemes, Department of Agriculture and Agricultural Research Council
Administers the Wine of Origin system
Runs testing committees, administers the Integrated Production of wine scheme, certifies wine and issues seals of certification, advises the Department of Agriculture on technical issues regarding wine and liquors
Independent Vignerons
1974 45 independent grape growers
Communicate the interests of the independent grape growers and represent
Initially, active in obtaining the right to sell grapes directly to wholesalers (before liberalization). Currently the organization is responsible for communicating with stakeholders on grape prices, contracts, strategies and

109
Institution Established Members Mission Functions and positions
them in industry bodies provide market information to members Source: Wineland
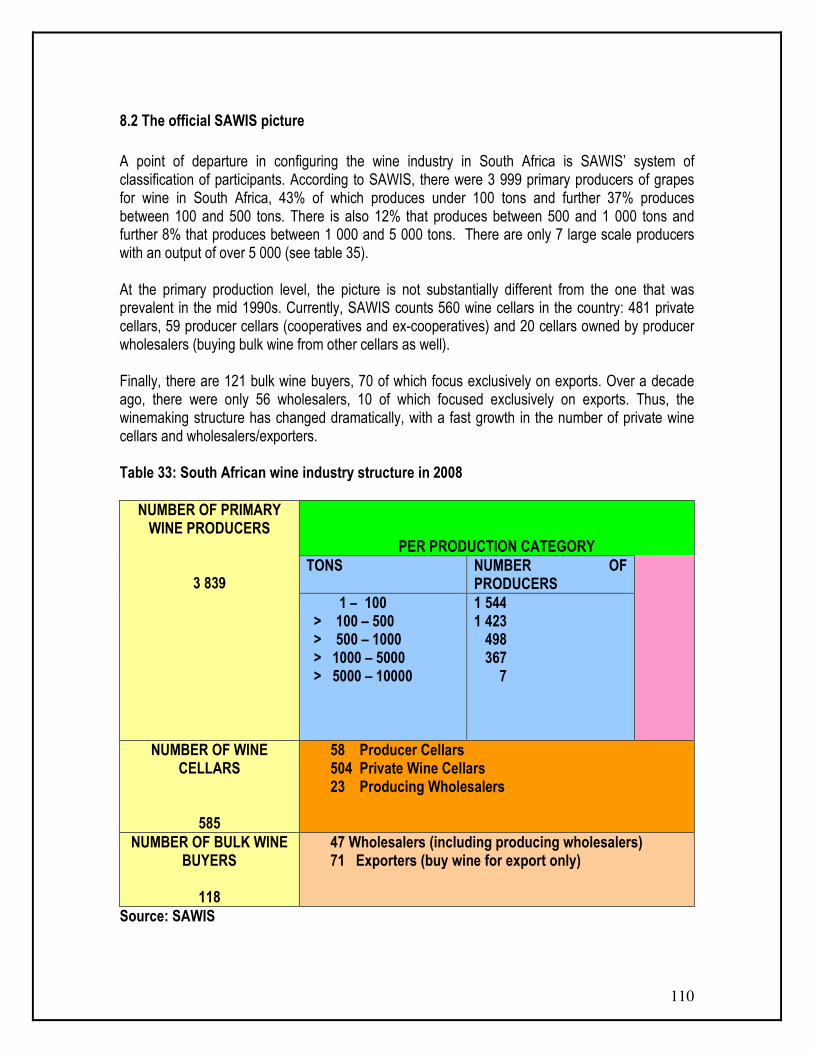
110
8.2 The official SAWIS picture
A point of departure in configuring the wine industry in South Africa is SAWIS’ system of classification of participants. According to SAWIS, there were 3 999 primary producers of grapes for wine in South Africa, 43% of which produces under 100 tons and further 37% produces between 100 and 500 tons. There is also 12% that produces between 500 and 1 000 tons and further 8% that produces between 1 000 and 5 000 tons. There are only 7 large scale producers with an output of over 5 000 (see table 35). At the primary production level, the picture is not substantially different from the one that was prevalent in the mid 1990s. Currently, SAWIS counts 560 wine cellars in the country: 481 private cellars, 59 producer cellars (cooperatives and ex-cooperatives) and 20 cellars owned by producer wholesalers (buying bulk wine from other cellars as well). Finally, there are 121 bulk wine buyers, 70 of which focus exclusively on exports. Over a decade ago, there were only 56 wholesalers, 10 of which focused exclusively on exports. Thus, the winemaking structure has changed dramatically, with a fast growth in the number of private wine cellars and wholesalers/exporters. Table 33: South African wine industry structure in 2008
NUMBER OF PRIMARY WINE PRODUCERS
3 839
PER PRODUCTION CATEGORY TONS NUMBER OF
PRODUCERS
1 – 100 > 100 – 500 > 500 – 1000 > 1000 – 5000 > 5000 – 10000
1 544 1 423 498 367 7
NUMBER OF WINE CELLARS
585
58 Producer Cellars 504 Private Wine Cellars 23 Producing Wholesalers
NUMBER OF BULK WINE BUYERS
118
47 Wholesalers (including producing wholesalers) 71 Exporters (buy wine for export only)
Source: SAWIS
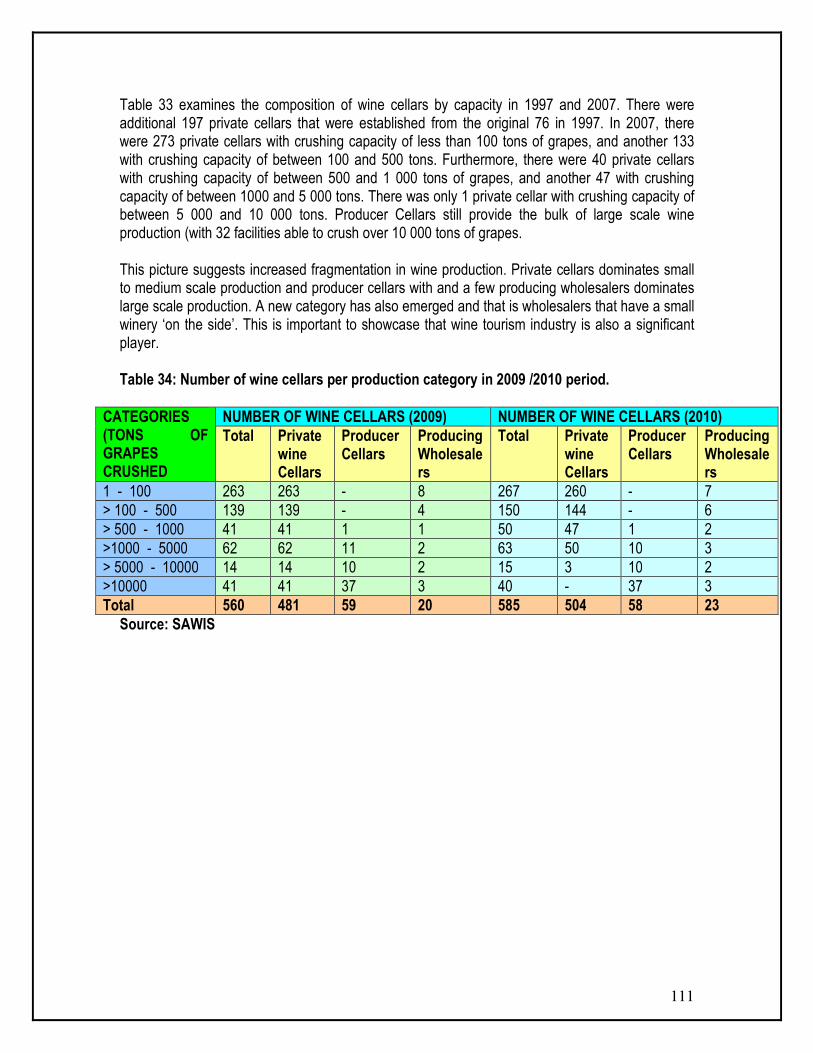
111
Table 33 examines the composition of wine cellars by capacity in 1997 and 2007. There were additional 197 private cellars that were established from the original 76 in 1997. In 2007, there were 273 private cellars with crushing capacity of less than 100 tons of grapes, and another 133 with crushing capacity of between 100 and 500 tons. Furthermore, there were 40 private cellars with crushing capacity of between 500 and 1 000 tons of grapes, and another 47 with crushing capacity of between 1000 and 5 000 tons. There was only 1 private cellar with crushing capacity of between 5 000 and 10 000 tons. Producer Cellars still provide the bulk of large scale wine production (with 32 facilities able to crush over 10 000 tons of grapes. This picture suggests increased fragmentation in wine production. Private cellars dominates small to medium scale production and producer cellars with and a few producing wholesalers dominates large scale production. A new category has also emerged and that is wholesalers that have a small winery ‘on the side’. This is important to showcase that wine tourism industry is also a significant player. Table 34: Number of wine cellars per production category in 2009 /2010 period.
CATEGORIES (TONS OF GRAPES CRUSHED
NUMBER OF WINE CELLARS (2009) NUMBER OF WINE CELLARS (2010) Total Private
wine Cellars
Producer Cellars
Producing Wholesalers
Total Private wine Cellars
Producer Cellars
Producing Wholesalers
1 - 100 263 263 - 8 267 260 - 7 > 100 - 500 139 139 - 4 150 144 - 6 > 500 - 1000 41 41 1 1 50 47 1 2 >1000 - 5000 62 62 11 2 63 50 10 3 > 5000 - 10000 14 14 10 2 15 3 10 2 >10000 41 41 37 3 40 - 37 3 Total 560 481 59 20 585 504 58 23
Source: SAWIS

112
8.3 Strengths, Weaknesses Opportunities and Threats (SWOT) analysis
Some of the strengths, weaknesses, threats and opportunities of the wine production sector in South Africa are the following: Strengths
Weaknesses
• The exceptional export growth over the
last 12 years. The SA wine industry is making inroads as a global player.
• The sound development of an aligned and focused statutory levy system for the industry to support industry activities like generic marketing.
• South African wines are perceived internationally to less overwhelmingly fruity than other New World wines such as Australia and have some structure and elegance of Old world wines such as France.
• South Africa has a great variety of terriors (total natural environment of any vitcultural site.
• South Africa does not have strong brands for mid-range quality wines sold over €7/£5. This is the fastest growing segment and the margins are healthier.
• Lack of serious investment due to small margins.
• Price competition amongst South African producers and high unit costs renders the wine industry increasingly marginal, a “price taker” and economically unstable.
• Fragmentation of production entities. There are too many producers who produce small quantities. This too makes the industry to be economically unstable.
• Port congestions. Wine has a similar season to fruits (December to March). As a result fruit always get preferential treatment primarily due to its higher value and is more perishable. This constrains wine trade.
Threats
Opportunities
• Increased competitions from fellow
Southern hemisphere countries like Chile, Australia and New Zealand.
• South Africa should take an opportunity
to capitalize on the global increase in red wine demand.

113
8.4 Business opportunities and challenges
With the end of apartheid and the opening of export market, investment flowed in the industry, new farms and cellars were established, wine quality improved, cooperatives modernized themselves (both infrastructural and managerial). At the same time exports increased dramatically. Positive coverage on the health benefits of wine continues to drive wine consumption amongst the older generation. With aging population profiles in UK, Europe and USA, this is positive for consumption. Lifestyle changes are driving the relationship between food and wine as more meals are eaten out of home. New opportunities have seen the emergence of medium-scale exporting participants. These have been formed by the conversion of former co-operatives (e.g. Simonsvlei), by a new enterprise formed by existing co-operatives (e.g. WestCorp), by strategic alliances formed between private producers (e.g. Winecorp) and by consolidation of existing enterprises (e.g. Omnia Wines). One other feature is the virtual explosion in smaller cellar based businesses and trading companies. The rapid institutional change that has characterized the industry in the past decade has come about because of strategies to adapt to new trading environment. A key feature of these of this environment has been to the ability to exploit new opportunities in the global market, and more institutional changes can be expected as the industry consolidates its position in the international markets. There is a growing need for marketing strategies, business training and development and also resources to penetrate, educate and build the domestic market. Support programmes from both the government and the industry need to give more attention on growing the local market given the challenges of the stronger trading currency and trading barriers presented by foreign markets. The other general challenges that the wine industry in South Africa is currently facing are as follows: 8.4.1. Global over-supply; 8.4.2 Sensitivity to the outside economic shocks such as exchange rate fluctuations, currency
values, tax increases, etc; 8.4.3 High subsidization regimes by the competitors especially developed countries; 8.4.4 Increased production costs; 8.4.5 Surplus removal schemes.
9. EMPOWERMENT ISSUES AND TRANSFORMATION IN THE SECTOR
9.1 Transformation of the industry
In the early 1990s, the promise of democratic transformation posed a new challenge to the elites, in particular the KWV, which had previously controlled the wine industry, and seemed to hold significant promise to black workers. In order to protect the economic assets it had built up since 1924, the KWV needed to mitigate the risks of government intervention and transformation of the

114
industry. The opportunity had been created by the Amendment of the Cooperative Act in 1993 to convert itself into a private company and therefore pre-empt transformation by distancing itself from the control of government. In 1997, the chairman of the KWV Lourens Jonker announced that the KWV would be applying to the Supreme Court to convert to a public company. However, the then Minister of Agriculture and Land Affairs resisted a mere financial conversation from a cooperative to a company. The Minister argued that the assets built up by the KWV while exercising its statutory duties should be considered in the public domain and would benefit the entire industry (Kruger et al. 2006; Williams 2005). The dispute was settled out of court in September 1997, with the agreement that the KWV would fund an industry trust to provide services to the industry as a whole and to support industry transformation. In February 1999, the South African Wine Industry Trust (SAWIT) was established and a board of trustees appointed by the Minister of Agriculture and Land Affairs and by the KWV. The main purpose of the trust was to be custodian of the funds paid by the KWV. The functions of the trust were separated into two not-for-profit companies namely Wine Industry Business Support Company (Busco) and Wine Industry Development Company (DEVCO). The objective of Busco was to support research, development and competitiveness in the industry. For that purpose, it was allocated 54.6% of SAWIT’s funds. The funds were used to finance the Winetech which is the research institution to support human resource development and transfer of technology, SAWIS and WOSA. Busco was also used to fund the provision of services that had previously been provided by KWV. The objective of Devco on the other hand was in equal measure the development and support of new entrants to the industry. Furthermore, Devco was expected to support and uplift farm workers and their communities. A part of its budget was also related to the marketing of wine products and access to the related extension services. In reality, it did little to support new entrants into the industry in comparison to the support provided to the established industry through Busco (for a detailed discussion of DEVCO’s performance, see Kruger et al. 2006; Williams 2005). In 1999, Winetech developed the Vision 2020 document. The Vision 2020 is the document that laid down a process of research and consultation for building an ‘innovation driven, globally competitive and highly profile industry’ (Winetech 1999). While it announced the end of the ‘productionist’ era and announced the need for the industry to become more market oriented, it did not offer much in the way of guidance as to how the industry could achieve this. The report pointed out that in order to succeed in the market, producers had to produce quality while also stating that quality was whatever the market wanted. Vision 2020 played a vital role in attempting to establish a framework in terms of which changes in the industry had to be debated and legitimized. These terms were technical and neo-liberal and rigorously eschewed any real engagement with the burning political questions facing the industry. There was no mention of a change of ownership or redistribution of productive resources in the industry, nor any specific mention of ‘black empowerment’ (Kruger et al. 2006)

115
A prerequisite for the implementation of Vision 2020 was an industry structure and leadership that represented all stakeholders in the wine industry. Thus, in 2002, the two main producer-wholesalers in the industry (KWV and Distell) moved to form SAWB as the ‘inclusive and representative’ body of the wine industry. The rationale behind the chamber structure that was adopted was that the various industry sectors would enjoy equal ‘representation’ and ‘equal ownership’. The SAWB’s four chambers represented producers, cellars, trade and labour. SAWB became purportedly the forum where both old and new economic and political interest groups could stake out their claims in the transformation process of the wine industry. However, the solution of a ‘representative’ institution was inherently unstable because now established discourse of BEE (see Ponte et al. 2006) opened for new demands which could not be met by old habits. White interests still maintained 99% of ownership and control over the assets of the wine industry. Thus, the structure of SAWB was still basically 75% white and 25% black (black interests were only represented in the chamber). SAWB was restructured in July 2006, when it became SAWIC. SAWIC is structured into four business units namely: the already existing SAWIS, Winetech, WOSA (now working to promote domestic consumption and wine tourism as well as exports), plus the newly created Development and Transformation Unit that will take care, inter alia, of the Wine-BEE Charter. An advisory forum was also created, to provide SAWIC with advice on strategic issues. The forum includes representatives from BAWSI, NAFU, VinPro, Wine Cellars of South Africa, SAWIT and the Rural Development Network.
9.2 BEE in the wine industry
The troubles of the wine industry with BEE (or lack thereof) are well known (Kruger et al. 2006; Williams 2005). The industry is still completely white in terms of ownership, control and consumption. Most black operators in the industry are found on the farms as labourers, and increasingly in tasting rooms and in wine tourism trade. There are indications that conditions for the permanent work force have improved, but at the same time a large proportion of it has been externalized and is now hired ad hoc through labour contractors. Some ‘black empowered’ labels have emerged and a handful are enjoying healthy sales, but all in all they involve a very small number of operators.
According to the industry, empowerment initiatives in the wine industry should cover the entire spectrum of the industry’s value chain. Information gathered from a survey conducted in the co-operative cellars, indicates that sixty two percent of co-ops were currently involved in one of more BEE projects. As far as direct empowerment programmes are concerned, equity schemes are the most favoured, while skills development initiatives are the most significant in human resource development. Outsourcing of cellar activities and farming operations are regarded the most important in the case of private cellars.

116
Table 35: Current BEE programmes in the Private and co-operative wine cellars Category breakdown Number
1.Direct Empowerment 62 1.1 Equity ownership in cellar 17 1.2 Equity in farming sector 20 1.3 Profit sharing 1 1.4 Housing 9 1.5 Management 2 2. Human Resources 2.1 Mentorship 7 2.2 Employment Equity 1 2.3 Skills development/Training 9 2.4 Community Development ?????? 3.Indirect Empowerment and Entreprise development 3.1 Outsourcing cellar/farming activities 35 3.2 Preferential procurement 26 Enterprise Development 1 The above statistics changes all the time as more and more empowerment initiatives takes place in the wine industry. It can be stated however that all the segments of the wine industry are currently in the process of developing their respective charters and establishing the baselines and targets for their scorecards. BEE projects in the brand ownership sector have been more progressive with the result that over 20 black-owned wine labels have been created by black companies throughout the Western Cape. These companies have access for financial assistance from the South African Wine Industry Trust and the Department of Trade and Industry through various schemes such as export promotion and marketing material development. BEE in the corporate/wholesale sector is also making a mark with the big companies such Distell and KWV leading in the way in empowerment programmes. In summary, it is clear that there is still much to be done to enhance empowerment initiatives in the wine industry. Particular challenges are in the areas of access to finance and skills transfer. There is also a growing need for marketing strategies, business training and development and resources to penetrate educate and build the domestic market. Support programmes from government need to give more attention on growing the local market given the challenges of the stronger currency and trading barriers presented by foreign markets. Generally, the industry is still almost completely white in terms of ownership, control and consumption. Most black operators in the industry are found on the farms as labourers and increasingly in taste rooms and wine tourism trade. There are indications that conditions for the permanent labour force on farms have improved, but at the same time a large proportion of it has been externalized and is now hired ad hoc through labour contractors. Some ‘black empowered’

117
labels have emerged and a handful are enjoying healthy sales, but al in all they involve a very small number of people.

118
10. ACKNOWLEDGEMENTS
10.1 The following industries/organizations are acknowledged. 10.1.1 South African Wine Industry Council
Box 7055 Stellenbosch 7599 Tel (021) 886 8992 Fax (021) 882 9510 Web: www.winecouncil.co.za
10.1.2 South African Wine Industry Information and Services Box 238 Paarl 7620 Tel (021) 807 5704 Fax (021) 871 1360 Web: www.sawis.co.za
10.1.3 VinPro
Box 1411 Suider-Paarl 7620 Tel (021) 807 3322 Fax (021) 863 2079 Web: www.vinpro.co.za
10.1.4 Trade and Industrial Policy Strategies (TIPS) P. O. Box 11214 Hatfield 0028 Tel (012) 431 7900 Fax (012) 431 7910 www.tips.org.za 10.1.5 National Agricultural Marketing Council (NAMC) Private Bag X 935 Pretoria 0001 Tel (012) 341 1115 Fax: (086) 626 4769 www.namc.co.za 10.1.6 International Trade Centre www.intracen.org
119
10.1.7 Directorate: Agricultural Statistics
Department of Agriculture, Forestry and Fisheries; Private X 246 Pretoria 0001 Tel (012) 319 84 54 Fax (012) 319 8031
www.nda.agric.za 10.1.8 Trade Law Centre for Southern Africa (TRALAC) P. O. Box 224 Stellenbosch 7599 Tel (021) 883 2208 Fax (021) 883 8292 www.tralac.co.za Disclaimer: This document and its contents have been compiled by the Directrate: Marketing of the Department of Agriculture, Forestry and Fisheries; for the purpose of detailing the wine market. Anyone who uses this information does so at his/her own risk. The views expressed in this document are those of the Department of Agriculture with regard to agricultural industry, unless otherwise stated. The Department of Agriculture, Forestry and Fisheries therefore, accepts no liability that can be incurred resulting from the use of this information.