winners and losers - carnegie endowment for international peace
TRANSCRIPT

IMPACT OF THE DOHA ROUND ON DEVELOPING COUNTRIES
Sandra Polaski
Winners and Losers
IMPACT OF THE DOHA ROUND ON DEVELOPING COUNTRIES
Sandra Polaski
Winners and Losers
© 2006 Carnegie Endowment for International Peace. All rights reserved.
No part of this publication may be reproduced or transmitted in any form or by any means withoutpermission in writing from the Carnegie Endowment.
The Carnegie Endowment normally does not take institutional positions on public policy issues; theviews presented here do not necessarily reflect the views of the Endowment, its staff, or its trustees.
For electronic copies of this report, visit www.CarnegieEndowment.org/trade. Limited printcopies are also available. To request a copy, send an e-mail to [email protected].
Carnegie Endowment for International Peace
1779 Massachusetts Avenue, N.W.Washington, D.C. 20036202-483-7600Fax 202-483-1840www.CarnegieEndowment.org
About the Author
Sandra Polaski is senior associate and director of the Trade, Equity, and Development project atthe Carnegie Endowment. Before joining the Endowment, she served as the U.S. Secretary ofState’s special representative for international labor affairs, the senior State Department officialdealing with such matters. She played a leading role in the development of U.S. government policyon international labor issues, and integrated those issues into U.S. trade and foreign policy. Prior tothat, she was the director of research for the North American Commission on Labor Cooperation, aNAFTA-related intergovernmental body.
Cover photo: Tomasz Tomaszewski/National Geographic Image Collection
Table of Contents
Acknowledgments iv
List of Tables, Figures, and Boxes v
Overview of the Report vii
Chapter 1Introduction: A Changing World of Trade 1
Chapter 2 A Description of the Model 3
Chapter 3The Results of Doha Round Trade Simulations 21
Chapter 4A Comparison of Models and Simulation Results 57
Chapter 5Policy Implications and Recommendations 67
AppendixesA. Technical Specifications of the Model 75B. Sensitivity Analysis 97
Notes 101
Carnegie Endowment for International Peace 104
This report is the product of a team organizedby the Trade, Equity, and Development Projectof the Carnegie Endowment for InternationalPeace, which included external experts as wellas Carnegie staff. It was led by project directorSandra Polaski. The team consisted of chiefmodeler Zhi Wang, expert advisor ShermanRobinson, researchers Kate Vyborny andJennifer Maul, program assistants GretchenSmith and Nicole Brown, copyeditor Alfred F.Imhoff, designers Laurie Rosenthal and PeteLindeman, and production manager Phyllis Jask.
We are deeply grateful to the RockefellerFoundation and its Global Inclusion Program forgenerous funding and continuous engagementand support throughout the project.
We benefited greatly from the comments,criticisms, and questions of numerous policymakers, modelers, and other economists as wepresented early versions of the model resultsand implications at meetings in Geneva,Washington, Brussels, and Paris.
The work of external modelers and experts doesnot imply any responsibility for the contents ofthe final report or for any remaining errors,which rests with the main author, Sandra Polaski.The policy conclusions and recommendationsare also those of Sandra Polaski, and they donot necessarily represent the views of theCarnegie Endowment for International Peace orthose of the external experts or the institutionswith which they are affiliated.
Acknowledgments
iv Winners and Losers: Impact of the Doha Round on Developing Countries

List of Tables, Figures, and Boxes
Tables2.1 Countries and Regions in the Model2.2 Sectors in the Model2.3 Unemployment Rate for Urban Unskilled Labor in Developing Countries2.4 Scenarios Modeled3.1 Global Real Income Gains from Trade Scenarios3.2 Percentage Change in World Export Prices under Different Scenarios3.3 Percentage Change in World Import Prices under Different Scenarios3.4 Percentage Change in International Terms of Trade under Different Scenarios3.5 Change in Net Exports under Hong Kong Scenario3.6 Percentage Change in Factor Returns under Sectoral and Hong Kong Scenarios3.7 Percentage Change in Demand for Unskilled Labor by Sector under Hong Kong Scenario3.8 Percentage Change in Demand for Agricultural Labor by Sector under Hong Kong Scenario3.9 Percentage Changes in Production and Value Added by Sector under Hong Kong Scenario3.10 Percentage of Working Population Engaged in Agriculture, 20034.1 Income Gains from Full Free Trade in the World Bank Model with Different Data Sets4.2 Income Gains from Full Free Trade Compared with Plausible Doha Scenarios, Carnegie and
World Bank Models4.3 Destination of Exports under Agricultural Liberalization in the World Bank Model: Change from
Baseline in Bilateral Trade Flows from World Bank Doha Scenario 7A.1 Countries and Regions in the Model and Correspondence to GTAP DatabaseA.2 Sectors in the Model, with Corresponding GTAP and ISIC CodesA.3 Definitions of VariablesA.4 Definitions of ParametersA.5 Economic Data, Factor Endowments, and Trade Dependence for Regions in the ModelA.6 Net Trade Patterns across the World B.1 Sensitivity of Labor Market Specification for Developing Countries: Change in Real Income
Figures2.1 Agricultural Labor as a Share of Total Labor2.2 Urban Unskilled Labor as a Share of Total Labor2.3 Skilled Labor as a Share of Total Labor2.4 Capital/Labor Ratio2.5 Land/Labor Ratio2.6 Exports as a Share of Output2.7 Imports as a Share of Absorption3.1 Global Distribution of Gains under Central Doha and Hong Kong Scenarios3.2 Gains (Losses) for Developed and Developing Countries under Doha Scenarios for Agriculture
and Manufactures3.3 Gains (Losses) for Developed and Developing Countries under Hong Kong Scenarios for
Agriculture and Manufactures
Carnegie Endowment for International Peace v
vi Winners and Losers: Impact of the Doha Round on Developing Countries
3.4 Manufacturing Liberalization: Developing Country Winners and Losers under Doha Scenario forManufactures
3.5 Manufacturing Liberalization: Developing Country Winners and Losers under Modest Scenariofor Manufactures
3.6 Gains (Losses) of World Export Market Share for Developing Countries’ Manufactures Exportsunder Hong Kong Scenario, by sub-sector
3.7 Gains (Losses) of World Export Market Share for Developing Countries’ Manufactures Exportsunder Hong Kong Scenario
3.8 Agricultural Liberalization: Developing Country Winners and Losers under Doha Scenario forAgriculture
3.9 Agricultural Liberalization: Developing Country Winners and Losers under Limited Scenario forAgriculture
3.10 Gains (Losses) of World Export Market Share for Developing Countries’ Agriculture Exportsunder Hong Kong Scenario, by sub-sector
3.11 Impact of Flexibility for “Special Products” on Real Income Gains for Developed andDeveloping Countries
3.12 Impact of Flexibility for “Special Products” on Real Income Gains for Selected Countries3.13 Poorest Countries Lose Income under All Doha Scenarios3.14 Sectoral Composition of Real Income Gains for Developing Countries 3.15 Real Income Gains (Losses) for Developing Countries under Overall Scenarios3.16 Real Income Gains for Developed Countries under Overall Scenarios3.17 Sectoral Composition of Real Income Gains for Developed Countries3.18 Gains (Losses) of World Export Market Share for Developed Countries’ Agriculture Exports
under Hong Kong Scenario, by sub-sector3.19 Gains (Losses) of World Export Market Share for Developed Countries’ Manufactures Exports
under Hong Kong Scenario, by sub-sector3.20 Developing Country Real Income Gains (Losses) as a Percentage of GDP under Central Doha
and Hong Kong Scenarios3.21 Developed Country Real Income Gains as a Percentage of GDP under Central Doha and Hong
Kong Scenarios3.22 Impact of Hong Kong Scenario on Global Prices 3.23 Population Living in Poverty in Developing Countries and Regions4.1 Sectoral Gains (Losses) for Developed and Developing Countries under World Bank Scenarios
for Agriculture and Manufactures4.2 Global Real Income Gains from Agricultural Liberalization: Comparison of Major Models4.3 Agricultural Liberalization: Developing Country Winners and Losers under Carnegie Doha
Scenario for Agriculture and World Bank Scenario 2A.1 Structure of ProductionA.2 Structure of DemandA.3 Price System in the Model
Boxes5.1 RecommendationsA.1 Equations

Carnegie Endowment for International Peace vii
World trade negotiationsappear to be stalemated.Meeting in Hong Kong inDecember 2005, tradeministers from World
Trade Organization (WTO) member countrieswere unable to bridge major disagreements inthe Doha Round negotiations, so calledbecause they were launched in Doha, Qatar, in2001. Why are these negotiations so difficult?The answers lie mainly in the developing world.
A Changing World of Trade
The global trade regime expanded during thepast two decades to encompass most devel-oping countries, including China, which wasoutside the capitalist trading system in earlierrounds of trade talks. Countries like India wereless engaged in earlier rounds, reflectingeconomies that were largely closed at the time.Now, however, these fast-growing countrieshave become major players in the globaleconomy and global trade regime. As they joinglobal trade negotiations, they bring their ownoffensive and defensive concerns. Some wantto liberalize sectors in which they are competi-tive, such as agriculture, textiles, and apparel—the same sectors that are the most protected inwealthy countries, reflecting strong domesticconstituencies resistant to change. Developingcountries also have defensive concerns. Manyof them have agricultural sectors that employ
large shares of their population but are notcompetitive in global markets. And many wantto maintain trade barriers to nurture fledglingdomestic manufacturing and service sectors.The different priorities of developed and devel-oping countries make it inevitable that currentand future bargaining rounds will be morecomplex and difficult than past negotiations.
What would it take to produce a global tradeagreement that addresses the interests of bothdeveloped and developing countries? Toanalyze the underlying economic interests ofthe WTO’s diverse members and the potentialeffects of the Doha Round negotiations, theTrade, Equity, and Development Project of theCarnegie Endowment for International Peacecommissioned a model of global trade as a toolto estimate the impact of different trade policyscenarios. It is one of the newest in a series ofmodels built to analyze the Doha Round, usingthe latest global trade data.
In comparison with other models, the Carnegiemodel makes several improvements. Mostnotable are more accurate representations ofthe way labor markets function in developingcountries. Most models assume that all labor,including unskilled labor, is fully employed. Yetthis assumption is far from the reality of devel-oping countries. The Carnegie model incorpo-rates actual unemployment rates. Most modelstreat agricultural labor as identical to urban
Overview of the Report

unskilled labor, an inaccurate assumption thatcan produce inaccurate results. The Carnegiemodel treats agricultural labor markets sepa-rately from urban unskilled labor markets indeveloping countries. These innovations makethe Carnegie model more accurate in gaugingthe impact of trade policies on countries withlarge unskilled and agricultural labor forces.
The Carnegie model was used to simulate arange of plausible outcomes from the DohaRound. The central scenario anticipates anambitious expansion of market access for man-ufactured goods, a more modest expansion foragricultural products, reductions of domesticsubsidies and elimination of export subsidiesfor agricultural products. It requires lessermeasures by developing countries and none bythe least developed countries (LDCs), based onguidelines already agreed. A second main sce-nario was constructed after the Hong Kongmeeting to simulate agreements reachedthere. In this scenario, the same level of tariffcuts is applied to both agriculture and manu-facturing. The reductions are set at levels closeto proposals that are now on the negotiatingtable.
Findings That Defy ConventionalWisdom about the Doha Round
The most important finding at the aggregate,global level is that any of the plausible tradescenarios will produce only modest gains, onthe order of a one-time increase in worldincome of $40 to $60 billion. This represents anincrease of less than 0.2 percent of currentglobal gross domestic product (GDP). Thelimited nature of the gains from the DohaRound goes far in explaining the lack ofurgency demonstrated by WTO negotiators.Given relatively low gains, the adjustment coststo which countries expose themselves whenthey change trade policies may loom largerthan in the past. Losses of existing jobs and
firms are often more painful politically thanpotential gains in future growth. Major coun-tries are likely to insist that any agreement mustaccommodate their main defensive interests. Asa result, the Doha Round will probably achieveonly modest changes in any sector.
The modest overall gains would have quite dif-ferent economic effects on different countriesand regions. There are both net winners andnet losers under different scenarios, and thepoorest countries are among the net losersunder all likely Doha scenarios. At the countrylevel, maximum gains or losses are about 1percent of GDP for the most affectedeconomies. The biggest gainer is China, withgains ranging from 0.8 to 1.2 percent of GDPunder different scenarios. The biggest losersare some Sub-Saharan African countries, whichsee a reduction in income of just under 1percent. Most countries’ gains or losses rangefrom 0 to 0.5 percent of current GDP.
Among developing countries, about 90 percentof the gains from Doha scenarios would comefrom liberalization of trade in manufacturedgoods. Most developing countries gain fromliberalization of trade in manufactured goods,with China gaining the most and Asian coun-tries gaining more than Latin American andAfrican countries.
The benefits of agricultural trade liberalizationflow overwhelmingly to rich countries, whiledeveloping countries actually suffer slight lossesas a group. There are great differences in theimpact on different developing countries. A fewcountries gain, notably Brazil, Argentina, andThailand, but more suffer small losses from agri-cultural liberalization. The losers include manyof the poorest countries in the world, includingBangladesh and the countries of East Africa andthe rest of Sub-Saharan Africa. Middle Easternand North African countries, Vietnam, Mexico,and China also experience losses.
viii Winners and Losers: Impact of the Doha Round on Developing Countries

These results run counter to a commonly heldview about the Doha Round, that agriculturalliberalization benefits developing countries andwill augment their growth and development.Instead, agricultural liberalization benefits onlya relatively small subset of developing coun-tries, whereas manufacturing liberalization ismore important to most developing countries.
There are several reasons why the developingworld does not gain broadly from agriculturalliberalization. Many poor countries are net foodimporters. Many lose relative advantages theynow enjoy under special preference programs.However, a more fundamental problem arisesfrom the reality that low-productivity, small-scalesubsistence farming makes up a large portion ofagricultural activity in many developing coun-tries. The products of subsistence farmers aregenerally not competitive on global markets.
The pervasiveness of noncompetitive, small-scale farming in many developing countries hasled them to demand special consideration fortheir agricultural sectors in the Doha Round. Totest the impact on other countries of takingaccount of these agricultural concerns, we simu-lated a scenario in which developing countriesare allowed to shield agricultural products fromtariff liberalization. The results of this scenarioare surprising and important. Special treatmentcould be extended with only minor reductionsin other countries’ gains from the Doha Round,even for countries that are major agriculturalexporters. As for the developing countriesthemselves, India and Vietnam experienceslightly greater overall income gains under thisscenario, despite some loss of efficiency in theireconomies from continued tariffs. Bangladeshand the East African countries experiencesmaller losses if these exceptions are allowed.
Another striking result from the model is thepossibility that the poorest countries may losefrom any agreement unless additional special
measures are taken on their behalf. The resultsshow that Bangladesh, East Africa, and the restof Sub-Saharan Africa are adversely affected inalmost every scenario.
Although the Carnegie model was constructedprimarily to assess the impact of the DohaRound on developing countries, interestingresults also emerge for the developed world.All high-income countries and regions experi-ence small gains from the main scenarios, andthe gains come mainly from the liberalization ofmanufactured rather than agricultural goods.The United States gains more from liberaliza-tion of manufacturing than of agriculture. Forthe fifteen Western and Central Europeanmembers of the European Union (EU) and forJapan, manufacturing accounts for most gains,but agriculture contributes a greater share ofgains than in the United States, as higher levelsof distortions are removed in the EU and Japan.The gains are not without a cost, however.Income from farmland declines dramatically, by26 percent in the EU and 23 percent in Japan.
World export and import prices for all agricul-tural products increase under the main sce-narios. By contrast, liberalization ofmanufactured goods intensifies competition inseveral manufacturing sectors—includingapparel, metal products, and motor vehiclesand parts—and world prices decline slightly.These price trends are at odds with a long-standing historical pattern of declining pricesfor agricultural commodities relative to manu-factured goods.
Trade liberalization for manufactured goodsincreases demand for unskilled labor in mostof the developing world. However, wages donot increase, due to the abundant supply oflabor and the fact that liberalized trade inlabor-intensive manufactures drives downworld prices for such goods. Under the mainscenarios, employment of unskilled labor
Carnegie Endowment for International Peace ix
increases by about 1 percent in the manufac-turing sector for developing countries as agroup, although the gain is unevenly distrib-uted among countries and across manufac-turing subsectors. Increases in unskilledemployment of 1 percent or more are realizedby China, Indonesia, the other members of theAssociation of Southeast Asian Nations(ASEAN), and India. Once again, the threepoorest countries/regions in the model(Bangladesh, East Africa, and the rest of Sub-Saharan Africa) actually lose unskilled jobs inmanufacturing industries. Income for agricul-tural labor and land increases in developingcountries, except in Mexico, India,Bangladesh, and Vietnam. For developingcountries as a group, agricultural employmentbarely increases (0.17 percent) under the mainscenarios, but is somewhat more robust underthe special scenario for developing countryagriculture (0.3 percent).
Global trade models do not capture the costsincurred as economies adjust to trade reform,with some labor and capital idled by changes intrade patterns. At least in the short term, thiswill subtract from overall income gains and havea potentially large negative impact on theaffected individuals and households. As a resultof omitting these costs, models tend to system-atically overstate the gains from trade or under-state the losses. The effects are likely to berelatively greater in developing countries,because they have less diversified economies,with fewer alternative sources of employmentthan developed countries.
From the Perspectives of Equity and Poverty, a Complicated Picture Emerges
The overall gains to the world are dividedfairly evenly between the developed anddeveloping worlds. The big winner in thedeveloping world, China, is also home to large
numbers of poor people, with more than 200million living on less than $1 per day and anadditional 600 million living on less than $2 perday. A Doha pact that lowers tariffs in low-skilled manufactured products could increaseemployment there and boost the incomes ofthe poor. However, in the countries that losefrom the Doha Round, including Bangladeshand many countries in Sub-Saharan Africa,there are even more desperately poor people(267 million) living on less than $1 per day andalmost as many very poor people (486 million)living on less than $2 per day. Most of theworld’s poor people are concentrated in ruralareas and depend on agriculture for theirincomes. This is true in China, Bangladesh,and Sub-Saharan Africa, as well as in othercountries that have large numbers of poorpeople, most notably India. All of these coun-tries lose from agricultural liberalization.Whether a pact would help or hurt their poorcitizens on a net basis depends heavily on thedetails of the outcome. For example, countrieslike India, Indonesia, and Kenya will requireexceptions for the products produced by theirsubsistence farmers if they are to avoidincreases in poverty.
Comparison with Other Trade Models
This report compares results from theCarnegie model with several other models,including the newest World Bank model. Onsome of the most surprising results, othermodels show similar patterns, although theseresults often are not highlighted in reports onthose models.
Conclusions and Recommendations
It is important not to overstate the possiblegains from the Doha Round, as has been doneby many political leaders, commentators, andactivists. It has been fashionable to state thattrade can do more than development aid to lift
x Winners and Losers: Impact of the Doha Round on Developing Countries

Carnegie Endowment for International Peace xi
people out of poverty in developing countries.Though this may be theoretically true, it is clearfrom the Carnegie model and a close study ofmost other recent models that trade is not apanacea for poverty alleviation or for develop-ment more generally. Trade is one factor amongmany that can contribute to economic growthand rising incomes, but its contribution is likelyto be very modest. At the same time, changesin existing trade policies can also cause eco-nomic contraction and must be designed andimplemented with great care. An unrealisticexpectation of gains can lead to pressure forinappropriate policies and could create a band-wagon effect where the very legitimate defen-sive concerns of developing countries areignored to achieve illusory gains. Errors inanalysis can lead to increases in poverty, not thehoped-for reductions, in a broad range ofdeveloping countries. For the poorest coun-tries, where there is little margin for error, therisks are particularly acute.
The report concludes with a set of recommen-dations meant to address the interests andproblems of the developing world in the DohaRound. These include:
■ Many developing countries will require verylong phase-in periods and a carefulsequencing of sectoral liberalizationmeasures, to take account of the impact oftrade changes on their less diversifiedeconomies.
■ Special treatment for developing countryagricultural sectors will be needed becauseof the high concentrations of employment inthose sectors and the long and difficultprocess of raising productivity levels anddeveloping new skills among the hundredsof millions of subsistence farmers in theworld.
■ The Doha Round should include additionaldevelopment assistance for agriculture in
developing countries, because the transitionto more modern sectors will require resourcesbeyond what is domestically available in poorcountries. Major new aid commitments bymultilateral development agencies andbilateral donors are needed.
■ For the LDCs, additional measures will beneeded to ensure that they are not net losersfrom the Doha Round. In Hong Kong,developed countries agreed to extend duty-free and quota-free market access for mostexports of LDCs; however, their mostcompetitive products can be excluded. Theagreement should be extended to include allproducts of LDCs by a firm future date. Thefinal plan should also eliminate cumbersomerules of origin that block imports of someproducts from LDCs and reduce theiropportunity to achieve economies of scale.
■ Middle-income countries should also extendthis access to the LDCs. China established apositive precedent by offering preferentialaccess to many products of the leastdeveloped ASEAN members as part of aregional free trade agreement, althoughthere are many exceptions. Preferentialaccess should be extended by other middle-income developing countries and by China toLDCs in other regions.
■ A solution must also be found for the groupof low-income countries that are just abovethe threshold for LDC status, because theymay be made worse off by the effort to helpthe poorest. Some access to the specialbenefits should be extended to thesecountries as well.
■ Trade adjustment assistance programs forpoor people in low-income countries shouldbe part of a Doha package. This can be donethrough multilateral development agencies,such as the World Bank, or through bilateralassistance. To date, such programs have notbeen adopted or even discussed. Theyshould be added to the Doha agenda.


Carnegie Endowment for International Peace 1
Efforts to liberalize global tradethrough the World TradeOrganization (WTO) have madelimited progress since thecurrent round of negotiations
was launched in Doha, Qatar, in 2001. Meetingin Hong Kong in December 2005, trade minis-ters from the 149 WTO member countriesresolved only a few issues, while postponingthe deadline for resolution of the main contro-versies until April 30, 2006. Despite the pres-ence of the most senior negotiators and theglare of media attention, member countrieswere unable to break stalemates that exist invirtually every major area of the negotiations.
Why are these negotiations so difficult? Theanswers lie mainly in the developing world.Earlier trade rounds primarily involved devel-oped countries and addressed their priorities.During the past twenty years, however, theglobal trade regime has expanded to includemost of the developing world, including commu-nist countries such as China, which were outsidethe capitalist trading system in earlier rounds oftrade talks. India and a number of smaller coun-tries were less engaged in earlier rounds,reflecting economies that were largely closed atthe time. The relative weight of these countriesin the global economy has grown enormouslyover the same period, and it will continue toexpand due to higher rates of growth in thesecountries compared with mature economies.
As developing countries join global trade nego-tiations, they bring their own offensive anddefensive concerns. Offensively, they want toliberalize sectors in which they are competitive,such as agriculture, textiles, and apparel. Thesesectors were liberalized least in earlier traderounds, due to strong domestic constituenciesin developed countries. The developing coun-tries also have their own defensive concerns,often involving agricultural sectors that employlarge shares of their population but are notcompetitive in global markets, or even indomestic markets in the absence of tariffs.Many are also concerned defensively aboutmanufacturing and service sectors, where theyhope to nurture domestic industries behindtrade barriers. In most developing countries,growing manufacturing and service sectors areseen as essential to absorb growing laborforces and large numbers of low-income, low-productivity farmers.
The different priorities of developed and devel-oping countries make it inevitable that currentand future bargaining rounds will be even morecomplex and difficult than past negotiations. Atthe same time, the size and high growth ratesof many developing economies mean that theirpresence in the global trading system iswelcome. In recognition of the new reality, thecurrent negotiations were named the “DohaDevelopment Round” and were launched witha commitment by wealthy countries to pay
C H A P T E R 1
Introduction: A Changing World of Trade
2 Winners and Losers: Impact of the Doha Round on Developing Countries
special attention to the needs and interests ofdeveloping countries. Arguably, without thiscommitment to redress perceived imbalances inthe global trading system that favored richcountries, the launch of negotiations would nothave been possible. After 2001, however, theinterests of developing countries did notreceive the promised prioritization. The summitof trade ministers held in Cancún, Mexico, in2003 broke down in acrimony, largely due tothese countries’ perception of their continuedmarginalization in the negotiations. At theHong Kong ministerial, at least some progresswas made on the demands of the poorestcountries, although most of these concessionswill take effect only if the talks produce anoverall agreement, an achievement that stillappears out of reach.1
What would it take to reach a global tradeagreement that addresses the interests ofdeveloping countries and holds the potential tolift their incomes, while at the same timeoffering sufficiently expanded opportunities fordeveloped countries to win their assent?Answering this question is not a simple matter.Global trade is carried out through myriad two-way trade relationships between countries thathave different sets of assets, capabilities, andvulnerabilities. Differences in the size and skillsof workforces, suitability for cultivating differentagricultural crops, and amount of capital avail-able for investment mean that a particular traderule change will affect countries differently.Finding a mix of trade policy changes thatoffers opportunities for all, or even for most, iscomplex and difficult.
To analyze the underlying economic interests of
the WTO’s diverse members and to identifycombinations of trade policies that wouldproduce widely distributed benefits, the Trade,Equity, and Development Project of theCarnegie Endowment for International Peacecommissioned an applied general equilibrium(AGE) model of global trade.2 AGE models arecomputer-based simulations of how economieswork. In the case of global trade models, theentire world economy is modeled, including themaze of bilateral trade relationships.
Once such a model is built, it can be used as alaboratory for policy experiments in whichvarious policies are changed and the results aretraced through the model for their impact ondifferent sectors, different economic actors, andthe overall welfare of countries and the globaleconomy. The Carnegie model was used tosimulate the impact on different countries andregions of various trade proposals that approxi-mate those under consideration in the DohaRound. Scenarios were constructed that captureplausible outcomes from the round.
This report presents the results of these tradepolicy simulations. The model and a descrip-tion of how it represents the world’s economiesare presented in chapter 2, with a moredetailed specification of the model provided inappendix A and a sensitivity analysis inAppendix B. In chapter 3, the main results ofthe trade policy simulations are reported.Chapter 4 provides an overview of severalother important models and a comparison oftheir structures and results. In chapter 5, theconclusions and implications that can be drawnfrom the Carnegie model results are discussedand policy recommendations are presented.
Carnegie Endowment for International Peace 3
The Carnegie model is one of thenewest in a series of models builtfor the purpose of analyzing andprojecting possible impacts of theDoha Round. Applied general
equilibrium (AGE) trade models create a simula-tion of the workings of actual economies as theyengage in trade, represented through an exten-sive series of equations that establish the rela-tionships between economic variables. The AGEmodel used in this analysis shares many basicfeatures with other current models. The impor-tant distinguishing features of this model are dis-cussed below.
The Carnegie model is a multicountry, multi-sector general equilibrium model. It uses datafrom the Global Trade Analysis Project (GTAP)database Version 6.0, the newest compilation ofglobal trade data, which is used in most recentmajor models.3 Additional data are drawn fromvarious national and intergovernmental sources,as noted where the data appear. The data areused to construct a baseline representation ofthe current global economy. This serves as abasis for comparison with the impact of simula-tions of different trade policy scenarios, such asthose that might be agreed in the World TradeOrganization (WTO). The scenarios are describedbelow. The results of the simulations showchanges in prices, terms of trade, and net tradevolumes induced by different trade policychanges, along with changes in returns to factors
of production (land, labor, and capital) andemployment. The model also captures gainsfrom the more efficient use of resources and fromthe transfer of technology, which increases astrade barriers are lowered. Technology transfer isassumed to flow in one direction—from moredeveloped regions to less developed regions.
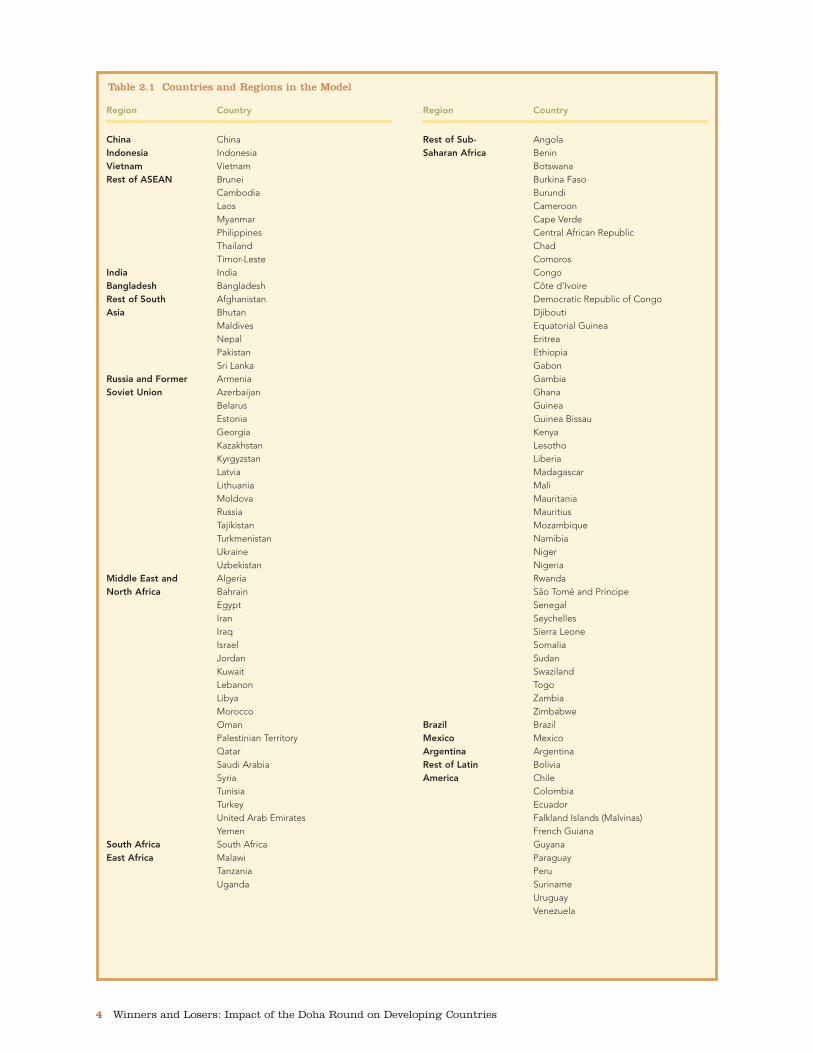
The model is global in scope, covering all coun-tries (including nonmembers of the WTO). Tomake global models computable (and becauseof data limitations) it is necessary to aggregatesmaller countries. In the Carnegie model,eleven large countries, including nine devel-oping countries, are modeled separately, andthe remaining countries are aggregated intothirteen regions (table 2.1). The model coversall sectors, including agriculture, manufacturing,and services. Again, due to the technical limita-tions of models, sectors must be aggregatedinto a workable number. In the Carnegie model,there are twenty-seven sectoral aggregations(table 2.2). There are six factors of production:agricultural land, natural resources, capital, agri-cultural labor, unskilled labor, and skilled labor.The way labor is modeled for developing coun-tries, which is unique to the Carnegie model, isdiscussed below. The model incorporates con-siderable detail on domestic production andconsumption within each country or region aswell as international trade flows at the bilateraland global levels. A fuller technical discussionof the model is found in appendix A.
C H A P T E R 2
A Description of the Model

4 Winners and Losers: Impact of the Doha Round on Developing Countries
Region Country
China ChinaIndonesia IndonesiaVietnam VietnamRest of ASEAN Brunei
CambodiaLaosMyanmarPhilippinesThailandTimor-Leste
India IndiaBangladesh BangladeshRest of South AfghanistanAsia Bhutan
MaldivesNepalPakistanSri Lanka
Russia and Former ArmeniaSoviet Union Azerbaijan
BelarusEstoniaGeorgiaKazakhstanKyrgyzstanLatviaLithuaniaMoldovaRussiaTajikistanTurkmenistanUkraineUzbekistan
Middle East and AlgeriaNorth Africa Bahrain
EgyptIranIraqIsraelJordan Kuwait LebanonLibyaMoroccoOmanPalestinian TerritoryQatarSaudi ArabiaSyriaTunisiaTurkeyUnited Arab EmiratesYemen
South Africa South AfricaEast Africa Malawi
TanzaniaUganda
Region Country
Rest of Sub- AngolaSaharan Africa Benin
BotswanaBurkina FasoBurundiCameroonCape VerdeCentral African RepublicChadComorosCongoCôte d'IvoireDemocratic Republic of CongoDjiboutiEquatorial GuineaEritreaEthiopiaGabonGambiaGhanaGuineaGuinea Bissau KenyaLesothoLiberiaMadagascarMaliMauritaniaMauritiusMozambiqueNamibiaNigerNigeriaRwandaSão Tomé and Príncipe SenegalSeychellesSierra LeoneSomaliaSudanSwazilandTogoZambiaZimbabwe
Brazil BrazilMexico MexicoArgentina ArgentinaRest of Latin BoliviaAmerica Chile
ColombiaEcuadorFalkland Islands (Malvinas)French GuianaGuyanaParaguayPeruSurinameUruguayVenezuela
Table 2.1 Countries and Regions in the Model
Carnegie Endowment for International Peace 5
Region Country
Central America Anguillaand Caribbean Antigua and Barbuda
ArubaBahamasBarbadosBelizeBritish Virgin IslandsCayman IslandsCosta RicaCubaDominicaDominican RepublicEl SalvadorGrenadaGuadeloupeGuatemalaHaitiHondurasJamaicaMartiniqueMontserratNetherlands AntillesNicaraguaPanamaPuerto RicoSaint Kitts and NevisSaint LuciaSaint Vincent and the GrenadinesTrinidad and TobagoTurks and CaicosU.S. Virgin Islands
Rest of the World AlbaniaAmerican SamoaAndorraBermudaBosnia and HerzegovinaBulgariaCook IslandsCroatiaFaroe IslandsFijiFormer Yugoslav Republic of MacedoniaFrench PolynesiaGibraltarGreenlandGuamKiribatiMacauMarshall IslandsMicronesia, Federated States ofMonacoMongoliaNauruNew CaledoniaNiue
Region Country
Norfolk IslandNorth KoreaNorthern Mariana IslandsPalauPapua New GuineaRomaniaSaint Pierre and MiquelonSamoaSan MarinoSerbia and MontenegroSolomon IslandsTokelauTongaTuvaluVanuatuWallis and Futuna
Asian Newly Hong KongIndustrialized Economies Malaysia
SingaporeSouth KoreaTaiwan
United States United StatesEuropean Union 15 Austria
BelgiumDenmarkFinlandFranceGermanyGreeceIrelandItalyLuxembourgNetherlandsPortugalSpainSwedenUnited Kingdom
European Union 10 CyprusCzech RepublicHungaryMaltaPolandSlovakiaSloveniaEstoniaLatviaLithuania
Japan JapanRest of OECD Australia
CanadaIcelandLichtensteinNew ZealandNorwaySwitzerland
Table 2.1 (continued) Countries and Regions in the Model
Note: ASEAN = Association of Southeast Asian Nations. OECD = Organization for Economic Cooperation and Development.

AGE models are not meant to be forecasts ofeconomic outcomes, because many factors willdetermine the actual impact of trade policychanges on the real world. The reliability offindings from AGE models is constrained bydata limitations and the necessity to simplify
economic realities in order to make the modelscomputable. The Carnegie model shares theseconstraints, and the results should not beviewed as predictions of economic perform-ance. What the Carnegie model, like otherwell-constructed models, can do is to provide a
6 Winners and Losers: Impact of the Doha Round on Developing Countries
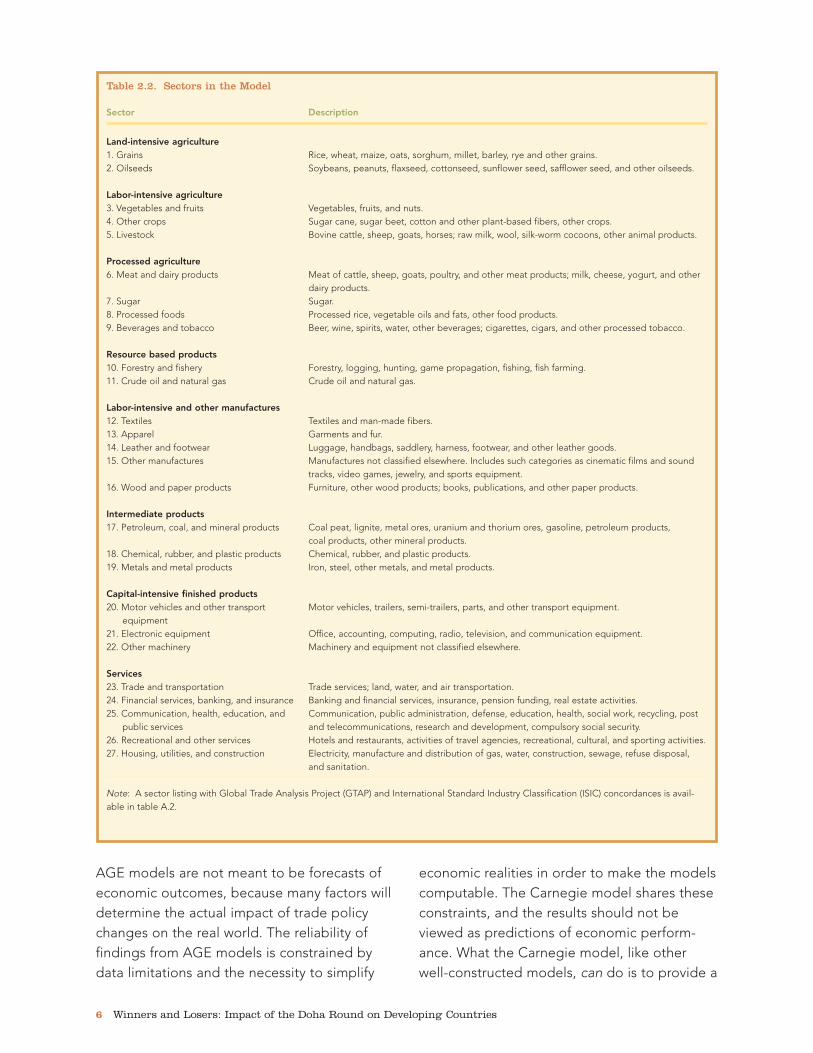
Table 2.2. Sectors in the Model
Sector Description
Land-intensive agriculture1. Grains Rice, wheat, maize, oats, sorghum, millet, barley, rye and other grains.2. Oilseeds Soybeans, peanuts, flaxseed, cottonseed, sunflower seed, safflower seed, and other oilseeds.
Labor-intensive agriculture3. Vegetables and fruits Vegetables, fruits, and nuts.4. Other crops Sugar cane, sugar beet, cotton and other plant-based fibers, other crops.5. Livestock Bovine cattle, sheep, goats, horses; raw milk, wool, silk-worm cocoons, other animal products.
Processed agriculture6. Meat and dairy products Meat of cattle, sheep, goats, poultry, and other meat products; milk, cheese, yogurt, and other
dairy products.7. Sugar Sugar.8. Processed foods Processed rice, vegetable oils and fats, other food products.9. Beverages and tobacco Beer, wine, spirits, water, other beverages; cigarettes, cigars, and other processed tobacco.
Resource based products10. Forestry and fishery Forestry, logging, hunting, game propagation, fishing, fish farming.11. Crude oil and natural gas Crude oil and natural gas.
Labor-intensive and other manufactures12. Textiles Textiles and man-made fibers.13. Apparel Garments and fur.14. Leather and footwear Luggage, handbags, saddlery, harness, footwear, and other leather goods.15. Other manufactures Manufactures not classified elsewhere. Includes such categories as cinematic films and sound
tracks, video games, jewelry, and sports equipment.16. Wood and paper products Furniture, other wood products; books, publications, and other paper products.
Intermediate products17. Petroleum, coal, and mineral products Coal peat, lignite, metal ores, uranium and thorium ores, gasoline, petroleum products,
coal products, other mineral products.18. Chemical, rubber, and plastic products Chemical, rubber, and plastic products.19. Metals and metal products Iron, steel, other metals, and metal products.
Capital-intensive finished products20. Motor vehicles and other transport Motor vehicles, trailers, semi-trailers, parts, and other transport equipment.
equipment21. Electronic equipment Office, accounting, computing, radio, television, and communication equipment.22. Other machinery Machinery and equipment not classified elsewhere.
Services23. Trade and transportation Trade services; land, water, and air transportation.24. Financial services, banking, and insurance Banking and financial services, insurance, pension funding, real estate activities.25. Communication, health, education, and Communication, public administration, defense, education, health, social work, recycling, post
public services and telecommunications, research and development, compulsory social security.26. Recreational and other services Hotels and restaurants, activities of travel agencies, recreational, cultural, and sporting activities.27. Housing, utilities, and construction Electricity, manufacture and distribution of gas, water, construction, sewage, refuse disposal,
and sanitation.
Note: A sector listing with Global Trade Analysis Project (GTAP) and International Standard Industry Classification (ISIC) concordances is avail-able in table A.2.
comparison of the relative effects of alternativetrade policy proposals when all other factorsare held constant. This capacity makes themodel an extremely useful tool for policymakers and the public in deciding betweencompeting proposals.
Distinguishing Features of the Model
AGE models can be extended or adapted invarious ways to provide greater detail on partic-ular aspects of economic activity or to attemptgreater accuracy in the representation of eco-nomic reality. The approaches taken in differentmodels will differ according to the trade andeconomic policy issues that are of greatestinterest to those constructing the models anddesigning policy simulations.
In the case of the Carnegie model, importantobjectives were to explore the impact of pos-sible trade policy changes on economic growth,employment, agriculture, and low-skilled manu-facturing in developing countries. Because themajority of the world’s population lives in thosecountries, and the vast majority of livelihoodsthere depend on the agricultural sector orunskilled urban occupations, the impact ofglobal trade policies on these individuals andhouseholds will have an important effect onglobal economic activity, stability, and growth. Ifglobal trade extends opportunities to theseindividuals and households—the globalmajority—the global trading system can realizeits potential to contribute to poverty alleviation,equity, and broad-based growth. If these indi-viduals and households do not benefit, or ifthey face worse economic circumstances as aresult of global trade rules, the impact of tradewill be to concentrate wealth in a relativelysmall number of countries, firms, and house-holds. This would call into question both thelegitimacy and sustainability of an open globaltrade regime.
Trade policy changes tend to affect individualsand households more through effects on earn-ings, such as changes in employment or wagesor the prices of agricultural products sold, thanthrough effects on consumption, such aschanges in the prices of goods purchased.4 Theimpact of trade policies on demand in the agri-cultural sector and in labor markets of eachcountry is an important factor in gauging thewelfare results for the poor and for others whosemain asset is their labor. AGE models are wellsuited for probing these effects, because theycapture the gains or losses to both producersand consumers, through wage and pricechanges that are induced by trade liberalization.
The importance of agriculture and unskilledlabor demand for the livelihoods of the globalmajority makes it imperative to represent themarkets for agricultural and unskilled labor indeveloping countries as accurately as possiblein the model. The Carnegie model makesseveral important innovations in this regardcompared with other models.5
Most general equilibrium models include onlytwo classes of labor, skilled and unskilled,without distinguishing between unskilled laborin urban and agricultural labor markets. In manydeveloping countries, however, a large share ofthe economically active population is engagedin small-scale agriculture. The labor market inthat sector is quite distinct from urban labormarkets. To reflect this reality, the Carnegiemodel disaggregates labor into three types:agricultural labor, urban unskilled labor, andurban skilled labor.
Most models assume that all labor, includingunskilled labor, is fully employed.Unemployment is not taken into account. Anyincreases (or decreases) in demand for laborcaused by trade policy changes will be shown inthe model results as rising (or declining) wages.This assumption is highly inaccurate for the
Carnegie Endowment for International Peace 7

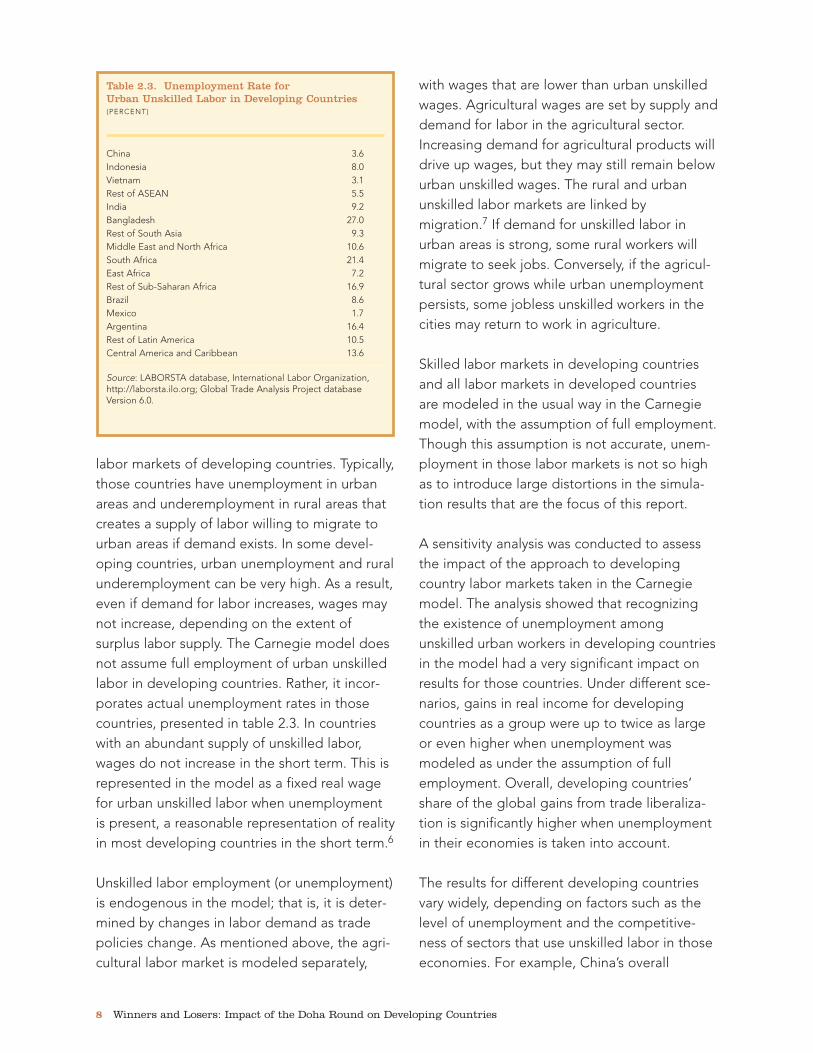
labor markets of developing countries. Typically,those countries have unemployment in urbanareas and underemployment in rural areas thatcreates a supply of labor willing to migrate tourban areas if demand exists. In some devel-oping countries, urban unemployment and ruralunderemployment can be very high. As a result,even if demand for labor increases, wages maynot increase, depending on the extent ofsurplus labor supply. The Carnegie model doesnot assume full employment of urban unskilledlabor in developing countries. Rather, it incor-porates actual unemployment rates in thosecountries, presented in table 2.3. In countrieswith an abundant supply of unskilled labor,wages do not increase in the short term. This isrepresented in the model as a fixed real wagefor urban unskilled labor when unemploymentis present, a reasonable representation of realityin most developing countries in the short term.6
Unskilled labor employment (or unemployment)is endogenous in the model; that is, it is deter-mined by changes in labor demand as tradepolicies change. As mentioned above, the agri-cultural labor market is modeled separately,
with wages that are lower than urban unskilledwages. Agricultural wages are set by supply anddemand for labor in the agricultural sector.Increasing demand for agricultural products willdrive up wages, but they may still remain belowurban unskilled wages. The rural and urbanunskilled labor markets are linked bymigration.7 If demand for unskilled labor inurban areas is strong, some rural workers willmigrate to seek jobs. Conversely, if the agricul-tural sector grows while urban unemploymentpersists, some jobless unskilled workers in thecities may return to work in agriculture.
Skilled labor markets in developing countriesand all labor markets in developed countriesare modeled in the usual way in the Carnegiemodel, with the assumption of full employment.Though this assumption is not accurate, unem-ployment in those labor markets is not so highas to introduce large distortions in the simula-tion results that are the focus of this report.
A sensitivity analysis was conducted to assessthe impact of the approach to developingcountry labor markets taken in the Carnegiemodel. The analysis showed that recognizingthe existence of unemployment amongunskilled urban workers in developing countriesin the model had a very significant impact onresults for those countries. Under different sce-narios, gains in real income for developingcountries as a group were up to twice as largeor even higher when unemployment wasmodeled as under the assumption of fullemployment. Overall, developing countries’share of the global gains from trade liberaliza-tion is significantly higher when unemploymentin their economies is taken into account.
The results for different developing countriesvary widely, depending on factors such as thelevel of unemployment and the competitive-ness of sectors that use unskilled labor in thoseeconomies. For example, China’s overall
8 Winners and Losers: Impact of the Doha Round on Developing Countries
Table 2.3. Unemployment Rate for Urban Unskilled Labor in Developing Countries(PERCENT)
China 3.6Indonesia 8.0Vietnam 3.1Rest of ASEAN 5.5India 9.2Bangladesh 27.0Rest of South Asia 9.3Middle East and North Africa 10.6South Africa 21.4East Africa 7.2Rest of Sub-Saharan Africa 16.9Brazil 8.6Mexico 1.7Argentina 16.4Rest of Latin America 10.5Central America and Caribbean 13.6
Source: LABORSTA database, International Labor Organization,http://laborsta.ilo.org; Global Trade Analysis Project databaseVersion 6.0.
income gains are more than twice as largewhen unemployment is included in the model.At the same time, a few developing countriesthat are less competitive would see smallergains or larger losses because of the extraadvantage that their more competitive counter-parts enjoy when wages are constrained byunemployment. Mexico and Central Americagain less and Bangladesh loses more in the faceof competition from more efficient countrieswith reserves of unemployed labor.
The sensitivity analysis suggests that modelsthat do not acknowledge unemployment indeveloping countries probably understate gainsfor countries that have competitive manufac-turing sectors to a significant degree, whileminimizing the negative effects on less compet-itive developing countries.
Separating unskilled labor into agricultural andurban unskilled labor forces has a lesser effecton the results. However, the effect is in theopposite direction from that of unemployment.Depending on the scenario, the gains to devel-oping countries as a group are about 2 to 6percent less if these labor forces are modeledseparately rather than as a single unskilledlabor group. This suggests that models thatcombine these two distinct groups into one willtend to overstate the gains to developing coun-tries, although the overstatement will be small.
The results are reported in greater detail inappendix B.
Characteristics of the Global Economy as Represented in the Model
The main data used in the Carnegie model torepresent the existing global economy are pre-sented in tables A.5 and A.6 of appendix A.Table A.5 covers measures such as grossdomestic product (GDP), trade flows, trade
dependence, and factor endowments for eachcountry and region. These variables help toexplain both existing patterns of trade and thepotential impact of trade policy changes. TableA.6 presents the existing net trade patternsacross the world.
A key factor in understanding existing tradepatterns is the distribution of land, labor, andcapital in the global economic system. Thecombination of these factors of production ineach country’s endowment determines its com-parative advantage relative to others in theworld economy. Because these endowmentsare distributed unevenly, countries have dif-ferent relative strengths and costs of produc-tion. For example, if a country has a largesupply of unskilled labor but little capital, itscost of labor will be lower relative to its cost ofcapital. Goods that it produces using unskilledlabor intensively will be relatively inexpensive,both domestically and if exported to countriesthat have relatively scarce (and therefore moreexpensive) supplies of such labor. Similarly, acountry that has abundant land and capital butrelatively scarce labor will tend to produce agri-cultural crops that can be farmed in mecha-nized ways and export them to other countrieswith differing factor endowments and costs.
The data presented in table A.5 show that thehigh-income regions—the United States,European Union (EU), Japan, other high-incomemembers of the Organization for EconomicCooperation and Development (OECD), and thenewly industrialized economies (NIEs) of Asia—are home to only about 16 percent of the globallabor force but possess 78 percent of the world’scapital stock. In contrast, developing regions arehome to more than 84 percent of the globallabor force but possess just 22 percent of theworld’s capital stock. The high-income regionsare also relatively abundant in skilled labor, with36 percent of the world’s skilled labor, more thantwice their share of the total global labor force.
Carnegie Endowment for International Peace 9

Land is more abundant in the developing world,which accounts for 73 percent of the worldendowment of agricultural land.
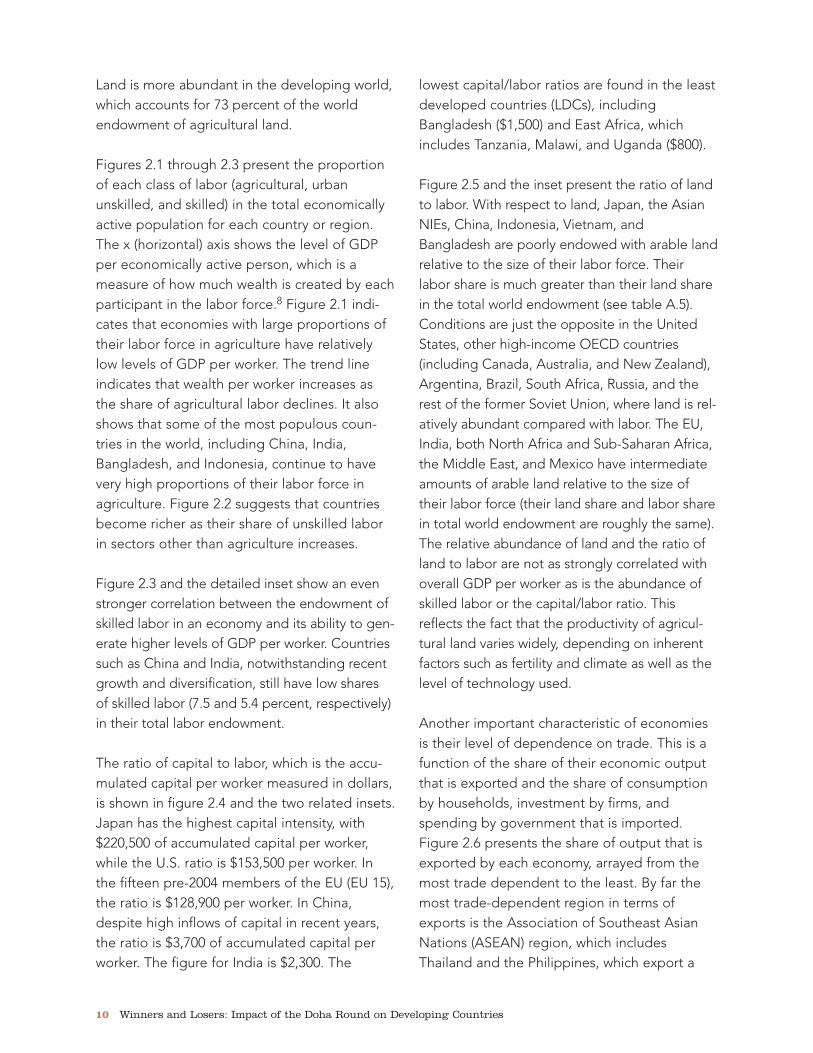
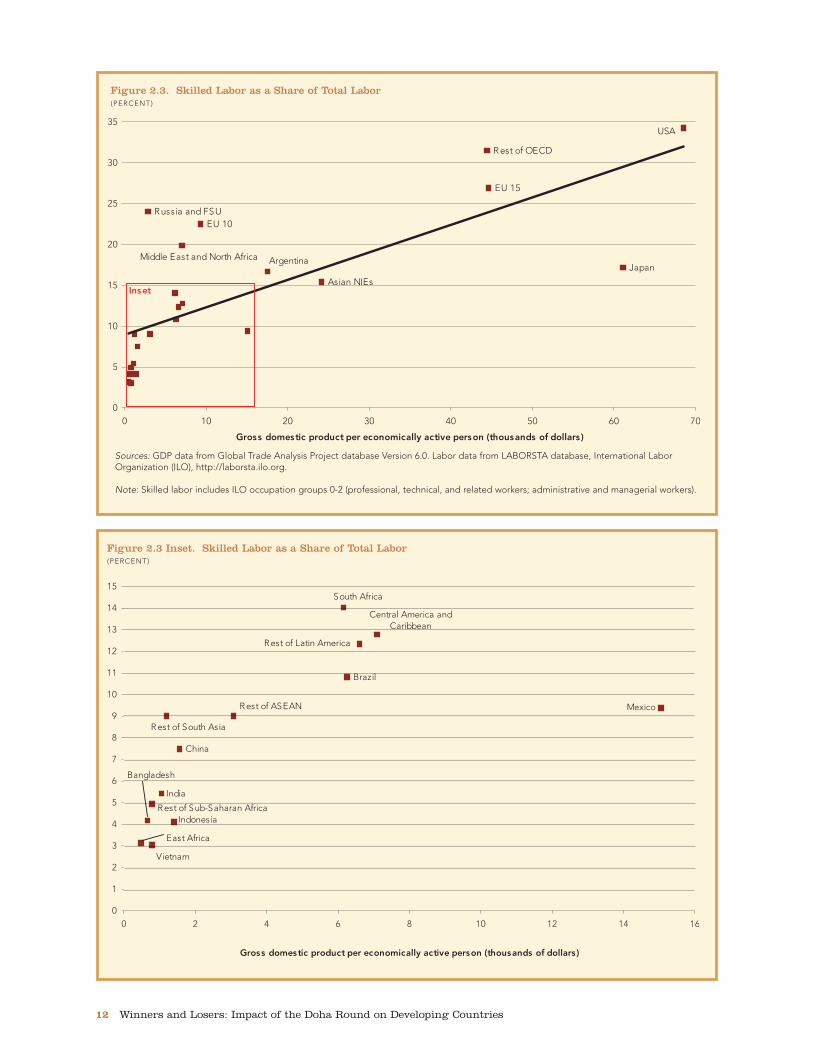
Figures 2.1 through 2.3 present the proportionof each class of labor (agricultural, urbanunskilled, and skilled) in the total economicallyactive population for each country or region.The x (horizontal) axis shows the level of GDPper economically active person, which is ameasure of how much wealth is created by eachparticipant in the labor force.8 Figure 2.1 indi-cates that economies with large proportions oftheir labor force in agriculture have relativelylow levels of GDP per worker. The trend lineindicates that wealth per worker increases asthe share of agricultural labor declines. It alsoshows that some of the most populous coun-tries in the world, including China, India,Bangladesh, and Indonesia, continue to havevery high proportions of their labor force inagriculture. Figure 2.2 suggests that countriesbecome richer as their share of unskilled laborin sectors other than agriculture increases.
Figure 2.3 and the detailed inset show an evenstronger correlation between the endowment ofskilled labor in an economy and its ability to gen-erate higher levels of GDP per worker. Countriessuch as China and India, notwithstanding recentgrowth and diversification, still have low sharesof skilled labor (7.5 and 5.4 percent, respectively)in their total labor endowment.
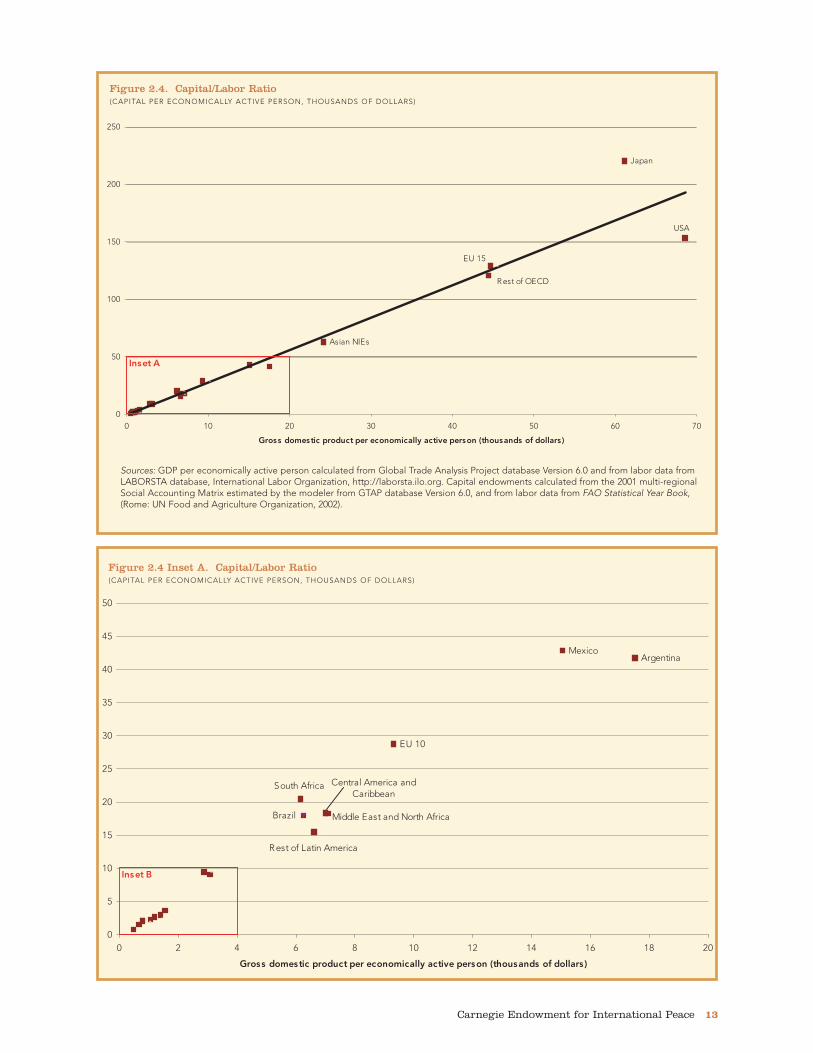
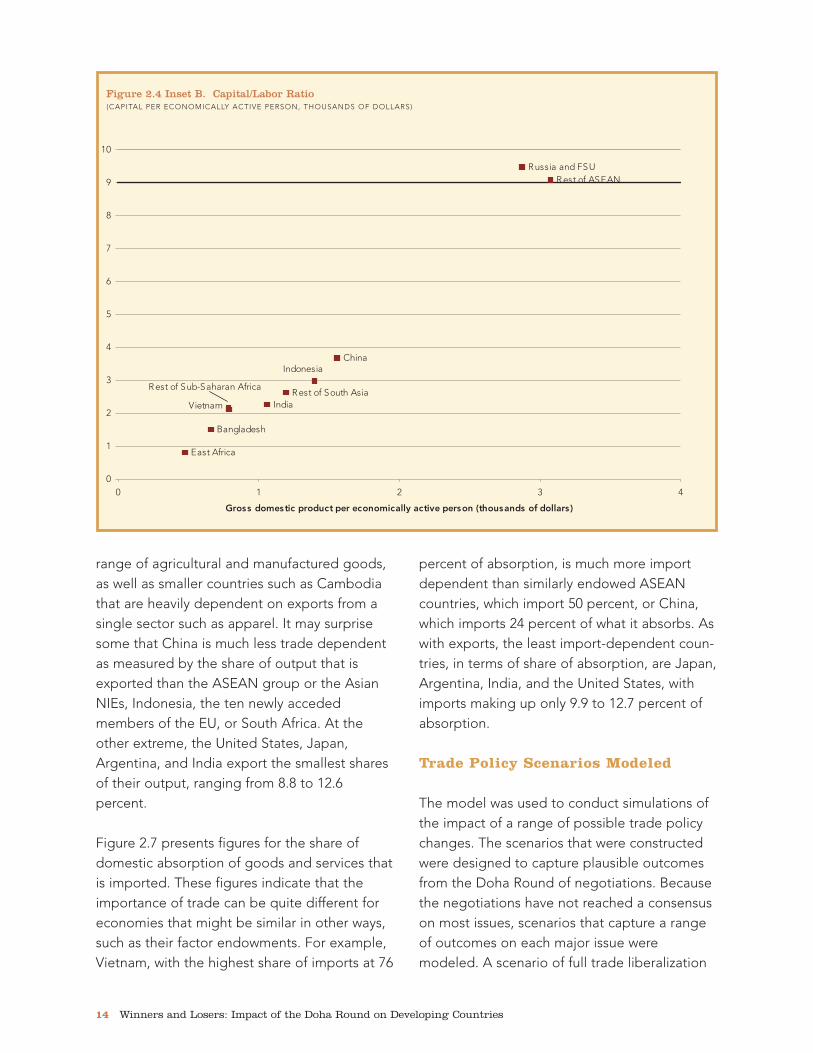
The ratio of capital to labor, which is the accu-mulated capital per worker measured in dollars,is shown in figure 2.4 and the two related insets.Japan has the highest capital intensity, with$220,500 of accumulated capital per worker,while the U.S. ratio is $153,500 per worker. Inthe fifteen pre-2004 members of the EU (EU 15),the ratio is $128,900 per worker. In China,despite high inflows of capital in recent years,the ratio is $3,700 of accumulated capital perworker. The figure for India is $2,300. The
lowest capital/labor ratios are found in the leastdeveloped countries (LDCs), includingBangladesh ($1,500) and East Africa, whichincludes Tanzania, Malawi, and Uganda ($800).
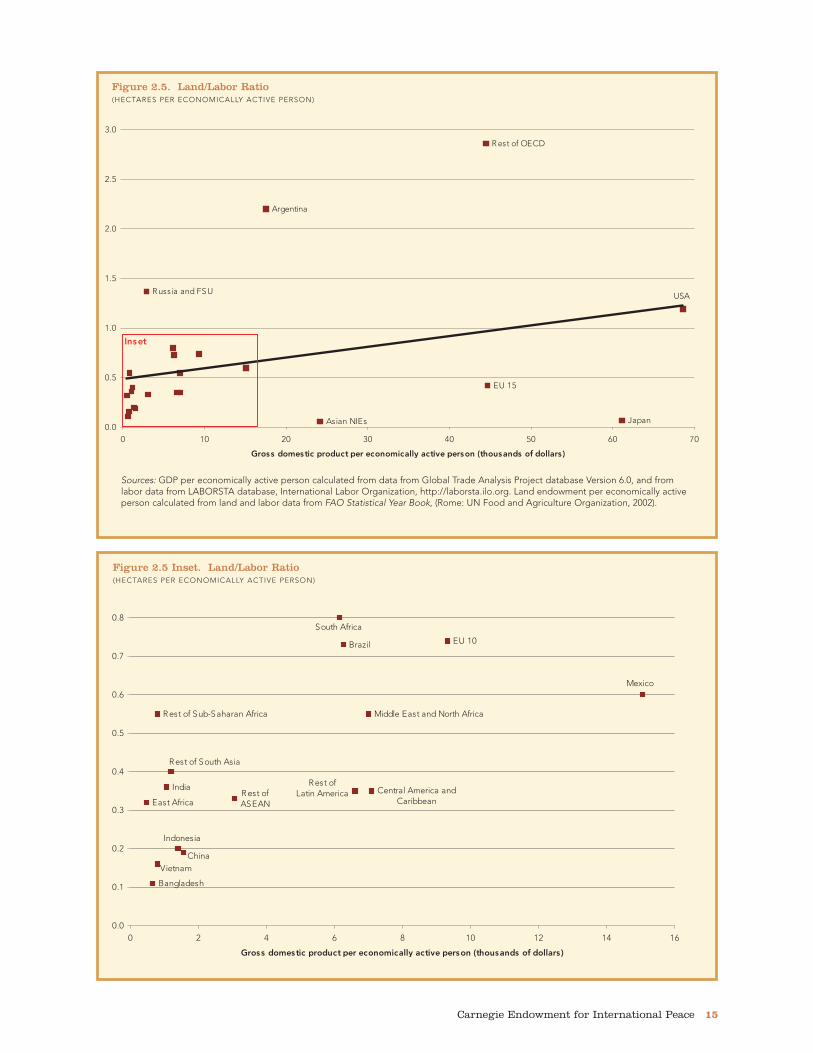
Figure 2.5 and the inset present the ratio of landto labor. With respect to land, Japan, the AsianNIEs, China, Indonesia, Vietnam, andBangladesh are poorly endowed with arable landrelative to the size of their labor force. Theirlabor share is much greater than their land sharein the total world endowment (see table A.5).Conditions are just the opposite in the UnitedStates, other high-income OECD countries(including Canada, Australia, and New Zealand),Argentina, Brazil, South Africa, Russia, and therest of the former Soviet Union, where land is rel-atively abundant compared with labor. The EU,India, both North Africa and Sub-Saharan Africa,the Middle East, and Mexico have intermediateamounts of arable land relative to the size oftheir labor force (their land share and labor sharein total world endowment are roughly the same).The relative abundance of land and the ratio ofland to labor are not as strongly correlated withoverall GDP per worker as is the abundance ofskilled labor or the capital/labor ratio. Thisreflects the fact that the productivity of agricul-tural land varies widely, depending on inherentfactors such as fertility and climate as well as thelevel of technology used.
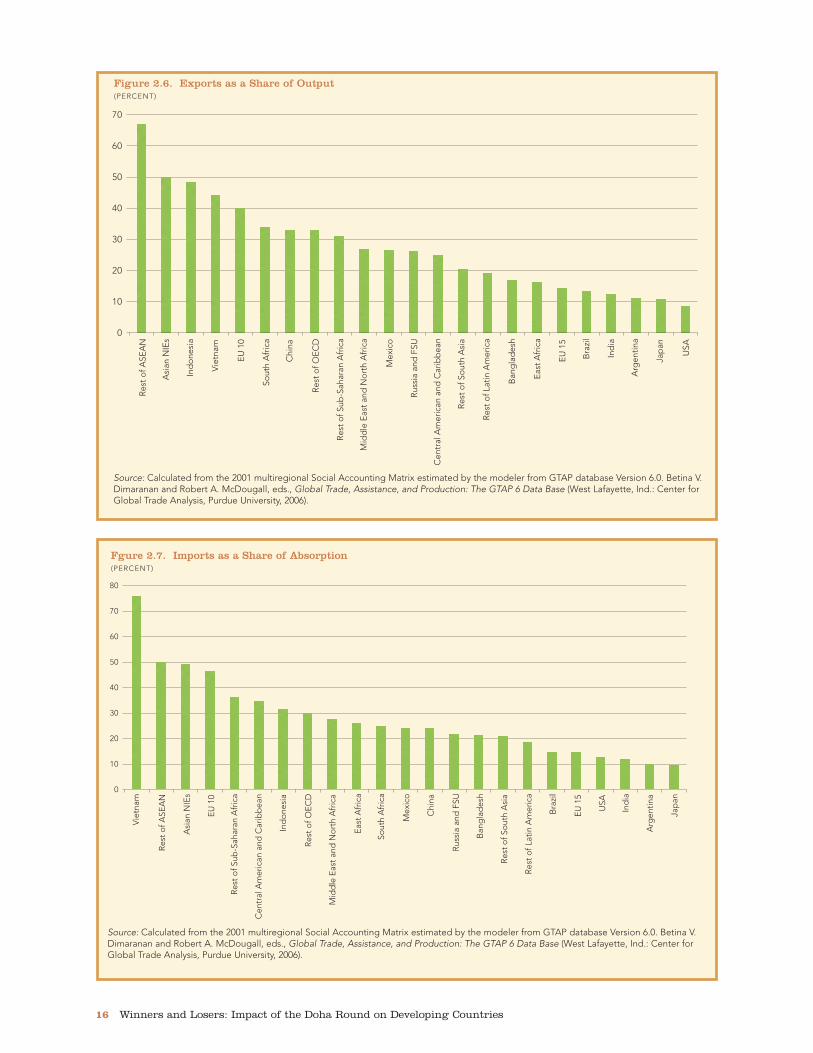
Another important characteristic of economiesis their level of dependence on trade. This is afunction of the share of their economic outputthat is exported and the share of consumptionby households, investment by firms, andspending by government that is imported.Figure 2.6 presents the share of output that isexported by each economy, arrayed from themost trade dependent to the least. By far themost trade-dependent region in terms ofexports is the Association of Southeast AsianNations (ASEAN) region, which includesThailand and the Philippines, which export a
10 Winners and Losers: Impact of the Doha Round on Developing Countries
Carnegie Endowment for International Peace 11
-
-
-
-
-
-
-
-
-
-
-
-
--
-
-
-
-
-
-
-
-
-
anihC
01 UE
aisenodnI
aidnI
ocixeM
sEIN naisA
manteiVacirfA narahaS-buS fo tseR
acirfA tsaE
anitnegrA
hsedalgnaB
lizarB
naebbiraC dna aciremA lartneC
51 UEnapaJDCEO fo tseR
USF dna aissuR
NAESA fo tseR
tsaE elddiMacirfA htroN dna
aisA htuoS fo tseR
aciremA nitaL fo tseR
acirfA htuoS
0
01
02
03
04
05
06
07
08
09
070605040302010
)srallod fo sdnasuoht( nosrep evitca yllacimonoce rep tcudorp citsemod ssorGa
USA
Figure 2.1. Agricultural Labor as a Share of Total Labor(PERCENT)
Sources: GDP data from Global Trade Analysis Project database Version 6.0. Betina V. Dimaranan and Robert A. McDougall, eds., GlobalTrade, Assistance, and Production: The GTAP 6 Data Base, (West Lafayette, Ind.: Center for Global Trade Analysis, Purdue University, 2006).Labor data from LABORSTA database, International Labor Organization, http://laborsta.ilo.org.
a. Gross Domestic Product in 2001 US Dollars.
-
-
-
-
-
-
-
-
-
-
-
-
-
--
-
-
-
-
-
-
-
-
acirfA tsaE
anitnegrAlizarB
51 UE
sEIN naisA
DCEO fo tseR
acirfA htuoS
hsedalgnaB
aciremA lartneCnaebbiraC dna
anihC
01 UE
aisenodnI
aidnI
napaJ
ocixeMaissuRUSF dna USA
manteiV
NAESA fo tseR
acirfA htroN dna tsaE elddiM
aisA htuoS fo tseR
fo tseRaciremA nitaL
acirfA narahaS-buS fo tseR
0
01
02
03
04
05
06
07
08
09
070605040302010
)srallod fo sdnasuoht( nosrep evitca yllacimonoce rep tcudorp citsemod ssorG
Figure 2.2. Urban Unskilled Labor as a Share of Total Labor(PERCENT)
Sources: GDP data from Global Trade Analysis Project database Version 6.0. Labor data from LABORSTA database, International LaborOrganization (ILO), http://laborsta.ilo.org.
Note: Urban unskilled labor includes ILO occupation groups 3-5 (clerical and related workers; sales workers; service workers) and 7-9, (produc-tion and related workers, transport equipment operators, and laborers).
12 Winners and Losers: Impact of the Doha Round on Developing Countries
01 UE
51 UE
napaJ
sEIN naisA
DCEO fo tseR
USF dna aissuR
anitnegrA
USA
acirfA htroN dna tsaE elddiM
0
5
01
51
02
52
03
53
070605040302010
)srallod fo sdnasuoht( nosrep evitca yllacimonoce rep tcudorp citsemod ssorG
tesnI
Figure 2.3. Skilled Labor as a Share of Total Labor(PERCENT)
Sources: GDP data from Global Trade Analysis Project database Version 6.0. Labor data from LABORSTA database, International LaborOrganization (ILO), http://laborsta.ilo.org.
Note: Skilled labor includes ILO occupation groups 0-2 (professional, technical, and related workers; administrative and managerial workers).
-
-
-
-
-
-
-
-
-
--
-
-
-
lizarB
anihC
acirfA tsaE
hsedalgnaB
dna aciremA lartneCnaebbiraC
aisenodnI
aidnI
ocixeM
manteiV
NAESA fo tseR
aisA htuoS fo tseR
aciremA nitaL fo tseR
acirfA narahaS-buS fo tseR
acirfA htuoS
0
1
2
3
4
5
6
7
8
9
01
11
21
31
41
51
6141210186420
)srallod fo sdnasuoht( nosrep evitca yllacimonoce rep tcudorp citsemod ssorG
Figure 2.3 Inset. Skilled Labor as a Share of Total Labor(PERCENT)
Carnegie Endowment for International Peace 13
-
-
-
-
-
-
--
-
-
-
-
-
-
-
-
-
anitnegrA
01 UE
ocixeM
lizarB
dna aciremA lartneCnaebbiraC
acirfA htroN dna tsaE elddiM
aciremA nitaL fo tseR
acirfA htuoS
0
5
01
51
02
52
03
53
04
54
05
02816141210186420
)srallod fo sdnasuoht( nosrep evitca yllacimonoce rep tcudorp citsemod ssorG
B tesnI
Figure 2.4 Inset A. Capital/Labor Ratio(CAPITAL PER ECONOMICALLY ACTIVE PERSON, THOUSANDS OF DOLLARS)
-
-
-
- -
-
-
-
--
-
-
-
-
-
-
--
-
-
-
-
-
napaJ
sEIN naisA
51 UE
DCEO fo tseR
USA
0
05
001
051
002
052
070605040302010
)srallod fo sdnasuoht( nosrep evitca yllacimonoce rep tcudorp citsemod ssorG
A tesnI
Figure 2.4. Capital/Labor Ratio(CAPITAL PER ECONOMICALLY ACTIVE PERSON, THOUSANDS OF DOLLARS)
Sources: GDP per economically active person calculated from Global Trade Analysis Project database Version 6.0 and from labor data fromLABORSTA database, International Labor Organization, http://laborsta.ilo.org. Capital endowments calculated from the 2001 multi-regionalSocial Accounting Matrix estimated by the modeler from GTAP database Version 6.0, and from labor data from FAO Statistical Year Book,(Rome: UN Food and Agriculture Organization, 2002).
range of agricultural and manufactured goods,as well as smaller countries such as Cambodiathat are heavily dependent on exports from asingle sector such as apparel. It may surprisesome that China is much less trade dependentas measured by the share of output that isexported than the ASEAN group or the AsianNIEs, Indonesia, the ten newly accededmembers of the EU, or South Africa. At theother extreme, the United States, Japan,Argentina, and India export the smallest sharesof their output, ranging from 8.8 to 12.6percent.
Figure 2.7 presents figures for the share ofdomestic absorption of goods and services thatis imported. These figures indicate that theimportance of trade can be quite different foreconomies that might be similar in other ways,such as their factor endowments. For example,Vietnam, with the highest share of imports at 76
percent of absorption, is much more importdependent than similarly endowed ASEANcountries, which import 50 percent, or China,which imports 24 percent of what it absorbs. Aswith exports, the least import-dependent coun-tries, in terms of share of absorption, are Japan,Argentina, India, and the United States, withimports making up only 9.9 to 12.7 percent ofabsorption.
Trade Policy Scenarios Modeled
The model was used to conduct simulations ofthe impact of a range of possible trade policychanges. The scenarios that were constructedwere designed to capture plausible outcomesfrom the Doha Round of negotiations. Becausethe negotiations have not reached a consensuson most issues, scenarios that capture a rangeof outcomes on each major issue weremodeled. A scenario of full trade liberalization
14 Winners and Losers: Impact of the Doha Round on Developing Countries
-
-
-
-
-
-
-
-
-
-
acirfA tsaE
hsedalgnaB
anihC
aidnI
USF dna aissuRNAESA fo tseR
aisA htuoS fo tseR
aisenodnI
manteiV
acirfA narahaS-buS fo tseR
0
1
2
3
4
5
6
7
8
9
01
43210
)srallod fo sdnasuoht( nosrep evitca yllacimonoce rep tcudorp citsemod ssorG
Figure 2.4 Inset B. Capital/Labor Ratio(CAPITAL PER ECONOMICALLY ACTIVE PERSON, THOUSANDS OF DOLLARS)
Carnegie Endowment for International Peace 15
acirfA tsaE
hsedalgnaB
lizarB 01 UE
aidnI
acirfA htroN dna tsaE elddiMacirfA narahaS-buS fo tseR
dna aciremA lartneCnaebbiraC
anihC
aisenodnI
ocixeM
manteiV
fo tseRNAESA
aisA htuoS fo tseR
fo tseRaciremA nitaL
acirfA htuoS
0.0
1.0
2.0
3.0
4.0
5.0
6.0
7.0
8.0
6141210186420
)srallod fo sdnasuoht( nosrep evitca yllacimonoce rep tcudorp citsemod ssorG
anitnegrA
51 UE
napaJsEIN naisA
DCEO fo tseR
USF dna aissuR USA
0.0
5.0
0.1
5.1
0.2
5.2
0.3
070605040302010
)srallod fo sdnasuoht( nosrep evitca yllacimonoce rep tcudorp citsemod ssorG
tesnI
Sources: GDP per economically active person calculated from data from Global Trade Analysis Project database Version 6.0, and fromlabor data from LABORSTA database, International Labor Organization, http://laborsta.ilo.org. Land endowment per economically activeperson calculated from land and labor data from FAO Statistical Year Book, (Rome: UN Food and Agriculture Organization, 2002).
Figure 2.5. Land/Labor Ratio(HECTARES PER ECONOMICALLY ACTIVE PERSON)
Figure 2.5 Inset. Land/Labor Ratio(HECTARES PER ECONOMICALLY ACTIVE PERSON)

16 Winners and Losers: Impact of the Doha Round on Developing Countries
0
01
02
03
04
05
06
07
08
Res
t o
f ASE
AN
Asi
an N
IEs
Ind
one
sia
Vie
tnam
EU
10
Sout
h A
fric
a
Chi
na
Res
t o
f OE
CD
Res
t o
f Sub
-Sah
aran
Afr
ica
Mid
dle
Eas
t an
d N
ort
h A
fric
a
Mex
ico
Cen
tral
Am
eric
an a
nd C
arib
bea
n
Res
t o
f So
uth
Asi
a
Res
t o
f Lat
in A
mer
ica
Ban
gla
des
h
Eas
t A
fric
a
EU
15
Bra
zil
Ind
ia
Arg
entin
a
Jap
an
USA
Rus
sia
and
FSU
Fgure 2.7. Imports as a Share of Absorption(PERCENT)
Source: Calculated from the 2001 multiregional Social Accounting Matrix estimated by the modeler from GTAP database Version 6.0. Betina V.Dimaranan and Robert A. McDougall, eds., Global Trade, Assistance, and Production: The GTAP 6 Data Base (West Lafayette, Ind.: Center forGlobal Trade Analysis, Purdue University, 2006).
0
01
02
03
04
05
06
07
Res
t o
f ASE
AN
Asi
an N
IEs
Ind
one
sia
Vie
tnam
EU
10
Sout
h A
fric
a
Chi
na
Res
t o
f OE
CD
Res
t o
f Sub
-Sah
aran
Afr
ica
Mid
dle
Eas
t an
d N
ort
h A
fric
a
Mex
ico
Cen
tral
Am
eric
an a
nd C
arib
bea
n
Res
t o
f So
uth
Asi
a
Res
t o
f Lat
in A
mer
ica
Ban
gla
des
h
Eas
t A
fric
a
EU
15
Bra
zil
Ind
ia
Arg
entin
a
Jap
an
USA
Rus
sia
and
FSU
Figure 2.6. Exports as a Share of Output(PERCENT)
Source: Calculated from the 2001 multiregional Social Accounting Matrix estimated by the modeler from GTAP database Version 6.0. Betina V.Dimaranan and Robert A. McDougall, eds., Global Trade, Assistance, and Production: The GTAP 6 Data Base (West Lafayette, Ind.: Center forGlobal Trade Analysis, Purdue University, 2006).

was also modeled as a reference point. Themain scenarios are described below and addi-tional details are provided in table 2.4.
In all the scenarios, reductions in tariffs andother forms of border protection are made fromapplied, rather than bound, rates.9 Appliedrates are the tariffs that are actually charged bycountries, while bound rates are the maximumtariffs that may be charged by a country underits WTO commitments. Negotiations on tariffreductions at the WTO usually take the form ofagreements to reduce bound tariffs. We choseto model reductions from applied rather thanbound rates for two reasons. First, and mostimportant, we wanted to capture the impact ofactual changes in tariffs on production, trade,demand for labor, and other economic meas-ures. Reductions in bound tariffs may notproduce any reduction in applied tariffs if thegap between bound and applied is large. Wewanted to use the model to simulate theimpact on the real world economy of realchanges in trade policies.
Second, a number of other models use scenariosthat take reductions from bound tariffs, oftenusing the bands or thresholds for different levelsof reductions that have been proposed in pastnegotiating sessions. This is a useful exercise,but there was no particular value in repeating ithere. In addition, the precision of using very spe-cific thresholds coupled with specific levels oftariff reductions within each band, or particularcoefficients for the size of cuts, means that thesescenarios quickly lose relevance if other bandsare proposed or agreed to in the negotiations.By contrast, the method we chose, reductions toapplied tariffs, can be thought of as an end pointthat would be achieved by any of various for-mulas of reductions in bound rates. When newproposals are made, their proponents (andothers) often calculate the resulting impact onapplied tariffs, which can be used for comparisonwith our scenarios.
The same approach was taken to reductions ofsubsidies and domestic support, which werereduced from applied rather than boundrates.10
The central Doha scenario that we constructedentails an ambitious expansion of market accessfor manufactured goods (50 percent reductionsin applied tariffs and other border protection bydeveloped countries and 33 percent reductionsby developing countries); a modestly ambitiousexpansion of market access for agriculturalproducts (36 percent reductions in appliedtariffs and other border protection by devel-oped countries and 24 percent reductions bydeveloping countries); reductions of domesticsubsidies for agricultural products by one-thirdby all countries except LDCs; and the elimina-tion of agricultural export subsidies by all coun-tries except LDCs. The scenario does notinclude market access liberalization by theLDCs, in line with agreements already made inthe Doha Round.11
The scenario was constructed separately foragricultural measures (scenario 1) and manufac-turing measures (scenario 2) and then cumu-lated (scenario 3). The results are sometimespresented for the separate components, todraw attention to the contribution of that sectorfor each country or group of countries. It shouldbe noted that the combined results for theoverall scenario differ slightly from the sum ofthe two sectoral scenarios. Because of the pres-ence of initial unemployment in unskilled labormarkets, if the overall scenario generates ahigher level of demand for either agricultural orunskilled labor or both, it may generate furtherincreases in total production and wage incomedue to general equilibrium effects.
We then varied different elements of thiscentral scenario to simulate other plausible out-comes of the Doha Round. First, we alloweddeveloping countries to exclude an unlimited
Carnegie Endowment for International Peace 17
18 Winners and Losers: Impact of the Doha Round on Developing Countries
Tab
le 2
.4.
Sce
nar
ios
Mod
eled
(4
)C
entr
al D
oha
Sc
enar
io w
ith
(8)
"Sp
ecia
l Sc
enar
io w
ith
(1)
(2)
(3)
Pro
duc
ts"
for
(5)
(6)
(7)
Lim
ited
Ag
ricu
ltur
e (9
) D
oha
Sce
nari
o f
or
Do
ha S
cena
rio
fo
r C
entr
al D
oha
D
evel
op
ing
M
od
est
Scen
ario
H
ong
Ko
ng
Lim
ited
Sce
nari
o
and
Am
bit
ious
Fu
ll P
olic
y M
easu
reA
gri
cult
ure
Man
ufac
ture
sSc
enar
ioC
oun
trie
sfo
r M
anuf
actu
res
Scen
ario
for
Ag
ricu
ltur
eM
anuf
actu
ring
Lib
eral
izat
ion
Red
ucti
on
in A
pp
lied
Tar
iffs
and
Oth
er B
ord
er P
rote
ctio
n (A
VE
s)a
Ag
ricul
tura
l pro
duc
tsD
evel
op
ed c
oun
trie
sR
educ
ed b
y 36
%N
o c
hang
eR
educ
ed b
y 36
%R
educ
ed b
y 36
%N
o c
hang
eR
educ
ed b
y 36
%R
educ
ed b
y 25
%R
educ
ed b
y 25
%R
educ
ed t
o z
ero
Dev
elo
pin
g c
oun
trie
sR
educ
ed b
y 24
%N
o c
hang
eR
educ
ed b
y 24
%N
o c
hang
eN
o c
hang
eR
educ
ed b
y 24
%R
educ
ed b
y 15
%R
educ
ed b
y 15
%R
educ
ed t
o z
ero
Man
ufac
ture
d p
rod
ucts
Dev
elo
ped
co
untr
ies
No
cha
nge
Red
uced
by
50%
Red
uced
by
50%
Red
uced
by
50%
Red
uced
by
36%
Red
uced
by
36%
No
cha
nge
Red
uced
by
50%
Red
uced
to
zer
oD
evel
op
ing
co
untr
ies
No
cha
nge
Red
uced
by
33%
Red
uced
by
33%
Red
uced
by
33%
Red
uced
by
24%
Red
uced
by
24%
No
cha
nge
Red
uced
by
33%
Red
uced
to
zer
o
Exp
ort
sub
sid
ies
Dev
elo
ped
co
untr
ies
Elim
inat
edN
o c
hang
eE
limin
ated
Elim
inat
edN
o c
hang
eE
limin
ated
Elim
inat
edE
limin
ated
Elim
inat
edD
evel
op
ing
co
untr
ies
Elim
inat
edN
o c
hang
eE
limin
ated
Elim
inat
edN
o c
hang
eE
limin
ated
Elim
inat
edE
limin
ated
Elim
inat
ed
Do
mes
tic
sup
po
rtD
evel
op
ed c
oun
trie
sR
educ
ed b
y 1/
3N
o c
hang
eR
educ
ed b
y 1/
3R
educ
ed b
y 1/
3N
o c
hang
eR
educ
ed b
y 1/
3R
educ
ed b
y 25
%R
educ
ed b
y 25
%E
limin
ated
Dev
elo
pin
g c
oun
trie
sR
educ
ed b
y 1/
3N
o c
hang
eR
educ
ed b
y 1/
3N
o c
hang
eN
o c
hang
eR
educ
ed b
y 1/
3R
educ
ed b
y 15
%R
educ
ed b
y 15
%E
limin
ated
Spec
ial t
reat
men
tb
Leas
t D
evel
op
ed C
oun
trie
s d
o n
ot
mak
e re
duc
tions
in s
cena
rios
1–8
No
ne
a. T
rad
e-w
eig
hted
ad
val
ore
m e
qui
vale
nt (A
VE
) pro
tect
ion.
An
ad v
alo
rem
eq
uiva
lent
is a
co
nver
sio
n o
f a s
pec
ific
tarif
f (a
spec
ific
amo
unt
per
uni
t tr
aded
) int
o a
n ad
val
ore
m t
ariff
(a p
erce
ntag
e o
f the
val
ue o
f the
go
od
) with
an
equi
vale
nt v
alue
.b
. Bec
ause
of a
gg
reg
atio
n, s
pec
ial t
reat
men
t fo
r le
ast
dev
elo
ped
co
untr
ies
in t
he m
od
el a
pp
lies
to t
he fo
llow
ing
co
untr
ies
or
reg
ions
: Ban
gla
des
h, E
ast
Afr
ica,
and
the
res
t o
f Sub
-Sah
aran
Afr
ica.

Carnegie Endowment for International Peace 19
number of agricultural products from marketliberalization measures (scenario 4). Thepurpose of this scenario was to test the impactof two agreements already reached in theround. The first, included in the July 2004Framework Agreement, was that “developingcountry Members will have the flexibility to des-ignate an appropriate number of products asSpecial Products, based on criteria of foodsecurity, livelihood security and rural develop-ment needs.” The second agreement, whichoriginated in that framework and was furtherelaborated in the Declaration adopted at theHong Kong ministerial in December 2005,allows developing country members recourseto a “Special Safeguard Mechanism” to tem-porarily protect agricultural products faced witha surge in the volume of imports or lowerimport prices that threaten domesticproducers.12 The scenario we modeled simu-lates an outer bound of any agreement thatmight be reached under this framework, in thatit represents the extreme case in which devel-oping countries effectively shelter all their agri-cultural products.
The second variation entails a less ambitiousexpansion in market access for manufacturedproducts only (scenario 5). As already noted,the central scenario was quite ambitious withregard to manufacturing trade liberalization,incorporating 50 percent reductions in appliedtariffs and other border protection by devel-oped countries and a 33 percent reduction bydeveloping countries. Scenario 5 simulates theimpact of more modest liberalization in thatsector, with 36 percent reductions by developedcountries and 24 percent by developing coun-tries. It is analogous to scenario 2, in that itincludes only manufactured products.
The Hong Kong Declaration instructed negotia-tors “to ensure that there is a comparably highlevel of ambition in market access forAgriculture and NAMA (nonagricultural market
access).”13 Therefore, we then cumulated themodest manufacturing liberalization scenariowith our central Doha agricultural scenario (sce-nario 1) to create an alternate overall scenarioin which tariffs and other border protection forboth agricultural and manufactured goods arereduced by 36 percent by developed countriesand 24 percent by developing countries, withno reductions by LDCs. Agricultural domesticsupport is reduced by one-third by all but theLDCs and all agricultural export subsidies areeliminated, as agreed to in Hong Kong. Wename this the “Hong Kong scenario” (scenario6). As always, these reductions are taken fromapplied rates. In the case of agriculture, thislevel of liberalization is a reasonable approxi-mation of the impact of actual proposals thathave been tabled in the Doha Round, mostnotably that of the EU. This scenario takes upthe Hong Kong mandate for a comparable levelof ambition in manufactures, to produce a simu-lation that approximates the current state of thenegotiations.
Finally, we constructed a scenario that signifi-cantly scales back the level of ambition in agri-culture to reflect the lower bound of proposalscurrently tabled in the Doha Round (scenario 7).In this scenario, both applied agriculturalborder protection and domestic subsidies arereduced by 25 percent by developed countriesand 15 percent by developing countries, withno reductions by LDCs. This can be taken as arough approximation of the end point ofmarket access expansion if countries areallowed to designate a significant percentageof agricultural tariff lines as “sensitive products”that would be subject to lesser liberalization.For example, the EU currently proposes toexempt 8 percent of agricultural tariff linesunder this rubric. In scenario 8, this scenario iscombined with the ambitious liberalization ofthe manufactures sector in scenario 2.
Full trade liberalization is designated scenario 9.

We did not model the liberalization of theservice sectors for two reasons. First, most bar-riers to trade in services arise from complex andinteracting regulations in the host country thatcannot be easily reduced to a numerical formula,as is done for tariffs and domestic subsidies.Second, the structure of negotiations over serv-ices in the WTO is quite different from othernegotiations, with countries making offers thatother individual countries may accept and recip-rocate, or refuse, resulting in a series of bilateraldeals. By contrast, other sectors are negotiatedon a multilateral basis, with all parties (or all simi-larly situated parties) making the same changesin trade rules. Because of this bilateral characterof services talks and the lack of reliable data to
quantify the resulting multiplicity of trade policychanges that could occur, it is difficult to modelservice liberalization with any reliability. Althoughwe did not model changes in barriers to trade inservices, all service sectors are included in themodel and experience indirect effects from liber-alization in other sectors.
The simulations were conducted on a compara-tive static basis; that is, the baseline equilibriumin the model was compared with the final equi-librium after the specified trade policy changesin each scenario were made. This approach cap-tures changes in prices, production, trade, andoverall income that are induced by the policychange.14
20 Winners and Losers: Impact of the Doha Round on Developing Countries

The trade scenarios that weremodeled, simulating a range ofplausible outcomes of the DohaRound, generate income gains atthe global level that are positive
but quite modest. Depending on the level ofambition in the scenario, the one-time gains forthe global economy range from $40 to $60billion, an increase of about 0.2 percent (one-fifth of 1 percent) of current global grossdomestic product (GDP).
These overall gains would have quite differenteconomic effects for different countries andregions. There are both net winners and netlosers, as well as sectoral winners and losers,under different scenarios. The varied impacts ofthese potential trade policy changes provideimportant insights into the interests and con-cerns of different countries as the global traderegime is renegotiated.
In this chapter, we first present the main results ofthe modeled scenarios for the global economy asa whole. Following that, we show the distributionof gains or losses by sector for developed anddeveloping countries as groups. We then tracesectoral and overall results for each developingcountry or region on a disaggregated basis.Next, we present the main effects experiencedby each developed country or region. We thendiscuss the income gains as a percentage ofcurrent GDP for each country or region.
We then turn to the underlying changes thataccount for these effects. We present changesin world prices, terms of trade, and net tradepatterns, followed by changes in factor returnsand employment of agricultural and unskilledlabor. We then show the adjustments that occurin production structures in each country orregion and the redistribution of value addedbetween countries. In the final section of thechapter, we briefly discuss the adjustment costsof the changes induced by trade policy.
Global Results
The results from the trade liberalization sce-narios for the global economy as a whole arepresented in table 3.1. The measure used is thechange in real income.15 In the first column, thechange is presented in 2001 dollars, and thesecond column gives the percentage changefrom the base year global GDP.
The first scenario represents moderate liberal-ization in agricultural trade, while the secondscenario represents ambitious liberalization oftrade in manufactured goods. These scenariosare labeled the Doha scenario for agricultureand Doha scenario for manufactures. The dataindicate that the gains from these plausible lib-eralization scenarios would come overwhelm-ingly from manufacturing trade. This isunsurprising, for several reasons. Most obvious,perhaps, is that the manufacturing scenario is
Carnegie Endowment for International Peace 21
C H A P T E R 3
The Results of Doha Round Trade Simulations

more ambitious. More fundamentally, the valueof current global agricultural trade is $783billion, while current manufacturing tradeamounts to $6.57 trillion, or 89 percent of com-bined global trade in agricultural and manufac-tured goods.16 The third scenario combines thegains from liberalization under the first andsecond scenarios. This scenario is referred to asthe central Doha scenario (or scenario 3).
The fourth scenario represents a variation onthe central Doha scenario in which developingcountries are allowed to forgo the liberalizationof their own agricultural sectors (referred to asthe central scenario with special products fordeveloping countries). As discussed in chapter2 above, this scenario is meant to test theimpact of interim agreements and proposals forthe special and differential treatment of devel-oping countries’ agricultural sectors, in recogni-tion of the livelihood, food security, and ruraldevelopment concerns in this sector. The sce-nario models an extreme version of thatapproach, in which developing countries makeno reductions at all in tariffs or domesticsupport. This contrasts with the proposal of theG-33 group of developing countries, a mainproponent of special and differential treatmentfor developing country agriculture, which pro-poses that 20 percent of agricultural tariff linesbe exempted from full liberalization for devel-oping countries.17 The result indicates that, atthe global level, income gains are reduced onlyslightly compared with the scenario in which
developing countries reduce tariffs by two-thirds as much as developed countries. Similarresults appear for both developed countries asa group and developing countries as a group,as well as at disaggregated country and regionlevels (these results are discussed below).
The next scenario (scenario 5) is a further varia-tion on the central scenario. In this scenario,market access for manufactured goods isincreased more modestly, to the same degreeas for agricultural goods. It is then combinedwith scenario 1 to form scenario 6, whichapproximates the agreement in Hong Kong inDecember 2005 that negotiators shouldachieve a comparable level of ambition inmarket access liberalization for agriculture andnonagricultural goods (the latter include manu-factures and other nonagricultural productssuch as minerals). Overall global gains areabout 26 percent lower if manufacturing liber-alization goals are scaled back to the samelevel as agricultural liberalization.
The following scenario (scenario 7) representsmore modest cuts in agricultural tariffs and sub-sidies. In scenario 8, it is combined with thehigh level of ambition in manufacturing marketaccess of the central scenario. It is interesting tonote that global gains still amount to more than95 percent of those under more ambitious agri-cultural liberalization. This is a function of therelatively small weight of agriculture in globaltrade and its relatively small contribution to the
22 Winners and Losers: Impact of the Doha Round on Developing Countries
Table 3.1. Global Real Income Gains from Trade Scenarios
Scenarios Gain (billions of dollars) Gain over Base Year GDP (percent)
(1) Doha Scenario for Agriculture 5.4 0.02(2) Doha Scenario for Manufactures 53.1 0.17(3) Central Doha Scenario 58.6 0.19(4) Central Doha Scenario with "Special Products" for Developing Countries 57.7 0.18(5) Modest Scenario for Manufactures 38.1 0.12(6) Hong Kong Scenario 43.4 0.14(7) Limited Scenario for Agriculture 2.9 0.009(8) Scenario with Limited Agriculture and Ambitious Manufacturing 56.0 0.18(9) Full Liberalization 168.1 0.53

overall gains that can be realized from furthertrade liberalization.
The results of scenarios 6 and 8 indicate thatthe manufacturing sector is indeed the sourceof major global gains. Reducing market accessliberalization for agriculture by about one-thirdreduces overall global gains by only 4 percent.By contrast, a somewhat smaller reduction inmarket access liberalization for manufacturedgoods (about 28 percent) reduces overall globalgains by 26 percent, nearly the same amount.
The final scenario is full free trade.18 This is nota realistic outcome for the Doha Round.Indeed, nothing even close to this level ofambition has been proposed by any party.However, it is a useful reference point toestablish the magnitude of gains that could beachieved if all tariffs and subsidies werereduced to zero and all other barriers to tradewere abolished. This measure is particularlyuseful in comparing the results of differentmodels, because most modelers include a fullliberalization scenario while other scenariosdiffer considerably among models and areharder to compare. This topic is exploredfurther in chapter 4.
The gains to the global economy in terms ofpercentage change are quite small. All theplausible Doha scenarios produce global gainsof less than 0.2 percent of the global economy.Even full trade liberalization produces a globalincome gain of only about 0.5 percent. Thisresult is consistent with findings from mostother models, discussed in chapter 4.
The Distribution of Gains betweenDeveloped and Developing Countries
The modest overall gains are distributed rela-tively evenly between developed and devel-oping countries, as seen in figure 3.1. However,the distribution at the sectoral level is quite dif-ferent between developed and developingcountries. Figure 3.2 presents the income gainsor losses for each group of countries from sepa-rate liberalization scenarios for agricultural andmanufacturing sectors.
Developed countries receive all the gains fromagricultural liberalization. Their gains arise
Carnegie Endowment for International Peace 23
0
5
01
51
02
52
03
53
a
b
28.5
21.9
30.1
21.5
Central Doha scenarioHong Kong scenario
Developing countriesDeveloped countries
Figure 3.1. Global Distribution of Gains underCentral Doha and Hong Kong Scenarios(CHANGE IN REAL INCOME, BILLIONS OF DOLLARS)
a. Scenario 3. See Table 2.4.b. Scenario 6.
-5
0
5
10
15
20
25
30
35
ManufacturesbAgriculturea
DevelopedCountries
5.5
DevelopedCountries
23.0
DevelopingCountries
30.2
DevelopingCountries
-63million
Figure 3.2. Gains (Losses) for Developed andDeveloping Countries under Doha Scenarios forAgriculture and Manufactures(CHANGE IN REAL INCOME, BILLIONS OF DOLLARS)
a. Scenario 1. b. Scenario 2.
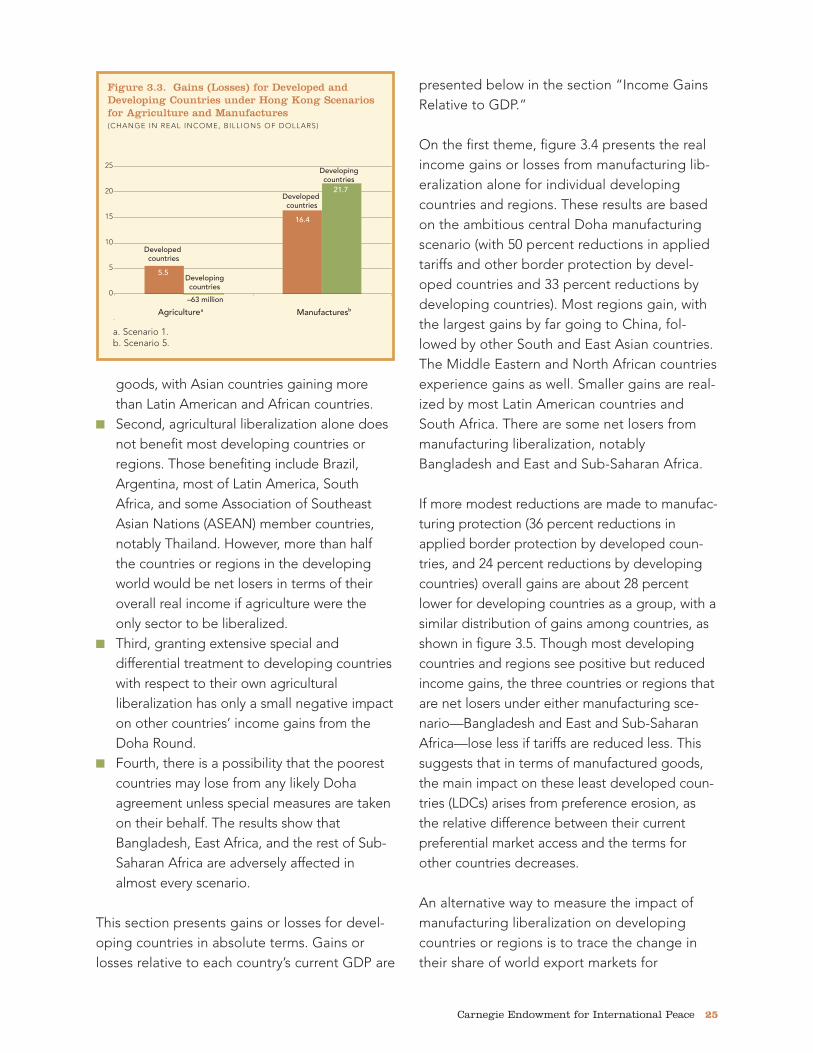
from two main sources. First, many developedcountries protect their agricultural sectorsextensively, through tariffs, subsidies, andother measures. This protection is inefficientfor those economies. The elimination of thedistorting measures leads to better use ofresources and efficiency gains to the overalleconomies. Second, some developed coun-tries are very efficient producers of agriculturalcommodities, even without domestic protec-tion and subsidies, and would gain globalmarket share in agriculture if other countriesopened their markets.
As a group, developing countries lose slightlyfrom agricultural trade liberalization.19 There isgreat heterogeneity among the results for dif-ferent developing countries, discussed below.Numerous factors contribute to the overallresult. They include the fact that developingcountries cannot afford inefficient subsidies fortheir farmers to the extent employed bywealthier countries, and therefore they do notemploy such subsidies on comparable scales.Thus, rules that reduce these subsidies do notincrease efficiency in developing countries asextensively as they do in the United States, theEuropean Union (EU), and Japan.
Second, many agricultural products of developingcountries are not competitive in global markets.Some developing countries would suffer from theloss of the preferential market access terms thatthey now enjoy in developed country marketsbecause their margin of preference would beeroded by a general lowering of tariffs and theywould lose market share to more competitive pro-ducers. Some countries would lose current sharesof their own domestic markets to more efficientlyproduced imports if they lower tariffs, potentiallycreating more unemployment and an economythat is worse off overall. This is particularly likely iflow-productivity subsistence agriculture is a majorcomponent of overall economic activity in acountry, a point discussed further below.
Third, many developing countries are netimporters of agricultural and food products. Ifreductions in global agricultural production andexport subsidies lead to an increase in worldprices, as expected in the short and mediumterm, they will pay more for their imports.
These results run counter to a commonly heldview about the Doha Round, namely, that agri-cultural liberalization benefits developing coun-tries and therefore is key to achieving thedevelopment goals of the round. In fact, agri-cultural liberalization benefits only a relativelysmall subset of developing countries. Theactual distribution of gains and losses is dis-cussed below.
By contrast, developing countries as a groupgain substantially from the liberalization of man-ufactured goods. This is partly attributable to amore ambitious scenario for manufacturing thanfor agricultural liberalization in the central Dohascenario. However, the alternative scenario thatincludes comparably ambitious market accessliberalization for both sectors also showsmarkedly greater gains for developing countriesfrom manufacturing than from agricultural liber-alization (figure 3.3). Under this balanced sce-nario, developed and developing countries gainabout equally overall, but with different contri-butions from agriculture and manufactures.
The Results for Developing Countries
As noted above, the results for the globaleconomy and for developing countries as agroup mask the wide differences in outcomesfor individual developing countries and regions.Disaggregated results demonstrate the extentof heterogeneity among them. Four mainthemes emerge:
■ First, most developing countries gain fromthe liberalization of trade in manufactured
24 Winners and Losers: Impact of the Doha Round on Developing Countries

goods, with Asian countries gaining morethan Latin American and African countries.
■ Second, agricultural liberalization alone doesnot benefit most developing countries orregions. Those benefiting include Brazil,Argentina, most of Latin America, SouthAfrica, and some Association of SoutheastAsian Nations (ASEAN) member countries,notably Thailand. However, more than halfthe countries or regions in the developingworld would be net losers in terms of theiroverall real income if agriculture were theonly sector to be liberalized.
■ Third, granting extensive special anddifferential treatment to developing countrieswith respect to their own agriculturalliberalization has only a small negative impacton other countries’ income gains from theDoha Round.
■ Fourth, there is a possibility that the poorestcountries may lose from any likely Dohaagreement unless special measures are takenon their behalf. The results show thatBangladesh, East Africa, and the rest of Sub-Saharan Africa are adversely affected inalmost every scenario.
This section presents gains or losses for devel-oping countries in absolute terms. Gains orlosses relative to each country’s current GDP are
presented below in the section “Income GainsRelative to GDP.”
On the first theme, figure 3.4 presents the realincome gains or losses from manufacturing lib-eralization alone for individual developingcountries and regions. These results are basedon the ambitious central Doha manufacturingscenario (with 50 percent reductions in appliedtariffs and other border protection by devel-oped countries and 33 percent reductions bydeveloping countries). Most regions gain, withthe largest gains by far going to China, fol-lowed by other South and East Asian countries.The Middle Eastern and North African countriesexperience gains as well. Smaller gains are real-ized by most Latin American countries andSouth Africa. There are some net losers frommanufacturing liberalization, notablyBangladesh and East and Sub-Saharan Africa.
If more modest reductions are made to manufac-turing protection (36 percent reductions inapplied border protection by developed coun-tries, and 24 percent reductions by developingcountries) overall gains are about 28 percentlower for developing countries as a group, with asimilar distribution of gains among countries, asshown in figure 3.5. Though most developingcountries and regions see positive but reducedincome gains, the three countries or regions thatare net losers under either manufacturing sce-nario—Bangladesh and East and Sub-SaharanAfrica—lose less if tariffs are reduced less. Thissuggests that in terms of manufactured goods,the main impact on these least developed coun-tries (LDCs) arises from preference erosion, asthe relative difference between their currentpreferential market access and the terms forother countries decreases.
An alternative way to measure the impact ofmanufacturing liberalization on developingcountries or regions is to trace the change intheir share of world export markets for
Carnegie Endowment for International Peace 25
0
5
01
51
02
52
5.5
16.4
21.7
Developed countries
Developed countries
Developingcountries
Developingcountries
–63 million
ManufacturesAgriculturea b
Figure 3.3. Gains (Losses) for Developed andDeveloping Countries under Hong Kong Scenariosfor Agriculture and Manufactures(CHANGE IN REAL INCOME, BILLIONS OF DOLLARS)
a. Scenario 1. b. Scenario 5.

26 Winners and Losers: Impact of the Doha Round on Developing Countries
.6 01
.3 2.8 1 7.1
.4 1862
noillim182
noillim
446noillim
207noillim
828noillim 842
noillim722
noillim412
noillim72-
noillim23-
noillim48-
noillim
0
2
4
6
8
01
21
Chi
na
Ind
ia
Vie
tnam
Res
t of
ASE
AN
Mid
dle
Eas
t an
dN
orth
Afr
ica
Bra
zil
Cen
tral
Am
eric
aan
d C
arib
bea
n
Ind
ones
ia
Sout
h A
fric
a
Res
t of
Sou
th A
sia
Arg
enti
na
Mex
ico
Res
t of
Lati
n A
mer
ica
Eas
t Afr
ica
Ban
gla
des
h
Res
t of
Sub
-Sa
hara
n A
fric
a
Figure 3.5. Manufacturing Liberalization: Developing Country Winners and Losers under Modest Scenario forManufacturesa
(CHANGE IN REAL INCOME, BILLIONS OF DOLLARS)
a. Scenario 5.
-2
0
2
4
6
8
10
12
14
16
Res
t of
Sub
-Sa
hara
n A
fric
a
Ban
gla
des
h
Eas
t A
fric
a
Res
t of
Lat
in A
mer
ica
Mex
ico
Arg
enti
na
Sout
h A
fric
a
Res
t of
Sou
th A
sia
Ind
ones
ia
Cen
tral
Am
eric
a a
nd C
arib
bea
n
Bra
zil
Res
t of
ASE
AN
Vie
tnam
Ind
ia
Chi
na14.8
3.12.6
2.41.9
1.1 1.0900
million 340million
369million
336million
264million
242million -35
million-40
million-122
million0
2
4
6
8
10
12
14
16
Mid
dle
Eas
t an
dN
orth
Afr
ica
Figure 3.4. Manufacturing Liberalization: Developing Country Winners and Losers under Doha Scenario forManufacturesa
(CHANGE IN REAL INCOME, BILLIONS OF DOLLARS)
a. Scenario 2.

manufactured goods. Figure 3.6 presents thechange in each country’s share of the worldmarket for manufactures under the Hong Kongscenario.29 Again, China is the big winner. Itshould be noted that although the changes inmarket share seem small (less than 0.4 percent,in China’s case), these are percentages of thehuge world market for manufactures, which cur-rently amounts to $6.57 trillion. The increase inChina’s share would be worth about $22 billion.India and Vietnam also experience gains inworld market share, although much less thanthose of China. Smaller gains for some productsbut losses for others accrue to Central Americaand the Caribbean, the Middle East and NorthAfrica, other ASEAN members, Indonesia, andthe rest of South Asia. Mexico experiences thelargest losses in market share, reflecting theerosion of its current advantages in access tothe U.S. market under the North American FreeTrade Agreement. Sub-Saharan Africa loses
world market share in some or all manufacturedproducts.
Overall gains or losses of world export marketshare under the Hong Kong scenario are pre-sented in figure 3.7.
The second main finding for developing coun-tries, that agricultural liberalization alone bene-fits only a minority of them, is illustrated infigure 3.8. Most developing countries andregions do not benefit from agricultural liberal-ization in terms of overall real income, and theeffects are highly differentiated.21 Argentina,Brazil, and some ASEAN countries, notablyThailand, are the main winners. It is noteworthythat even for these competitive agriculturalexporters, the gains are small. Gains from man-ufacturing liberalization (figures 3.4 and 3.5)were measured in billions of dollars, while thehighest gains from agricultural liberalization
Carnegie Endowment for International Peace 27
3.0-
2.0-
1.0-
0
1.0
2.0
3.0
4.0
Chi
na
Ind
ia
Vie
tnam
Mid
dle
Eas
t an
d N
ort
h A
fric
a
Cen
tral
Am
eric
aan
d C
arib
bea
n
Res
t o
f So
uth
Asi
a
Res
t o
f ASE
AN
Ind
one
sia
Ban
gla
des
h
Arg
entin
a
Res
t o
f La
tin A
mer
ica
Eas
t A
fric
a
Bra
zil
Sout
h A
fric
a
Res
t o
f Sub
-Sa
hara
n A
fric
a
Mex
ico
Capital intensiveIntermediatesLabor-intensive and other manufactures
Figure 3.6. Gains (Losses) of World Export Market Share for Developing Countries’ Manufactures Exportsunder Hong Kong Scenario, by sub-sectora
(CHANGE IN PERCENTAGE OF WORLD EXPORT MARKET)
a. Scenario 6.
28 Winners and Losers: Impact of the Doha Round on Developing Countries
50 0-
0
50 0.
1 0.
51 0.
2 0.
52. 0
3 0.
53 0.C
hina
Ind
ia
Viet
nam
Mid
dle
Eas
t an
dN
ort
h A
fric
a
Cen
tral
Am
eric
a an
dC
arib
bea
n
Res
t o
f So
uth
Asi
a
Res
t o
f ASE
AN
Ind
one
sia
Ban
gla
des
h
Arg
entin
a
Res
t o
f Lat
inA
mer
ica
Eas
t Afr
ica
Bra
zil
Sout
h A
fric
a
Res
t o
f Sub
-Sah
aran
Afr
ica
Mex
ico
Figure 3.7. Gains (Losses) of World Export Market Share for Developing Countries’ Manufactures Exportsunder Hong Kong Scenarioa
(CHANGE IN PERCENTAGE OF WORLD EXPORT MARKET)
-300
-200
-100
0
100
200
300
400
-294
-157
307
-42-22
9
-14
-178
57
141
-110-106
251
-165
358
18
Arg
entin
a
Res
t o
f ASE
AN
Bra
zil
Res
t o
fLa
tin A
mer
ica
Sout
h A
fric
a
Cen
tral
Am
eric
aan
d C
arib
bea
n
Ind
one
sia
Res
t o
f So
uth
Asi
a
Ban
gla
des
h
Ind
ia
Res
t o
f Sub
-Sa
hara
n A
fric
a
Eas
t A
fric
a
Vie
tnam
Mex
ico
Mid
dle
Eas
tan
d N
ort
h A
fric
a
Chi
na
Figure 3.8. Agricultural Liberalization: Developing Country Winners and Losers under Doha Scenario forAgriculturea
(CHANGE IN REAL INCOME, MILLIONS OF DOLLARS)
a. Scenario 6.
a. Scenario 1.

amount to only $358 million (for Argentina).Most of Latin America and South Africa benefit,although on a very small scale.
More than half of the countries or regions in thedeveloping world would be net losers in termsof their overall real income if agriculture werethe only sector to be liberalized, although thelosses, like the gains, are relatively small. Thelosers include many of the world’s LDCs,including Bangladesh and the countries of EastAfrica and the rest of Sub-Saharan Africa. TheMiddle East and North Africa, Vietnam, andMexico experience losses, which partly offsetthe gains they enjoy under the liberalization ofthe manufacturing sector. India also is a netloser, on a very small scale.
China comes out as the biggest single loserfrom agriculture-only liberalization. China hasalready agreed to substantial agriculture sectorliberalization under its World TradeOrganization (WTO) accession agreement, andit is expected to experience employment lossesfrom those measures. The model demonstratesthat further liberalization of the sector in theDoha Round would inflict additional losses onChina. Although China’s losses are greater inabsolute terms than those of other countries, asa percentage of Chinese GDP the losses aresmall.
As with manufacturing liberalization, we alsotested a scenario in which more modest reduc-tions are made to tariffs, subsidies, and otherprotection for agricultural products (scenario 7).Under this scenario, developed countriesreduce border protection and domestic supportby 25 percent while developing countries makereductions of 15 percent in these types of pro-tection. Both eliminate export subsidies. LDCsmake no changes. The results, presented infigure 3.9, indicate that several developingcountries or regions gain more (or lose less) interms of overall real income under the more
modest agricultural scenario. India moves frombeing a net loser to a net winner (although on avery small scale), while Vietnam, Bangladesh,the rest of South Asia, East Africa, and Mexicoremain losers but lose less. However, otherdeveloping countries fare less well under themore modest scenario. China, the Middle East,North Africa, and the rest of Sub-Saharan Africaface slightly larger losses, while Indonesia andthe rest of ASEAN, South Africa, Brazil,Argentina, and the rest of South America expe-rience smaller gains. Central America and theCaribbean shift from very small gains to verysmall losses.
Figure 3.10 presents changes in world exportmarket share for agricultural products under theHong Kong scenario. The overall pattern issomewhat similar to the pattern of real incomegains and losses, but significant variationsemerge that reflect the relative weight and effi-ciency of agriculture in different developingeconomies. Brazil dramatically outstrips otherLatin American and ASEAN countries in termsof increased overall market share, a reflection ofits size and the fact that many of its agriculturalproducts are globally competitive. However,Brazil loses market share in labor-intensiveproducts. Market share in some or all productsis lost by East African and other Sub-SaharanAfrican countries, Indonesia, and Bangladesh.This is particularly noteworthy because manycommentators have based calls for progress onagricultural liberalization in the Doha Round onthe supposed benefits it would bring to low-income African countries.
Other studies have shown that losses for someof these countries arise from the erosion ofpreferences they currently enjoy in wealthycountry markets, particularly those of the EU.22
However, a more fundamental problem is thestructure of the agricultural sector in manydeveloping countries, where low-productivity,small-scale subsistence farming makes up a
Carnegie Endowment for International Peace 29
30 Winners and Losers: Impact of the Doha Round on Developing Countries
4.0-
2.0-
0
2.0
4.0
6.0
8.0
1
erutlucirga evisnetni d-naLerutlucirga evisnetni r-obaL
erutlucirga dessecorP
Bra
zil
Res
t o
f ASE
AN
Res
t o
fLa
tin A
mer
ica
Arg
entin
a
Chi
na
Sout
h A
fric
a
Cen
tral
Am
eric
a a
nd C
arib
bea
n
Mex
ico
Ind
ia
Res
t o
f So
uth
Asi
a
Vie
tnam
Ban
gla
des
h
Mid
dle
Eas
t a
nd N
ort
h A
fric
a
Eas
t A
fric
a
Ind
one
sia
Res
t o
f Sub
-Sa
hara
n A
fric
a
b
Figure 3.10. Gains (Losses) of World Export Market Share for Developing Countries’ Agriculture Exportsunder Hong Kong Scenario, by sub-sectora
(CHANGE IN PERCENTAGE OF WORLD EXPORT MARKET)
a. Scenario 6.b. includes meat, dairy products, and sugar.
562
971 771
49
8554
3
8- 71- 52-
17- 47-
121-241-
922-
992-003-
002-
001-
0
001
002
003
Arg
entin
a
Bra
zil
Res
t o
f ASE
AN
Res
t o
f L
atin
Am
eric
a
Ind
ia
Sout
h A
fric
a
Ind
one
sia
Res
t o
f So
uth
Asi
a
Ban
gla
des
h
Cen
tral
Am
eric
a a
nd C
arib
bea
n
Vie
tnam
Eas
t A
fric
a
Res
t o
f Sub
-Sa
hara
n A
fric
a
Mex
ico
Mid
dle
Eas
t a
nd N
ort
h A
fric
a
Chi
na
Figure 3.9. Agricultural Liberalization: Developing Country Winners and Losers under Limited Scenario forAgriculturea
(CHANGE IN REAL INCOME, MILLIONS OF DOLLARS)
a. Scenario 7.

large portion of agricultural activity. The prod-ucts of such farms are generally not competitivein global markets, due to problems of scale,productivity, and access to export facilities.Some developing countries’ agricultural sectorsare so dominated by this type of low-productivity farming that they have few or noglobally competitive agricultural exports. This istrue of many LDCs and other low-income coun-tries. Other developing countries have someagricultural subsectors that are competitive onexport markets, while low-productivity, small-scale farming persists more broadly. The distri-bution of economic activity and employment inthe competitive and noncompetitive sectors willbe an important determinant of whether a par-ticular country gains or loses from agriculturalliberalization. For example, countries such asIndonesia and India might benefit from loweredbarriers abroad for certain products in whichthey can compete. However, lowering their owntrade barriers on crops cultivated by their small-scale farmers could lead to displacement ofthose crops by cheaper imports. If thesefarmers make up a significant share of theworking population, the net effect could benegative for the overall economy. As a result,such countries are concerned as much or morewith their defensive interests in global agricul-tural trade as with opening markets abroad fortheir competitive agricultural products.
The pervasiveness of small-scale farming inmany developing countries has led them todemand special consideration for their agricul-tural sectors in negotiations at the WTO. Theirconcerns have already produced agreementthat they will have the flexibility to designate anumber (still to be agreed) of agricultural prod-ucts as “special products” subject to less liber-alization, based on food security, livelihoodsecurity, and rural development concerns.23 Ithas also been agreed that they will haverecourse to a “special safeguard mechanism”that would allow them to restrict imports based
on volume surges or declining prices, withdetails yet to be negotiated.
To test the impact on other countries ofextending such special and differential treat-ment to the agricultural sectors of countries withthese concerns, we constructed scenario 4,which allows developing countries to shield agri-cultural products from liberalization. The sce-nario we modeled simulates an outer bound ofspecial and differential treatment. It representsthe extreme case in which developing countriesare permitted and choose to shelter all theiragricultural products.
The results of this scenario constitute the thirdmajor finding from the model with respect todeveloping countries. Special and differentialtreatment could be extended to their agricul-tural sectors with only minor reductions in othercountries’ income gains from the Doha Round,as seen in figure 3.11. A more limitedapproach—such as the G-33’s proposal that 20percent of agricultural tariff lines be excludedfrom liberalization by developing countries—could be expected to have even more modesteffects.
Several factors explain the minimal impact ofallowing special and differential treatment fordeveloping countries’ agricultural sectors. Withrespect to most developed countries, exportgains from trade liberalization are to beexpected in their most competitive sectors, typ-ically services and manufactures. For thosedeveloped countries that currently protect theiragricultural sectors, such as the United States,EU members, and Japan, agricultural liberaliza-tion offers gains primarily through the channelof their own increased efficiency in resourceallocation. Competitive agricultural exportersamong high-income countries, such as theUnited States, Canada, and Australia, are likelyto see gains primarily in the markets of otherhigh-income countries, particularly those that
Carnegie Endowment for International Peace 31

currently have high levels of protection, such asJapan and the EU members. For developingcountries, most gains from agricultural liberal-ization also arise from increased exports towealthy country markets and, to a much smallerdegree, from gains in resource allocation effi-ciency.
The results of simulations done by the WorldBank suggest a similar outcome. Under theBank’s central Doha scenario (World Bank sce-nario 7), increases in agriculture and foodexports from high-income countries go entirelyto other high-income countries.24 Their agricul-tural exports to developing countries do notincrease at all. For developing countries, morethan 75 percent of increased agriculturalexports go to high-income countries (see table4.3 in chapter 4).
Figure 3.12 gives disaggregated results forselected countries, including those that aremost competitive in world agricultural export
markets. The results indicate that any loss ofreal income gains is minor, even for the groupof countries that would be most affected.
India and Vietnam experience slightly greateroverall income gains under this scenario,despite allocative efficiency gains they mightsacrifice. Bangladesh and the East African coun-tries experience smaller losses. For most coun-tries, there is very little effect from allowingeven this extreme version of special and differ-ential treatment for developing countries’ agri-cultural sectors.
The fourth major finding with regard to devel-oping countries is the possibility that thepoorest countries may lose from any likely Dohascenario unless special measures are taken ontheir behalf. Figure 3.13 shows that Bangladesh,East Africa, and the rest of Sub-Saharan Africaare adversely affected in every Doha scenariomodeled, regardless of whether the level ofambition is modest or high.
32 Winners and Losers: Impact of the Doha Round on Developing Countries
0
5
01
51
02
52
03
53
seirtnuoc depoleveD seirtnuoc gnipoleveD
oiranecs ahoD lartneC
oiranecs ahoD lartneC''stcudorp laiceps'' htiwseirtnuoc gnipoleved rof
a
b
(97.7%of
centralDohagains)
(99.3%of
centralDohagains)
28.5 28.330.1 29.4
Figure 3.11. Impact of Flexibility for “Special Products” on Real Income Gains for Developed andDeveloping Countries(CHANGE IN REAL INCOME, BILLIONS OF DOLLARS)
a. Scenario 3. b. Scenario 4.

These results arise from several factors. In theagricultural sector, the most fundamental prob-lems are the concentration of livelihoods inlow-productivity agriculture, the lack of com-petitiveness on world export markets, and theerosion of existing preferences. In the manufac-turing sector, some LDCs have begun in recentyears to compete in low-skilled manufacturedproducts such as apparel. They have gainedsmall shares in world export markets, oftenbased on preferential access to high-incomecountry markets. They would face problems ina liberalized environment arising from competi-tion from more efficient producers. The solu-tion to these problems is complicated by thecurrent patchwork of preference programs thatfavor some low-income countries over othersimilarly situated countries. Possible solutionsare discussed in chapter 5.
The sectoral composition of real income gains(or losses) to developing countries under the
various sectoral scenarios are shown together infigure 3.14. It is noteworthy that even competi-tive agricultural exporters such as Brazil gainmore overall from manufacturing than fromagricultural liberalization. Only Argentina gainsmore from agricultural liberalization.
Total real income gains or losses from bothagriculture and manufacturing liberalizationunder the central Doha and Hong Kong sce-narios are presented in figure 3.15. Less ambi-tious manufacturing liberalization producessmaller gains for most developing countries,while producing smaller losses for the poorestcountries.
The Results for Developed Countries
Although the Carnegie model was constructedprimarily to assess the impact of Doha liberal-ization on developing countries, the model isglobal in scope and interesting results also
Carnegie Endowment for International Peace 33
0
1
2
3
4
5
6
7
8
9
Jap
an
EU
15
USA
Ind
ia
Res
t o
f OE
CD
Res
t o
f ASE
AN
Viet
nam
Bra
zil
Arg
entin
a
EU
10
Res
t o
f Lat
inA
mer
ica
Ban
gla
des
h
Eas
t Afr
ica
ahoD lartneCoiranecs
ahoD lartneChtiw oiranecs
''stcudorp laiceps''gnipoleved rof
seirtnuoc
a
b
Figure 3.12. Impact of Flexibility for “Special Products” on Real Income Gains for Selected Countries(CHANGE IN REAL INCOME, BILLIONS OF DOLLARS)
a. Scenario 3. b. Scenario 4.

emerge for the developed world. Selectedresults are presented here.
All developed countries and regions experiencepositive gains from each of the four overall Dohascenarios modeled, as shown in figure 3.16. Ineach case, the gains come mainly from the liber-alization of manufacturing rather than from theliberalization of agriculture, even taking intoaccount the efficiency gains the countries realizefrom the liberalization of their own agriculturalsectors (figure 3.17). The gains vary dependingon the extent of liberalization, although the levelof ambition makes more difference in the manu-facturing sector than in the agricultural sector forthese countries. As noted above, service liberal-ization was not modeled. Service sector liberal-ization could be expected to provide additionalgains to developed countries.
Figure 3.17 shows that U.S. real income gainsarise overwhelmingly from manufacturing liber-
alization rather than from agricultural liberaliza-tion. For the EU 15 (including the Western andCentral European members but not the ten newmembers that acceded in 2004) and Japan,manufacturing accounts for most of the gains,but agricultural liberalization contributes rela-tively more than in the case of the UnitedStates. This is attributable to the removal ofhigher levels of agricultural distortions andresulting gains in efficiency in the European andJapanese economies.
Changes in the share of world export marketsfor developed countries are shown in figures3.18 and 3.19. The patterns shown offer insightsinto the political economy of different coun-tries’ negotiating postures in the Doha Round.For the EU 15, expected losses in the worldagricultural market are offset by gains in thelarger world markets for capital-intensive andintermediate manufactures, which are highervalue-added products. The opposite is true for
34 Winners and Losers: Impact of the Doha Round on Developing Countries
003-
052-
002-
051-
001-
05-
0
acirfA narahaS-buS fo tseRacirfA tsaEhsedalgnaB
oiranecs ahoD lartneC
laiceps" htiw oiranecs ahoD lartneCseirtnuoc gnipoleved rof "stcudorp
dna erutlucirga detimil htiw oiranecSgnirutcafunam suoitibma
oiranecs gnoK gnoH
a
b
c
d
Figure 3.13. Poorest Countries Lose Income under All Doha Scenarios(CHANGE IN REAL INCOME, MILLIONS OF DOLLARS)
a. Scenario 3.b. Scenario 4.c. Scenario 8.d. Scenario 6.

Carnegie Endowment for International Peace 35
0
1
2
3
5
erutlucirga rof oiranecs ahoD
erutlucirga rof oiranecs detimiL
serutcafunam rof oiranecs ahoD
rof oiranecs tsedoMserutcafunam
c
5.41
5.01
5.51
d
b
a
Chi
na
Ind
ia
Res
t o
f ASE
AN
Vie
tnam
Mid
dle
Eas
t a
nd N
ort
h A
fric
a
Bra
zil
Cen
tral
Am
eric
a a
nd C
arib
bea
n
Ind
one
sia
Arg
entin
a
Sout
h A
fric
a
Res
t o
fLa
tin A
mer
ica
Res
t o
f So
uth
Asi
a
Mex
ico
Ban
gla
des
h
Eas
t A
fric
a
Res
t o
f Sub
-Sa
hara
n A
fric
a
Figure 3.14. Sectoral Composition of Real Income Gains for Developing Countries (CHANGE IN REAL INCOME, BILLIONS OF DOLLARS)
0
2
4
6
8
01
21
41
61
Chi
na
Ind
ia
Res
t o
f ASE
AN
Viet
nam
Mid
dle
Eas
t an
d N
ort
hA
fric
a
Bra
zil
Cen
tral
Am
eric
a an
dC
arib
bea
n
Ind
one
sia
Arg
entin
a
Sout
h A
fric
a
Res
t o
f Lat
in A
mer
ica
Res
t o
f So
uth
Asi
a
Mex
ico
Ban
gla
des
h
Eas
t Afr
ica
Res
t o
f Sub
-Sah
aran
Afr
ica
oiranecs ahoD lartneCoiranecs gnoK gnoH b
a
Figure 3.15. Real Income Gains (Losses) for Developing Countries under Overall Scenarios(CHANGE IN REAL INCOME, BILLIONS OF DOLLARS)
a. Scenario 1.b. Scenario 7.c. Scenario 2.d. Scenario 5.
a. Scenario 3.b. Scenario 6.

36 Winners and Losers: Impact of the Doha Round on Developing Countries
0
1
2
3
4
5
6
7
8
9
01 UEDCEO fo tseRsEIN naisAUSA51 UEnapaJ
oiranecs ahoD lartneC
oiranecs gnoK gnoHlaiceps" htiw oiranecs ahoD lartneC
seirtnuoc gnipoleved rof "stcudorp
dna erutlucirga detimil htiw oiranecSgnirutcafunam suoitibma
c
d
b
a
Figure 3.16. Real Income Gains for Developed Countries under Overall Scenarios(CHANGE IN REAL INCOME, BILLIONS OF DOLLARS)
0
1
2
3
4
5
6
7
01 UEDCEO fo tseRsEIN naisAnapaJ51 UEUSA
erutlucirga rof oiranecs ahoD
erutlucirga rof oiranecs detimiL
serutcafunam rof oiranecs ahoDserutcafunam rof oiranecs tsedoM
c
d
b
a
Figure 3.17. Sectoral Composition of Real Income Gains for Developed Countries(CHANGE IN REAL INCOME, BILLIONS OF DOLLARS)
a. Scenario 1.b. Scenario 7.c. Scenario 2.d. Scenario 5.
a. Scenario 3.b. Scenario 6.c. Scenario 4. d. Scenario 8.

Carnegie Endowment for International Peace 37
4-
3-
2-
1-
0
1
2
3
4
51
UEsEIN naisAnapaJ01 UEASUDCEO
fo tseR
b
erutlucirga evisnetni dnaLerutlucirga evisnetni robaL
erutlucirga dessecorP
Figure 3.18. Gains (Losses) of World Export Market Share for Developed Countries’ Agriculture Exportsunder Hong Kong Scenario, by sub-sectora
(CHANGE IN PERCENTAGE OF WORLD EXPORT MARKET)
a. Scenario 6. b. Includes meat, dairy products, and sugar.
5.0-
4.0-
3.0-
2.0-
1.0-
0
1.0
2.0
3.0
DCEO
fo
tseRASU51 UE01 UEsEIN
naisAnapaJ
Capital-intensiveIntermediatesLabor-intensive and other manufactures
Figure 3.19. Gains (Losses) of World Export Market Share for Developed Countries’ Manufactures Exportsunder Hong Kong Scenario, by sub-sectora
(CHANGE IN PERCENTAGE OF WORLD EXPORT MARKET)
a. Scenario 6.
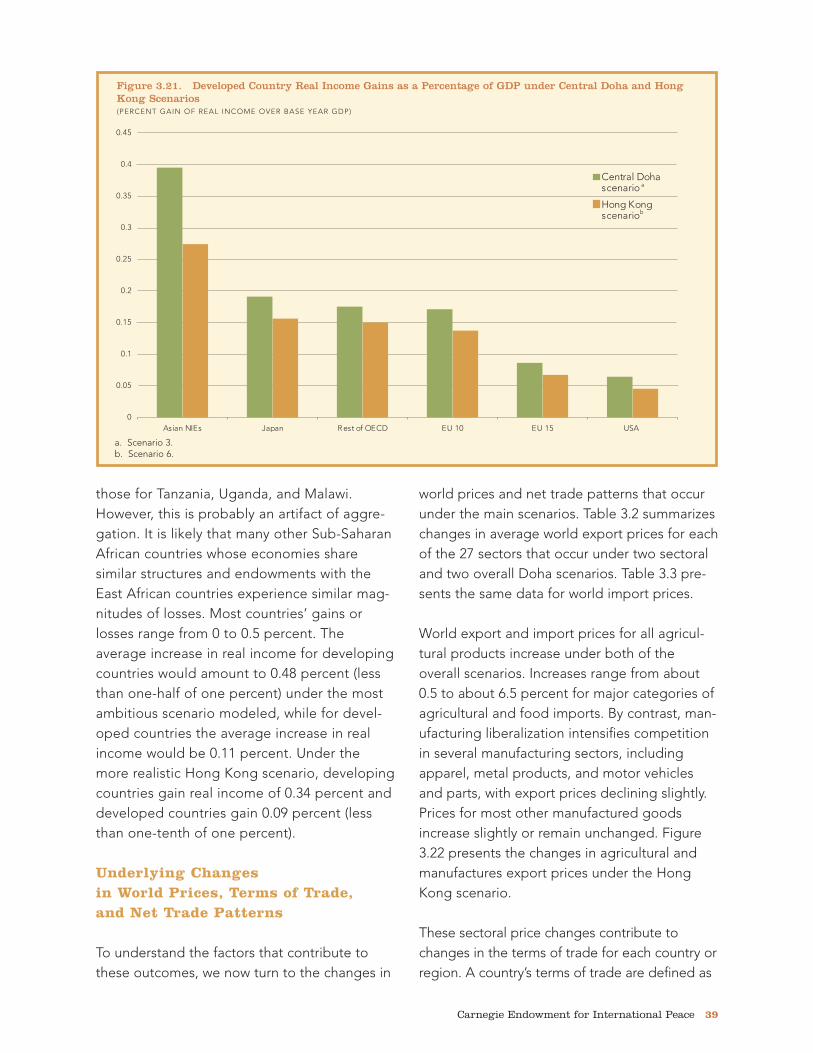
countries like Australia and Canada (grouped inthe rest of OECD), which lose manufacturingmarket share but gain share in the world agri-cultural market. The United States loses marketshare in land- and labor-intensive agriculturewhile gaining market share in processed agri-culture and food. Its share of capital-intensiveand intermediate manufactures marketsdeclines, although its share of labor-intensiveand other manufactures increases. This cate-gory includes such high value-added productsas motion pictures, video games, and photo-graphic film.
Income Gains Relative to GDP
Given the huge differences in the sizes ofeconomies in both the developed and devel-oping worlds, it is instructive to assess the
gains for each country or region as a per-centage of its current GDP, to see the relativeimportance of trade changes to each economy.Figures 3.20 and 3.21 present the gains orlosses under the central Doha and Hong Kongscenarios for developing and developed coun-tries respectively.
Maximum gains and losses are about 1percent of GDP for the most affectedeconomies. The biggest gainer is China, withan increase ranging from 0.8 to 1.2 percentunder the two scenarios. The biggest losersare the three countries of East Africa, who seea reduction in income of about 0.8 percentunder either scenario. Because of the waycountries are aggregated, the average gains orlosses for the many countries in the rest ofSub-Saharan Africa appear to be less than
38 Winners and Losers: Impact of the Doha Round on Developing Countries
1-
5.0-
0
5.0
1
5.1
ahoD lartneCoiranecs
gnoK gnoHoiranecs
a
b
Chi
na
Res
t o
f ASE
AN
Ind
ia
Ind
one
sia
Cen
tral
Am
eric
a a
nd C
arib
bea
n
Res
t o
f So
uth
Asi
a
Sout
h A
fric
a
Bra
zil
Arg
entin
a
Mid
dle
Eas
t a
nd N
ort
h A
fric
a
Res
t o
fLa
tin A
mer
ica
Mex
ico
Res
t o
f Sub
-Sa
hara
n A
fric
a
Ban
gla
des
h
Eas
t A
fric
a
Figure 3.20. Developing Country Real Income Gains (Losses) as a Percentage of GDP under Central Dohaand Hong Kong Scenarios(PERCENT GAIN OF REAL INCOME OVER BASE YEAR GDP)
Note: Vietnam experiences significantly greater real income gains in the simulation than the countries shown, gains of 7.2 percent underthe central Doha scenario and 4.9 percent under the Hong Kong scenario. However, this is attributable to the assumption that it accedesto the World Trade Organization during the period simulated, not to gains from the policy changes of the scenario itself. a. Scenario 3.b. Scenario 6.

those for Tanzania, Uganda, and Malawi.However, this is probably an artifact of aggre-gation. It is likely that many other Sub-SaharanAfrican countries whose economies sharesimilar structures and endowments with theEast African countries experience similar mag-nitudes of losses. Most countries’ gains orlosses range from 0 to 0.5 percent. Theaverage increase in real income for developingcountries would amount to 0.48 percent (lessthan one-half of one percent) under the mostambitious scenario modeled, while for devel-oped countries the average increase in realincome would be 0.11 percent. Under themore realistic Hong Kong scenario, developingcountries gain real income of 0.34 percent anddeveloped countries gain 0.09 percent (lessthan one-tenth of one percent).
Underlying Changes in World Prices, Terms of Trade, and Net Trade Patterns
To understand the factors that contribute tothese outcomes, we now turn to the changes in
world prices and net trade patterns that occurunder the main scenarios. Table 3.2 summarizeschanges in average world export prices for eachof the 27 sectors that occur under two sectoraland two overall Doha scenarios. Table 3.3 pre-sents the same data for world import prices.
World export and import prices for all agricul-tural products increase under both of theoverall scenarios. Increases range from about0.5 to about 6.5 percent for major categories ofagricultural and food imports. By contrast, man-ufacturing liberalization intensifies competitionin several manufacturing sectors, includingapparel, metal products, and motor vehiclesand parts, with export prices declining slightly.Prices for most other manufactured goodsincrease slightly or remain unchanged. Figure3.22 presents the changes in agricultural andmanufactures export prices under the HongKong scenario.
These sectoral price changes contribute tochanges in the terms of trade for each country orregion. A country’s terms of trade are defined as
Carnegie Endowment for International Peace 39
0
50.0
1.0
51.0
2.0
52.0
3.0
53.0
4.0
54.0
USA51 UE01 UEDCEO fo tseRnapaJsEIN naisA
ahoD lartneCoiranecs
gnoK gnoHoiranecs
a
b
Figure 3.21. Developed Country Real Income Gains as a Percentage of GDP under Central Doha and HongKong Scenarios(PERCENT GAIN OF REAL INCOME OVER BASE YEAR GDP)
a. Scenario 3.b. Scenario 6.

the ratio between prices for its exports andprices for its imports. For example, if a countryexports mainly agricultural goods and world agri-cultural prices increase while it imports mainlymanufactured goods and those prices remainsteady or decline, the country would experiencean improvement in its terms of trade. Table 3.4gives figures for terms of trade changes arisingfrom two sectoral and two overall Doha sce-narios. Sectoral contributions to changes interms of trade can be seen in the first twocolumns. The overall Doha and Hong Kong sce-narios, reflecting different levels of ambition indifferent sectors, produce similar changes in thepatterns of terms of trade, with differences in thelevel but not the direction of change.
The overall scenarios produce improvements inthe terms of trade for the EU 15 and the Asiannewly industrialized economies (NIEs), but dete-riorations for all other countries and regions.Gains from small increases in the prices of manymanufactured goods exported by China,
ASEAN, and Japan are more than offset byincreased prices for their agricultural imports.Most developing countries experience a terms-of-trade deterioration under all sectoral andoverall scenarios. Even Brazil, which seesimproved terms of trade under the agriculture-only scenario, experiences deterioration in thecombined scenarios because manufacturingprice changes dominate overall effects. Forsome countries, this deterioration is offset by anincrease in the volume of their exports, dis-cussed below. In the case of some of thepoorest countries, however, the combination ofsectoral price changes compounds losses. Forexample, the increase in world prices for foodand agricultural products that they import iscoupled with a decline in world prices for theirmain manufactured export, apparel. Their man-ufactured export volumes also decrease. Thiscombination is a key driver of the real incomelosses for the three poorest country groups(Bangladesh, East Africa, and the rest of Sub-Saharan Africa).
40 Winners and Losers: Impact of the Doha Round on Developing Countries
Table 3.2. Percentage Change in World Export Prices under Different Scenarios
(1) Doha Scenario (2) Doha Scenario (3) Central Doha (6) Hong KongSector for Agriculture for Manufactures Scenario Scenario
Grains 3.53 0.18 3.73 3.67Oilseeds 3.76 0.11 3.89 3.85Vegetables and fruits 0.74 0.23 0.98 0.91Other crops 0.75 0.24 1.00 0.93Livestock 0.55 0.34 0.89 0.79Meat and dairy products 5.53 0.26 5.69 5.65Sugar 1.94 0.02 1.93 1.93Processed foods 0.79 0.21 1.01 0.95Beverages and tobacco 0.24 0.24 0.48 0.41Forestry and fishery 0.17 0.24 0.40 0.34Crude oil and natural gas -0.03 0.06 0.02 0.01Textiles -0.06 0.10 0.05 0.02Apparel -0.04 -0.09 -0.13 -0.10Leather and footwear 0.03 0.25 0.27 0.20Other manufactures -0.07 0.15 0.08 0.04Wood and paper products -0.01 0.19 0.17 0.13Petroleum, coal, and mineral products -0.03 0.19 0.17 0.13Chemical, rubber, and plastic products -0.09 0.16 0.08 0.04Metals and metal products -0.05 0.04 -0.02 -0.03Motor vehicles and other transport equipment -0.10 0.10 -0.01 -0.03Electronic equipment -0.10 0.13 0.03 0.00Other machinery -0.11 0.16 0.06 0.01Trade and transportation -0.08 0.38 0.30 0.19Financial services, banking, and insurance -0.07 0.31 0.24 0.15Communication, health, education, and public services -0.05 0.21 0.16 0.10Recreational and other services -0.08 0.31 0.23 0.15Housing, utilities, and construction -0.08 0.16 0.08 0.04

Carnegie Endowment for International Peace 41
00.0
00.1
00.2
00.3
00.4
00.5
00.6
Mea
t an
d d
airy
pro
duc
ts
Oils
eed
s
Gra
ins
Sug
ar
Pro
cess
ed fo
od
s
Oth
er c
rop
s
Veg
etab
les
and
frui
ts
Live
sto
ck
Bev
erag
es a
nd t
ob
acco
Fore
stry
and
fish
ery
Leat
her
and
foo
twea
r
Petr
ole
um, c
oal
, and
min
eral
pro
duc
ts
Wo
od
and
pap
er p
rod
ucts
Oth
er m
anuf
actu
res
Che
mic
al, r
ubb
er, a
nd p
last
ic p
rod
ucts
Text
iles
Oth
er m
achi
nery
Cru
de
oil
and
nat
ural
gas
Ele
ctro
nic
equi
pm
ent
Met
al a
nd m
etal
pro
duc
ts
Mo
tor
vehi
cles
and
par
ts
Ap
par
el
Figure 3.22. Impact of Hong Kong Scenario on Global Pricesa
(PERCENT CHANGE IN WORLD EXPORT PRICES)
a. Scenario 6.
Table 3.3. Percentage Change in World Import Prices under Different Scenarios
(1) Doha Scenario (2) Doha Scenario (3) Central Doha (6) Hong KongSector for Agriculture for Manufactures Scenario Scenario
Grains 3.83 0.18 4.03 3.97Oilseeds 3.70 0.11 3.82 3.78Vegetables and fruits 0.67 0.24 0.93 0.85Other crops 0.72 0.24 0.97 0.90Livestock 0.55 0.34 0.90 0.80Meat and dairy products 6.22 0.27 6.38 6.33Sugar 2.52 0.04 2.52 2.51Processed foods 0.85 0.21 1.06 1.00Beverages and tobacco 0.24 0.24 0.48 0.41Forestry and fishery 0.24 0.18 0.41 0.36Crude oil and natural gas -0.03 0.06 0.02 0.01Textiles -0.06 0.08 0.02 0.00Apparel -0.04 -0.07 -0.12 -0.09Leather and footwear 0.03 0.29 0.31 0.23Other manufactures -0.07 0.11 0.04 0.02Wood and paper products -0.02 0.22 0.20 0.15Petroleum, coal, and mineral products -0.03 0.19 0.16 0.13Chemical, rubber, and plastic products -0.09 0.18 0.10 0.05Metals and metal products -0.05 0.06 0.02 0.00Motor vehicles and other transport equipment -0.10 0.12 0.02 -0.01Electronic equipment -0.10 0.13 0.04 0.00Other machinery -0.10 0.16 0.06 0.02Trade and transportation -0.08 0.37 0.29 0.19Financial services, banking, and insurance -0.07 0.31 0.24 0.15Communication, health, education, and public services -0.05 0.21 0.16 0.10Recreational and other services -0.08 0.30 0.23 0.14Housing, utilities, and construction -0.08 0.16 0.08 0.04
These price trends are at odds with a long-standing historical pattern of declining pricesfor agricultural commodities relative to manu-factured goods. Changes in both the agricul-tural and manufacturing sectors are involved inthis historical shift. Proposed reductions indomestic support for agriculture by high-income countries under various Doha scenarioswould tend to lower production. If demandremains steady, lower supply would drive upprices. Eliminating export subsidies would alsoincrease prices to importing countries.
In the manufacturing sector, worldwide liberal-ization in labor-intensive products intensifiescompetition and lowers world prices. There iscurrently excess production capacity relative todemand for many manufactured goods. This isdriven by a number of factors, including theend of the Cold War and the merger of two for-merly separate production systems; an abun-
dant supply of unskilled labor in very largecountries such as China and India (representedin the model as unemployed or underemployedworkers who can be drawn into production withno increase in wages or prices); and the end ofthe apparel quota system, which had encour-aged overcapacity in that sector.
Table 3.5 presents the changes in net exports (inmillions of 2001 dollars) induced by the HongKong scenario. Generally speaking, the imple-mentation of a trade liberalization agreementlike the one modeled here would lead to mostEast and South Asian developing countriesexporting more labor-intensive manufacturedgoods and electronic equipment and importingmore manufactured intermediates and capital-intensive products. Brazil and Argentina wouldsee a broad decline in manufactured exportsoffset by growth in food and agriculturalexports. However, a number of the poorest
42 Winners and Losers: Impact of the Doha Round on Developing Countries
Table 3.4. Percentage Change in International Terms of Trade under Different Scenarios
(1) Doha Scenario (2) Doha Scenario (3) Central Doha (6) Hong KongCountry or region for Agriculture for Manufactures Scenario Scenario
China -0.66 0.34 -0.33 -0.49Indonesia -0.42 0.37 -0.06 -0.17Vietnam -0.49 -1.05 -1.54 -0.97Rest of ASEAN -0.35 0.17 -0.19 -0.26India -0.88 -0.97 -1.83 -1.62Bangladesh -0.43 -0.24 -0.66 -0.58Rest of South Asia -0.47 -0.37 -0.84 -0.76Russia and FSU -1.13 -0.40 -1.52 -1.45Middle East and North Africa -0.93 -0.52 -1.43 -1.32South Africa -0.40 -0.30 -0.70 -0.70East Africa -0.38 0.05 -0.33 -0.42Rest of Sub-Saharan Africa -0.77 -0.04 -0.79 -0.83Brazil 0.16 -0.46 -0.30 -0.18Mexico -0.16 -0.46 -0.62 -0.48Argentina -0.03 -0.41 -0.43 -0.36Rest of Latin America -0.70 -0.58 -1.26 -1.12Central America and Caribbean -0.49 -0.26 -0.74 -0.67Rest of the world -0.64 -0.38 -1.02 -0.92All developing countries -0.51 -0.31 -0.81 -0.74
Asian NIEs -0.30 0.74 0.43 0.19USA 0.01 -0.23 -0.22 -0.17EU 15 2.68 0.16 2.85 2.76EU 10 -1.84 -0.41 -2.23 -2.12Japan -0.86 0.51 -0.36 -0.50Rest of OECD -0.64 -0.18 -0.81 -0.76All developed countries -0.18 0.10 -0.07 -0.12

developing countries experience an overalldecline in exports, dominated by declines inlabor-intensive exports and processed food. Thelabor-intensive sectors in the LDCs cannotattract the same level of production resources asthey could before Doha Round liberalization,because profitability is reduced by lower worldprices for their manufactured exports. As aresult, more production resources remain in orreturn to those countries’ agricultural sectors.The elimination of export subsidies and thereduction of domestic farm support in rich coun-tries push up world food prices, increasing theprofitability of agricultural exports, but notenough to fully compensate for the losses inmanufacturing and processed food. A similarpattern occurs in the Middle East and NorthAfrica; there, however, a significant increase inoil and gas exports and some improvement inmeat and dairy exports offset export losses inlabor-intensive manufactured goods.
Changes in Factor Returns and Employment
The changes in returns to land, labor, andcapital resulting from the Hong Kong scenarioand its two sectoral components are reported intable 3.6. The changes induced by the scenariosare consistent with intuition and the aggregatereal income changes discussed above. Returnsto agricultural land decline in many high-incomecountries, dramatically in the case of the EUmembers (by 26 percent) and Japan (by 23percent), because of reduced farm subsidiesand tariffs in those countries. Returns to agricul-tural land and labor increase in most developingcountries, with the largest gains going tolandowners in Brazil, Argentina, South Africa,and other Latin American countries. Though theliberalization of manufactured goods increasesthe demand for labor in the developing world(with the exception of the poorest countries, asdiscussed above), wages for unskilled labor donot increase, because of both the abundant
supply of labor and the fact that liberalizedtrade in labor-intensive manufactures drivesdown world prices for such goods and returns toworkers and firms in those sectors.
Table 3.7 presents the percentage change indemand for unskilled labor by sector as a resultof implementation of the Hong Kong scenario.Employment of unskilled labor increases by 0.76percent for developing countries as a group,although the gain is unevenly distributedamong countries and across manufacturing sub-sectors. Significant increases in unskilledemployment (from 0.6 to 1.4 percent) are real-ized by China, Indonesia, the rest of ASEAN,and India.25 Once again, the three poorestregions in the model (Bangladesh, East Africa,and the rest of Sub-Saharan Africa) actually loseunskilled jobs from manufacturing industries,although they may gain some jobs in theirprimary agricultural sectors. Whether the agri-cultural employment growth is sufficient tooffset the manufacturing job losses depends onthe relative size of the sectors in each country,as well as productivity levels in each sector.
Employment of unskilled labor is largelyunchanged in the developed countries andregions overall, but there is extensive composi-tional change in unskilled employment inseveral countries. In the United States, losses intextiles, apparel, leather, metal products, motorvehicles, and electronic equipment are offset bygains in unskilled employment in other manu-facturing and processed food industries. In theEU 15, losses in unskilled employment in mostprocessed foods, textiles, apparel, and leatherare offset by employment gains in intermediateand capital-intensive manufacturing sectors,including metal products, motor vehicles, andother machinery. A fairly similar pattern is seenin Japan, which experiences strong growth indemand for unskilled labor in motor vehicleproduction. Other high-income OECD coun-tries, including Australia, Canada, and New
Carnegie Endowment for International Peace 43
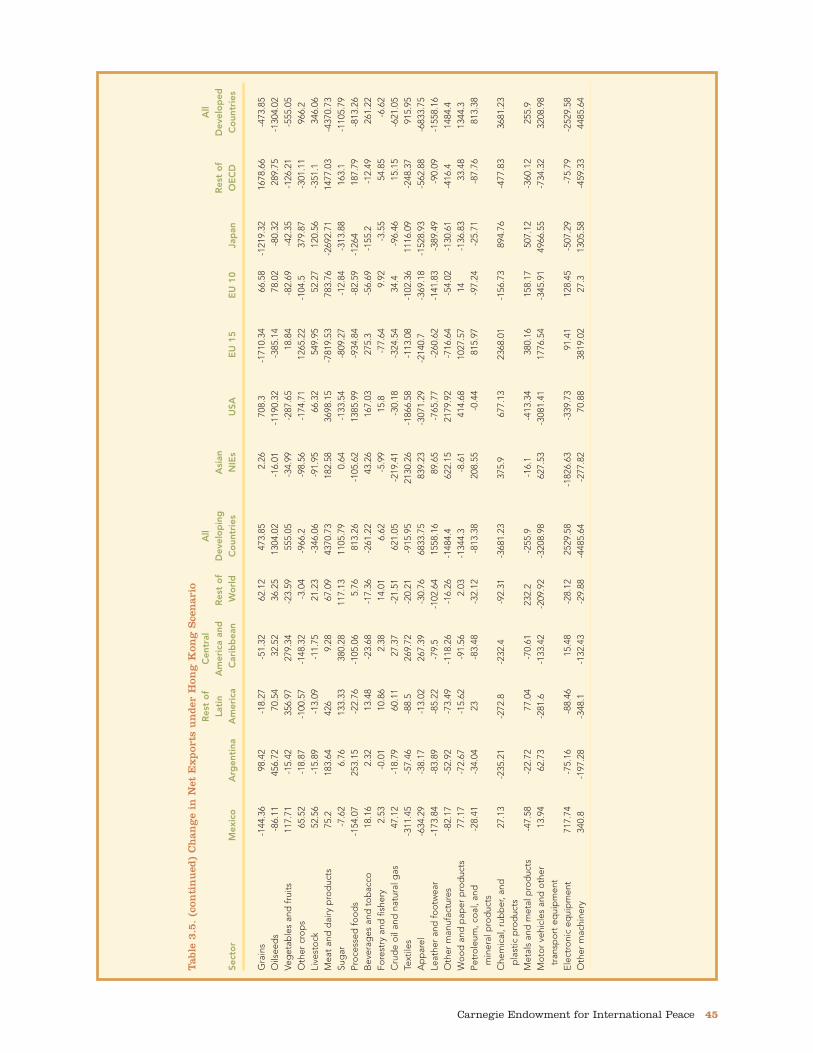
44 Winners and Losers: Impact of the Doha Round on Developing Countries
Tab
le 3
.5.
Ch
ang
e in
Net
Ex
por
ts u
nd
er H
ong
Kon
g S
cen
ario
(MIL
LIO
NS
OF
DO
LL
AR
S)
Mid
dle
Res
t o
f R
est
of
Res
t o
f R
ussi
a E
ast
and
So
uth
Eas
t Su
b-S
ahar
anSe
cto
rC
hina
Ind
one
sia
Vie
tnam
ASE
AN
Ind
iaB
ang
lad
esh
Sout
h A
sia
and
FSU
No
rth
Afr
ica
Afr
ica
Afr
ica
Afr
ica
Bra
zil
Gra
ins
191.
07-5
.75.
42-9
.71
102.
479.
6136
.26
243.
96-5
9.14
39.4
3-2
.53
32.2
-56.
08O
ilsee
ds
-97.
846.
1416
.36
-8.7
162
.73
1.87
4.54
83.9
31.9
819
.91
3.94
69.9
959
9.28
Veg
etab
les
and
frui
ts10
6.66
1.27
6.17
25.4
8-1
32.3
7-0
.47
-3.5
3-3
6.92
-84.
070.
911.
79-2
.31
-42.
58O
ther
cro
ps
-125
.93
-45.
6221
.17
-178
.61
-29.
7418
.91
11.5
-75.
45-8
7.22
-4.8
822
.55
-160
.29
-127
.32
Live
sto
ck-2
16.6
72.
233.
94-1
9.3
-12.
80.
12-3
.3-1
2.84
-56.
02-8
.72
-2.4
-16.
47-3
6.89
Mea
t an
d d
airy
pro
duc
ts-1
10.6
910
5.67
8.1
112.
1277
.92.
1337
.530
9.99
570.
8710
9.56
2.26
490.
1618
93.9
2Su
gar
-13.
19-1
4.06
-0.8
718
8.56
29.1
90.
39-4
1.86
-163
.94
-12.
3961
.51
15.2
825
3.44
173.
87Pr
oce
ssed
foo
ds
407.
8342
.38
61.2
264
3.03
-371
.23
-9.5
5-7
9.18
-27.
223
.73
42.2
5-1
8.81
-154
.85
276.
61B
ever
ages
and
to
bac
co-1
7.9
8.44
-16.
52-4
0.37
0.47
0.19
-4.2
3-2
8.97
-150
.95
12.6
2-1
.01
-7.0
1-8
.9Fo
rest
ry a
nd fi
sher
y-5
1.28
5.22
5.4
-18.
1-5
.69
0.31
5.17
21.3
84.
7813
.67
-2.0
72.
32-4
.27
Cru
de
oil
and
nat
ural
gas
-212
.63
-47.
66-0
.7-5
9.77
62.2
1-0
.16
21.8
1-4
1.61
789.
2942
.45
-0.2
5-2
7.12
0.88
Text
iles
-996
.48
91.0
3-1
66.2
773
.25
606.
74-2
6.56
170.
6-9
7.04
-198
.84
-38.
5-3
.35
-20.
39-1
02.2
3A
pp
arel
5704
.09
366.
3242
7.42
645.
0455
5.11
-5.7
724
0.49
-81.
06-5
12.5
810
.84
-2.0
6-2
5.24
-40.
02Le
athe
r an
d fo
otw
ear
1692
.44
230.
6155
8.43
61.4
460
.73
-32.
49-5
.79
-153
.06
-161
.34
-26.
55-1
.64
-36.
66-1
02.8
6O
ther
man
ufac
ture
s-4
83.7
7-7
6.78
0.32
-207
.29
-78.
92.
6611
.8-8
5.82
94.1
1-9
.88
-0.6
4-2
00.2
-106
.9W
oo
d a
nd p
aper
pro
duc
ts-5
24.8
969
.83
2.73
-20.
66-5
9.09
2.04
-19.
78-9
6.61
-330
.17
-173
.83
0.57
-11.
61-8
2.17
Petr
ole
um, c
oal
, and
-1
83.6
5-8
3.42
-22.
79-1
16.0
5-2
34.2
510
.5-7
0.12
338.
3211
3.85
-328
.02
-1.5
3-1
7.13
-64.
04m
iner
al p
rod
ucts
Che
mic
al, r
ubb
er, a
nd
-210
0.49
-74.
9-5
1.93
141.
91-1
12.3
93.
6-7
1.83
-158
.76
277.
92-1
47.9
2-4
.51
-21.
85-5
54.4
9p
last
ic p
rod
ucts
Met
als
and
met
al p
rod
ucts
-508
.01
-78.
12-2
0.94
-321
.34
-334
.47
0.96
-42.
0468
0.98
100.
9130
0.07
-11.
18-8
2.05
-108
.98
Mo
tor
vehi
cles
and
oth
er
-102
9.04
-133
.44
-5.0
7-4
79.3
8-1
19.7
90.
69-9
9.82
-354
.39
-458
.15
43.1
7-2
.24
-58.
1534
.9tr
ansp
ort
eq
uip
men
tE
lect
roni
c eq
uip
men
t20
28.0
3-2
5.64
1.55
520.
52-7
4.11
1.47
-18.
31-1
68.9
583
.25
-11.
97-1
.58
-4.3
8-3
41.7
8O
ther
mac
hine
ry-2
009.
09-3
6.9
16.9
877
.81
-374
.82
3.77
-92.
56-2
75.5
3-5
50.1
519
.52
-3.6
7-1
3.51
-880
.59
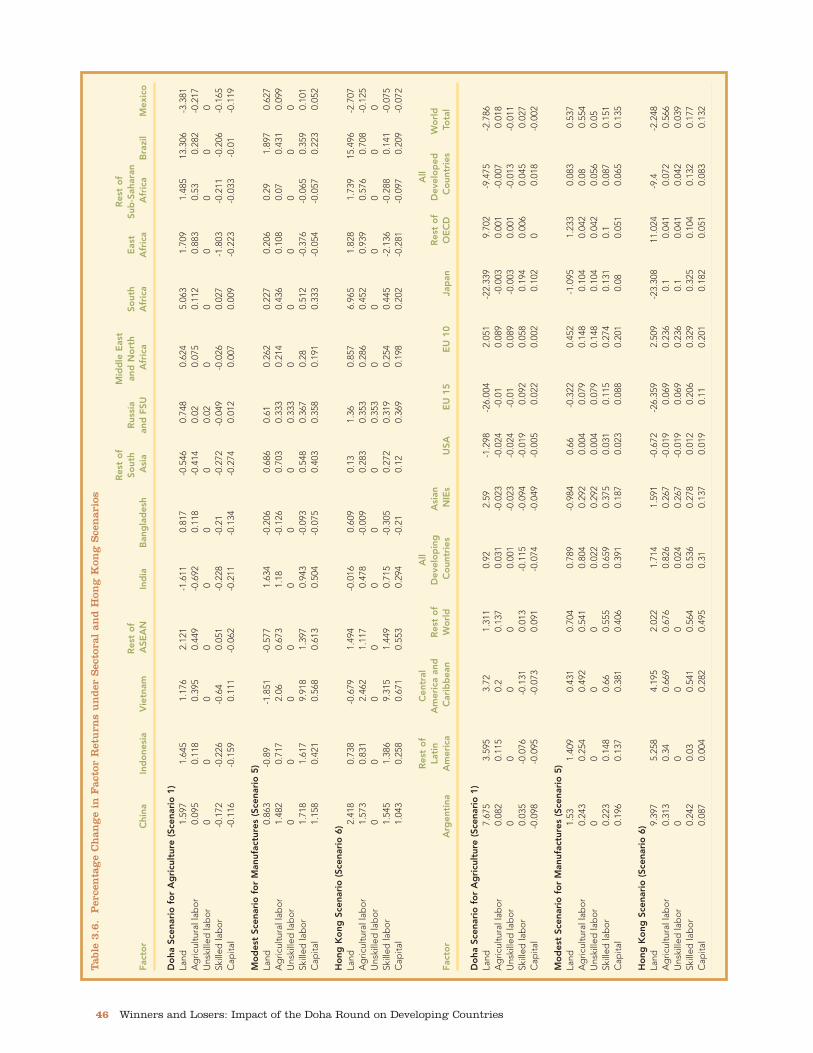
Carnegie Endowment for International Peace 45
Tab
le 3
.5.
(con
tin
ued
) C
han
ge
in N
et E
xp
orts
un
der
Hon
g K
ong
Sce
nar
ioR
est
of
Cen
tral
All
All
Lati
n A
mer
ica
and
Res
t o
fD
evel
op
ing
A
sian
R
est
of
Dev
elo
ped
Sect
or
Mex
ico
Arg
enti
naA
mer
ica
Car
ibb
ean
Wo
rld
Co
untr
ies
NIE
sU
SAE
U 1
5E
U 1
0Ja
pan
OE
CD
Co
untr
ies
Gra
ins
-144
.36
98.4
2-1
8.27
-51.
3262
.12
473.
852.
2670
8.3
-171
0.34
66.5
8-1
219.
3216
78.6
6-4
73.8
5O
ilsee
ds
-86.
1145
6.72
70.5
432
.52
36.2
513
04.0
2-1
6.01
-119
0.32
-385
.14
78.0
2-8
0.32
289.
75-1
304.
02Ve
get
able
s an
d fr
uits
117.
71-1
5.42
356.
9727
9.34
-23.
5955
5.05
-34.
99-2
87.6
518
.84
-82.
69-4
2.35
-126
.21
-555
.05
Oth
er c
rop
s65
.52
-18.
87-1
00.5
7-1
48.3
2-3
.04
-966
.2-9
8.56
-174
.71
1265
.22
-104
.537
9.87
-301
.11
966.
2Li
vest
ock
52.5
6-1
5.89
-13.
09-1
1.75
21.2
3-3
46.0
6-9
1.95
66.3
254
9.95
52.2
712
0.56
-351
.134
6.06
Mea
t an
d d
airy
pro
duc
ts75
.218
3.64
426
9.28
67.0
943
70.7
318
2.58
3698
.15
-781
9.53
783.
76-2
692.
7114
77.0
3-4
370.
73Su
gar
-7.6
26.
7613
3.33
380.
2811
7.13
1105
.79
0.64
-133
.54
-809
.27
-12.
84-3
13.8
816
3.1
-110
5.79
Pro
cess
ed fo
od
s-1
54.0
725
3.15
-22.
76-1
05.0
65.
7681
3.26
-105
.62
1385
.99
-934
.84
-82.
59-1
264
187.
79-8
13.2
6B
ever
ages
and
to
bac
co18
.16
2.32
13.4
8-2
3.68
-17.
36-2
61.2
243
.26
167.
0327
5.3
-56.
69-1
55.2
-12.
4926
1.22
Fore
stry
and
fish
ery
2.53
-0.0
110
.86
2.38
14.0
16.
62-5
.99
15.8
-77.
649.
92-3
.55
54.8
5-6
.62
Cru
de
oil
and
nat
ural
gas
47.1
2-1
8.79
60.1
127
.37
-21.
5162
1.05
-219
.41
-30.
18-3
24.5
434
.4-9
6.46
15.1
5-6
21.0
5Te
xtile
s-3
11.4
5-5
7.46
-88.
526
9.72
-20.
21-9
15.9
521
30.2
6-1
866.
58-1
13.0
8-1
02.3
611
16.0
9-2
48.3
791
5.95
Ap
par
el-6
34.2
9-3
8.17
-13.
0226
7.39
-30.
7668
33.7
583
9.23
-307
1.29
-214
0.7
-369
.18
-152
8.93
-562
.88
-683
3.75
Leat
her
and
foo
twea
r-1
73.8
4-8
3.89
-85.
22-7
9.5
-102
.64
1558
.16
89.6
5-7
65.7
7-2
60.6
2-1
41.8
3-3
89.4
9-9
0.09
-155
8.16
Oth
er m
anuf
actu
res
-82.
17-5
2.92
-73.
49-1
18.2
6-1
6.26
-148
4.4
622.
1521
79.9
2-7
16.6
4-5
4.02
-130
.61
-416
.414
84.4
Wo
od
and
pap
er p
rod
ucts
77.1
7-7
2.67
-15.
62-9
1.56
2.03
-134
4.3
-8.6
141
4.68
1027
.57
14-1
36.8
333
.48
1344
.3Pe
tro
leum
, co
al, a
nd
-28.
41-3
4.04
23-8
3.48
-32.
12-8
13.3
820
8.55
-0.4
481
5.97
-97.
24-2
5.71
-87.
7681
3.38
min
eral
pro
duc
tsC
hem
ical
, rub
ber
, and
27
.13
-235
.21
-272
.8-2
32.4
-92.
31-3
681.
2337
5.9
677.
1323
68.0
1-1
56.7
389
4.76
-477
.83
3681
.23
pla
stic
pro
duc
tsM
etal
s an
d m
etal
pro
duc
ts-4
7.58
-22.
7277
.04
-70.
6123
2.2
-255
.9-1
6.1
-413
.34
380.
1615
8.17
507.
12-3
60.1
225
5.9
Mo
tor
vehi
cles
and
oth
er
13.9
462
.73
-281
.6-1
33.4
2-2
09.9
2-3
208.
9862
7.53
-308
1.41
1776
.54
-345
.91
4966
.55
-734
.32
3208
.98
tran
spo
rt e
qui
pm
ent
Ele
ctro
nic
equi
pm
ent
717.
74-7
5.16
-88.
4615
.48
-28.
1225
29.5
8-1
826.
63-3
39.7
391
.41
128.
45-5
07.2
9-7
5.79
-252
9.58
Oth
er m
achi
nery
340.
8-1
97.2
8-3
48.1
-132
.43
-29.
88-4
485.
64-2
77.8
270
.88
3819
.02
27.3
1305
.58
-459
.33
4485
.64

46 Winners and Losers: Impact of the Doha Round on Developing Countries
Tab
le 3
.6.
Per
cen
tag
e C
han
ge
in F
acto
r R
etu
rns
un
der
Sec
tora
l an
d H
ong
Kon
g S
cen
ario
s
Res
t o
f M
idd
le E
ast
Res
t o
f R
est
of
Sout
hR
ussi
a an
d N
ort
hSo
uth
Eas
t Su
b-S
ahar
anFa
cto
rC
hina
Ind
one
sia
Vie
tnam
ASE
AN
Ind
iaB
ang
lad
esh
Asi
aan
d F
SUA
fric
aA
fric
aA
fric
aA
fric
aB
razi
lM
exic
o
Do
ha S
cena
rio
fo
r A
gri
cult
ure
(Sce
nari
o 1
)La
nd1.
597
1.64
51.
176
2.12
1-1
.611
0.81
7-0
.546
0.74
80.
624
5.06
31.
709
1.48
513
.306
-3.3
81A
gric
ultu
ral l
abo
r0.
095
0.11
80.
395
0.44
9-0
.692
0.11
8-0
.414
0.02
0.07
50.
112
0.88
30.
530.
282
-0.2
17U
nski
lled
lab
or
00
00
00
00.
020
00
00
0Sk
illed
lab
or
-0.1
72-0
.226
-0.6
40.
051
-0.2
28-0
.21
-0.2
72-0
.049
-0.0
260.
027
-1.8
03-0
.211
-0.2
06-0
.165
Cap
ital
-0.1
16-0
.159
0.11
1-0
.062
-0.2
11-0
.134
-0.2
740.
012
0.00
70.
009
-0.2
23-0
.033
-0.0
1-0
.119
Mo
des
t Sc
enar
io f
or
Man
ufac
ture
s (S
cena
rio
5)
Land
0.86
3-0
.89
-1.8
51-0
.577
1.63
4-0
.206
0.68
60.
610.
262
0.22
70.
206
0.29
1.89
70.
627
Ag
ricul
tura
l lab
or
1.48
20.
717
2.06
0.67
31.
18-0
.126
0.70
30.
333
0.21
40.
436
0.10
80.
070.
431
0.09
9U
nski
lled
lab
or
00
00
00
00.
333
00
00
00
Skill
ed la
bo
r1.
718
1.61
79.
918
1.39
70.
943
-0.0
930.
548
0.36
70.
280.
512
-0.3
76-0
.065
0.35
90.
101
Cap
ital
1.15
80.
421
0.56
80.
613
0.50
4-0
.075
0.40
30.
358
0.19
10.
333
-0.0
54-0
.057
0.22
30.
052
Ho
ng K
ong
Sce
nari
o (
Scen
ario
6)
Land
2.41
80.
738
-0.6
791.
494
-0.0
160.
609
0.13
1.36
0.85
76.
965
1.82
81.
739
15.4
96-2
.707
Ag
ricul
tura
l lab
or
1.57
30.
831
2.46
21.
117
0.47
8-0
.009
0.28
30.
353
0.28
60.
452
0.93
90.
576
0.70
8-0
.125
Uns
kille
d la
bo
r0
00
00
00
0.35
30
00
00
0Sk
illed
lab
or
1.54
51.
386
9.31
51.
449
0.71
5-0
.305
0.27
20.
319
0.25
40.
445
-2.1
36-0
.288
0.14
1-0
.075
Cap
ital
1.04
30.
258
0.67
10.
553
0.29
4-0
.21
0.12
0.36
90.
198
0.20
2-0
.281
-0.0
970.
209
-0.0
72
Res
t o
f C
entr
al
All
All
Lati
n A
mer
ica
and
Res
t o
f D
evel
op
ing
Asi
anR
est
of
Dev
elo
ped
Wo
rld
Fact
or
Arg
enti
naA
mer
ica
Car
ibb
ean
Wo
rld
Co
untr
ies
NIE
sU
SAE
U 1
5E
U 1
0Ja
pan
OE
CD
Co
untr
ies
Tota
l
Do
ha S
cena
rio
fo
r A
gri
cult
ure
(Sce
nari
o 1
)La
nd7.
675
3.59
53.
721.
311
0.92
2.59
-1.2
98-2
6.00
42.
051
-22.
339
9.70
2-9
.475
-2.7
86A
gric
ultu
ral l
abo
r0.
082
0.11
50.
20.
137
0.03
1-0
.023
-0.0
24-0
.01
0.08
9-0
.003
0.00
1-0
.007
0.01
8U
nski
lled
lab
or
00
00
0.00
1-0
.023
-0.0
24-0
.01
0.08
9-0
.003
0.00
1-0
.013
-0.0
11Sk
illed
lab
or
0.03
5-0
.076
-0.1
310.
013
-0.1
15-0
.094
-0.0
190.
092
0.05
80.
194
0.00
60.
045
0.02
7C
apita
l-0
.098
-0.0
95-0
.073
0.09
1-0
.074
-0.0
49-0
.005
0.02
20.
002
0.10
20
0.01
8-0
.002
Mo
des
t Sc
enar
io f
or
Man
ufac
ture
s (S
cena
rio
5)
Land
1.53
1.40
90.
431
0.70
40.
789
-0.9
840.
66-0
.322
0.45
2-1
.095
1.23
30.
083
0.53
7A
gric
ultu
ral l
abo
r0.
243
0.25
40.
492
0.54
10.
804
0.29
20.
004
0.07
90.
148
0.10
40.
042
0.08
0.55
4U
nski
lled
lab
or
00
00
0.02
20.
292
0.00
40.
079
0.14
80.
104
0.04
20.
056
0.05
Skill
ed la
bo
r0.
223
0.14
80.
660.
555
0.65
90.
375
0.03
10.
115
0.27
40.
131
0.1
0.08
70.
151
Cap
ital
0.19
60.
137
0.38
10.
406
0.39
10.
187
0.02
30.
088
0.20
10.
080.
051
0.06
50.
135
Ho
ng K
ong
Sce
nari
o (
Scen
ario
6)
Land
9.39
75.
258
4.19
52.
022
1.71
41.
591
-0.6
72-2
6.35
92.
509
-23.
308
11.0
24-9
.4-2
.248
Ag
ricul
tura
l lab
or
0.31
30.
340.
669
0.67
60.
826
0.26
7-0
.019
0.06
90.
236
0.1
0.04
10.
072
0.56
6U
nski
lled
lab
or
00
00
0.02
40.
267
-0.0
190.
069
0.23
60.
10.
041
0.04
20.
039
Skill
ed la
bo
r0.
242
0.03
0.54
10.
564
0.53
60.
278
0.01
20.
206
0.32
90.
325
0.10
40.
132
0.17
7C
apita
l0.
087
0.00
40.
282
0.49
50.
310.
137
0.01
90.
110.
201
0.18
20.
051
0.08
30.
132

Zealand, see strong gains in unskilled employ-ment in processed foods but declines in allother manufacturing subsectors. In the AsianNIEs, unskilled employment increases in tex-tiles, apparel, leather, other manufactures,motor vehicles, and chemical, rubber, andplastic products, while declining in other manu-facturing subsectors.
Table 3.8 presents the changes in agriculturallabor demand induced by the Hong Kong sce-nario. For developing countries as a group,agricultural employment barely increases (0.1percent). Agricultural employment declines inIndonesia, India, the rest of South Asia, andMexico.
In developed countries, the secular trend ofdeclining agricultural employment continues forall countries except the ten newly accededmembers of the EU; the Asian NIEs; and otherhigh-income countries belonging to theOrganization for Economic Cooperation andDevelopment (OECD), such as Australia,Canada, and New Zealand, which see increasesin agricultural exports, mainly to other high-income countries.
The Adjustment of ProductionStructures and the Redistribution ofValue Added between Developed andDeveloping Countries
Table 3.9 presents the changes in productionand value added induced by the Hong Kongscenario. In agriculture, the results show thatthe EU 15 and Japan reduce their agriculturaland food production significantly across almostall subsectors. The United States expands pro-duction slightly in grains, livestock, meat anddairy products, and processed food while pro-duction of oilseeds, fruits, vegetables, nongraincrops, and sugar declines. High-income OECDcountries, including Australia, Canada, and NewZealand, experience strong expansions in pro-
duction of grains, oilseeds, and sugar, withsmaller growth in meat, dairy products, andother processed foods. The Asian NIEs greatlyexpand production of oilseeds, with smallerincreases in livestock and in meat and dairyproducts. Other subsectors shrink or holdsteady.
Most developing countries (except Mexico)expand production of many agricultural goods.Oilseed production grows significantly inChina, Vietnam, South Africa, Sub-SaharanAfrica, Brazil, Argentina, and the rest of LatinAmerica. Grain production holds roughlysteady across the developing world, with onlymarginal expansions or contractions, except inSouth Africa, where production increases about4 percent, and Mexico, where it declines byslightly more. Production of fruits, vegetables,and nongrain crops holds steady. Livestockproduction expands in Brazil, contracts inVietnam, and holds steady elsewhere. Meatand dairy production expands in most devel-oping countries, with significant increases inSub-Saharan Africa and Brazil and a declineonly in Vietnam. Sugar production expands formuch of ASEAN, South Africa, East Africa, andthe rest of Sub-Saharan Africa, Brazil, CentralAmerica, and some other Latin American coun-tries, offset by contractions in China, Vietnam,and some South Asian countries. Food pro-cessing remains largely stable across the devel-oping world, with some small losses in Indiaand the rest of South Asia.
In manufacturing, labor-intensive productionshrinks across the developed world, with theexception of the Asian NIEs. However, only afew developing countries, most notably China,ASEAN, India, some parts of South Asia, andCentral America, increase their production. Inother manufacturing subsectors, there is someshifting of production among developing coun-tries. Most changes are fairly small (less than 2percent). However in metals, motor vehicles,
Carnegie Endowment for International Peace 47

48 Winners and Losers: Impact of the Doha Round on Developing Countries
Tab
le 3
.7.
Per
cen
tag
e C
han
ge
in D
eman
d f
or U
nsk
ille
d L
abor
by
Sec
tor
un
der
Hon
g K
ong
Sce
nar
ioa
Res
t o
f M
idd
le E
ast
Res
t o
f R
est
of
Sout
hR
ussi
a an
d N
ort
hSo
uth
Eas
t Su
b-S
ahar
anSe
cto
rC
hina
Ind
one
sia
Vie
tnam
ASE
AN
Ind
iaB
ang
lad
esh
Asi
aan
d F
SUA
fric
aA
fric
aA
fric
aA
fric
aB
razi
lM
exic
o
Mea
t an
d d
airy
pro
duc
ts1.
688
3.01
40.
736
1.61
31.
252
2.44
22.
155
2.91
73.
931
3.29
52.
043
11.8
0410
.596
0.04
8Su
gar
-2.8
56-0
.409
-3.0
836.
173
0.78
30.
158
-4.3
84-2
.775
0.25
58.
581
11.9
027.
444
4.50
1-0
.61
Pro
cess
ed fo
od
s1.
382
0.33
30.
585
2.01
6-1
.95
-0.1
27-1
.465
-0.1
50.
492
1.40
5-0
.427
-0.2
571.
386
-0.5
53B
ever
ages
and
to
bac
co0.
819
0.20
7-6
.906
-0.5
10.
118
-0.0
74-0
.706
-0.2
1-1
.672
0.69
90.
442
0.34
10.
141
0.06
3C
rud
e o
il an
d n
atur
al g
as-0
.302
-0.5
87-0
.154
-0.5
170.
281
0.05
6-0
.046
0.04
50.
234
-0.1
1-0
.268
-0.1
71-0
.302
0.19
3Te
xtile
s1.
847
2.90
716
.677
2.63
13.
169
-0.7
172.
624
-1.7
37-3
.364
-2.2
06-2
.495
-1.0
85-1
.907
-3.7
35A
pp
arel
5.81
97.
102
29.4
834.
139
9.82
4-0
.317
6.90
1-2
.282
-6.8
971.
896
0.00
5-1
.343
-0.8
02-4
.775
Leat
her
and
foo
twea
r4.
241
7.36
523
.179
1.14
12.
561
-5.6
47-0
.736
-3.8
96-2
.994
-5.0
36-2
.269
-2.2
49-2
.836
-3.2
6O
ther
man
ufac
ture
s0.
109
-3.5
812.
318
-0.9
380.
574
0.28
70.
886
-0.7
660.
66-0
.05
-0.3
74-2
.06
-1.2
11-1
.596
Wo
od
and
pap
er p
rod
ucts
0.28
70.
212
2.99
4-0
.028
-0.2
280.
062
-1.2
91-0
.778
-0.8
25-2
.705
-0.1
5-0
.47
-0.6
950.
215
Petr
ole
um, c
oal
, and
min
eral
pro
duc
ts0.
634
-0.9
48-1
.618
-0.4
07-0
.796
0.75
1-2
.181
0.32
70.
364
-1.9
37-0
.213
-0.3
51-0
.624
-0.1
23C
hem
ical
, rub
ber
, and
pla
stic
pro
duc
ts-0
.501
-0.2
98.
442
0.98
7-0
.731
-0.1
86-1
.687
-0.6
020.
434
-1.8
18-0
.476
-0.6
-1.8
98-0
.527
Met
als
and
met
al p
rod
ucts
0.21
6-2
-0.0
46-1
.912
-1.6
51-0
.23
-2.4
240.
489
0.47
92.
229
-2.8
81-1
.799
-1.4
670.
086
Mo
tor
vehi
cles
and
oth
er t
rans
po
rt
-0.9
82-2
.172
-2.2
13-2
.878
-0.0
74-0
.277
-4.6
65-0
.971
-1.2
221.
158
-1.3
88-2
.708
-0.1
72-0
.018
equi
pm
ent
Ele
ctro
nic
equi
pm
ent
4.18
7-0
.704
0.54
30.
625
0.42
9-0
.558
-1.1
18-1
.505
1.35
70.
401
-1.7
99-0
.898
-3.2
962.
257
Oth
er m
achi
nery
0.03
2-0
.021
7.23
21.
597
-0.5
57-0
.318
-1.9
96-1
.136
-0.3
840.
561
-1.5
55-1
.172
-3.3
820.
99Tr
ade
and
tra
nsp
ort
atio
n1.
676
0.33
75.
282
0.71
10.
567
-0.1
940.
350.
242
0.48
70.
502
-0.2
02-0
.132
0.11
8-0
.008
Fina
ncia
l ser
vice
s, b
anki
ng,
1.64
90.
417
0.40
80.
968
1.04
7-0
.319
0.29
20.
137
0.41
0.59
3-0
.516
-0.1
580.
123
0.28
6an
d in
sura
nce
Co
mm
unic
atio
n, h
ealth
, ed
ucat
ion,
3.
018
3.77
424
.508
3.53
41.
124
-0.9
870.
442
-0.0
370.
378
0.90
9-6
.809
-0.7
40.
316
-0.2
39an
d p
ublic
ser
vice
sR
ecre
atio
nal a
nd o
ther
ser
vice
s1.
865
0.21
15.
592
0.29
61.
75-0
.208
0.47
0.08
60.
473
0.48
7-2
.055
-0.2
810.
20.
013
Ho
usin
g, u
tiliti
es, a
nd c
ons
truc
tion
1.25
20.
373
-0.9
220.
719
0.52
6-0
.282
0.23
7-0
.05
0.15
50.
407
-0.2
28-0
.148
0.17
7-0
.02
Tota
l1.
451
0.87
4.49
80.
977
0.66
2-0
.28
0.35
1-0
.051
0.2
0.25
5-0
.845
-0.1
54-0
.006
-0.0
97
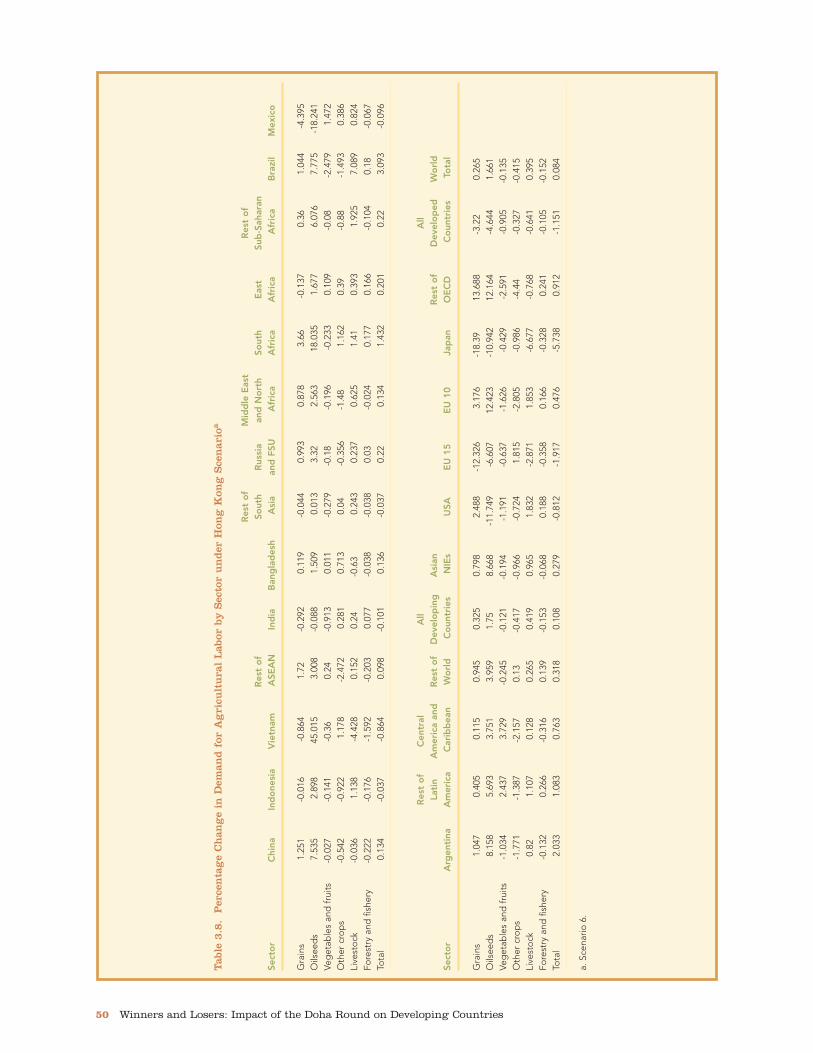
Carnegie Endowment for International Peace 49
Tab
le 3
.7 (
con
tin
ued
).
Per
cen
tag
e C
han
ge
in D
eman
d f
or U
nsk
ille
d L
abor
by
Sec
tor
un
der
Hon
g K
ong
Sce
nar
ioa
Res
t o
fC
entr
alA
llA
llLa
tin
Am
eric
a an
dR
est
of
Dev
elo
pin
gA
sian
Res
t o
f D
evel
op
edW
orl
dSe
cto
rA
rgen
tina
Am
eric
aC
arib
bea
nW
orl
dC
oun
trie
sN
IEs
USA
EU
15
EU
10
Jap
anO
EC
DC
oun
trie
sTo
tal
Mea
t an
d d
airy
pro
duc
ts2.
065
2.78
40.
687
2.68
3.62
1.82
2.11
2-4
.982
4.35
6-1
1.39
52.
043
-0.9
042.
211
Sug
ar2.
579
4.10
313
.435
5.51
82.
161
0.58
5-0
.727
-11.
563
-0.2
47-1
6.37
16.
324
-5.3
111.
236
Pro
cess
ed fo
od
s1.
555
0.16
8-0
.596
1.17
7-0
.156
-0.0
270.
842
-1.1
3-0
.091
-1.8
240.
438
-0.5
39-0
.215
Bev
erag
es a
nd t
ob
acco
0.12
40.
177
-0.4
34-0
.006
0.20
90.
078
0.19
90.
071
-0.7
13-0
.347
-0.0
57-0
.193
0.14
5C
rud
e o
il an
d n
atur
al g
as-0
.279
0.23
4-0
.087
0.06
-0.0
01-0
.518
0.01
3-0
.01
0.53
5-0
.268
-0.0
650.
010
Text
iles
-4.2
67-1
.656
6.15
8-0
.846
1.72
55.
479
-3.2
37-0
.889
-4.0
842.
276
-5.5
58-0
.435
1.55
9A
pp
arel
-1.3
36-0
.364
2.70
4-0
.318
5.02
43.
81-4
.163
-2.9
89-5
.436
-2.8
64-5
.997
-2.6
854.
251
Leat
her
and
foo
twea
r-3
.472
-2.9
36-4
.737
-3.3
293.
596
2.01
7-6
.424
-0.9
03-4
.532
-6.5
18-4
.366
-2.2
893.
123
Oth
er m
anuf
actu
res
-1.3
94-2
.619
-2.9
03-0
.959
-0.2
264.
076
3.62
4-0
.281
-0.8
02-0
.068
-6.7
34-0
.044
-0.2
01W
oo
d a
nd p
aper
pro
duc
ts-0
.925
-0.2
83-1
.323
-0.1
19-0
.114
-0.1
410.
189
0.30
9-0
.186
-0.0
29-0
.214
0.12
2-0
.051
Petr
ole
um, c
oal
, and
min
eral
pro
duc
ts-0
.397
0.18
5-1
.051
0.32
80.
271
0.03
90.
028
0.36
-0.5
330.
13-0
.267
0.02
0.24
4C
hem
ical
, rub
ber
, and
pla
stic
pro
duc
ts-2
.237
-1.4
96-1
.516
-0.2
09-0
.515
0.64
0.01
30.
268
-0.6
650.
48-0
.738
0.14
8-0
.365
Met
als
and
met
al p
rod
ucts
-1.5
890.
04-1
.012
1.39
6-0
.095
-0.4
95-0
.13
0.29
20.
462
0.6
-0.7
620.
117
-0.0
41M
oto
r ve
hicl
es a
nd o
ther
tra
nsp
ort
0.
941
-2.6
160.
635
-1.6
13-1
.011
0.68
4-0
.49
0.43
5-1
.003
2.30
9-0
.871
0.30
2-0
.594
equi
pm
ent
Ele
ctro
nic
equi
pm
ent
-4.4
22-3
.233
0.76
60.
079
2.03
7-2
.438
-0.1
030.
267
0.79
4-0
.096
-0.3
-0.2
361.
366
Oth
er m
achi
nery
-4.1
84-4
.439
-0.6
780.
267
-0.1
32-0
.98
0.04
20.
719
0.14
60.
52-0
.47
0.26
6-0
.024
Trad
e an
d t
rans
po
rtat
ion
0.07
90.
183
0.27
80.
880.
704
-0.4
090.
050.
203
0.05
0.20
10.
155
0.08
70.
534
Fina
ncia
l ser
vice
s, b
anki
ng,
0.21
30.
237
0.40
10.
748
0.63
-0.2
390.
026
0.12
3-0
.018
0.15
0.07
10.
034
0.43
1an
d in
sura
nce
Co
mm
unic
atio
n, h
ealth
, ed
ucat
ion,
0.
615
0.07
21.
120.
898
1.45
70.
480.
091
0.24
40.
377
0.62
50.
431
0.30
61.
033
and
pub
lic s
ervi
ces
Rec
reat
iona
l and
oth
er s
ervi
ces
0.15
40.
192
0.34
60.
716
0.80
9-0
.642
0.06
50.
196
-0.0
970.
220.
114
0.06
20.
518
Ho
usin
g, u
tiliti
es, a
nd c
ons
truc
tion
0.15
20.
050.
053
0.49
70.
578
0.05
10.
038
0.09
3-0
.09
0.17
80.
009
0.06
90.
479
Tota
l0.
021
-0.0
260.
30.
541
0.75
9-0
.027
0.02
60.
114
-0.1
160.
276
-0.0
510.
076
0.58
3
a. S
cena
rio 6
.
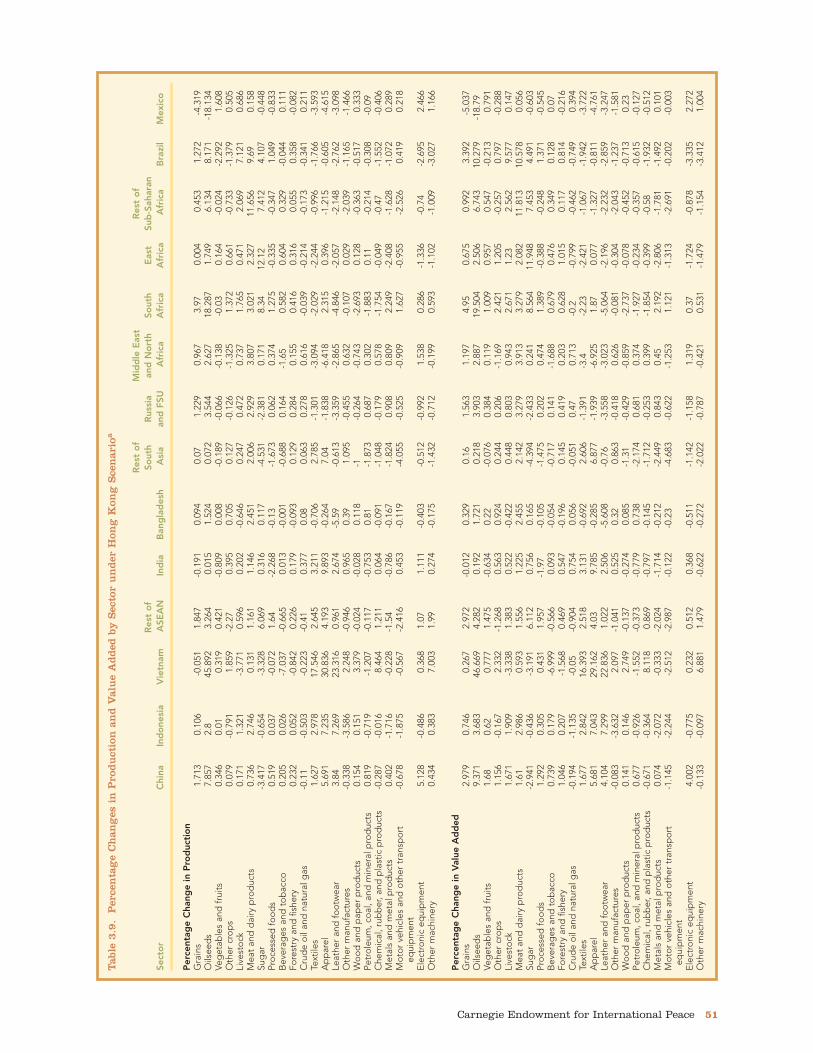
50 Winners and Losers: Impact of the Doha Round on Developing Countries
Tab
le 3
.8.
Per
cen
tag
e C
han
ge
in D
eman
d f
or A
gri
cult
ura
l L
abor
by
Sec
tor
un
der
Hon
g K
ong
Sce
nar
ioa
Res
t o
fM
idd
le E
ast
Res
t o
f R
est
of
Sout
hR
ussi
aan
d N
ort
hSo
uth
Eas
t Su
b-S
ahar
anSe
cto
rC
hina
Ind
one
sia
Vie
tnam
ASE
AN
Ind
iaB
ang
lad
esh
Asi
aan
d F
SUA
fric
aA
fric
aA
fric
aA
fric
aB
razi
lM
exic
o
Gra
ins
1.25
1-0
.016
-0.8
641.
72-0
.292
0.11
9-0
.044
0.99
30.
878
3.66
-0.1
370.
361.
044
-4.3
95O
ilsee
ds
7.53
52.
898
45.0
153.
008
-0.0
881.
509
0.01
33.
322.
563
18.0
351.
677
6.07
67.
775
-18.
241
Veg
etab
les
and
frui
ts-0
.027
-0.1
41-0
.36
0.24
-0.9
130.
011
-0.2
79-0
.18
-0.1
96-0
.233
0.10
9-0
.08
-2.4
791.
472
Oth
er c
rop
s-0
.542
-0.9
221.
178
-2.4
720.
281
0.71
30.
04-0
.356
-1.4
81.
162
0.39
-0.8
8-1
.493
0.38
6Li
vest
ock
-0.0
361.
138
-4.4
280.
152
0.24
-0.6
30.
243
0.23
70.
625
1.41
0.39
31.
925
7.08
90.
824
Fore
stry
and
fish
ery
-0.2
22-0
.176
-1.5
92-0
.203
0.07
7-0
.038
-0.0
380.
03-0
.024
0.17
70.
166
-0.1
040.
18-0
.067
Tota
l0.
134
-0.0
37-0
.864
0.09
8-0
.101
0.13
6-0
.037
0.22
0.13
41.
432
0.20
10.
223.
093
-0.0
96
Res
t o
f C
entr
al
All
All
Lati
n A
mer
ica
and
Res
t o
f D
evel
op
ing
Asi
anR
est
of
Dev
elo
ped
Wo
rld
Sect
or
Arg
enti
naA
mer
ica
Car
ibb
ean
Wo
rld
Co
untr
ies
NIE
sU
SAE
U 1
5E
U 1
0Ja
pan
OE
CD
Co
untr
ies
Tota
l
Gra
ins
1.04
70.
405
0.11
50.
945
0.32
50.
798
2.48
8-1
2.32
63.
176
-18.
3913
.688
-3.2
20.
265
Oils
eed
s8.
158
5.69
33.
751
3.95
91.
758.
668
-11.
749
-6.6
0712
.423
-10.
942
12.1
64-4
.644
1.66
1Ve
get
able
s an
d fr
uits
-1.0
342.
437
3.72
9-0
.245
-0.1
21-0
.194
-1.1
91-0
.637
-1.6
26-0
.429
-2.5
91-0
.905
-0.1
35O
ther
cro
ps
-1.7
71-1
.387
-2.1
570.
13-0
.417
-0.9
66-0
.724
1.81
5-2
.805
-0.9
86-4
.44
-0.3
27-0
.415
Live
sto
ck0.
821.
107
0.12
80.
265
0.41
90.
965
1.83
2-2
.871
1.85
3-6
.677
-0.7
68-0
.641
0.39
5Fo
rest
ry a
nd fi
sher
y-0
.132
0.26
6-0
.316
0.13
9-0
.153
-0.0
680.
188
-0.3
580.
166
-0.3
280.
241
-0.1
05-0
.152
Tota
l2.
033
1.08
30.
763
0.31
80.
108
0.27
9-0
.812
-1.9
170.
476
-5.7
380.
912
-1.1
510.
084
a. S
cena
rio 6
.

Carnegie Endowment for International Peace 51
Tab
le 3
.9.
Per
cen
tag
e C
han
ges
in
Pro
du
ctio
n a
nd
Val
ue
Ad
ded
by
Sec
tor
un
der
Hon
g K
ong
Sce
nar
ioa
Res
t o
fM
idd
le E
ast
Res
t o
f R
est
of
Sout
hR
ussi
aan
d N
ort
hSo
uth
Eas
t Su
b-S
ahar
anSe
cto
rC
hina
Ind
one
sia
Vie
tnam
ASE
AN
Ind
iaB
ang
lad
esh
Asi
aan
d F
SUA
fric
aA
fric
aA
fric
aA
fric
aB
razi
lM
exic
o
Per
cent
age
Cha
nge
in P
rod
ucti
on
Gra
ins
1.71
30.
106
-0.0
511.
847
-0.1
910.
094
0.07
1.22
90.
967
3.97
0.00
40.
453
1.27
2-4
.319
Oils
eed
s7.
857
2.8
45.8
923.
264
0.01
51.
524
0.07
23.
544
2.62
718
.287
1.74
96.
134
8.17
1-1
8.13
4Ve
get
able
s an
d fr
uits
0.34
60.
010.
319
0.42
1-0
.809
0.00
8-0
.189
-0.0
66-0
.138
-0.0
30.
164
-0.0
24-2
.292
1.60
8O
ther
cro
ps
0.07
9-0
.791
1.85
9-2
.27
0.39
50.
705
0.12
7-0
.126
-1.3
251.
372
0.66
1-0
.733
-1.3
790.
505
Live
sto
ck0.
171
1.32
1-3
.771
0.59
60.
202
-0.6
460.
247
0.47
20.
737
1.76
50.
471
2.06
97.
121
0.68
6M
eat
and
dai
ry p
rod
ucts
0.73
62.
746
0.13
11.
161
1.14
62.
451
2.00
62.
929
3.80
73.
021
2.32
711
.656
9.69
0.15
8Su
gar
-3.4
17-0
.654
-3.3
286.
069
0.31
60.
117
-4.5
31-2
.381
0.17
18.
3412
.12
7.41
24.
107
-0.4
48Pr
oce
ssed
foo
ds
0.51
90.
037
-0.0
721.
64-2
.268
-0.1
3-1
.673
0.06
20.
374
1.27
5-0
.335
-0.3
471.
049
-0.8
33B
ever
ages
and
to
bac
co0.
205
0.02
6-7
.037
-0.6
650.
013
-0.0
01-0
.688
0.16
4-1
.65
0.58
20.
604
0.32
9-0
.044
0.11
1Fo
rest
ry a
nd fi
sher
y0.
232
0.05
2-0
.842
0.22
60.
179
-0.0
930.
129
0.28
40.
155
0.41
60.
316
0.05
50.
358
-0.0
82C
rud
e o
il an
d n
atur
al g
as-0
.11
-0.5
03-0
.223
-0.4
10.
377
0.08
0.06
30.
278
0.61
6-0
.039
-0.2
14-0
.173
-0.3
410.
211
Text
iles
1.62
72.
978
17.5
462.
645
3.21
1-0
.706
2.78
5-1
.301
-3.0
94-2
.029
-2.2
44-0
.996
-1.7
66-3
.593
Ap
par
el5.
691
7.23
530
.836
4.19
39.
893
-0.2
647.
04-1
.838
-6.4
182.
315
0.39
6-1
.215
-0.6
05-4
.615
Leat
her
and
foo
twea
r3.
847.
269
23.3
160.
961
2.67
4-5
.59
-0.6
13-3
.359
-2.8
65-4
.846
-2.0
57-2
.148
-2.7
62-3
.098
Oth
er m
anuf
actu
res
-0.3
38-3
.586
2.24
8-0
.946
0.96
50.
391.
095
-0.4
550.
632
-0.1
070.
029
-2.0
39-1
.165
-1.4
66W
oo
d a
nd p
aper
pro
duc
ts0.
154
0.15
13.
379
-0.0
24-0
.028
0.11
8-1
-0.2
64-0
.743
-2.6
930.
128
-0.3
63-0
.517
0.33
3Pe
tro
leum
, co
al, a
nd m
iner
al p
rod
ucts
0.81
9-0
.719
-1.2
07-0
.117
-0.7
530.
81-1
.873
0.68
70.
302
-1.8
830.
11-0
.214
-0.3
08-0
.09
Che
mic
al, r
ubb
er, a
nd p
last
ic p
rod
ucts
-0.2
87-0
.016
8.46
41.
211
0.06
4-0
.091
-1.0
48-0
.179
0.57
8-1
.754
-0.0
49-0
.47
-1.5
52-0
.406
Met
als
and
met
al p
rod
ucts
0.40
2-1
.716
-0.2
28-1
.54
-0.7
86-0
.167
-1.8
240.
908
0.80
92.
249
-2.4
08-1
.628
-1.0
720.
289
Mo
tor
vehi
cles
and
oth
er t
rans
po
rt-0
.678
-1.8
75-0
.567
-2.4
160.
453
-0.1
19-4
.055
-0.5
25-0
.909
1.62
7-0
.955
-2.5
260.
419
0.21
8eq
uip
men
tE
lect
roni
c eq
uip
men
t5.
128
-0.4
860.
368
1.07
1.11
1-0
.403
-0.5
12-0
.992
1.53
80.
286
-1.3
36-0
.74
-2.6
952.
466
Oth
er m
achi
nery
0.43
40.
383
7.00
31.
990.
274
-0.1
75-1
.432
-0.7
12-0
.199
0.59
3-1
.102
-1.0
09-3
.027
1.16
6
Per
cent
age
Cha
nge
in V
alue
Ad
ded
Gra
ins
2.97
90.
746
0.26
72.
972
-0.0
120.
329
0.16
1.56
31.
197
4.95
0.67
50.
992
3.39
2-5
.037
Oils
eed
s9.
371
3.68
346
.669
4.28
20.
192
1.72
10.
218
3.90
32.
887
19.5
042.
506
6.74
310
.279
-18.
79Ve
get
able
s an
d fr
uits
1.68
0.62
0.77
71.
475
-0.6
340.
22-0
.076
0.38
40.
119
1.00
90.
957
0.54
7-0
.213
0.79
1O
ther
cro
ps
1.15
6-0
.167
2.33
2-1
.268
0.56
30.
924
0.24
40.
206
-1.1
692.
421
1.20
5-0
.257
0.79
7-0
.288
Live
sto
ck1.
671
1.90
9-3
.338
1.38
30.
522
-0.4
220.
448
0.80
30.
943
2.67
11.
232.
562
9.57
70.
147
Mea
t an
d d
airy
pro
duc
ts1.
612.
986
0.59
31.
556
1.22
52.
455
2.14
23.
279
3.91
33.
279
2.08
211
.813
10.5
780.
056
Sug
ar-2
.941
-0.4
36-3
.191
6.11
20.
756
0.16
5-4
.394
-2.4
330.
241
8.56
411
.948
7.45
34.
491
-0.6
03Pr
oce
ssed
foo
ds
1.29
20.
305
0.43
11.
957
-1.9
7-0
.105
-1.4
750.
202
0.47
41.
389
-0.3
88-0
.248
1.37
1-0
.545
Bev
erag
es a
nd t
ob
acco
0.73
90.
179
-6.9
99-0
.566
0.09
3-0
.054
-0.7
170.
141
-1.6
880.
679
0.47
60.
349
0.12
80.
07Fo
rest
ry a
nd fi
sher
y1.
046
0.20
7-1
.568
0.46
90.
547
-0.1
960.
145
0.41
90.
203
0.62
81.
015
0.11
70.
814
-0.2
16C
rud
e o
il an
d n
atur
al g
as-0
.194
-1.1
35-0
.05
-0.9
040.
754
0.05
6-0
.051
0.47
0.71
3-0
.2-0
.799
-0.4
62-0
.749
0.39
4Te
xtile
s1.
677
2.84
216
.393
2.51
83.
131
-0.6
922.
606
-1.3
91-3
.4-2
.23
-2.4
21-1
.067
-1.9
42-3
.722
Ap
par
el5.
681
7.04
329
.162
4.03
9.78
5-0
.285
6.87
7-1
.939
-6.9
251.
870.
077
-1.3
27-0
.811
-4.7
61Le
athe
r an
d fo
otw
ear
4.10
47.
299
22.8
361.
022
2.50
6-5
.608
-0.7
6-3
.558
-3.0
23-5
.064
-2.1
96-2
.232
-2.8
59-3
.247
Oth
er m
anuf
actu
res
-0.0
83-3
.632
2.09
7-1
.041
0.52
50.
320.
863
-0.4
180.
626
-0.0
81-0
.304
-2.0
43-1
.237
-1.5
81W
oo
d a
nd p
aper
pro
duc
ts0.
141
0.14
62.
749
-0.1
37-0
.274
0.08
5-1
.31
-0.4
29-0
.859
-2.7
37-0
.078
-0.4
52-0
.713
0.23
Petr
ole
um, c
oal
, and
min
eral
pro
duc
ts0.
677
-0.9
26-1
.552
-0.3
73-0
.779
0.73
8-2
.174
0.68
10.
374
-1.9
27-0
.234
-0.3
57-0
.615
-0.1
27C
hem
ical
, rub
ber
, and
pla
stic
pro
duc
ts-0
.671
-0.3
648.
118
0.86
9-0
.797
-0.1
45-1
.712
-0.2
530.
399
-1.8
54-0
.399
-0.5
8-1
.932
-0.5
12M
etal
s an
d m
etal
pro
duc
ts0.
074
-2.0
72-0
.333
-2.0
24-1
.714
-0.2
12-2
.449
0.84
30.
452.
192
-2.8
06-1
.781
-1.4
920.
101
Mo
tor
vehi
cles
and
oth
er t
rans
po
rt
-1.1
45-2
.244
-2.5
12-2
.987
-0.1
22-0
.23
-4.6
83-0
.622
-1.2
531.
121
-1.3
13-2
.691
-0.2
02-0
.003
equi
pm
ent
Ele
ctro
nic
equi
pm
ent
4.00
2-0
.775
0.23
20.
512
0.36
8-0
.511
-1.1
42-1
.158
1.31
90.
37-1
.724
-0.8
78-3
.335
2.27
2O
ther
mac
hine
ry-0
.133
-0.0
976.
881
1.47
9-0
.622
-0.2
72-2
.022
-0.7
87-0
.421
0.53
1-1
.479
-1.1
54-3
.412
1.00
4
52 Winners and Losers: Impact of the Doha Round on Developing Countries
Tab
le 3
.9 (
con
tin
ued
).
Per
cen
tag
e C
han
ges
in
Pro
du
ctio
n a
nd
Val
ue
Ad
ded
by
Sec
tor
un
der
Hon
g K
ong
Sce
nar
ioa
Res
t o
f C
entr
al
All
All
Lati
n A
mer
ica
and
Res
t o
f D
evel
op
ing
Asi
anR
est
of
Dev
elo
ped
Wo
rld
Sect
or
Arg
enti
naA
mer
ica
Car
ibb
ean
Wo
rld
Co
untr
ies
NIE
sU
SAE
U 1
5E
U 1
0Ja
pan
OE
CD
Co
untr
ies
Tota
l
Per
cent
age
Cha
nge
in P
rod
ucti
on
Gra
ins
1.21
90.
440.
233
1.28
0.80
90.
819
2.47
5-1
2.48
13.
29-1
8.17
213
.889
-3.9
3-0
.66
Oils
eed
s8.
354
5.68
3.86
24.
266
3.64
28.
507
-11.
853
-6.9
1812
.646
-10.
864
12.4
64-7
.738
-0.0
13Ve
get
able
s an
d fr
uits
-0.9
952.
423
3.87
-0.0
630.
263
-0.1
51-1
.202
-0.5
36-1
.551
-0.1
98-2
.499
-0.7
69-0
.022
Oth
er c
rop
s-1
.765
-1.4
24-2
.072
0.54
7-0
.387
-0.9
26-0
.729
1.83
9-2
.636
-0.9
44-4
.385
-0.0
03-0
.228
Live
sto
ck0.
744
1.09
70.
210.
667
0.74
1.04
91.
575
-3.1
492.
068
-6.7
53-0
.486
-1.0
58-0
.025
Mea
t an
d d
airy
pro
duc
ts1.
353
2.41
10.
244
2.3
2.78
21.
843
1.95
5-4
.62
4.47
8-1
0.75
41.
785
-1.5
3-0
.399
Sug
ar1.
977
3.83
13.0
995.
373
1.87
60.
741
-0.7
36-1
1.21
1-0
.012
-15.
257
6.34
2-5
.559
-2.0
1Pr
oce
ssed
foo
ds
1.28
90.
123
-0.8
650.
935
0.15
-0.1
470.
65-1
.014
0.06
8-1
.058
0.54
2-0
.299
-0.1
4B
ever
ages
and
to
bac
co0.
048
0.16
5-0
.55
-0.0
51-0
.061
0.24
70.
135
0.19
3-0
.535
-0.1
210.
008
0.07
50.
031
Fore
stry
and
fish
ery
0.05
0.43
4-0
.011
0.60
90.
178
0.06
30.
222
-0.4
130.
48-0
.302
0.42
9-0
.098
0.05
Cru
de
oil
and
nat
ural
gas
-0.2
420.
358
-0.0
140.
219
0.30
4-0
.497
0.02
10.
016
2.23
9-0
.33
-0.0
330.
022
0.22
7Te
xtile
s-4
.147
-1.5
456.
385
-0.6
980.
882
5.76
4-3
.098
-0.7
16-3
.696
2.48
3-5
.296
-0.5
770.
216
Ap
par
el-1
.181
-0.1
782.
978
-0.2
312.
855
4.08
5-3
.84
-2.7
88-5
.089
-2.7
02-5
.603
-2.8
01-0
.365
Leat
her
and
foo
twea
r-3
.451
-2.7
73-4
.641
-3.2
041.
249
2.21
7-6
.035
-0.7
26-4
.215
-6.0
33-4
.108
-2.1
78-0
.224
Oth
er m
anuf
actu
res
-0.9
01-2
.473
-2.7
88-0
.951
-0.4
54.
373
3.63
5-0
.265
-0.5
53-0
.058
-6.5
250.
231
-0.0
08W
oo
d a
nd p
aper
pro
duc
ts-0
.68
-0.0
76-1
.178
-0.0
33-0
.199
0.15
50.
189
0.29
90.
128
-0.0
38-0
.13
0.16
70.
094
Petr
ole
um, c
oal
, and
min
eral
pro
duc
ts-0
.15
0.22
4-0
.915
0.44
80.
281
0.67
90.
027
0.39
4-0
.293
0.22
3-0
.167
0.19
40.
23C
hem
ical
, rub
ber
, and
pla
stic
pro
duc
ts-1
.659
-1.1
55-1
.284
-0.1
79-0
.284
1.07
50.
032
0.35
-0.2
870.
547
-0.5
910.
252
0.11
9M
etal
s an
d m
etal
pro
duc
ts-1
.178
0.31
8-0
.743
1.51
20.
216
-0.0
51-0
.108
0.36
60.
865
0.62
4-0
.64
0.18
30.
192
Mo
tor
vehi
cles
and
oth
er t
rans
po
rt1.
544
-2.1
511.
437
-1.3
7-0
.463
1.08
8-0
.436
0.53
7-0
.456
2.31
7-0
.583
0.45
10.
308
equi
pm
ent
Ele
ctro
nic
equi
pm
ent
-3.8
16-2
.923
1.03
80.
105
2.14
3-1
.855
-0.0
950.
307
1.18
2-0
.03
-0.1
86-0
.204
0.30
1O
ther
mac
hine
ry-3
.641
-4.2
05-0
.511
0.37
50.
188
-0.5
970.
053
0.77
70.
571
0.53
9-0
.353
0.31
80.
292
Per
cent
age
Cha
nge
in V
alue
Ad
ded
Gra
ins
3.59
81.
803
1.54
62.
016
1.29
21.
562.
338
-14.
534.
025
-20.
946
15.5
65-5
.063
-0.7
63O
ilsee
ds
10.8
97.
165
5.23
55.
083
3.88
59.
502
-11.
878
-8.7
5513
.345
-13.
731
13.8
89-9
.005
-0.6
26Ve
get
able
s an
d fr
uits
1.46
63.
864
5.21
20.
843
1.06
60.
534
-1.3
36-2
.967
-0.8
31-3
.548
-0.9
87-2
.117
0.23
9O
ther
cro
ps
0.71
-0.0
13-0
.758
1.18
20.
14-0
.227
-0.8
69-0
.657
-2.0
09-4
.088
-2.8
38-1
.272
-0.4
78Li
vest
ock
3.36
62.
516
1.55
91.
349
1.74
21.
661.
683
-5.3
112.
675
-9.6
0.87
1-2
.251
0.32
8M
eat
and
dai
ry p
rod
ucts
2.05
92.
784
0.66
52.
631
2.95
72.
12.
09-4
.92
4.60
3-1
1.31
42.
083
-1.5
1-0
.481
Sug
ar2.
571
4.10
213
.404
5.47
42.
588
0.86
3-0
.748
-11.
506
-0.0
11-1
6.29
56.
366
-6.4
47-2
.748
Pro
cess
ed fo
od
s1.
547
0.16
7-0
.621
1.13
50.
262
0.24
80.
819
-1.0
670.
145
-1.7
340.
477
-0.2
76-0
.118
Bev
erag
es a
nd t
ob
acco
0.11
70.
177
-0.4
6-0
.055
0.04
0.35
60.
175
0.13
5-0
.477
-0.2
57-0
.018
0.08
0.07
Fore
stry
and
fish
ery
-0.0
170.
825
-0.1
720.
948
0.50
60.
065
0.33
3-0
.671
0.53
9-0
.656
0.51
8-0
.295
0.16
9C
rud
e o
il an
d n
atur
al g
as-0
.661
0.55
2-0
.115
0.36
20.
28-1
.096
0.02
80.
071.
851
-0.5
08-0
.122
-0.0
130.
201
Text
iles
-4.2
83-1
.657
6.1
-0.9
170.
754
5.77
7-3
.26
-0.8
29-3
.857
2.36
1-5
.522
-0.9
91-0
.158
Ap
par
el-1
.354
-0.3
652.
646
-0.3
912.
527
4.09
6-4
.184
-2.9
29-5
.212
-2.7
79-5
.961
-3.0
53-0
.755
Leat
her
and
foo
twea
r-3
.487
-2.9
37-4
.783
-3.3
840.
673
2.29
8-6
.446
-0.8
42-4
.306
-6.4
36-4
.33
-2.6
43-0
.909
Oth
er m
anuf
actu
res
-1.4
1-2
.62
-2.9
52-1
.03
-0.3
764.
368
3.59
9-0
.222
-0.5
650.
011
-6.7
0.19
1-0
.014
Wo
od
and
pap
er p
rod
ucts
-0.9
41-0
.284
-1.3
76-0
.195
-0.3
740.
139
0.16
40.
368
0.05
30.
049
-0.1
770.
179
0.08
7Pe
tro
leum
, co
al, a
nd m
iner
al p
rod
ucts
-0.3
920.
186
-1.0
370.
348
0.10
10.
301
0.01
0.43
2-0
.299
0.23
7-0
.226
0.16
30.
14C
hem
ical
, rub
ber
, and
pla
stic
pro
duc
ts-2
.255
-1.4
97-1
.568
-0.2
83-0
.677
0.92
7-0
.013
0.32
5-0
.428
0.56
-0.7
020.
174
0.00
4M
etal
s an
d m
etal
pro
duc
ts-1
.603
0.03
9-1
.058
1.33
3-0
.213
-0.2
12-0
.153
0.35
10.
699
0.68
-0.7
250.
131
0.06
5M
oto
r ve
hicl
es a
nd o
ther
tra
nsp
ort
0.
924
-2.6
170.
588
-1.6
8-0
.874
0.96
6-0
.514
0.49
4-0
.767
2.38
9-0
.835
0.33
40.
155
equi
pm
ent
Ele
ctro
nic
equi
pm
ent
-4.4
39-3
.235
0.71
1-0
.008
1.38
3-2
.158
-0.1
280.
324
1.03
4-0
.018
-0.2
64-0
.119
0.13
1O
ther
mac
hine
ry-4
.201
-4.4
4-0
.733
0.20
8-0
.349
-0.6
990.
016
0.77
50.
383
0.59
9-0
.435
0.26
60.
174
a. S
cena
rio 6
.

electronics, and machinery, there is more signifi-cant redistribution of production.
It is interesting to note the different adjustmentpattern in the textile and apparel sectorsamong Japan, the Asian NIEs, and other devel-oped countries in response to the expansion ofapparel production in developing countries. Inmost high-income countries, both textile andapparel industries decline, while in Japanapparel production declines but textile produc-tion increases. In the Asian NIEs both sectorsincrease. This disparity in adjustment reflectscontinuing trends in Asia to integrate produc-tion across the region based on changing com-parative advantage. A reduction of tradebarriers will accelerate this trend and enableeven greater vertical integration betweendeveloped and developing Asian countries inmanufacturing production. Similar attempts atvertical integration between the United States,Mexico, and Central America appear not to besufficient to sustain the U.S. textile sector,based on the simulation results.
The structural adjustment induced by Doha lib-eralization in some developing countries seemsopposite to their comparative advantage in theproduction of labor-intensive products. Plausibleexplanations have already been discussed.Liberalization in some world manufacturesmarkets increases competition and pushesdown world prices. Labor-intensive sectors insome developing countries cannot attractcapital under conditions of reduced profitabilityfrom lower world prices. This leads labor andcapital to remain in (or return to) agriculturalactivities in those countries. This is reinforced tosome extent by the rise in world food prices,driven by the elimination of agricultural exportsubsidies, domestic support, and border protec-tion in developed countries.
Adjustments in production structures redis-tribute value added among different sectors
within countries and among countries. Thegains and losses produce overall small netgains for both developed countries and devel-oping countries as groups, with developingcountries gaining slightly more in percentageterms, although from a much lower base. Mostindividual developing countries and regionsgain value added in labor-intensive manufac-tures and agriculture. Two developing countriessuffer very small losses in value added(Bangladesh and Mexico), while East Africanand Sub-Saharan African countries see nochange. The EU 15 and Japan experience smallnet gains, mainly from capital-intensive manu-facturing. The United States experiences nochange. Value added increases in agricultureand food processing in high-income OECDcountries, such as Australia, Canada, and NewZealand, while they experience declines invalue added in their manufacturing sectors.
Adjustment Costs
Global trade models do not capture the costsincurred as economies adjust to trade reform.Most models assume that all resources are fullyemployed throughout the adjustment process.The Carnegie model does take account of pre-existing and continuing unemployment ofunskilled labor, but otherwise it shares theshortcomings of other models in this regard.
In reality, structural adjustment to trade-inducedchanges does not occur instantaneously orwithout cost. Some labor or capital will be idledtemporarily by changes in trade patterns, whichwill subtract from overall GDP and have a nega-tive impact on the individuals and householdsaffected. The effects are likely to be relativelygreater in developing countries, which typicallyhave less diversified economies and thereforefewer employment alternatives, than in devel-oped countries. For agricultural labor, adjust-ment costs may be very high becausealternative employment in rural areas may be
Carnegie Endowment for International Peace 53
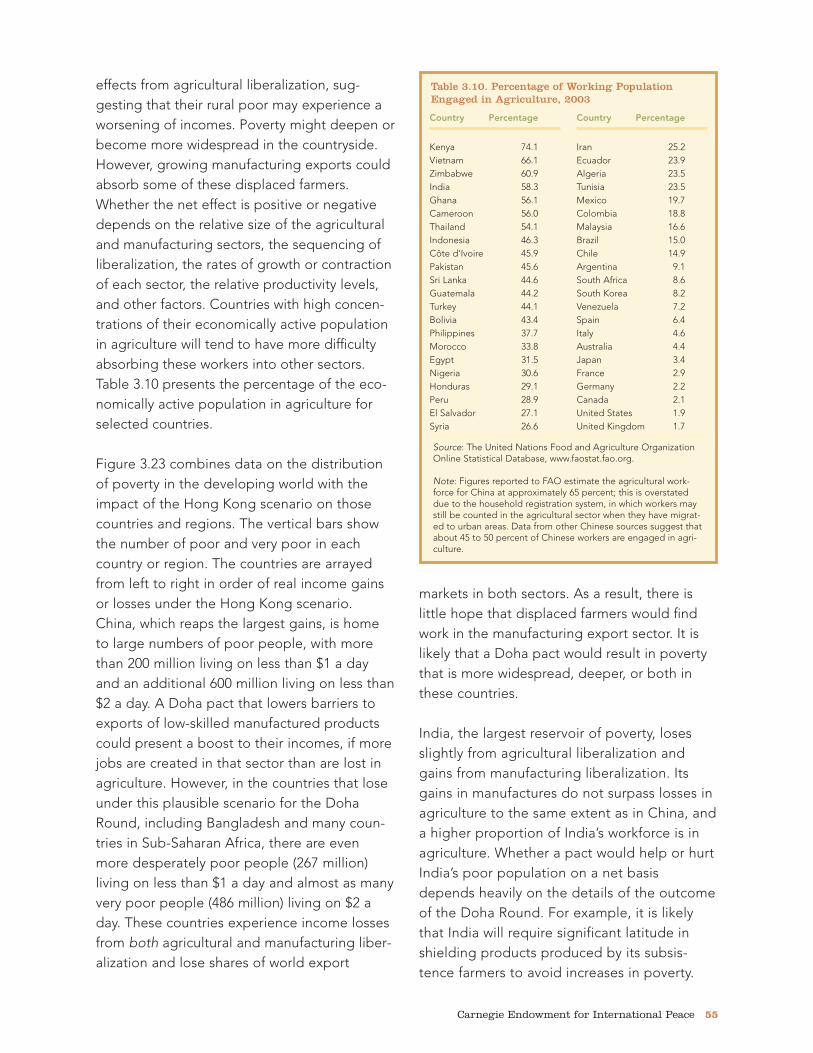
54 Winners and Losers: Impact of the Doha Round on Developing Countries
almost nonexistent. As a result, relocation willbe required to find alternative employment,increasing the time required and other costs tofind new work. Adjustment costs may be severeand long lasting for the poorest households,due to low levels of education and skills, andlimited savings that could be used to financerelocation or retraining. Most developing coun-tries lack the unemployment insurance, jobretraining, job placement, and other socialsafety nets that have been used, with varyingsuccess, in developed countries to facilitateadjustment to trade-related structural changes.
As a result of omitting these costs, appliedgeneral equilibrium models tend to systemati-cally overstate the net gains from trade orunderstate the net losses. However, it is diffi-cult to determine the scale of overstatementfor developing countries, because the subjecthas received relatively little study in thesecountries. A limited number of case studiesexist, but differences in methodologies and thedifficulty of isolating trade policy effects fromother causal factors limit their value in reachingbroader conclusions.
One recent study of adjustment to unilateraltrade opening by several developing countriesdoes offer useful insights, including the conclu-sion that structural unemployment induced bytrade policy changes is likely to be the majorsocial cost of adjustment in developing coun-tries.26 Overall, the study reinforces the needfor more systematic work. Further research onthe patterns and duration of adjustment costsin developing countries would be needed tomake comprehensive assessments of the netgains (or losses) from trade liberalization forthese countries.
Implications for Global Equity and Poverty
The overall gains to the world are divided fairly
evenly between developed and developingcountries. As a percentage of current GDP,developing countries gain somewhat moreunder the main scenarios. However, this distri-bution of benefits among economies offers onlya rough first approximation of the equity effectsof trade. It is also important to look at the sizesof populations affected—positively and nega-tively—by trade policy changes. It is particularlyimportant to assess, to the degree possible,whether the world’s poor people are likely to bebetter or worse off, because the poor are lessable to cope with adverse economic shocks,due to lower levels of education, savings, andmobility.
When the findings of the model are linked todata on the distribution of poverty, additionalinsight can be gained regarding the impact oftrade policy changes on equity and poverty.Some models have been used to estimate spe-cific numbers of poor people who would belifted out of poverty based on trade scenarios.Using this approach, various modelers haveprojected net reductions in the number of poorpeople in the developing world ranging from2.5 million to 686 million.27 The difference in theorder of magnitude of results illustrates thespeculative nature of such calculations. Thisapproach requires that a series of assumptionsbe employed, first about the impact of trade oneconomic growth and then about the impact ofeconomic growth on poverty. However actualdata on each of these linkages vary consider-ably, depending on the region studied and thehistorical period under review. The overall dataare contested and cannot be consideredrobust.
We adopt a more modest approach, consistentwith the limitations of AGE models and avail-able data. Most of the world’s poor people areconcentrated in rural areas and depend on agri-culture for their incomes. As discussed above,many developing countries experience negative
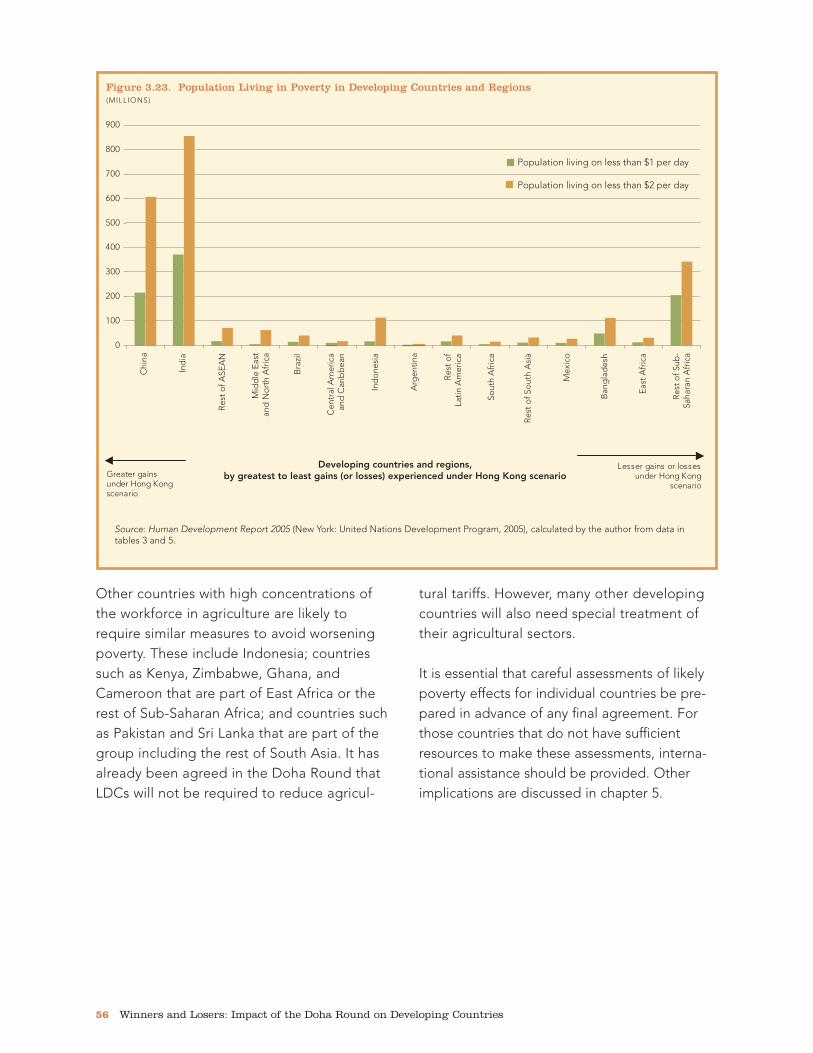
effects from agricultural liberalization, sug-gesting that their rural poor may experience aworsening of incomes. Poverty might deepen orbecome more widespread in the countryside.However, growing manufacturing exports couldabsorb some of these displaced farmers.Whether the net effect is positive or negativedepends on the relative size of the agriculturaland manufacturing sectors, the sequencing ofliberalization, the rates of growth or contractionof each sector, the relative productivity levels,and other factors. Countries with high concen-trations of their economically active populationin agriculture will tend to have more difficultyabsorbing these workers into other sectors.Table 3.10 presents the percentage of the eco-nomically active population in agriculture forselected countries.
Figure 3.23 combines data on the distributionof poverty in the developing world with theimpact of the Hong Kong scenario on thosecountries and regions. The vertical bars showthe number of poor and very poor in eachcountry or region. The countries are arrayedfrom left to right in order of real income gainsor losses under the Hong Kong scenario.China, which reaps the largest gains, is hometo large numbers of poor people, with morethan 200 million living on less than $1 a dayand an additional 600 million living on less than$2 a day. A Doha pact that lowers barriers toexports of low-skilled manufactured productscould present a boost to their incomes, if morejobs are created in that sector than are lost inagriculture. However, in the countries that loseunder this plausible scenario for the DohaRound, including Bangladesh and many coun-tries in Sub-Saharan Africa, there are evenmore desperately poor people (267 million)living on less than $1 a day and almost as manyvery poor people (486 million) living on $2 aday. These countries experience income lossesfrom both agricultural and manufacturing liber-alization and lose shares of world export
markets in both sectors. As a result, there islittle hope that displaced farmers would findwork in the manufacturing export sector. It islikely that a Doha pact would result in povertythat is more widespread, deeper, or both inthese countries.
India, the largest reservoir of poverty, losesslightly from agricultural liberalization andgains from manufacturing liberalization. Itsgains in manufactures do not surpass losses inagriculture to the same extent as in China, anda higher proportion of India’s workforce is inagriculture. Whether a pact would help or hurtIndia’s poor population on a net basisdepends heavily on the details of the outcomeof the Doha Round. For example, it is likelythat India will require significant latitude inshielding products produced by its subsis-tence farmers to avoid increases in poverty.
Carnegie Endowment for International Peace 55
Country Percentage
Kenya 74.1Vietnam 66.1Zimbabwe 60.9India 58.3Ghana 56.1Cameroon 56.0Thailand 54.1Indonesia 46.3Côte d’Ivoire 45.9Pakistan 45.6Sri Lanka 44.6Guatemala 44.2Turkey 44.1Bolivia 43.4Philippines 37.7Morocco 33.8Egypt 31.5Nigeria 30.6Honduras 29.1Peru 28.9El Salvador 27.1Syria 26.6
Country Percentage
Iran 25.2Ecuador 23.9Algeria 23.5Tunisia 23.5Mexico 19.7Colombia 18.8Malaysia 16.6Brazil 15.0Chile 14.9Argentina 9.1South Africa 8.6South Korea 8.2Venezuela 7.2Spain 6.4Italy 4.6Australia 4.4Japan 3.4France 2.9Germany 2.2Canada 2.1United States 1.9United Kingdom 1.7
Table 3.10. Percentage of Working PopulationEngaged in Agriculture, 2003
Source: The United Nations Food and Agriculture OrganizationOnline Statistical Database, www.faostat.fao.org.
Note: Figures reported to FAO estimate the agricultural work-force for China at approximately 65 percent; this is overstateddue to the household registration system, in which workers maystill be counted in the agricultural sector when they have migrat-ed to urban areas. Data from other Chinese sources suggest thatabout 45 to 50 percent of Chinese workers are engaged in agri-culture.

56 Winners and Losers: Impact of the Doha Round on Developing Countries
Other countries with high concentrations ofthe workforce in agriculture are likely torequire similar measures to avoid worseningpoverty. These include Indonesia; countriessuch as Kenya, Zimbabwe, Ghana, andCameroon that are part of East Africa or therest of Sub-Saharan Africa; and countries suchas Pakistan and Sri Lanka that are part of thegroup including the rest of South Asia. It hasalready been agreed in the Doha Round thatLDCs will not be required to reduce agricul-
tural tariffs. However, many other developingcountries will also need special treatment oftheir agricultural sectors.
It is essential that careful assessments of likelypoverty effects for individual countries be pre-pared in advance of any final agreement. Forthose countries that do not have sufficientresources to make these assessments, interna-tional assistance should be provided. Otherimplications are discussed in chapter 5.
0
001
002
003
004
005
006
007
008
009
sniag retaerG gnoK gnoH rednu
oiranecs
sessol ro sniag resseLgnoK gnoH rednuoiranecs
Developing countries and regions,by greatest to least gains (or losses) experienced under Hong Kong scenario
Chi
na
Ind
ia
Res
t o
f ASE
AN
Mid
dle
Eas
t a
nd N
ort
h A
fric
a
Bra
zil
Cen
tral
Am
eric
a a
nd C
arib
bea
n
Ind
one
sia
Arg
entin
a
Res
t o
fLa
tin A
mer
ica
Sout
h A
fric
a
Res
t o
f So
uth
Asi
a
Mex
ico
Ban
gla
des
h
Eas
t A
fric
a
Res
t o
f Sub
-Sa
hara
n A
fric
a
Population living on less than $1 per day
Population living on less than $2 per day
Figure 3.23. Population Living in Poverty in Developing Countries and Regions(MILLIONS)
Source: Human Development Report 2005 (New York: United Nations Development Program, 2005), calculated by the author from data intables 3 and 5.

Results from a number of newapplied general equilibriummodels have been reported inrecent months. In this chapter,we provide a nontechnical
explanation of some differentiating features ofthe models. The Carnegie results are comparedwith results from the newest World Bank modelfor agricultural and manufacturing liberalizationscenarios. Models that focus on agricultural lib-eralization, constructed by the Centre d’EtudesProspectives et d’Informations Internationales(CEPII) and the International Food PolicyResearch Institute (IFPRI), are compared withCarnegie and World Bank results for thatsector.28 A recent study by the United NationsConference on Trade and Development(UNCTAD) that models manufacturing liberal-ization is compared with results for that sectorfrom the Carnegie and World Bank models. Weexplore the main reasons for different findingsamong the models.
Most AGE models share common basic ele-ments, including their assumptions about howeconomies operate.29 These assumptions canbe described as standard neoclassical eco-nomic assumptions, where markets are perfectlycompetitive, firms maximize their profits, andhouseholds obtain the greatest possible utilityfrom their limited resources.30 When modelerschoose to make different assumptions, this willaffect the findings of the model. Differences in
certain key assumptions are discussed below.Models can also be distinguished based on thedata they use, their scope, the type of tradepolicy scenarios they choose to simulate, andwhether they are modeling what are termedstatic gains or dynamic gains from trade.
Data
Clearly, the quality of data used in a model is akey determinant of the reliability of the model’sresults. Differences in data inputs in differentmodels will produce different findings. Manymodels use the same basic data about theglobal economy and trading patterns. Modelersmay also incorporate additional data from othersources, as we have done. The most commonlyused basic data set on global trade is the data-base built by the Global Trade Analysis Project(GTAP).31 This evolving database was updatedin late 2004 to incorporate newer economicdata, generally for 2001. The updated version,GTAP 6, also incorporates changes in tradepractices based on the results of the previousround of global trade negotiations, the UruguayRound, and, for the first time, includes dataabout preferential trade arrangements thatdeveloped countries extend to developingcountries.
The update of the GTAP database is a majorfactor explaining some large differences inresults among different models that have been
Carnegie Endowment for International Peace 57
C H A P T E R 4
A Comparison of Models and Simulation Results

used to simulate outcomes of the Doha Roundsince negotiations were launched in 2001.Models that use earlier versions of GTAP (GTAP5 or earlier) overstate the gains that can beachieved from further trade liberalization in theDoha Round, for at least two reasons. First, theycount as potential Doha Round gains manychanges that already were secured through theUruguay Round or through accession agree-ments for new WTO member countries. Thesechanges include tariff reductions under theUruguay Round, the end of the global apparelquota system, and the accession of China tothe World Trade Organization (WTO)—all majorchanges in the international trading system.
Second, models based on earlier versions ofGTAP do not take into account the preferenceprograms that provide more favorable marketaccess for goods exported by developing coun-tries to developed country markets. Instead,they count these existing market access advan-tages as gains to be achieved from furthertrade liberalization in the Doha Round. In addi-tion to overstating global gains from the DohaRound, models using older data will understatelosses to countries that currently enjoy thesepreferences. For some countries, includingmany Sub-Saharan African and other leastdeveloped countries (LDCs), models based onGTAP 5 generate predictions that are likely tobe directly contrary to what will actually happento these countries if they lose their current pref-erential access. Because many of the countriesinvolved also have high rates of poverty, thesemodels also overstate the global gains in
poverty reduction and ignore the possibilitythat poverty could increase in such countries.
Table 4.1 illustrates the magnitude of overstate-ment of gains from trade attributable to use ofGTAP 5 or GTAP 6. It presents the global gainsfrom full trade liberalization reported for theWorld Bank model in 2002 and 2005, with themajor difference being the use of GTAP 5 forthe 2002 report and GTAP 6 for the new report.The table also shows the gains for developingcountries. What is noteworthy is that the WorldBank model shows dramatically smaller gainsfor these countries based on the new data andinclusion of preference programs and otherglobal changes since the Uruguay Round.Rather than capturing the majority of gains fromliberalization (50.9 percent), as in the 2002model, developing countries gain only 29.9percent of the global benefits from full tradeliberalization, with 70.1 percent of gainsaccruing to high-income countries. This com-parison suggests that results from other studiesusing GTAP 5 data should be discounted to asimilar degree.
Scope
General equilibrium models cover all majoreconomic sectors while partial equilibriummodels cover only selected sectors.Simulations conducted on general equilibriummodels that include all sectors may nonethe-less limit the scenarios of trade reform tocertain sectors of particular interest. TheCarnegie and World Bank general equilibrium
58 Winners and Losers: Impact of the Doha Round on Developing Countries
Table 4.1. Income Gains from Full Free Trade in the World Bank Model with Different Data Sets
Gains to World Economy Gains to Developing Countries
World Bank 2002 LINKAGE Model with GTAP 5.4a $385 billion $196 billionWorld Bank 2005 LINKAGE Model with GTAP 6.0b $287 billion $86 billion
a. Dominique van der Mensbrugghe and John C. Beghin, “Global Agricultural Reform: What Is at Stake?” in Global Agricultural Trade andDeveloping Countries, ed. M.A. Aksoy and John C. Beghin (Washington, D.C.: World Bank, 2005).b. Kym Anderson, William J. Martin, and Dominique van der Mensbrugghe, “Global Impacts of the Doha Scenarios on Poverty,” in Poverty andthe WTO: Impacts of the Doha Development Agenda, ed. Thomas W. Hertel and L. Alan Winters (Washington, D.C.: World Bank, 2006).

models include the agriculture, manufacturing,and service sectors but are not used to modelservice sector liberalization. The latter isexcluded both because measuring liberaliza-tion in that sector is much more difficult andbecause the structure of negotiations on serv-ices at the WTO is more complex and difficultto simulate than negotiations for other sectors,as discussed in chapter 2. Some recent modelsdo attempt to simulate liberalization of theservice sector, but the modelers make widelydifferent assumptions about the contribution toeach economy’s efficiency that service liberal-ization would make. In consequence, theresults of these models vary dramatically andmust be considered experimental or specula-tive.32 When comparing gains from DohaRound trade liberalization under differentmodels, it is important to note which sectorsare included in the simulations.
Scenarios
The choice of trade policy scenarios that mod-elers simulate is also a source of major differ-ences in results among models. Some simulatefull trade liberalization, in which all countries cut
all tariffs to zero, eliminate all nontariff barriers,and discontinue all trade-distorting domesticproduction and export subsidies. Others simu-late more limited, and more realistic, tradepolicy changes. It should be noted that fulltrade liberalization is not a goal of the DohaRound and is not part of the WTO’s July 2004Framework Agreement, under which currentnegotiations are conducted. Many models,including the Carnegie model, simulate bothfull trade liberalization and other, more modesttrade policy changes that have some chance ofbeing realized in the Doha DevelopmentRound. Table 4.2 shows the difference betweenthe gains from full liberalization of agriculturaland manufactures trade and the gains frommore modest Doha scenarios, as simulated inthe Carnegie and World Bank models. Thoughthe Doha scenarios that are modeled are notidentical, they produce similar proportions ofgains compared with full liberalization.
The main Doha scenario in the World Bankmodel (World Bank scenario 1) cannot be con-sidered a realistic outcome of the negotiations.In that scenario, existing agricultural tariffs aredivided into bands and then reduced by
Carnegie Endowment for International Peace 59
Table 4.2. Income Gains from Full Free Trade Compared with Plausible Doha Scenarios, Carnegie and World Bank Models
Model Full Liberalization Plausible Doha Scenariosb
Current World Bank Modela $287 billion $96 billion(Dynamic gains) (No exceptions for sensitive or special agricultural products)
$39 billion(2% sensitive and 4% special agricultural products are subject to lesser liberalization)
Carnegie Model $168 billion $59 billion(Comparative static gains)
a. Kym Anderson, William J. Martin, and Dominique van der Mensbrugghe, “Market and Welfare Implications of Doha Reform Scenarios,” inAgricultural Trade Reform and the Doha Development Agenda, ed. Kym Anderson and William J. Martin (Washington, D.C.: World Bank, 2006).b. In the World Bank model, scenario 7 is based on tariff reductions from bound rates based on a tiered formula. Resulting average agriculturaltariff reductions are 44 percent by developed countries and 21 percent by developing countries. For manufactured goods, bound tariffs arereduced by 50 percent by developed countries and 33 percent by developing countries. Least developed countries do not make tariff reduc-tions. Tiered reductions in domestic support of agriculture are made from bound aggregate measures of support. Export subsidies for agricul-ture are eliminated. In the Carnegie model scenario (scenario 3), reductions are made from trade-weighted ad valorem equivalent (AVE) appliedborder protection. Agricultural AVEs are reduced by 36 percent by developed countries and 24 percent by developing countries, whereas thecorresponding reductions for manufactured goods are 50 percent and 33 percent. Least developed countries do not make AVE reductions.Export subsidies for agriculture are eliminated by all countries except least developed. Domestic subsidies for agriculture are reduced by a thirdby all countries except the least developed countries.

amounts that increase as the tariff bandsincrease, with reductions of 75 percent for thehighest band. This is somewhat similar to theG-20 proposal at the Hong Kong ministerialand less than the highest tariff reductions inthe U.S. proposal.33 However, the scenariodoes not allow any exceptions for sensitiveagricultural products or special products ofdeveloping countries.34 Under the July 2004Framework Agreement, it was agreed thatthere will be such exceptions, and every pro-posal that has been tabled includes suchexceptions. For example, the United Statesproposes that 1 percent of agricultural tarifflines be excluded from cuts as sensitive prod-ucts, while the European Union (EU) proposes 8percent. The G-33 has proposed that 20percent of developing country agricultural tarifflines be excluded from liberalization as specialproducts.
On the basis of the current proposals, the twomost realistic World Bank scenarios are thosethat allow for sensitive and special products(labeled World Bank scenarios 2 and 3). In sce-nario 2, 2 percent of developed country and 4percent of developing country agricultural tarifflines can be subject to smaller tariff cuts. In sce-nario 3, the allowance for developed countriesis 5 percent; and for developing countries, 10percent. These scenarios produce globalincome gains of only $17.7 billion and $13.4billion, respectively. For the purpose of compar-ison with Carnegie model results, we add $21.6billion global income gains for manufacturingliberalization, the incremental amount aboveagricultural sector gains reported in the WorldBank’s combined scenario 7 (the only scenariothat includes the manufacturing sector) toWorld Bank scenario 2.
Although the overall gains reported in theWorld Bank and Carnegie models are roughlysimilar, the sectoral sources of the gains arequite different. The Bank finds that three-
fourths of all gains come from agriculture; whilein the central Doha scenario used by Carnegie,less than 10 percent of the gains come fromagriculture. Some of the difference is explainedby differences in the Doha scenarios that areused in the two models. For example, theBank’s central scenario uses a tiered agricul-tural liberalization formula that generatesaverage cuts of 44 percent in developed coun-tries’ agricultural tariffs and 21 percent cuts intariffs by developing countries, while the corre-sponding figures in the Carnegie central sce-nario are 36 and 24 percent. When developedcountries are allowed to exclude 2 percent offarm products from cuts based on their sensi-tive status, and developing countries exclude 4percent as special products, the global gainsreported in the Bank model drop dramaticallyfrom $74.5 billion to $17.7 billion, less than thegains from manufacturing liberalization ($21.6billion). The Carnegie central Doha scenario ismore ambitious than that of the World Bankwith respect to manufacturing sector liberaliza-tion, which explains part of the difference.However, under the more modest manufac-turing liberalization scenario, the Carnegiemodel still finds that more than 87 percent ofoverall gains arise in the manufacturing sector.The results from most models are closer tothose from the Carnegie model than the Bankmodel with respect to the size of gains fromagricultural liberalization, discussed furtherbelow.
The Structures and Assumptions of the Models
Some of the differences in results amongmodels can be attributed to differences instructural features and the assumptions that aremade. As noted above, most models havenumerous similarities in structure and assump-tions. However, in an effort to make the modelsmore realistic, or to enable more detailed mod-eling of certain aspects of trade relationships,
60 Winners and Losers: Impact of the Doha Round on Developing Countries

modelers may adjust the parameters andassumptions of their models in various ways.These adaptations will affect the models’results.
General equilibrium models calculate the gainsor losses to economies based on the effects oftrade policy changes on both producers andconsumers. Most empirical studies show thatthe effects of such policy changes, especially atthe household level, are dominated by earningseffects (that is, the impact on producers andworkers) rather than by consumption effects, asdiscussed in chapter 2. In developing countries,the main source of household income for themajority of the population consists of wages forunskilled labor or income from the agriculturalsector, either as wages for farm labor or self-employment on small-scale farms. Therefore,the impact of trade policies on demand foragricultural and unskilled labor in each countrywill significantly affect the welfare results for theoverall economies, and for a large proportion ofthe households.
Because an important objective of the Carnegiemodel was to explore the impact of differentpotential trade policy changes on developingcountries, particular attention was paid to theassumptions made about labor markets in thosecountries. The model incorporates two majorinnovations compared with most other models.First, the Carnegie model disaggregates laborinto three types for developing countries: agri-cultural labor, urban unskilled labor, and urbanskilled labor. Most models incorporate only twotypes of labor, skilled and unskilled, therebyblurring the different characteristics of agricul-tural and urban unskilled labor.
Second, the Carnegie model recognizes theexistence of unemployment of urban unskilledlabor in developing countries. By contrast, mostmodels adopt the assumption of full employ-ment for all economies, whether developed or
developing. Unemployment is not taken intoaccount, and any increases (or decreases) indemand for labor will be shown by the modelas rising or declining wages. The assumption offull employment, though not accurate for devel-oped countries, is nevertheless close enough tothe actual functioning of labor markets in suchcountries that it is an acceptable simplification.In most developing countries, however, theassumption of full employment is so far fromthe reality that it is likely to significantly distort amodel’s results. The reality in such countries is acombination of very significant underemploy-ment (also called hidden unemployment) in thecountryside and open unemployment in urbanareas. As noted in the sensitivity analysis(appendix B), the incorporation of unemploy-ment into the Carnegie model doubled returnsto developing countries as a group comparedwith an exercise in which the model was runwith the assumption of full employment inthese countries. This suggests that models thatdo not take unemployment into account will bemuch less accurate and less useful in examiningthe impact of potential policy changes ondeveloping countries.
Several other recent modeling exercisesattempt to more accurately represent the realityof labor markets in developing countries.Modelers at CEPII and UNCTAD also adaptedthe architecture of their models to try tocapture the impact of trade policy changes inthe presence of dual labor markets (CEPII) andunemployment (UNCTAD). In each case themodelers adopted a somewhat differentapproach to this challenge. The modelers atCEPII show the manufacturing and servicesectors as paying a wage to unskilled workersthat is above their marginal productivity. Thisattracts an effectively unlimited supply ofworkers, so that the expansion of these sectorsfaces no labor supply constraint. By contrast,the agricultural sector pays a competitive wage(determined by supply and demand). The
Carnegie Endowment for International Peace 61

supply of labor to the agricultural sector is setas a residual; that is, once the better-payingmanufacturing and service sectors haveemployed the number of unskilled workersneeded, the remaining jobless are available toagriculture. The UNCTAD study addresses theunemployment issue in a straightforward way.Real wages for unskilled workers in developingcountries are fixed, and the supply of laboradjusts to clear the market. The Carnegieapproach is described in chapter 2 andappendix A.
The Results from the Models
All the newer models discussed here showpotential gains from the Doha Round that aremuch lower than forecasts from earlier models.
Many of the patterns of gains and losses foundin the Carnegie simulations, reported above,are echoed in the findings of these models.However, there are a few significant differencesbetween the models’ findings at the sectorallevel, noted below.
The results from the World Bank show thatunder the most realistic agricultural scenariomodeled, all the income gains go to high-income countries (figure 4.1). In the manufac-turing sector, the gains are somewhat moreequally distributed among countries, althoughmore than half the gains accrue to high-incomecountries. These results follow the same generalpattern as the Carnegie results, which also showall gains from the Doha agricultural scenarioaccruing to developed countries, with manufac-turing liberalization gains distributed morebroadly (see figures 3.2 and 3.3). However, theoverall gains for agriculture are much higher inthe World Bank results.
Most recent models show lower gains fromagricultural liberalization under plausible Dohascenarios than those found in the World Bankstudy. When scenarios are adjusted to be com-parable, the results for the CEPII and IFPRImodels are quite similar to the findings of theCarnegie model, as seen in figure 4.2.
The CEPII modelers appear to find highergains. However, their scenario does not allowfor any exceptions for sensitive or special prod-ucts. If the same margin of reduction found inthe World Bank’s results after allowing for theseexceptions is applied to the CEPII figure, theresult with 2 percent sensitive and 4 percentspecial products would be a global welfare gainof $5.5 billion, virtually identical to the Carnegiefinding.
The IFPRI model uses the scenario of full liber-alization. In a more realistic Doha scenario, weshould expect these gains to shrink, as they do
62 Winners and Losers: Impact of the Doha Round on Developing Countries
-5
0
5
10
15
20
ManufacturesbAgriculturea
High Income
18.1
High Income
13.6
MiddleIncome
-500million
MiddleIncome
LowIncome
100million
LowIncome
2.6
4.5
Figure 4.1. Sectoral Gains (Losses) for Developedand Developing Countries under World BankScenarios for Agriculture and Manufactures(CHANGE IN REAL INCOME, BILLIONS OF DOLLARS)
Source: Kym Anderson, William J. Martin, and Dominique van derMensbrugghe, “Market and Welfare Implications of Doha ReformScenarios,” in Agricultural Trade Reform and the DohaDevelopment Agenda, ed. Kym Anderson and William J. Martin(Washington, D.C.: World Bank, 2006). Agriculture data from table12.14. Manufactures data calculated by the author from the datain table 12.14.
a. World Bank scenario 2 for agriculture with two percent “sensi-tive” products and four percent “special” products.b. World Bank scenario 7 (scenario 1 for agriculture plus manufac-turing liberalization) minus World Bank scenario 1.

in every other model. For example, the differ-ence in the World Bank and Carnegie modelsbetween full liberalization and realistic Dohascenarios was on the order of three to one. Bythis rule of thumb, the IFPRI model would showgains of about $3.7 billion, the lowest of all themodels.
Though showing larger overall gains, the WorldBank simulations show similar results to those ofthe Carnegie model in the changes in tradepatterns that are induced by agricultural liberal-
ization, shown in table 4.3. Under the study’scentral Doha scenario (World Bank scenario 7),increases in agriculture and food exports fromhigh-income countries go entirely to other high-income countries.35 Their agricultural exports todeveloping countries do not increase at all. Fordeveloping countries, more than 75 percent ofincreased agricultural exports go to high-income countries.
This pattern of exports is consistent with thefindings of the Carnegie model under the sce-nario in which special treatment is accorded todeveloping countries’ agricultural sectors,based on livelihood security, food security, andrural development needs (Carnegie scenario 4).Carnegie found that the reduction in incomegains caused by allowing this exception fromagricultural liberalization rules was small both atthe global level and for individual countries,including major agricultural exporters, as shownin figures 3.11 and 3.12.
The findings of the World Bank and CEPII simu-lations also follow the distributional patternsfound in the Carnegie study. Figure 4.3 super-imposes the results from the World Bank’s sce-nario 2 (the most realistic agricultural scenariomodeled by the Bank) on the results fromCarnegie’s main Doha agricultural scenario. Thetwo scenarios are roughly comparable in levelsof ambition. The World Bank central Doha sce-nario shows China, Mexico, the Middle East andNorth Africa, and most of Sub-Saharan Africa asnet losers in terms of real income. The Bank’smodel shows much larger gains and muchlarger losses, but the pattern is strikingly similarto the Carnegie model’s results. Note that theCarnegie results are measured in millions ofdollars (on the left axis), whereas the WorldBank results are measured in billions of dollars(on the right axis).
Similarly, the CEPII model simulation shows thecountries of Sub-Saharan Africa and the
Carnegie Endowment for International Peace 63
0
5
10
15
20
25
CarnegiedIFPRIcCEPIIbWorld Banka
17.7
10.5
23.2
5.5 5.4
3.7
Figure 4.2. Global Real Income Gains fromAgricultural Liberalization: Comparison of Major Models(CHANGE IN REAL INCOME, BILLIONS OF DOLLARS)
a. Kym Anderson, William J. Martin, and Dominique van derMensbrugghe, “Market and Welfare Implications of Doha ReformScenarios,” in Agricultural Trade Reform and the DohaDevelopment Agenda, ed. Kym Anderson and William J. Martin(Washington, D.C.: World Bank, 2006), table 12.14. b. Scenario includes tiered tariff reductions similar to World Bank,no “sensitive” products and a reduction of 55 percent in domesticsubsidies. The Centre d'Etudes Prospectives et d'InformationsInternationales (CEPII) model uses GTAP 5 data; however, it doesinclude trade preferences. Antoine Bouët, Jean-ChristopheBureau, Yvan Decreux, and Sebastien Jean, MultilateralAgricultural Trade Liberalization: The Contrasting Fortunes ofDeveloping Countries in the Doha Round, CEPII Working Paper2004-18 (Paris: Centre d'Etudes Prospectives et d'InformationsInternationales, 2004). Calculated by author from data in table 6.c. International Food Policy Research Institute (IFPRI) scenario isfull liberalization; total gain would decline significantly in a morerealistic Doha scenario. Xinshen Diao, Eugenio Diaz-Bonilla,Sherman Robinson, and David Orden, Tell Me Where It Hurts, An'I'll Tell You Who to Call: Industrialized Countries' AgriculturalPolicies and Developing Countries, MTID Discussion Paper 84(Washington, D.C.: International Food Policy Research Institute,2005), table 10.d. Carnegie scenario 1.
64 Winners and Losers: Impact of the Doha Round on Developing Countries
-400
-300
-200
-100
0
100
200
300
400
$-294million
$-157million
$307million
$-42million
$-22million
$9million
$-14million
$-178million
$57million
$-110million
$-106million
$251million
$-165million
$358million
$1 billion
$1.1 billion
$300 millon
$200 million $100
million$0
$200million
$0
$-300million
$-1.2 billion$-1.5 billion
-1.5
-1.0
-0.5
0
.5
1
1.5
$18million
$141million
Change in real income, billions of dollars (right axis)Change in real income, millions of dollars (left axis)
Carnegie Doha scenario for agriculture World Bank scenario for agriculture ba
Arg
entin
a
Res
t o
f ASE
AN
Bra
zil
Res
t o
fLa
tin A
mer
ica
Sout
h A
fric
a
Cen
tral
Am
eric
a a
nd C
arib
bea
n
Ind
one
sia
Res
t o
f So
uth
Asi
a
Ban
gla
des
h
Ind
ia
Res
t o
f Sub
-Sa
hara
n A
fric
a
Eas
t A
fric
a
Vie
tnam
Mex
ico
Mid
dle
Eas
t a
nd N
ort
h A
fric
a
Chi
na
Figure 4.3. Agricultural Liberalization: Developing Country Winners and Losers under Carnegie DohaScenario for Agriculture and World Bank Scenario 2
a. Carnegie Scenario 1.b. World Bank Scenario 2 with two percent “sensitive” products and four percent “special” products. Kym Anderson, William J. Martin,and Dominique van der Mensbrugghe, “Market and Welfare Implications of Doha Reform Scenarios,” in Agricultural Trade Reform and theDoha Development Agenda, ed. Kym Anderson and William J. Martin (Washington, D.C.: World Bank, 2006), table 12.14. Only World Bankregions that correspond exactly to the Carnegie model regions are included in this figure. The World Bank data for the Middle East andNorth Africa and for Turkey were used to calculate the data for the Middle East and North Africa region here, in order to correspond withthe Carnegie model Middle East and North Africa region.
Table 4.3. Destination of Exports under Agricultural Liberalization in the World Bank ModelCHANGE FROM BASELINE IN BILATERAL TRADE FLOWS FROM WORLD BANK DOHA SCENARIO 7 (BILLIONS OF DOLLARS)
Importer
Exporter High-Income Countries Developing Countries
High-income countries 15 -0Developing countries 31 10
Source: Kym Anderson, William J. Martin, and Dominique van der Mensbrugghe, "Market and Welfare Implications of Doha Reform Scenarios,"in Agricultural Trade Reform and the Doha Development Agenda, ed. Kym Anderson and William J. Martin (Washington, D.C.: World Bank,2006), table 2.16.
Note: World Bank Scenario 7 is based on tariff reductions from bound rates based on a tiered formula. Resulting average agricultural tariffs arereduced by 50 percent by developed countries and 21 percent by developing countries. Least developed countries do not make tariff reduc-tions. Tiered reductions in domestic support of agriculture are made from bound aggregate measures of support. Export subsidies for agricul-ture are eliminated.

Mediterranean (North Africa, the Middle East,and Turkey) as net losers under the CEPII sce-nario for Doha liberalization of agriculture.
As noted above, the World Bank and CEPIImodels focus on agricultural trade. The onenew model that focuses on the manufacturingsector, the UNCTAD model, shows highergains from manufacturing liberalization thaneither the Carnegie or World Bank model.Under a range of scenarios, UNCTAD mod-elers find global income gains ranging from$94 billion to $137 billion. The majority ofgains go to developing countries, rangingfrom 58 to 65 percent in different scenarios.One important explanation for the highergains is that many of the scenarios modeledentail deep cuts in weighted-average applied
tariffs. For example, the impact of variousUNCTAD scenarios on the tariffs charged bydeveloped countries on imports from devel-oping countries ranges from reductions ofapplied tariffs of 46 percent under the mostmodest scenario to 94 percent under the mostambitious. These are very ambitious scenarioscompared with those modeled by Carnegieand the World Bank, and they are more ambi-tions than current proposals. Another aspectof the model that may account in part for thehigh gains is that UNCTAD modelers did rec-ognize the abundant supply of unskilled laborin developing countries. This will tend toincrease the impact of manufacturing liberal-ization on developing countries with competi-tive manufacturing industries, as also found inthe Carnegie study.
Carnegie Endowment for International Peace 65

Carnegie Endowment for International Peace 67
The main findings of the Carnegiemodel shed light on the chal-lenges faced by World TradeOrganization (WTO) members inconcluding the Doha Round of
multilateral trade negotiations. The negotiatingrules of the WTO generally require that agree-ments be reached by consensus. Thus, negotia-tors must find a balance of terms that offerpotential gains to all countries and regions, whilefulfilling the commitment made at the launch ofnegotiations to conclude a “developmentround” that provides a better balance betweenthe interests of rich and poor countries.
In the Uruguay and previous rounds of multilat-eral trade negotiations, the search for a con-sensus package was driven by the interests ofthe largest developed countries and blocs. Thelimits of that approach became apparent at theWTO ministerial meeting in Cancún in 2003,when the outline of an agricultural agreement,worked out in advance between the UnitedStates and European Union, was rejected byvarious groups of developing countries, leadingto a breakdown of the negotiations. The coali-tions formed at that time by developing coun-tries have persisted and deepened. It is nowclear that no new consensus—and thus noagreement—can be achieved without meetingtheir needs.
Finding the combination of measures that canachieve a balanced and mutually beneficialresult from the Doha Round requires realisticestimates of the benefits to be achievedthrough different combinations of marketaccess commitments and other liberalizationmeasures, as well as reliable estimates of howthose benefits are distributed among countriesacross the global economy. General equilibriummodeling is well suited for this purpose, andthe Carnegie model has particular valuebecause of its realism in modeling developingcountries, the new majority in world tradenegotiations, and its focus on issues and sce-narios of interest to them.
The Carnegie model and a close analysis ofmost other recent models makes clear thattrade is not a panacea for poverty alleviation orfor development more generally. It is importantnot to overstate the possible gains from theDoha Round, as has been done by many polit-ical leaders, commentators, and activists. Forexample, it has been fashionable to state thattrade can do more than development aid to liftpeople out of poverty in developing countries.Though this may be theoretically true, it is clearthat trade has a modest contribution to makeand is only one policy mechanism among manythat must be pursued to achieve economicgrowth and rising incomes.
C H A P T E R 5
Policy Implications and Recommendations

An unrealistic expectation of gains is not harm-less. It can lead to pressure for inappropriatepolicies and could create a bandwagon effectwhere the very legitimate defensive concerns ofdeveloping countries are ignored to achieveillusory gains. Errors in analysis can lead toincreases in poverty, not the hoped-for reduc-tions, in developing countries. For the poorestcountries, where there is little margin for error,the risks are particularly acute.
The various scenarios tested with the Carnegiemodel, together with actual negotiatingstances in the Doha Round, suggest severalconclusions about the dynamics of the negotia-tions and what will be required to achieve asuccessful outcome. These implications are dis-cussed below, followed by recommendationsof policies that would contribute to a suc-cessful outcome of the round.
Overall Gains in the Doha Round andImplications for Negotiating Stances
The first main conclusion arises from findings onthe overall gains from plausible Doha scenarios.The scale of gains to be achieved at the globallevel, and by any country or region, is rathermodest, measured as a percentage of thecurrent economy. On the basis of new tradedata that became available in late 2004, boththe Carnegie and World Bank models showglobal income gains of less than $60 billionunder any realistic Doha scenario.36 That is0.146 percent (about one-seventh of onepercent) of current global gross domesticproduct (GDP). Higher figures that have beenwidely cited refer to full free trade or to sce-narios that include levels of ambition that havealready been ruled out in the Doha FrameworkAgreement and that exceed even the mostambitious proposals currently tabled.
The gains for individual economies are alsosmall, with only China gaining more than 1
percent in real income (as a share of currentGDP) from any of the plausible scenarios thatwere modeled.37 Developing countries as agroup gain from 0.33 to 0.50 percent under themain scenarios, while developed countries gainabout 0.10 percent under these scenarios. Thelimited nature of the gains goes far in explainingthe overall lack of urgency demonstrated by themembers of the WTO and their negotiators.
An important political-economic corollaryemerges from the finding that each country canexpect only relatively small overall gains fromthe Doha Round: Given relatively low gains, theadjustment costs to which countries exposethemselves when they change trade policiesmay loom larger than in the past. It could bemore difficult for countries to make concessionsin noncompetitive sectors if these concessionsimpose high or concentrated adjustment costsand the gains in other sectors are modest.Consequently, any agreement is likely to beshaped to accommodate the main defensiveinterests of all major countries.
This corollary provides insight into the negoti-ating stances of the major countries, which havesought liberalizing measures from others fortheir competitive sectors but have been largelyunwilling to make offsetting concessions in theirnoncompetitive sectors. The stances of the EUand Brazil illustrate the point. The EU aggres-sively seeks liberalization of manufacturing andservices, but it has not been prepared to gobeyond modest agricultural liberalization meas-ures that had already been adopted internallyin earlier EU policy decisions. Similarly, Brazilhas aggressively sought agricultural liberaliza-tion, but it appears unwilling to make significantcuts in either manufacturing or service sectorsto achieve that end. In previous rounds, defen-sive interests in the agriculture, textile, andapparel sectors in the major developed coun-tries were able to limit liberalizing concessionsin these areas despite what were seen to be
68 Winners and Losers: Impact of the Doha Round on Developing Countries

large potential gains from liberalization in othersectors. With smaller overall gains, the losingsectors may be even more successful inblocking concessions that affect them.
Similar domestic calculations prevail in everymajor country. Taken together, they reinforce thelikelihood that any Doha agreement will entailonly modest levels of ambition in any sector.
The Imperative of Making Doha a “Development Round”
The WTO members agreed to make Doha a“development round” as a necessary conditionfor launching a new effort at global trade liberal-ization. The new weight of developing countriesin the WTO means that their interests, bothoffensive and defensive, must be addressed ifan agreement is to be reached. They have thepower to veto any proposed deal that fails todeliver benefits to them that exceed their costsof adjustment. Recent ministerial meetings havedemonstrated that the major developing coun-tries, and some smaller ones as well, are fullyaware of their own negotiating power, particu-larly when they combine into bargaining coali-tions. Because the developing world nowconstitutes the majority of WTO members and arapidly growing share of the world economy, theDoha Round can be seen as the first round inwhich the global community must learn tonegotiate under this new global distribution ofeconomic and bargaining power.
Beyond the realpolitik that will require conces-sions by high-income countries to developingcountries in order to reach a new agreement,there are considerations of equity, justice, andeven global economic and political stability thatshould inform the negotiations. If the globaltrading system extends opportunities to theglobal majority (that is, those who live in devel-oping countries and depend on agriculture orunskilled urban occupations for their livelihood),
the result will be increased global economicactivity, growth, and stability. If large numbersof these individuals and households do notbenefit, or if they face worse economic circum-stances as a result of global trade rules, theimpact of trade will be to concentrate wealth ina relatively small number of countries, firms,and households. This would call into questionboth the legitimacy and the economic sustain-ability of an open global trade regime, withpotential harm to high-income countries,households, and firms as well as to the poor.
The scenarios we modeled make clear thatsome low-income countries are likely to beharmed by trade policies under consideration inthe Doha Round. Poor people in middleincome developing countries are also at risk ofnegative impacts from the negotiations.
We suggest two principles that should be usedto evaluate—and adjust—trade policies in lightof possible adverse effects on poverty andequity. First, if a proposed trade policy change islikely to worsen poverty, it should be rejected oroffset by changes that have a high probability ofoffering better opportunities to groups likely tobe affected. Second, the international commu-nity should agree to apply the principle thattrade policy changes that produce benefits thatare likely to accrue to only small numbers offirms and households while inflicting economicharm on larger numbers of firms, individuals, orhouseholds will not be adopted.
The Challenge of Finding Gains for All Developing Countries
The developing countries have very differenttypes of economies and economic potential.For example, the often-cited proposition thatagricultural liberalization offers major benefitsfor most developing countries is simply nottrue, as demonstrated by the findings of theCarnegie model and other major models. Many
Carnegie Endowment for International Peace 69
70 Winners and Losers: Impact of the Doha Round on Developing Countries
developing countries are net losers if only agri-culture is liberalized. The gains accrue mainly tohigh-income countries that liberalize their ownagricultural sectors and shed the burden ofmaintaining expensive and inefficient subsidies.In terms of agricultural trade, there are someshifts in market share but little overall growth inagricultural export markets. Most developingcountries gain more from liberalization of man-ufactured goods than from freer trade in agri-culture. Even Brazil, a strong agriculturalexporter and demandeur in the negotiations onagriculture, gains more from manufacturingthan from agricultural liberalization.
However, liberalization of manufactured goodsposes its own difficult challenges. The currentoverabundance of labor in developing coun-tries—relative to both capital and the capacityof national and global markets to absorboutput—will make achieving all-around gainsfrom trade even more complicated. TheCarnegie model’s innovative use of realisticassumptions about developing country labormarkets makes this particularly evident.
The current surplus of labor in developingcountries affects both agriculture and manufac-turing. Many developing countries have non-competitive agricultural sectors based onlow-productivity, small-scale farming. Thoughthey would benefit from lower food costs byimporting from more efficient producersabroad, they would lose a disproportionateshare of employment in their own agriculturalsectors. In the absence of sufficient alternativeemployment, their economies would be worseoff, at least in the short and medium terms.
In the manufacturing sector, export demandgenerated by lower trade barriers would allowdeveloping countries to use unemployedunskilled labor and increase production withoutincreasing labor costs. This would benefit themost competitive producers among developing
countries but drive out marginal producers. Thishas already happened in the apparel sectorafter partial liberalization under the UruguayRound. Further ambitious liberalization of man-ufacturing trade would benefit China, which hasa concentration of efficient producers, andother developing countries to a lesser extent,but would harm Bangladesh and some Sub-Saharan African countries. As China, India, andother developing countries climb the tech-nology ladder, it is likely that downward pres-sures on prices and intense global competitionwill extend up the value-added chain to othermanufacturing industries.
The concerns of many low-income developingcountries about the Doha Round are especiallyjustified. Many fare poorly under the types ofliberalization currently proposed. Some experi-ence actual losses in real income or in theirexport share in world markets.
Finding a balance of measures that benefits alldeveloping countries will be a daunting chal-lenge. It may take more time and effort than inearlier rounds to succeed in this more complexglobal economic matrix. An overall balancehas not yet been found. However, several com-ponents can be identified that should beincluded in any package to address the chal-lenges identified through this report’s simula-tions. These recommended measures arepresented in box 5.1.
Our analysis suggests that for Doha to succeedas a development round, significant differentia-tion must be built into the basic structure of theglobal trading regime to accommodate the widedifferences in the offensive and defensive inter-ests of developing countries. Even with a carefullycalibrated treatment of developing countries inthe main architecture of any agreement, specialmeasures will also be required to ensure that theleast developed and most vulnerable countriesare able to join the winners’ circle of trade.

Carnegie Endowment for International Peace 71
Careful Sequencing ofLiberalization and Much Longer Phase-In Periods forDeveloping Countries
Because developing countries have less differ-entiated economies than more industrializedcountries and, in many cases, have high con-centrations of their labor forces in agriculture,it is essential that their manufacturing sectorsbe allowed to develop and grow before theyexpose uncompetitive agricultural sectors tothe full force of global agricultural trade.Otherwise, they are likely to experience higherlevels of unemployment and poverty as theireconomies adjust to trade liberalization. Theseshort- to medium-term outcomes are undesir-able in themselves and would put downwardpressure on domestic consumption, whichcould create a long-term cycle of stagnation.
In the context of a current global capacity glutin many low-skilled manufacturing sectors, it isunrealistic to expect that these sectors willquickly absorb displaced agricultural labor.Therefore, developing countries with very highconcentrations of agricultural labor will requirespecial agricultural consideration throughoutthe Doha implementation period, and prob-ably beyond.
Special and Differential Treatmentfor Developing Country Agriculture
The WTO’s July Framework Agreement from2004 acknowledges that developing countrieswill need to designate some products asspecial products based on livelihood security,food security, and rural development concerns.The number of such products and the terms forselecting them have yet to be agreed. Giventheir high levels of employment in agriculture
and the need to maintain those livelihoodsuntil alternative employment can be generatedin other sectors, developing countries shouldbe allowed to designate a substantial portionof their agricultural tariff lines as special prod-ucts. The G-33 group of developing countrieswith high concentrations of employment inagriculture, has proposed that 20 percent oftariff lines be eligible for such designation. Forcountries with the highest concentrations ofworkers in agriculture, this would be aminimum necessary accommodation.
The right to designate special products shouldbe open-ended. Raising productivity levels anddeveloping new skills among large numbers ofsubsistence farmers will be a difficult processthat in many countries will require much longerthan any anticipated implementation period forthe Doha Round. In addition, beneficiary coun-tries should be allowed to change the productsin this category as circumstances warrant.Cumbersome or restrictive rules on the desig-nation of special products are not appropriateand are not warranted in light of the minimalimpact on other countries.
Agreement in principle has also been reachedthat developing countries will be allowed toestablish a special safeguard mechanism,under which they could introduce tariffs orother protection for agricultural products inthe future. Detailed provisions have yet to benegotiated but should include the right tolaunch such protective measures when pricesdecline or when volumes surge.
In some cases, the interests of exporters in othercountries may run counter to the critical defen-sive interests of developing countries with largenumbers of subsistence farmers. For example,some basic grains may pose this conflict of inter-
Box 5.1. Recommendations

72 Winners and Losers: Impact of the Doha Round on Developing Countries
ests. A Doha agreement should reflect the basicprinciple that new trade measures should notbenefit a limited number of large firms andwealthy households at the expense of muchlarger numbers of very poor farmers and house-holds in the developing world.
Development Assistance for Agriculture
Allowing extensive special and differentialtreatment for products cultivated by subsis-tence farmers is not intended to keep farmersin low-productivity, low-income occupations. Itis meant to allow sufficient time for them tobecome more productive in farming or to findother occupations. These transitions will taketime and require targeted development assis-tance to raise farm incomes and to preparefarmers to cope with changes in global agricul-tural trade.
The Doha Round should include negotiationsover additional development assistance foragriculture because the transition to moremodern sectors will require resources beyondwhat is domestically available in poor coun-tries.38 New aid commitments by multilateraldevelopment agencies and bilateral donorsare needed to upgrade farming techniquesand inputs, extend irrigation systems, andbuild roads to markets. Specific amounts of aidfrom donors with bound timetables fordelivery should be part of the final Dohaagreement.
Policies for Least Developed Countries
Additional affirmative actions will be neededfor low-income countries that otherwise wouldcome out as net losers from the Doha Round.The WTO took an important step on this issueat the Hong Kong ministerial, where devel-
oped countries agreed to extend duty-freeand quota-free market access for most exportsof least developed countries (LDCs). Thisagreement is likely to mean additional marketopening by the United States and some otherdeveloped countries when it takes effect afterall other provisions of the round are settled.However, the agreement covers only 97percent of LDC exports, which may excludetheir most competitive products. The agree-ment should be extended to include all prod-ucts of LDCs by a firm future date. The finalplan should also eliminate cumbersome rulesof origin that block some exports of LDCs andreduce their opportunity to achieve economiesof scale.
Ideally, middle-income developing countriesshould also extend this access to the LDCs.China established a positive precedent byoffering preferential access to many productsof the least developed members of theAssociation of Southeast Asian Nations as partof a regional free trade agreement, althoughthere are many exceptions. Preferential accessshould be extended to LDCs by other middle-income developing countries and by China toLDCs in other regions.
Policies for Other Low-Income Countries
A solution must also be found for the group oflow-income countries that are just above thethreshold for LDC status, because they may bemade worse off by the effort to help thepoorest nations. Some access to special bene-fits should be extended to these countries aswell. Criteria should be developed to identifysectors in which these very-low-income coun-tries outside the LDC group share similar risks.On the basis of these criteria, sectoral benefitsavailable to the LDCs should be extended tothis group.

Carnegie Endowment for International Peace 73
Trade Adjustment Assistance Programs for the Poor in Developing Countries
Trade by its nature creates winners and losers,as economies adjust to changes in export andimport prices and other trade-inducedchanges. In theory, the winners can compen-sate the losers with transfer payments, or gov-ernments can tax the winners to pay forunemployment compensation, training pro-grams, and job searches by the losers. In prac-tice, such policies and programs have neverbeen created between countries where one isthe winner and the other the loser from trade.
In low-income countries, resources are notavailable for such trade adjustment programs.If the members of the WTO agree on tradepolicy changes that inflict losses on poorpeople in low-income countries, they shouldrecognize a responsibility to assist in con-structing and funding trade adjustment pro-grams there. This can be done throughmultilateral development agencies, such as theWorld Bank, or through bilateral assistance. Todate, such programs have not been adoptedor even discussed. They should be added tothe Doha agenda.

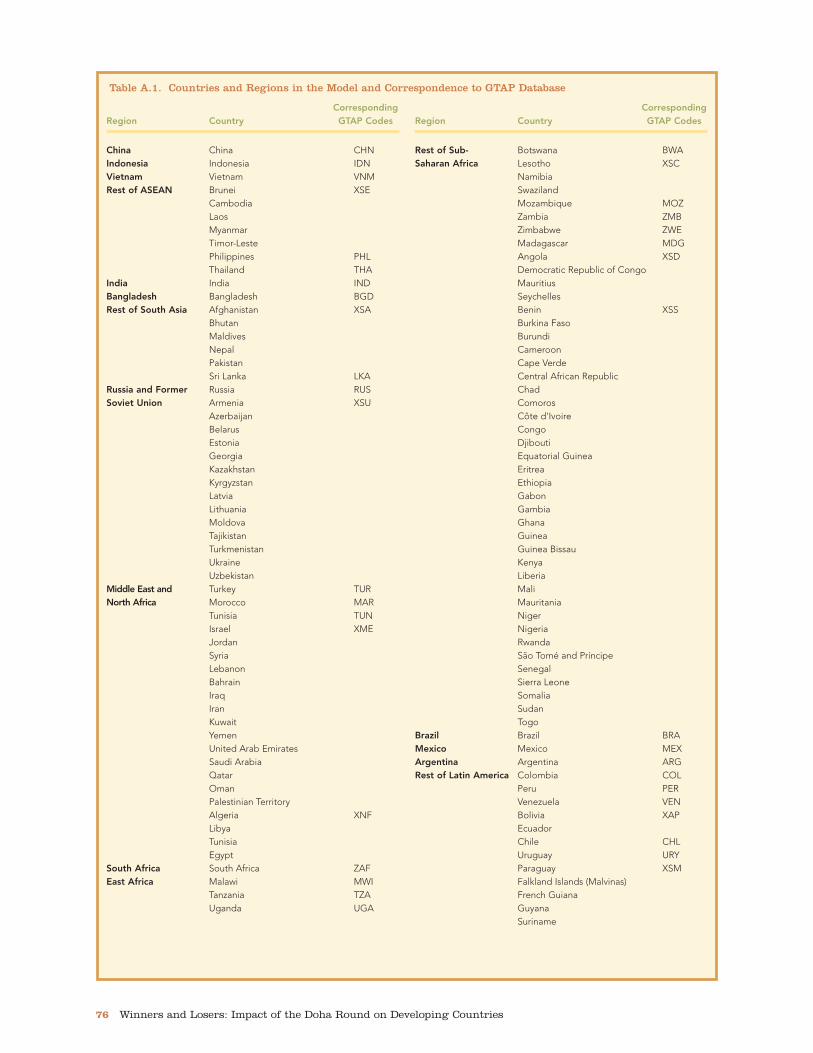
I. The Structure of the Model
The model is an update and extension of theapplied general equilibrium (AGE) modelsused in the study of China’s accession to theWorld Trade Organization (WTO) by Zhi Wang,with endogenous unskilled labor unemploy-ment in developing countries.39 It is part of afamily of models used widely to analyze theimpact of global trade liberalization and struc-tural adjustment programs. It focuses on thereal side of the world economy and incorpo-rates considerable detail on sectoral outputand real trade flows, both bilateral and global.However, this structural detail is obtained atthe cost of not explicitly modeling financialmarkets, interest rates, and inflation.
Given a world equilibrium in the base year, themodel generates the pattern of production andtrade changes from the base that result fromworld economic adjustment to the shocks speci-fied in various alternative scenarios of trade liber-alization. The model has a focus on developingcountries, with twenty-four fully endogenizedregions and twenty-seven production sectors ineach region to represent the world economy.Details of the regions and sectors and their cor-respondence to the GTAP database are pro-vided in table A.1 and table A.2.
There are six primary factors of production:agricultural land, natural resources, capital,agricultural labor, unskilled labor, and skilledlabor. Skilled and unskilled labor have basiceducation in common, with skilled labor alsohaving more advanced training. Agriculturallabor has little or no education. Naturalresources are sector specific. Land and agricul-tural labor are employed only in agriculturalsectors. Agricultural laborers may migrate inresponse to increased demand in urbanunskilled labor markets, depending on thelevel of unemployment in these markets andrural/urban wage differentials. The elasticity ofsubstitution is 1. Other primary factors areassumed to be mobile across sectors butimmobile across regions. All commodity andfactor markets, except unskilled labor, areassumed to clear through market prices. Forunskilled labor, the market equilibrium specifi-cation of Harris and Todaro is adopted for alldeveloping countries in the model,40 in whichthe wage is assumed fixed to a price index.This reflects the abundant supply of unskilledlabor and the presence of unemployment inmost developing countries. Unskilled laboremployment is endogenous, adjusting to clearthe unskilled labor market in developing coun-tries. Full employment is assumed in devel-oped country labor markets.
Carnegie Endowment for International Peace 75
A P P E N D I X A
Technical Specifications of the Model

76 Winners and Losers: Impact of the Doha Round on Developing Countries
Corresponding Region Country GTAP Codes
China China CHNIndonesia Indonesia IDNVietnam Vietnam VNMRest of ASEAN Brunei XSE
CambodiaLaosMyanmarTimor-LestePhilippines PHLThailand THA
India India INDBangladesh Bangladesh BGDRest of South Asia Afghanistan XSA
BhutanMaldivesNepalPakistanSri Lanka LKA
Russia and Former Russia RUSSoviet Union Armenia XSU
AzerbaijanBelarusEstoniaGeorgiaKazakhstanKyrgyzstanLatviaLithuaniaMoldovaTajikistanTurkmenistanUkraineUzbekistan
Middle East and Turkey TURNorth Africa Morocco MAR
Tunisia TUNIsrael XMEJordan SyriaLebanonBahrainIraqIranKuwait YemenUnited Arab EmiratesSaudi ArabiaQatarOmanPalestinian TerritoryAlgeria XNFLibyaTunisiaEgypt
South Africa South Africa ZAFEast Africa Malawi MWI
Tanzania TZAUganda UGA
Corresponding Region Country GTAP Codes
Rest of Sub- Botswana BWASaharan Africa Lesotho XSC
NamibiaSwazilandMozambique MOZZambia ZMBZimbabwe ZWEMadagascar MDGAngola XSDDemocratic Republic of CongoMauritiusSeychellesBenin XSSBurkina FasoBurundiCameroonCape VerdeCentral African RepublicChadComorosCôte d'IvoireCongoDjiboutiEquatorial GuineaEritreaEthiopiaGabonGambiaGhanaGuineaGuinea Bissau KenyaLiberiaMaliMauritaniaNigerNigeriaRwandaSão Tomé and Príncipe SenegalSierra LeoneSomaliaSudanTogo
Brazil Brazil BRAMexico Mexico MEXArgentina Argentina ARGRest of Latin America Colombia COL
Peru PERVenezuela VENBolivia XAPEcuadorChile CHLUruguay URYParaguay XSMFalkland Islands (Malvinas)French GuianaGuyanaSuriname
Table A.1. Countries and Regions in the Model and Correspondence to GTAP Database

Carnegie Endowment for International Peace 77
Corresponding Region Country GTAP Codes
Central America Belize XCAand Caribbean Costa Rica
GuatemalaHondurasEl SalvadorNicaraguaPanamaAntigua and Barbuda XFABahamasBarbadosDominicaDominican RepublicGrenadaHaitiJamaicaPuerto RicoSaint Kitts and NevisSaint LuciaSaint Vincent and the GrenadinesTrinidad and TobagoU.S. Virgin IslandsAnguilla XCBArubaBritish Virgin IslandsCayman IslandsCubaGuadeloupeMartiniqueMontserratNetherlands AntillesTurks and Caicos
Rest of the World American Samoa XOCCook IslandsFijiFrench PolynesiaGuamKiribatiMarshall IslandsMicronesia, Federated States ofNauruNew CaledoniaNorfolk IslandNorthern Mariana IslandsNiuePalauPapua New GuineaSamoaSolomon IslandsTokelauTongaTuvaluVanuatuWallis and FutunaMacau XEAMongolia
Corresponding Region Country GTAP Codes
North KoreaBermuda XNAGreenlandSaint Pierre and MiquelonAndorra XERBosnia and HerzegovinaFaroe IslandsGibraltarFormer Yugoslav
Republic of MacedoniaMonacoSan MarinoSerbia and MontenegroAlbania ALBBulgaria BGRCroatia HRVRomania ROM
Asian Newly South Korea KORIndustrialized Malaysia MYSEconomies Singapore SGP
Taiwan TWNHong Kong HKG
United States United States USAEuropean Union 15 Austria AUT
Belgium BELDenmark DNKFinland FINFrance FRAGermany DEUUnited Kingdom GBRGreece GRCIreland IRLItaly ITALuxembourg LUXNetherlands NLDPortugal PRTSpain ESPSweden SWE
European Union 10 Cyprus CYPCzech Republic CZEHungary HUNMalta MLTPoland POLSlovakia SVKSlovenia SVNEstonia ESTLatvia LVALithuania LTU
Japan Japan JPNRest of OECD Australia AUS
New Zealand NZLCanada CANSwitzerland CHEIceland XEFNorwayLichtenstein
Table A.1. (continued) Countries and Regions in the Model and Correspondence to GTAP Database
Source: Betina V. Dimaranan and Robert A. McDougall, eds., Global Trade, Assistance, and Production: The GTAP 6 Data Base (West Lafayette,Ind.: Center for Global Trade Analysis, Purdue University, 2006).

78 Winners and Losers: Impact of the Doha Round on Developing Countries
Table A.2. Sectors in the Model, with Corresponding GTAP and ISIC Codes
Global Trade Analysis ProjectSectors in the Database Version 6.0 Sector International Standard Industry Carnegie Model Number and Description Classification Revision 3 Code
1. Grains 1. Paddy rice 01111, 01301, 01401,2. Wheat 01112, 01302, 01402,3. Cereal grains, not elsewhere classified 01113, 01303, 01403
2. Oilseeds 5. Oil seeds 01116, 01307, 01407
3. Vegetables and fruits 4. Vegetables, fruit, and nuts 01121, 01112, 01114
4. Other crops 6. Sugar cane, sugar beet; 7. Plant-based fibers; 01305, 01405, 01204, 01404, 01117, 8. Crops not elsewhere classified 01115, 01306, 01406, 01122, 01132
5. Livestock 9. Bovine cattle, sheep and goats, horses; 10. Animal products, 01308, 01408, 01211, 01212, 013012, not elsewhere classified; 11. Raw milk; 01213,0122, 01309, 013010, 013011,12. Wool, silk-worm cocoons 01409, 014010, 014011, 014012 , 15311
6. Meat and dairy products 19. Meat of cattle, sheep, goats, and horses; 20. Meat products, 1511, 1514, 1520not elsewhere classified; 22. Dairy products
7. Sugar 24. Sugar 1542
8. Processed foods 23. Processed rice; 21. Vegetable oils and fats; 1500 excluding 1511, 1514, 1520, 1542, 25. Food products not elsewhere classified 1551,1552, 1553, and 1554
9. Beverages and tobacco 26. Beverages and tobacco 1551, 1552, 1553, 1554, 1600
10. Forestry and fishery 13. Forestry; 14. Fishing 02, 015, 05
11. Crude oil and natural gas 16. Oil; 17. Gas 111, 112
12. Textiles 27. Textiles 17, 243
13. Apparel 28. Wearing apparel 18
14. Leather and footwear 29. Leather products 19
15. Other manufactures 42. Manufactures not elsewhere classified 36
16. Wood and paper products 30. Wood products; 31. paper products, publishing 20, 361, 21, 2211, 2212, 2219, 222
17. Petroleum, coal, and 15. Coal; 18. Minerals not elsewhere classified; 101, 102, 103, 12, 13, 14, 231, 232, 26mineral products 34. Mineral products, not elsewhere classified;
32. Petroleum, coal products
18. Chemical, rubber, 33. Chemical, rubber, and plastic products 233, 241, 242, 23and plastic products
19. Metals and metal products 35. Ferrous metals; 36. Metals not elsewhere classified; 271, 2731, 272, 2732, 2837. Metal products
20. Motor vehicles and other 38. Motor vehicles and parts; 39. Transport equipment 34, 35transport equipment not elsewhere classified
21. Electronic equipment 40. Electronic equipment 30, 32
22. Other machinery 41. Machinery and equipment not elsewhere classified 2213, 223, 29, 31, 33
23. Trade and transportation 47. Trade; 48. Other transportation; 49. Water transportation; 521, 522, 523, 524, 523, 60, 61, 62, 5150. Air transportation
24. Financial services, banking, 52. Financial services; 53. Insurance; 54. Business services 65, 66, 67, 70and insurance not elsewhere classified
25. Communication, health, 51. Communication; 56. Defense, education, health 37, 64, 73, 75, 80, 85, 91, 99education, and public services
26. Recreational and other services 55. Recreational and other services 55, 63, 92, 93, 95
27. Housing, utilities, 43. Electricity; 44. Gas manufacture and distribution; 45. Water; 401, 402, 403, 41, 45, 90and construction 46. Construction; 57. Dwellings
Source: Betina V. Dimaranan and Robert A. McDougall, eds., Global Trade, Assistance, and Production: The GTAP 6 Data Base (West Lafayette,Ind.: Center for Global Trade Analysis, Purdue University, 2006).

On the macroeconomic side, householdsavings, government surplus (deficit), andforeign capital inflows (foreign savings) areassumed to be perfect substitutes and collec-tively constitute the source of gross investmentin each region. Because balance of trade andgovernment surplus (deficit) are fixed at thebase year level during simulation, domestic
private savings is assumed to adjust to achievesaving–investment balance after a trade policychange.
The structure of production in the model isshown in figure A.1 and the structure ofdemand in figure A.2. The price system in themodel is shown in figure A.3.
Carnegie Endowment for International Peace 79
ROTCESTUPTUO
DEDDA-EULAV
STROPXE
CITSEMODYLPPUS
ETAIDEMRETNISTUPNI
STUPNIROTCAF
......
yticitsaletnatsnoCnoitamrofsnartfo
yticitsaletnatsnoCnoitutitsbusfo
detropmIcitsemoDdetropmIcitsemoDtcudorp1tcudorp1tcudorp n tcudorp n
etisopmoC.....etisopmoCetisopmoCdoog2doog1doog n
noitroporpdexiFstnemeriuqertupni
latipaClarutaNdellikSdelliksnUlarutlucirgAlarutlucirgAsecruoserrobalrobalrobaldnal
gniziminim-tsoCeldnubtupni
yticitsaletnatsnoCnoitutitsbusfo
Figure A.1. Structure of Production
DLOHESUOH
NOITPMUSNOC
TNEMNREVOGGNIDNEPS
DNAMEDLATOT
m SDOOGETISOPMOC
TNEMTSEVNIDNAMED
ETAIDEMRETNIDNAMED
1leveL
gnomanoitutitsbuSdnaseirogetac
seitidommoc
2leveL
neewtebnoitutitsbuStropmidnacitsemod
etisopmoc
3leveL
gnomanoitutitsbuStnereffidmorfstropmi
secruos
SEC
gniziminim-tsoCeldnubytidommocCITSEMOD
DNAMED
DETROPMIDNAMED
morfstropmI1noiger
morfstropmI2noiger
stropmI.…
morfstropmInoiger n
SELEdexiFerahs
SEC
Leontief
Figure A.2. Structure of Demand
Notes: CES = constant elasticity of substitution. ELES = extended linear expenditure system.

In addition to changes in terms of trade andtrade volumes, the model captures two addi-tional types of gains from trade liberalization.The first is gains from more efficient utilizationof resources, which lead to a one-time perma-nent increase in gross domestic product (GDP)and social welfare. The second stems from thefact that empirical evidence suggests that thereis positive feedback between trade expansionand productivity growth. The model incorpo-rates a capital- and intermediate-goodsimport-embodied technology transfer amongregions, which links sector-specific total factorproductivity (TFP) growth with each region’simports of capital- and technology-intensiveproducts. The technology transfer is assumedto flow in one direction—from more developedregions to less developed regions. Trade liber-alization increases the prevalence of tech-nology transfer as trade barriers are reduced.Firms in the liberalized regions will import
more capital- and technology-intensive goodsas both investment and intermediate inputsfrom abroad at cheaper prices. Those goodsare usually embodied with advanced tech-nology from other countries, thus stimulatingproductivity growth for all production factors.
II. Algebraic Specification of the Model
This section provides a detailed mathematicalspecification of the model. Definitions of vari-ables are found in table A.3 and definitions ofparameters in table A.4. Equations are shownin box A.1. The model is implemented by theGeneral Algebraic Modeling System (GAMS)and solved in levels.41
Notation:
■ Regions are defined in set R and indexed byr or s;
80 Winners and Losers: Impact of the Doha Round on Developing Countries
dedda-eulaVecirp
etagerggAetaidemretni
ecirptupniremusnoC
ecirp
etisopmoCdoogsecirp
SECnoitcnuf
SECnoitcnuf
ecirp.f.i.cnoigerfo r
tropmIecirp
egarevAtuptuo
ecirp
SECnoitcnuf
recudorPecirp
xattropxEetaregnahcxE
ecirp.b.o.fnoigerfo r
tropxEecirp
ecirp.f.i.cnoigerfo s
noitcudorPxat
citsemoDecirp
ecirp.b.o.fnoigerfo s
tsocgnippihS
noitr
opor
pdexiF
xatselaS
ffiraTegnahcxe
etar
TECnoitcnuf
tsoc
gnippi
hS
Figure A.3. Price System in the Model
Note: CES = constant elasticity of substitution. CET = constant elasticity of transformation. f.o.b. = free on board. c.i.f. = cost, insurance,freight.

■ Sectors are defined in set I and indexed by ior j;
■ Agricultural sectors are defined as a subsetof I: IAG(I);
■ Natural resource based sectors are definedas a subset of I: RES(I);
■ Primary factors are defined in set F andindexed by f.
Conventions:
Uppercase English letters indicate variables.Those marked with a bar on top are set exoge-
Carnegie Endowment for International Peace 81
Table A.3. Definitions of Variables
Variable Definition No. of Variables
PWEisr World f.o.b. price for goods from region s to region r I × R(R-1) (13,662)PWMisr World c.i.f. price for goods from region s to region r I × R(R-1) (13,662)PMir Price of aggregate imported goods in region r I × R (621)PXir Price of composite goods in region r I × R (621)PDir Price of domestic products sold at domestic market in region r I × R (621)PEir Price of domestic goods for export in region r I × R (621)PCir Domestic consumer price in region r I × R (621)PPir Average output price before production tax in region r I × R (621)Pir Average output price after production tax in region r I × R (621)PFfr Factor price in region r F × R (138)PVir Price of value added in region r I × R (621)PNir Price of aggregate intermediate inputs in region r I × R (621)CPIr Price of savings in region r (consumer price index) R (23)ERr Exchange rate of region r R (23)PIDr Price index in region r R (23)Qir Sector output in region r I × R (621)VAir Variable sector production cost in region r I × R (621)NXir Aggregate sector intermediate input in region r I × R (621)DFfir Sector factor demand in region r (F-3) × I × R + (IAG + RES) × R (2,024)DXir Sector domestic sales in region r I × R (621)EXir Domestic goods for export in region r I × R (621)Cir Household consumption in region r I × R (621)GCir Government spending in region r I × R (621)IDir Investment demand in region r I × R (621)TXir Composite goods demand (supply) in region r I × R (621)MXir Sector composite goods imports in region r I × R (621)Xisr Trade flows from region s to region r I × R(R-1) (13,662)TRQ Total international transportation supply 1PTR Price of international shipping service 1TRQDir International shipping demand by region r I × R (621)TRQSr International shipping service supply by region r R (23)HDIr Household disposable income in region r R (23)SYr Household supernumerary income in region r R (23)GRr Total government revenue in region r R (23)GSPr Total government spending in region r R (23)TARIFFr Total tariff revenue in region r R (23)ETAXr Total export tax revenue (subsidy expenditure) in region r R (23)PTAXr Total production tax revenue in region r R (23)CTAXr Total consumer sales tax in region r R (23)SAVr Household savings in region r R (23)GSAVr Government saving (deficit) in region r R (23)GTRNSr Government transfer in region r R (23)BOTr Balance of trade in region r (net capital inflow) R (23)INVr Gross investment by region r R (23)ITFPir Import embodied TFP shifter by sector in region r I × R (621)FSfr Factor endowment by region r F × R (138)
TToottaall nnuummbbeerr ooff vvaarriiaabblleess:17 × R + (2 × F + IAG + RES) × R + 21 × I × R + 3 × I × R(R - 1) + (F - 3) × I × R + 2 (56,720)
Note: f.o.b. = free on board. c.i.f. = cost, insurance, freight. TFP = total factor productivity.

nously. Greek letters or lowercase Englishletters refer to parameters, which need to becalibrated or supplied from exogenoussources. When multiple subscripts of a variableor parameter come from the same set, the firstone represents the region or sector supplyinggoods; the next one represents the region orsector purchasing goods.
Price Equations
Equations 1 through 11 are price equations inthe model. Equations 1 and 2 define the rela-
tionship between border (world) prices andinternal prices, while equations 3, 4, 6, 7, and 8define price indices for aggregate importedgoods, Armington goods, composite valueadded, and the firm’s output with and withoutproduction taxes, respectively. In equations 3,4, 6, and 7, the price indices are the unit costfunctions, while in equation 8 they are unitrevenue functions, all of which are dual to thecorresponding unit quantity aggregator func-tions. For example, equation 7 is the result ofcost minimization by the representative firm ineach sector with respect to its aggregate factor
82 Winners and Losers: Impact of the Doha Round on Developing Countries
Table A.4. Definitions of Parameters
Parameter Definition
teisr Sector export tax (subsidy) rate for goods to region r from region stmisr Sector tariff rate for goods from region s in region rtnisr Sector NTB for goods from region s in region rtpir Sector indirect tax rate in region rtcir Consumer sales tax rate in region rtrcisr International transportation cost margin as percent value of f.o.b. ioijr Input/output coefficients for region rkioir Sector share of total investment in region rdkr Depreciation rate of capital stock in region rτr Regional share of international shipping service supplyΓir Unit coefficients in first level Armington aggregation function of region r∝ir Unit coefficients in second level Armington aggregation function of region rαir Share parameters in the first level Armington aggregation function of region rξir Share parameters in the second level Armington aggregation function of region rσmi Substitution elasticities between domestic and imported goodsσti Substitution elasticities among import goods from different regions χir Unit coefficients in CET function of region rκIr Share parameters in CET function of region rσei Elasticities of transformation between domestic sales and exportsAir Unit parameter in aggregate cost functionλIr Intermediate input share in aggregate cost functionσpir Elasticities of substitution between aggregate factor and intermediate inputΛir Unit parameter in value added functionδfir Factor share in value added functionσvir Elasticities of substitution among primary factors in value addedγir Sector minimum subsistence requirements for private households in region rβir Marginal propensity to consume for private households in region rMpsr Marginal propensity to save for private households in region rθir Sector share of government spending in region rTfpr General TFP shifter in region rImsir The share of intermediate inputs in sector’s total imports σipir Elasticity between intermediate goods import growth with TFP growth dlr Land depletion rate in region rDsr Share of additional tertiary education stock to skilled labor force at each period tϕr Parameter that controls the speed of wage convergence between agricultural and unskilled laborNrt Population growth rate in region r at period tWdfr Wage ratio of agricultural labor and unskilled labor in region r at base year
Note: NTB = nontariff barrier. CET = constant elasticity of transformation. TFP = total factor productivity.

and inputs, subject to a constant elasticity ofsubstitution (CES) production function. SinceCES functions are used as the building blocksof the basic model, and this quantity aggre-gator function is homogeneous of degree one,the total costs can be written as total quantitymultiplied by unit cost.42 This implies that theaverage cost, under cost minimization, is inde-pendent of the number of units produced orpurchased. Thus, the unit cost function alsostands for the price of the composed com-modity. Equation 5 defines the unit price foraggregate inputs, which is the input–outputcoefficient weighted sum of all the value of itscontents. Equation 9 states the domestic con-sumer price is the Armington goods price plussales taxes. Equation 10 specifies an economy-wide consumer price index, which is used asprice of household savings. Equation 11defines the numeraire in the model.
Factor Demand and Firms’ Supply Equations
Equation 12 and 13 specify the demand func-tions for aggregate factor and intermediateinputs, while equation 14 gives demand func-tions of each primary factor. They equal unitdemand function multiplied by the quantities oftotal output, and the unit demand functions areobtained by taking partial derivatives of the unitcost functions (equation 6 and 7) with respect tothe relevant factor prices, according toShephard’s lemma.
Equations 15 through 18 are the domestic andexport supply functions corresponding to theconstant elasticity of transformation (CET) func-tion commonly used in today’s AGE models.They are derived from revenue maximization,subject to the CET function, in a way similar tothe derivation of factor demand functions.Equation 19 aggregates exports by the repre-sentative firm in each region, which implies thatproducers only differentiate output sold in
domestic and foreign markets but do not dif-ferentiate exports by destination (foreignmarkets are perfect substitutes). Equations 15through 18 can be partially or entirely turnedoff in the model; in such case, PDir = PEir = Pir
will be enforced and exports and domesticsales become perfect substitutes in the model.
Trade and Final Demand Equations
Trade and final demand equations are listed inequations 20 through 26. Equation 20 is the con-sumer demand function, which is the ExtendedLinear Expenditure System derived from maxi-mizing a Stone-Geary utility function subject tohousehold disposable income, which is specifiedin equation 31. Equation 21 defines householdsupernumerary income, which is disposableincome less total expenditure on the subsistenceminimum. Equations 22 and 23 give governmentand investment demand. Equations 24 through26 are demand functions for domestic goods, foraggregate imported goods, and for importedgoods by source, respectively. They describe thecost-minimizing choice of domestic and importpurchases, as well as import sources. They arederived from corresponding cost functionsaccording to Shephard’s lemma in a way similarto the derivation of factor demand functions(taking partial derivatives of the cost functionwith respect to the relevant component prices).Because of the linear homogeneity of the CESfunction, the cost function that is dual to thecommodity aggregator can be represented byits unit cost function (equations 3 and 4) multi-plied by total quantity demanded.
International Shipping Equations
Equations 27 through 30 describe the interna-tional shipping industry in the model.Equations 27 and 28 describe the supply sideof the international shipping industry. Equation27 states that at equilibrium, the returns fromshipping activity must cover its cost. Like other
Carnegie Endowment for International Peace 83
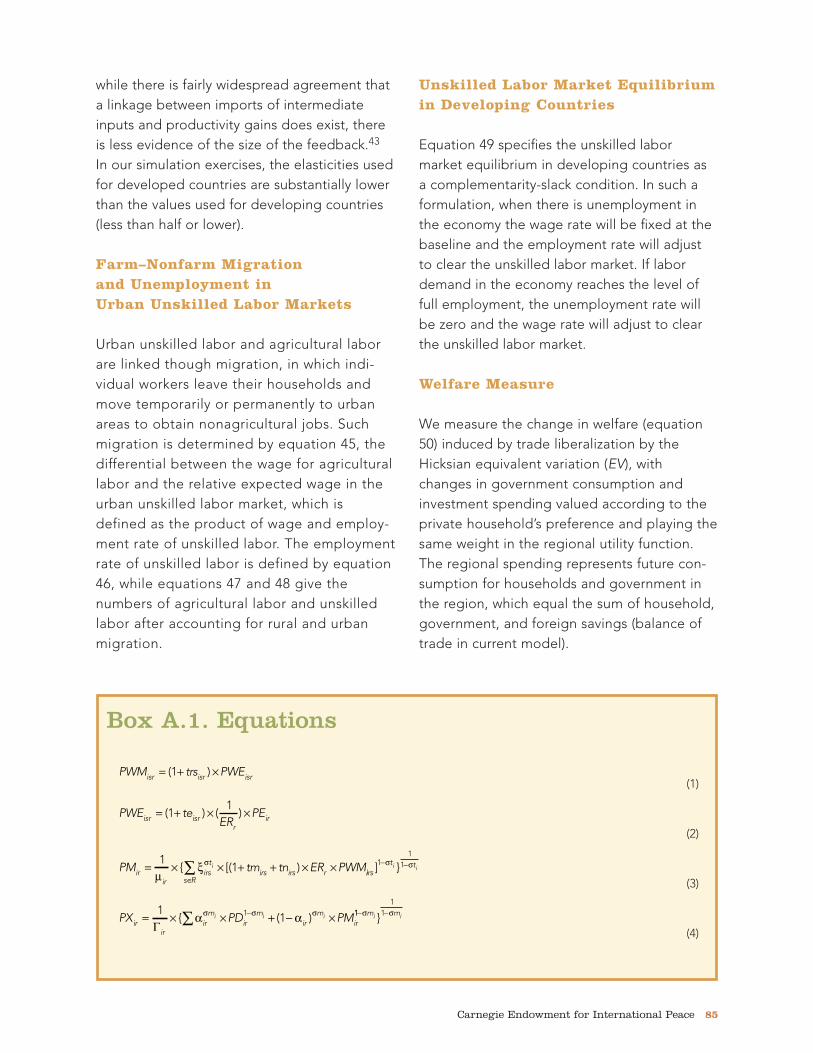
industries in the model, it also earns zeroprofit. Equation 28 describes the demand foreach region’s service sector exports to theinternational shipping industry, which is gener-ated by the assumed Cobb-Douglas tech-nology in this industry. The next two equations(29 and 30) refer to the demand side of theinternational shipping industry. The demand forshipping services associated with commodity iin region r is generated by a fixed proportioninput requirement (Leontief) coefficient trsisr,which is routine/commodity specific (equation29). In equilibrium, the total demand for ship-ping service must equal total supply (equation30).
Income and Saving Equations
Equations 31 through 39 are income and savingequations in the model. Equations 31 and 32define household disposable income andsavings. Equations 33 through 37 determinegovernment revenue from production taxes,consumption taxes, tariffs, and export taxes (anegative value indicates a subsidy), respec-tively, while equations 38 and 39 define govern-ment transfers to households and the balanceof trade (foreign savings) in each region.
General Equilibrium Conditions
Equations 40 through 43 define general equi-librium conditions of the model, which aresystem constraints that the model economymust satisfy. For every sector in each region,the supply of the composite goods must equaltotal demand (equation 40), which is the sum ofhousehold consumption (Cir), government pur-chases (GCir), investment (IDir), and the firm’sintermediate demand. Similarly, the demandfor each factor in every region must equal theexogenously fixed supply (equation 41). In thisdual formulation, output in each region isdetermined by demand. Sectoral equilibrium is
determined in equation 42, unit output priceequals average cost, which is also the zeroprofit condition. Equation 43 describes themacroeconomic equilibrium identity in eachregion, which is also the budget constraint forthe investor. Because all agents in each region(households, government, investor, and firms)satisfy their respective budget constraints, it iswell known that the sum of the excess demandfor all goods is zero; that is, Walras’ law holdsfor each region. Therefore, there is a functionaldependence among the equations of themodel. One equation is redundant in eachregion and thus can be dropped.
There are 60,914 equations and 61,130 vari-ables in the model. Since the 144 factorendowment variables (FSr) are determined bybase year data, three additional sets of vari-ables (72) have to be set exogenously as macroclosures to make the model fully determinate.They are chosen from the following variablesfor alternative closures: (1) gross investment orgovernment transfer (INVr or GTRANSr), (2)balance of trade or exchange rate (BOTr orERr), and (3) government spending or surplus(deficit) (GSPr or GSAVr).
Trade–Productivity Linkages
Equation 44 links import embodied technologytransfer (via imports of capital goods and inter-mediate inputs) and total factor productivity.Where X0isr is the base year real trade flows, IMis a subset of I, including those productsembodied with advanced technology. It oper-ates through shared parameters and elastici-ties. An elasticity (ipir) of 0.1 implies that a 10percent increase in real imports of capital andtechnology intensive goods would result in anincrease of no more than 1 percent in TFP inthat sector, depending on the share of interme-diate inputs in the sector’s total imports. Aspointed out by Lewis, Robinson, and Wang,
84 Winners and Losers: Impact of the Doha Round on Developing Countries

while there is fairly widespread agreement thata linkage between imports of intermediateinputs and productivity gains does exist, thereis less evidence of the size of the feedback.43
In our simulation exercises, the elasticities usedfor developed countries are substantially lowerthan the values used for developing countries(less than half or lower).
Farm–Nonfarm Migration and Unemployment in Urban Unskilled Labor Markets
Urban unskilled labor and agricultural laborare linked though migration, in which indi-vidual workers leave their households andmove temporarily or permanently to urbanareas to obtain nonagricultural jobs. Suchmigration is determined by equation 45, thedifferential between the wage for agriculturallabor and the relative expected wage in theurban unskilled labor market, which isdefined as the product of wage and employ-ment rate of unskilled labor. The employmentrate of unskilled labor is defined by equation46, while equations 47 and 48 give thenumbers of agricultural labor and unskilledlabor after accounting for rural and urbanmigration.
Unskilled Labor Market Equilibriumin Developing Countries
Equation 49 specifies the unskilled labormarket equilibrium in developing countries asa complementarity-slack condition. In such aformulation, when there is unemployment inthe economy the wage rate will be fixed at thebaseline and the employment rate will adjustto clear the unskilled labor market. If labordemand in the economy reaches the level offull employment, the unemployment rate willbe zero and the wage rate will adjust to clearthe unskilled labor market.
Welfare Measure
We measure the change in welfare (equation50) induced by trade liberalization by theHicksian equivalent variation (EV), withchanges in government consumption andinvestment spending valued according to theprivate household’s preference and playing thesame weight in the regional utility function.The regional spending represents future con-sumption for households and government inthe region, which equal the sum of household,government, and foreign savings (balance oftrade in current model).
Carnegie Endowment for International Peace 85
Box A.1. Equations
(1)
(2)
(3)
(4)PX PD PMir
irir
mir
mir
mir
i i i= × × + − ×−111
Γ{ ( )α ασ σ σ 11
11− −∑ σ σm mi i}
PM tm tn ER PWMirir
irst
irs irs ri= × × + + × ×1
1µ
ξσ{ [( ) iirst
s R
ti i] }11
1−
∈
−∑ σ σ
PWE teER
PEisr isrr
ir= + × ×( ) ( )11
PWM trs PWEisr isr isr= + ×( )1

86 Winners and Losers: Impact of the Doha Round on Developing Countries
(5)
(6)
(7)
(8)
(9)
(10)
(11)
(12)
(13)
(14)
(15)
(16)
(17)
(18)
(19)
(20)
(21)SY HDI PCr r jr jr
j I= − ×
∈∑ γ
CPC
SYir irir
irr= + ×γ
β
EXPE
ER
tePWE Xir
ir
r
irsirs irs
s R= ×
+× ×
∈∑1
1( )
EXP
PEsv rsv r
esv r
sv r
sv
sv,
,,
,
,
( ) {( )= × − ×−111
χκσ
rr
esv r r
sv Q TRQS) ( ),σ × −
EXP
PEQir
ir
eir
ir
ir
eir
i i= × − × ×−( ) {( ) }1
11
χκσ σ � � � � for� � �s sv≠
DXP
PDsv rsv r
esv r
sv r
sv r
esv,
,,
,
,
( ) ( )= × ×−1 1
χκσ σ ssv Q TRQSsv r r× −( ),
DXP
PDQir
ir
eir
ir
ir
eir
i sv= × × ×−( ) ( )1 1
χκσ σ � � � forr� s sv≠
DFtfp ITFP
PV
PFfirir r ir
vfir
ir
f
i=× ×
× ×−( ) (1 1
Λσ δ
rr
vir fir
f F
i VA)σ δ× =∈∑ 1
VAA
PP
PVQir
ir
pir
ir
ir
pir
i i= × − × ×−( ) [( ) ]1
11 σ σλ
NXA
PP
PNQir
ir
pir
ir
ir
pir
i i= × × ×−( ) ( )1 1 σ σλ
PID PC CPIr ir rmps
i I
ir r= ×∈
∏ β
CPIPC C
PCO Cr
ir iri I
ir iri I
=×
×∈
∈
∑∑
PC tc PXir ir ir= + ×( )1
P PD PEirir
ire
ire
ire
irir i i= × × + − ×−1
11
χκ κσ σ σ{ ( ) 11
11− −σ σe ei i}
PPA
PN PVirir
irp
irp
irp
iri i i= × × + − ×−1
11{ ( )λ λσ σ σ 111
1− −σ σp pi i}
PVtfp ITFP
PFirir r ir
firv
frvi i=
× ×× × −1 1
11
Λ{ }δσ σ −−
∈∑ σv
f F
i
PN io PXjr ijr iri I
= ×∈∑

(22)
(23)
(24)
(25)
(26)
(27)
(28)
(29)
(30)
(31)
(32)
(33)
(34)
(35)
(36)
(37)
(38)GTRANS GR GSP GSVAr r r r= − −
ETAX te PE Xs isr is isri Ir R
= × ×∈∈∑∑
TARIFF tm tn ER PWM Xr isr irs r isr isri Is
= + × × ×∈∈∑ ( )
RR∑
CTAX tc PX C GC IDr ir ir ir ir iri I
= × + +∈∑ ( )
PTAX tp P Qr ir ir iri I
= × ×∈∑
SAVHDI PC C
CPIr
r ir iri I
r
=× ×
∈∑
GR PTAX CTAX TARIFF ETAXr r r r r= + + +
HDI PF FS dk FS GTRANSr fr fr r KAr rf F
= × − × +∈∑
TRQDPRT
trs PWE Xir isr isr isrs R
= × × ×∈∑1
( )
TRQSER
PPTR TRQr
r r
sv r
=×
× ×τ
,
TRQ TRQDiri Ir R
=∈∈∑∑
TRQPTR
P
ERTRQSsv r
rr
r R= × ×
∈∑1 ,
XPM
tm tnisrir
tisr
ir
isr irs
i= × ×+ +
−( ) { (( )
11
1
µξσ
×× ×× = ≠
∈∑
ER PWMMX s
r isr
tir isr
s R
i)σ ξ� � � � � � for�1 rr
MXPX
PMTXir
ir
mir
ir
ir
mir
i i= × − × ×−( ) {( ) }1
11
Γσ σα
DXPX
PDTXir
ir
mir
ir
ir
mir
i i= × × ×−( ) ( )1 1
Γσ σα
IDkio
PCINVir
ir
irr= ×
GCPC
GSPirir
irr= ×
θ
Carnegie Endowment for International Peace 87

88 Winners and Losers: Impact of the Doha Round on Developing Countries
(39)
(40)
(41)
(42)
(43)
(44)
(45)
(46)
(47)
(48)
(49)
(50)
� � � � � � � � EV � =� ( � HDI � -� CPI � x� SAV � )� � �r r r ri I∈∏ (( �
PC0PC
� ) � -� ( � HDI0 � -� SAV0 � )�
� � � � �
ir
irr r
irβ
� � � � � � � � � +� GSP � � � ( �PC0PC
� ) � -� GSri I
ir
ir
ir
∈∏ θ PP0 �+� INV � � � ( �
PC0PC
� ) � -� INVr ri I
ir
ir
kior
ir
∈∏ 00
( ) , ( ) (, , , ,1 0 0 1− = ⇒ = − ×EMR PF PF EMR Pul r ul r ul r ul r FF PFul r ul r, , )− =0 0
FS FS MIGRLr t RLr t rt, ,= −−1
FS FS MIGULr t ULr t rt, ,= +−1
EMRFS MIG UEM
FSul r tul r t r t ul r t
ul r t, ,
, , , , ,
, ,
=+ −
++ MIGr t,
PF
EMR PFwdfALr t
r t ULr tr
t r,
, ,
exp
×=
− ϕ
ITFP imsNX
NX VA
x
xir irir
ir ir
jsrs Rj IM= + ×
+× ∈∈
∑∑1
oo
VX
NX VAjsrs Rj IM
ip
ir
ir ir
ir
∈∈∑∑
++
σ
−−
1
INV dr FS CPI SAV GSAV ER BOTr r k r r r r r r= × + × + − ×, ( )
PPN NX PV VA tp P Q
Qirir ir ir ir ir ir ir
ir
=× + × + × ×
DF FSfir fri I
=∈∑
TX C GC ID io NXir ir ir ir ijr jrj I
= + + + ×∈
∑
BOT PWE XP
ERTRQS PWM Xr irs irs
sv r
rr isr isr
i= + × − ×,
∈∈∈∈∈∑∑∑∑
Is Ri Is R

III. Simulation Design
To estimate the impact of trade liberalizationbased on possible agreements in the DohaRound of WTO trade negotiations, compara-tive static counterfactual analysis is conducted.(The static counterfactual analysis is the empir-ical analogy of the comparative-static analysisthat is common in theoretical work.) Suchexperiments begin by assuming that the worldeconomy under study is in equilibrium (notnecessarily Walrasian type) in the presence ofcurrently existing policy regimes and for thedata in the benchmark year. In the baselinesimulation, the model will replicate this bench-mark equilibrium through a model solution(called calibration). This “benchmark” or“observed” equilibrium data set serves as thepoint of comparison for counterfactual-equilibrium analysis of hypothetical policychanges. The nature of this numericalcomparative-static approach enables us notonly to capture both terms-of-trade effects andStolper-Samuelson effects, but also to isolateeconomic growth effects from the impact dueto changes in trade policy.
We start our simulation exercises with sepa-rate simulations of full liberalization of agri-culture and of manufactures, first bydeveloped countries and then by developingcountries only. The purpose of conductingseparate simulations is to better understandthe relative importance of different sectoraland regional components in changes in tradepatterns and welfare induced by trade policy.These simulations are then cumulated into asimulation of full worldwide trade liberaliza-tion of both agriculture and manufactures (all
border protection and subsidies are reducedto zero for all countries in the model). Thisfull liberalization scenario, while not a plau-sible outcome of the Doha Round negotia-tions, serves as another reference benchmark,both with our more modest scenarios andwith other modeling exercises that presentfull liberalization scenarios. We then move tofour more realistic scenarios that could beconsidered plausible outcomes of the actualWTO negotiation. Again, agricultural andmanufacturing liberalization are modeledseparately and then cumulated in each sce-nario. Our goal is to quantify the impact ondeveloping countries of trade liberalization inagricultural and manufactured productsbased on plausible agreements from theDoha Round negotiations. A total of sixteencomparative-static simulations were con-ducted. A description of the main scenarios ispresented in table 2.4.
Our AGE model generates results regardingthe effects on GDP, real income (also referredto as welfare and technically, equivalent varia-tion or EV), terms of trade, volume of trade,output, consumption, returns to each factor,and changes in prices and resource allocation.The differences in results generated by thealternative simulation scenarios with the base-line scenario provide estimates of the relativeimpact of different trade liberalization agree-ments on the world economy. However, thoseestimates should be regarded as outcomesfrom conditional projections rather than asforecasts. In reality, actual trade and outputpatterns are affected by many more factorsthan trade liberalization, such as domesticmacroeconomic and income policy changes.
Carnegie Endowment for International Peace 89

90 Winners and Losers: Impact of the Doha Round on Developing Countries
Table A.5. Economic Data, Factor Endowments, and Trade Dependence for Regions in the Model
Rest of Middle EastRest of South Russia and North
Measure China Indonesia Vietnam ASEAN India Bangladesh Asia and FSU Africa
GDP and trade flows (billions of dollars)GDP 1159 145 33 353 477 47 100 414 1028Exports 383 70 15 237 60 8 21 109 276Imports 278 46 25 177 58 10 21 91 286
Relative size in the world (percent)GDP 3.7 0.5 0.1 1.1 1.5 0.2 0.3 1.3 3.3Exports 7.2 1.3 0.3 4.4 1.1 0.2 0.4 2.0 5.2Imports 5.0 0.8 0.5 3.2 1.1 0.2 0.4 1.7 5.2
Trade dependence (percent)Exports/output 33.0 48.5 44.4 67.0 12.6 17.0 20.6 26.2 26.9Imports/absorption 24.0 31.5 76.0 50.1 12.2 21.6 21.2 22.0 27.9
Share of factor endowment (percent) Land 10.2 1.5 0.5 2.7 11.5 0.6 2.4 14.0 5.7Agricultural labor 28.5 4.4 2.5 5.3 23.4 3.4 4.1 1.8 3.8Unskilled labor 24.6 3.4 0.9 3.0 10.8 2.0 2.0 6.0 5.0Skilled labor 15.6 1.2 0.4 2.9 6.9 0.8 2.1 9.7 8.2Total labor 25.0 3.5 1.4 3.9 15.2 2.4 2.8 4.9 4.9Capital 3.2 0.4 0.1 1.2 1.2 0.1 0.3 1.6 3.2
Factor share in value-added (percent)Land 4.8 6.2 6.2 4.1 10.0 5.0 10.8 3.0 1.1Agricultural labor 11.4 5.7 6.0 4.7 9.4 4.6 10.1 7.0 5.7Unskilled labor 36.0 22.8 29.5 25.4 28.5 47.1 31.2 35.0 30.1Skilled labor 10.5 7.1 7.9 10.0 10.3 9.6 10.4 13.7 13.3Total labor 57.9 35.6 43.4 40.1 48.2 61.2 51.7 55.7 49.1Capital 37.4 58.2 50.4 55.9 41.8 33.8 37.6 41.3 49.8
Skill distribution of labor force (percent)Agricultural labor 43.6 47.7 66.9 52.2 59.2 54.7 55.5 14.3 29.8Unskilled labor 48.9 48.2 30.0 38.8 35.4 41.1 35.5 61.6 50.3Skilled labor 7.5 4.1 3.1 9.0 5.4 4.2 9.0 24.0 19.9
Unemployment rate (percent)Urban unskilled labor 3.6 8.0 3.1 5.5 9.2 27.0 9.3 0.0 10.6
Capital and land intensityCapital/labor ($1000 per worker) 3.7 3.0 2.2 9.1 2.3 1.5 2.6 9.5 18.3Land/labor (hectares per worker) 0.19 0.2 0.16 0.33 0.36 0.11 0.4 1.37 0.55
Relative factor price (ratio)Capital rent/wage 18.52 59.78 56.50 16.26 42.34 52.20 30.61 7.83 6.07Land rent/wage 45.14 96.53 94.49 32.49 63.59 102.12 57.66 3.97 4.42Capital rent/land rent 0.41 0.62 0.60 0.50 0.67 0.51 0.53 1.97 1.38
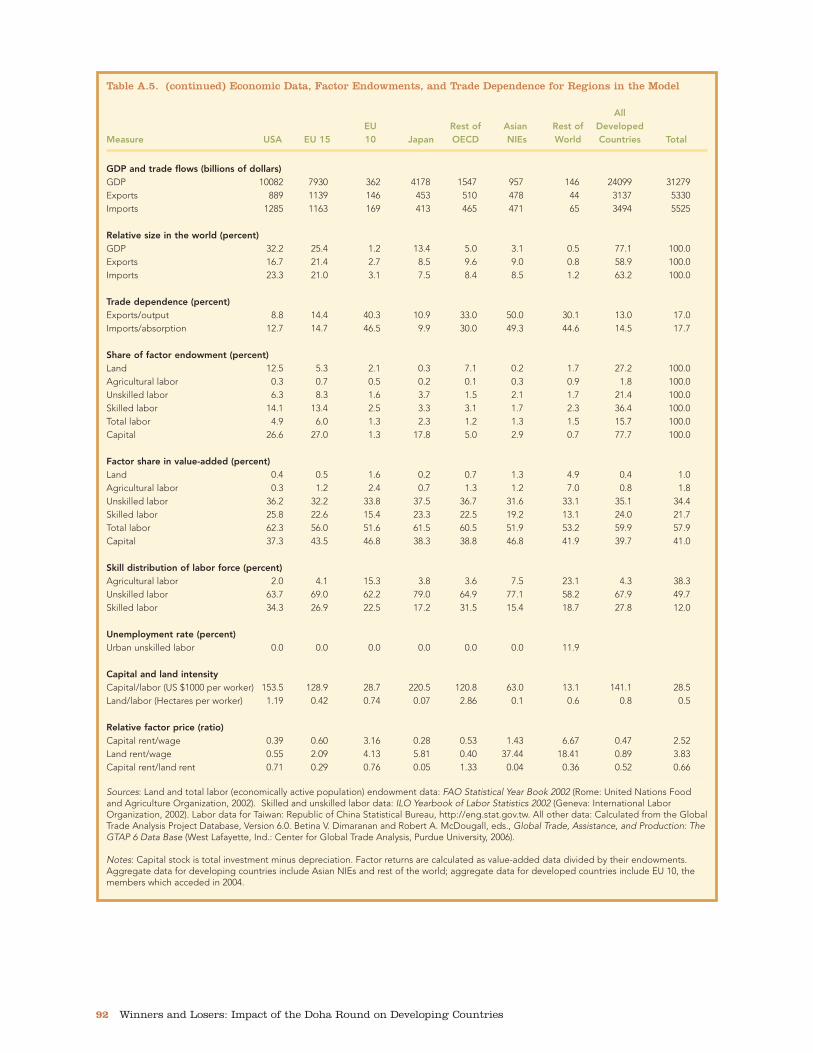
Carnegie Endowment for International Peace 91
Table A.5. (continued) Economic Data, Factor Endowments, and Trade Dependence for Regions in the Model
Rest of Rest of Central AllSouth East Sub-Saharan Latin America and Developing
Measure Africa Africa Africa Brazil Mexico Argentina America Caribbean Countries
GDP and trade flows (billions of dollars)GDP 113 17 192 503 618 269 382 226 7180Exports 39 3 59 67 165 30 73 57 2193Imports 28 4 70 75 149 27 71 78 2032
Relative size in the world (percent)GDP 0.4 0.1 0.6 1.6 2.0 0.9 1.2 0.7 23.0Exports 0.7 0.1 1.1 1.3 3.1 0.6 1.4 1.1 41.2Imports 0.5 0.1 1.3 1.4 2.7 0.5 1.3 1.4 36.8
Trade dependence (percent)Exports/output 34.0 16.5 31.0 13.4 26.8 11.2 19.2 25.1 30.6Imports/absorption 25.1 26.1 36.3 14.9 24.1 10.1 18.6 34.7 28.3
Share of factor endowment (percent) Land 1.1 0.8 9.5 4.2 1.8 2.4 1.4 0.8 72.9Agricultural labor 0.2 2.5 13.5 1.1 0.8 0.1 1.1 0.8 98.2Unskilled labor 1.0 0.4 5.2 4.0 1.9 0.8 2.6 1.3 78.6Skilled labor 0.7 0.3 3.4 2.4 1.1 0.7 2.0 1.1 63.6Total labor 0.6 1.2 8.2 2.7 1.4 0.5 2.0 1.1 84.3Capital 0.5 0.0 0.6 1.7 2.1 0.8 1.1 0.7 22.3
Factor share in value-added (percent)Land 0.5 5.2 2.0 0.8 1.6 1.5 2.6 2.1 3.1Agricultural labor 1.4 27.1 12.8 1.2 2.3 2.5 4.7 3.7 5.7Unskilled labor 47.6 22.3 37.0 37.6 20.5 40.3 31.0 36.3 32.0Skilled labor 16.2 6.2 10.4 20.2 9.8 16.5 13.1 14.6 13.4Total labor 65.2 55.6 60.1 59.0 32.7 59.3 48.7 54.7 51.0Capital 34.3 39.3 37.9 40.3 65.7 39.3 48.7 43.2 45.9
Skill distribution of labor force (percent)Agricultural labor 9.2 80.3 63.4 16.1 20.8 9.5 21.2 26.6 44.6Unskilled labor 76.7 16.6 31.7 73.1 69.8 73.8 66.5 60.6 46.3Skilled labor 14.0 3.1 4.9 10.8 9.4 16.7 12.3 12.8 9.0
Unemployment rate (percent)Urban unskilled labor 21.4 7.2 16.9 8.6 1.7 16.4 10.5 13.6
Capital and land intensityCapital/labor (US $1000 per worker) 20.5 0.8 2.1 18.0 42.8 41.7 15.5 18.3 7.5Land/labor (hectares per worker) 0.8 0.32 0.55 0.73 0.6 2.2 0.35 0.35 0.41
Relative factor price (ratio)Capital rent/wage 3.19 97.75 39.02 4.04 4.77 1.81 7.04 4.86 12.82Land rent/wage 1.23 32.57 7.77 1.89 8.07 1.29 16.80 12.64 16.09Capital rent/land rent 2.60 3.00 5.02 2.14 0.59 1.40 0.42 0.38 0.80
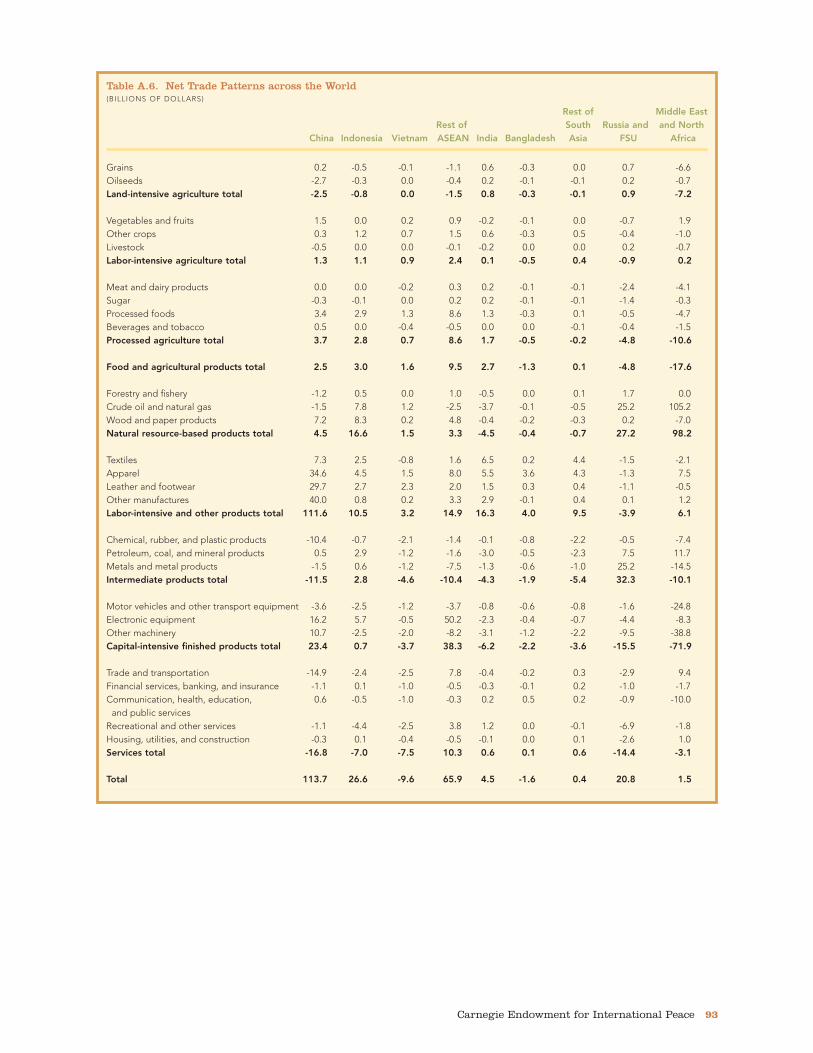
92 Winners and Losers: Impact of the Doha Round on Developing Countries
Table A.5. (continued) Economic Data, Factor Endowments, and Trade Dependence for Regions in the Model
AllEU Rest of Asian Rest of Developed
Measure USA EU 15 10 Japan OECD NIEs World Countries Total
GDP and trade flows (billions of dollars)GDP 10082 7930 362 4178 1547 957 146 24099 31279Exports 889 1139 146 453 510 478 44 3137 5330Imports 1285 1163 169 413 465 471 65 3494 5525
Relative size in the world (percent)GDP 32.2 25.4 1.2 13.4 5.0 3.1 0.5 77.1 100.0Exports 16.7 21.4 2.7 8.5 9.6 9.0 0.8 58.9 100.0Imports 23.3 21.0 3.1 7.5 8.4 8.5 1.2 63.2 100.0
Trade dependence (percent)Exports/output 8.8 14.4 40.3 10.9 33.0 50.0 30.1 13.0 17.0Imports/absorption 12.7 14.7 46.5 9.9 30.0 49.3 44.6 14.5 17.7
Share of factor endowment (percent) Land 12.5 5.3 2.1 0.3 7.1 0.2 1.7 27.2 100.0Agricultural labor 0.3 0.7 0.5 0.2 0.1 0.3 0.9 1.8 100.0Unskilled labor 6.3 8.3 1.6 3.7 1.5 2.1 1.7 21.4 100.0Skilled labor 14.1 13.4 2.5 3.3 3.1 1.7 2.3 36.4 100.0Total labor 4.9 6.0 1.3 2.3 1.2 1.3 1.5 15.7 100.0Capital 26.6 27.0 1.3 17.8 5.0 2.9 0.7 77.7 100.0
Factor share in value-added (percent)Land 0.4 0.5 1.6 0.2 0.7 1.3 4.9 0.4 1.0Agricultural labor 0.3 1.2 2.4 0.7 1.3 1.2 7.0 0.8 1.8Unskilled labor 36.2 32.2 33.8 37.5 36.7 31.6 33.1 35.1 34.4Skilled labor 25.8 22.6 15.4 23.3 22.5 19.2 13.1 24.0 21.7Total labor 62.3 56.0 51.6 61.5 60.5 51.9 53.2 59.9 57.9Capital 37.3 43.5 46.8 38.3 38.8 46.8 41.9 39.7 41.0
Skill distribution of labor force (percent)Agricultural labor 2.0 4.1 15.3 3.8 3.6 7.5 23.1 4.3 38.3Unskilled labor 63.7 69.0 62.2 79.0 64.9 77.1 58.2 67.9 49.7Skilled labor 34.3 26.9 22.5 17.2 31.5 15.4 18.7 27.8 12.0
Unemployment rate (percent)Urban unskilled labor 0.0 0.0 0.0 0.0 0.0 0.0 11.9
Capital and land intensityCapital/labor (US $1000 per worker) 153.5 128.9 28.7 220.5 120.8 63.0 13.1 141.1 28.5Land/labor (Hectares per worker) 1.19 0.42 0.74 0.07 2.86 0.1 0.6 0.8 0.5
Relative factor price (ratio)Capital rent/wage 0.39 0.60 3.16 0.28 0.53 1.43 6.67 0.47 2.52Land rent/wage 0.55 2.09 4.13 5.81 0.40 37.44 18.41 0.89 3.83Capital rent/land rent 0.71 0.29 0.76 0.05 1.33 0.04 0.36 0.52 0.66
Sources: Land and total labor (economically active population) endowment data: FAO Statistical Year Book 2002 (Rome: United Nations Foodand Agriculture Organization, 2002). Skilled and unskilled labor data: ILO Yearbook of Labor Statistics 2002 (Geneva: International LaborOrganization, 2002). Labor data for Taiwan: Republic of China Statistical Bureau, http://eng.stat.gov.tw. All other data: Calculated from the GlobalTrade Analysis Project Database, Version 6.0. Betina V. Dimaranan and Robert A. McDougall, eds., Global Trade, Assistance, and Production: TheGTAP 6 Data Base (West Lafayette, Ind.: Center for Global Trade Analysis, Purdue University, 2006).
Notes: Capital stock is total investment minus depreciation. Factor returns are calculated as value-added data divided by their endowments.Aggregate data for developing countries include Asian NIEs and rest of the world; aggregate data for developed countries include EU 10, themembers which acceded in 2004.

Carnegie Endowment for International Peace 93
Table A.6. Net Trade Patterns across the World (BILLIONS OF DOLLARS)
Rest of Middle EastRest of South Russia and and North
China Indonesia Vietnam ASEAN India Bangladesh Asia FSU Africa
Grains 0.2 -0.5 -0.1 -1.1 0.6 -0.3 0.0 0.7 -6.6Oilseeds -2.7 -0.3 0.0 -0.4 0.2 -0.1 -0.1 0.2 -0.7Land-intensive agriculture total -2.5 -0.8 0.0 -1.5 0.8 -0.3 -0.1 0.9 -7.2
Vegetables and fruits 1.5 0.0 0.2 0.9 -0.2 -0.1 0.0 -0.7 1.9Other crops 0.3 1.2 0.7 1.5 0.6 -0.3 0.5 -0.4 -1.0Livestock -0.5 0.0 0.0 -0.1 -0.2 0.0 0.0 0.2 -0.7Labor-intensive agriculture total 1.3 1.1 0.9 2.4 0.1 -0.5 0.4 -0.9 0.2
Meat and dairy products 0.0 0.0 -0.2 0.3 0.2 -0.1 -0.1 -2.4 -4.1Sugar -0.3 -0.1 0.0 0.2 0.2 -0.1 -0.1 -1.4 -0.3Processed foods 3.4 2.9 1.3 8.6 1.3 -0.3 0.1 -0.5 -4.7Beverages and tobacco 0.5 0.0 -0.4 -0.5 0.0 0.0 -0.1 -0.4 -1.5Processed agriculture total 3.7 2.8 0.7 8.6 1.7 -0.5 -0.2 -4.8 -10.6
Food and agricultural products total 2.5 3.0 1.6 9.5 2.7 -1.3 0.1 -4.8 -17.6
Forestry and fishery -1.2 0.5 0.0 1.0 -0.5 0.0 0.1 1.7 0.0Crude oil and natural gas -1.5 7.8 1.2 -2.5 -3.7 -0.1 -0.5 25.2 105.2Wood and paper products 7.2 8.3 0.2 4.8 -0.4 -0.2 -0.3 0.2 -7.0Natural resource-based products total 4.5 16.6 1.5 3.3 -4.5 -0.4 -0.7 27.2 98.2
Textiles 7.3 2.5 -0.8 1.6 6.5 0.2 4.4 -1.5 -2.1Apparel 34.6 4.5 1.5 8.0 5.5 3.6 4.3 -1.3 7.5Leather and footwear 29.7 2.7 2.3 2.0 1.5 0.3 0.4 -1.1 -0.5Other manufactures 40.0 0.8 0.2 3.3 2.9 -0.1 0.4 0.1 1.2Labor-intensive and other products total 111.6 10.5 3.2 14.9 16.3 4.0 9.5 -3.9 6.1
Chemical, rubber, and plastic products -10.4 -0.7 -2.1 -1.4 -0.1 -0.8 -2.2 -0.5 -7.4Petroleum, coal, and mineral products 0.5 2.9 -1.2 -1.6 -3.0 -0.5 -2.3 7.5 11.7Metals and metal products -1.5 0.6 -1.2 -7.5 -1.3 -0.6 -1.0 25.2 -14.5Intermediate products total -11.5 2.8 -4.6 -10.4 -4.3 -1.9 -5.4 32.3 -10.1
Motor vehicles and other transport equipment -3.6 -2.5 -1.2 -3.7 -0.8 -0.6 -0.8 -1.6 -24.8Electronic equipment 16.2 5.7 -0.5 50.2 -2.3 -0.4 -0.7 -4.4 -8.3Other machinery 10.7 -2.5 -2.0 -8.2 -3.1 -1.2 -2.2 -9.5 -38.8Capital-intensive finished products total 23.4 0.7 -3.7 38.3 -6.2 -2.2 -3.6 -15.5 -71.9
Trade and transportation -14.9 -2.4 -2.5 7.8 -0.4 -0.2 0.3 -2.9 9.4Financial services, banking, and insurance -1.1 0.1 -1.0 -0.5 -0.3 -0.1 0.2 -1.0 -1.7Communication, health, education, 0.6 -0.5 -1.0 -0.3 0.2 0.5 0.2 -0.9 -10.0
and public servicesRecreational and other services -1.1 -4.4 -2.5 3.8 1.2 0.0 -0.1 -6.9 -1.8Housing, utilities, and construction -0.3 0.1 -0.4 -0.5 -0.1 0.0 0.1 -2.6 1.0Services total -16.8 -7.0 -7.5 10.3 0.6 0.1 0.6 -14.4 -3.1
Total 113.7 26.6 -9.6 65.9 4.5 -1.6 0.4 20.8 1.5
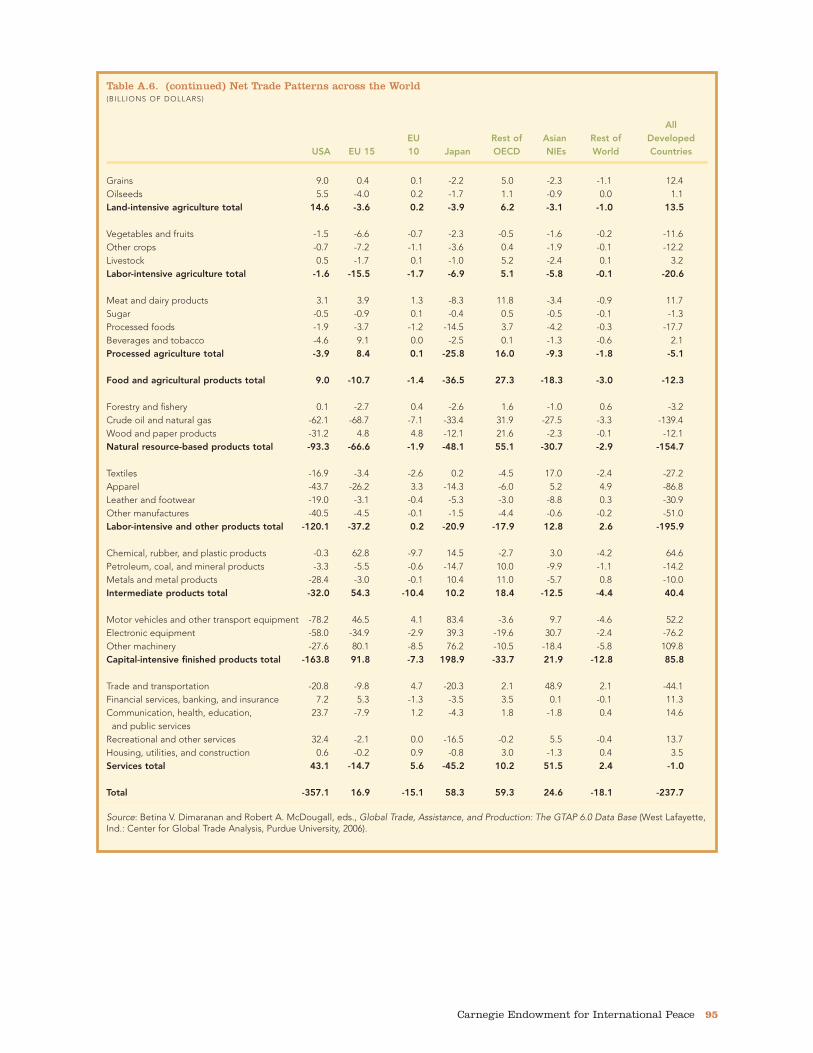
94 Winners and Losers: Impact of the Doha Round on Developing Countries
Table A.6. (continued) Net Trade Patterns across the World (BILLIONS OF DOLLARS)
Rest of Rest of Central AllSouth East Sub-Saharan Latin America and Developing Africa Africa Africa Brazil Mexico Argentina America Caribbean Countries
Grains 0.1 -0.1 -1.1 -0.4 -1.6 3.0 -1.1 -0.9 -12.4Oilseeds 0.0 0.0 0.2 2.7 -1.1 1.6 0.3 0.0 -1.1Land-intensive agriculture total 0.2 -0.1 -0.9 2.3 -2.8 4.6 -0.9 -0.9 -13.5
Vegetables and fruits 1.1 0.1 0.7 0.1 2.3 0.7 3.1 1.8 11.6Other crops 0.0 0.9 4.9 2.4 -0.4 0.2 1.7 1.3 12.2Livestock 0.1 0.0 0.2 0.1 -0.2 0.1 0.1 0.0 -3.2Labor-intensive agriculture total 1.2 1.1 5.9 2.7 1.7 1.0 4.8 3.1 20.6
Meat and dairy products 0.0 0.0 -1.0 2.7 -2.2 0.5 0.1 -0.9 -11.7Sugar 0.3 0.0 0.4 1.5 0.0 0.0 0.1 1.3 1.3Processed foods 0.1 0.0 -1.1 3.6 -0.6 5.4 3.4 -0.8 17.7Beverages and tobacco 0.4 0.0 -0.7 -0.1 1.5 0.1 0.4 0.4 -2.1Processed agriculture total 0.8 0.0 -2.5 7.7 -1.3 6.2 3.9 0.0 5.1
Food and agricultural products total 2.2 1.0 2.6 12.6 -2.3 11.7 7.9 2.2 12.3
Forestry and fishery 0.1 0.0 1.4 0.0 0.0 0.0 0.3 0.1 3.2Crude oil and natural gas -1.5 -0.1 20.3 -3.7 10.5 2.0 13.8 -2.4 139.4Wood and paper products 0.9 -0.1 -0.4 3.7 -0.8 -0.5 0.8 -2.0 12.1Natural resource-based products total -0.4 -0.2 21.3 0.0 9.7 1.5 15.0 -4.3 154.7
Textiles -0.2 -0.1 -1.9 -0.1 -0.4 -0.3 -1.2 -1.1 27.2Apparel 0.0 0.0 0.4 0.0 4.4 -0.1 0.0 3.6 86.8Leather and footwear -0.1 0.0 -0.1 2.3 -0.2 0.7 -0.2 -0.2 30.9Other manufactures 1.0 0.0 4.0 0.0 0.1 -0.3 -0.7 -0.9 51.0Labor-intensive and other products total 0.7 -0.1 2.4 2.3 3.9 -0.1 -2.2 1.4 195.9
Chemical, rubber, and plastic products -0.7 -0.5 -5.5 -6.7 -11.3 -2.0 -7.3 -3.9 -64.6Petroleum, coal, and mineral products 4.1 -0.2 -1.6 1.5 -1.4 0.6 9.1 -1.0 14.2Metals and metal products 9.9 0.0 -0.2 3.6 -3.5 0.4 7.7 -1.1 10.0Intermediate products total 13.3 -0.7 -7.3 -1.7 -16.2 -1.0 9.4 -6.1 -40.4
Motor vehicles and other transport equipment -1.3 -0.2 -8.3 1.5 8.3 -0.1 -6.5 -11.3 -52.2Electronic equipment -2.0 -0.2 -2.4 -4.4 10.3 -1.8 -4.9 -2.1 76.2Other machinery -1.9 -0.5 -9.0 -8.1 10.8 -2.7 -11.8 -5.6 -109.8Capital-intensive finished products total -5.1 -0.9 -19.7 -11.0 29.4 -4.6 -23.2 -19.1 -85.8
Trade and transportation 0.8 -0.1 -0.8 -2.5 -0.1 -1.8 -1.1 4.8 44.1Financial services, banking, and insurance 0.1 -0.1 -0.5 -0.6 -3.9 -0.5 -0.7 0.3 -11.3Communication, health, education, -0.1 -0.1 -0.5 -0.9 -0.7 -0.6 -0.2 1.2 -14.6
and public servicesRecreational and other services -0.5 -0.4 -4.3 -1.2 0.3 -0.4 -1.8 1.3 -13.7Housing, utilities, and construction 0.4 0.0 -0.2 -2.0 0.3 -0.2 1.8 0.0 -3.5Services total 0.7 -0.6 -6.3 -7.2 -4.2 -3.6 -2.0 7.6 1.0
Total 11.3 -1.4 -7.1 -4.9 20.3 4.0 5.0 -18.3 237.7

Carnegie Endowment for International Peace 95
Table A.6. (continued) Net Trade Patterns across the World (BILLIONS OF DOLLARS)
AllEU Rest of Asian Rest of Developed
USA EU 15 10 Japan OECD NIEs World Countries
Grains 9.0 0.4 0.1 -2.2 5.0 -2.3 -1.1 12.4Oilseeds 5.5 -4.0 0.2 -1.7 1.1 -0.9 0.0 1.1Land-intensive agriculture total 14.6 -3.6 0.2 -3.9 6.2 -3.1 -1.0 13.5
Vegetables and fruits -1.5 -6.6 -0.7 -2.3 -0.5 -1.6 -0.2 -11.6Other crops -0.7 -7.2 -1.1 -3.6 0.4 -1.9 -0.1 -12.2Livestock 0.5 -1.7 0.1 -1.0 5.2 -2.4 0.1 3.2Labor-intensive agriculture total -1.6 -15.5 -1.7 -6.9 5.1 -5.8 -0.1 -20.6
Meat and dairy products 3.1 3.9 1.3 -8.3 11.8 -3.4 -0.9 11.7Sugar -0.5 -0.9 0.1 -0.4 0.5 -0.5 -0.1 -1.3Processed foods -1.9 -3.7 -1.2 -14.5 3.7 -4.2 -0.3 -17.7Beverages and tobacco -4.6 9.1 0.0 -2.5 0.1 -1.3 -0.6 2.1Processed agriculture total -3.9 8.4 0.1 -25.8 16.0 -9.3 -1.8 -5.1
Food and agricultural products total 9.0 -10.7 -1.4 -36.5 27.3 -18.3 -3.0 -12.3
Forestry and fishery 0.1 -2.7 0.4 -2.6 1.6 -1.0 0.6 -3.2Crude oil and natural gas -62.1 -68.7 -7.1 -33.4 31.9 -27.5 -3.3 -139.4Wood and paper products -31.2 4.8 4.8 -12.1 21.6 -2.3 -0.1 -12.1Natural resource-based products total -93.3 -66.6 -1.9 -48.1 55.1 -30.7 -2.9 -154.7
Textiles -16.9 -3.4 -2.6 0.2 -4.5 17.0 -2.4 -27.2Apparel -43.7 -26.2 3.3 -14.3 -6.0 5.2 4.9 -86.8Leather and footwear -19.0 -3.1 -0.4 -5.3 -3.0 -8.8 0.3 -30.9Other manufactures -40.5 -4.5 -0.1 -1.5 -4.4 -0.6 -0.2 -51.0Labor-intensive and other products total -120.1 -37.2 0.2 -20.9 -17.9 12.8 2.6 -195.9
Chemical, rubber, and plastic products -0.3 62.8 -9.7 14.5 -2.7 3.0 -4.2 64.6Petroleum, coal, and mineral products -3.3 -5.5 -0.6 -14.7 10.0 -9.9 -1.1 -14.2Metals and metal products -28.4 -3.0 -0.1 10.4 11.0 -5.7 0.8 -10.0Intermediate products total -32.0 54.3 -10.4 10.2 18.4 -12.5 -4.4 40.4
Motor vehicles and other transport equipment -78.2 46.5 4.1 83.4 -3.6 9.7 -4.6 52.2Electronic equipment -58.0 -34.9 -2.9 39.3 -19.6 30.7 -2.4 -76.2Other machinery -27.6 80.1 -8.5 76.2 -10.5 -18.4 -5.8 109.8Capital-intensive finished products total -163.8 91.8 -7.3 198.9 -33.7 21.9 -12.8 85.8
Trade and transportation -20.8 -9.8 4.7 -20.3 2.1 48.9 2.1 -44.1Financial services, banking, and insurance 7.2 5.3 -1.3 -3.5 3.5 0.1 -0.1 11.3Communication, health, education, 23.7 -7.9 1.2 -4.3 1.8 -1.8 0.4 14.6
and public servicesRecreational and other services 32.4 -2.1 0.0 -16.5 -0.2 5.5 -0.4 13.7Housing, utilities, and construction 0.6 -0.2 0.9 -0.8 3.0 -1.3 0.4 3.5Services total 43.1 -14.7 5.6 -45.2 10.2 51.5 2.4 -1.0
Total -357.1 16.9 -15.1 58.3 59.3 24.6 -18.1 -237.7
Source: Betina V. Dimaranan and Robert A. McDougall, eds., Global Trade, Assistance, and Production: The GTAP 6.0 Data Base (West Lafayette,Ind.: Center for Global Trade Analysis, Purdue University, 2006).


To assess the impact of theapproach to developing countrylabor markets taken in theCarnegie model, we tested threeadditional versions of the model
using the same base year data but with dif-ferent labor market specifications. One versionincluded the three labor categories (agriculturallabor, urban unskilled labor, and skilled labor)with the assumption of full employment. Asecond included only two labor categories(unskilled labor and skilled labor) with the pres-ence of unemployment of unskilled labor. Afinal category included those two labor cate-gories with the assumption of full employment.
Table B.1 summarizes the main results from thesensitivity analysis. It illustrates the relativeimportance of different labor market specifica-tions to the aggregate real income changesfrom different Doha trade liberalization sce-narios. As might be expected, variation in thelabor market specification affects the predictedimpacts of a Doha trade agreement. Taking intoaccount the presence of unemployment ofunskilled labor in developing countries has asignificant impact both on results for thosecountries’ income gains and on the distributionof gains among developed and developingcountries. Under different scenarios, gains inreal income for developing countries as a groupcan be twice as large as under the assumptionof full employment, or even higher. Overall,
developing countries’ share of the global gainsfrom trade liberalization is about one-thirdhigher when unemployment in their economiesis taken into account.
The results for different developing countriesvary widely, depending on factors such as thelevel of unemployment and the competitive-ness of sectors that use unskilled labor in thoseeconomies. For example, China’s overallincome gains are more than twice as largewhen unemployment is included in the model.At the same time, a few developing countriesthat are less competitive would see smallergains or larger losses because of the extraadvantage that their more competitive counter-parts enjoy when wages are constrained byunemployment. Mexico and Central Americagain less, and Bangladesh loses more in theface of competition from countries withreserves of unemployed labor.
The sensitivity analysis suggests that modelsthat do not acknowledge unemployment indeveloping countries probably understate to asignificant degree gains for countries that havecompetitive manufacturing sectors, while mini-mizing the negative impacts on less competi-tive developing countries.
Modeling agricultural and unskilled laborseparately has only a very moderate impacton global income gains and their distribution
Carnegie Endowment for International Peace 97
A P P E N D I X B
Sensitivity Analysis
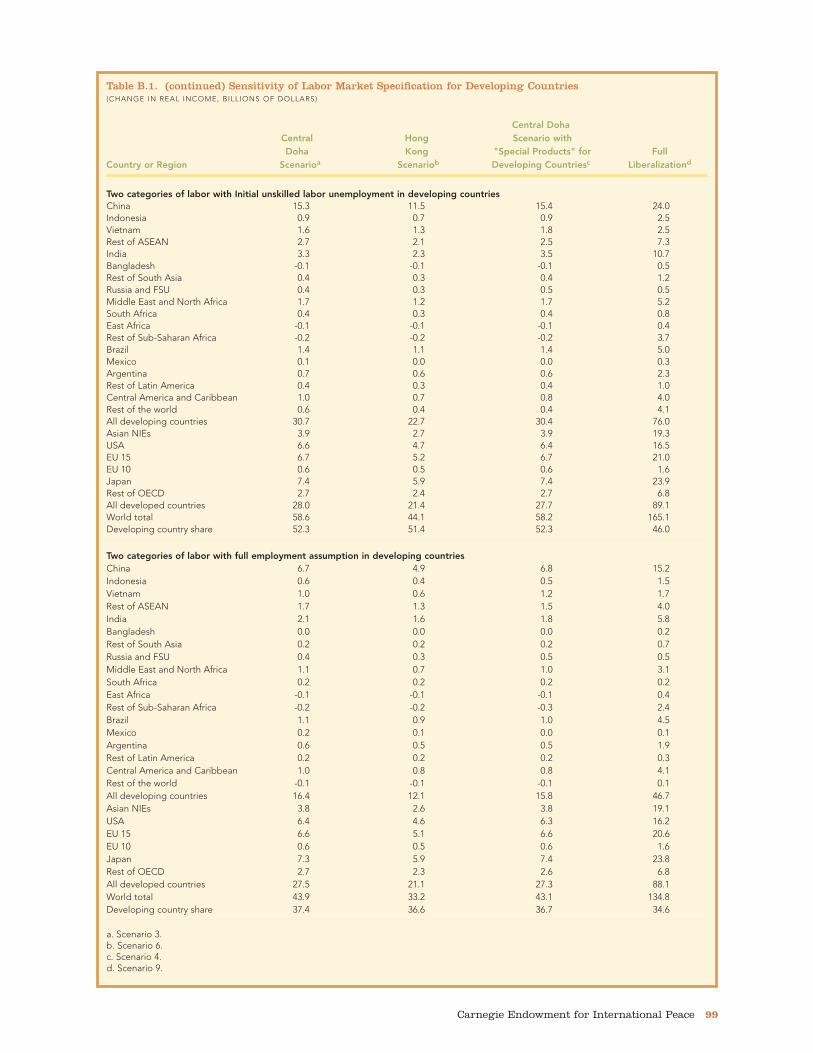
98 Winners and Losers: Impact of the Doha Round on Developing Countries
Table B.1. Sensitivity to Labor Market Specification for Developing Countries(CHANGE IN REAL INCOME, BILLIONS OF DOLLARS)
Central DohaCentral Hong Scenario withDoha Kong "Special Products" for Full
Country or Region Scenarioa Scenariob Developing Countriesc Liberalizationd
Three categories of labor with initial unskilled labor unemployment in developing countriesChina 14.5 10.3 14.4 21.6Indonesia 0.9 0.7 0.9 2.5Vietnam 2.4 1.6 2.7 5.4Rest of ASEAN 2.6 2.0 2.4 7.6India 3.1 2.2 3.1 10.2Bangladesh -0.1 -0.1 -0.1 0.5Rest of South Asia 0.4 0.3 0.3 1.2Russia and FSU 0.4 0.3 0.5 0.5Middle East and North Africa 1.7 1.2 1.6 5.2South Africa 0.4 0.3 0.4 0.8East Africa -0.1 -0.1 -0.1 0.4Rest of Sub-Saharan Africa -0.2 -0.2 -0.2 3.3Brazil 1.4 1.1 1.4 4.9Mexico 0.1 0.0 0.0 0.3Argentina 0.7 0.6 0.6 2.3Rest of Latin America 0.4 0.3 0.4 1.0Central America and Caribbean 1.0 0.7 0.8 4.0Rest of the world 0.5 0.3 0.4 3.5All developing countries 30.1 21.5 29.4 75.2Asian NIEs 3.8 2.6 3.8 20.5USA 6.5 4.6 6.3 16.1EU 15 6.9 5.3 6.9 21.3EU 10 0.6 0.5 0.6 1.6Japan 8.0 6.5 8.1 26.6Rest of OECD 2.7 2.3 2.7 6.9All developed countries 28.5 21.9 28.3 92.9World total 58.6 43.4 57.7 168.1Developing country share 51.4 49.5 51.0 44.7
Three categories of labor with full employment assumption in developing countriesChina 6.4 4.5 6.4 13.0Indonesia 0.6 0.4 0.6 1.6Vietnam 1.4 0.9 1.7 4.0Rest of ASEAN 1.6 1.1 1.5 4.0India 2.2 1.8 1.4 7.0Bangladesh -0.1 0.0 0.0 0.2Rest of South Asia 0.2 0.2 0.1 0.8Russia and FSU 0.4 0.3 0.5 0.5Middle East and North Africa 1.0 0.6 0.6 4.0South Africa 0.2 0.1 0.2 0.1East Africa -0.1 -0.1 -0.1 0.5Rest of Sub-Saharan Africa -0.3 -0.3 -0.3 2.3Brazil 0.5 0.3 0.4 1.6Mexico 0.2 0.2 -0.1 0.4Argentina 0.5 0.4 0.4 1.7Rest of Latin America 0.1 0.1 0.1 0.0Central America and Caribbean 1.0 0.8 0.8 4.1Rest of the world -0.2 -0.2 -0.1 0.0All developing countries 15.7 11.1 14.0 45.6Asian NIEs 3.8 2.6 3.8 20.4USA 6.3 4.4 6.1 15.7EU 15 6.8 5.3 6.8 21.2EU 10 0.6 0.5 0.6 1.6Japan 8.0 6.5 8.1 26.6Rest of OECD 2.7 2.3 2.6 6.8All developed countries 28.2 21.7 27.9 92.2World total 43.9 32.8 42.0 137.8Developing country share 35.8 33.9 33.4 33.1

Carnegie Endowment for International Peace 99
Table B.1. (continued) Sensitivity of Labor Market Specification for Developing Countries(CHANGE IN REAL INCOME, BILLIONS OF DOLLARS)
Central DohaCentral Hong Scenario withDoha Kong "Special Products" for Full
Country or Region Scenarioa Scenariob Developing Countriesc Liberalizationd
Two categories of labor with Initial unskilled labor unemployment in developing countriesChina 15.3 11.5 15.4 24.0Indonesia 0.9 0.7 0.9 2.5Vietnam 1.6 1.3 1.8 2.5Rest of ASEAN 2.7 2.1 2.5 7.3India 3.3 2.3 3.5 10.7Bangladesh -0.1 -0.1 -0.1 0.5Rest of South Asia 0.4 0.3 0.4 1.2Russia and FSU 0.4 0.3 0.5 0.5Middle East and North Africa 1.7 1.2 1.7 5.2South Africa 0.4 0.3 0.4 0.8East Africa -0.1 -0.1 -0.1 0.4Rest of Sub-Saharan Africa -0.2 -0.2 -0.2 3.7Brazil 1.4 1.1 1.4 5.0Mexico 0.1 0.0 0.0 0.3Argentina 0.7 0.6 0.6 2.3Rest of Latin America 0.4 0.3 0.4 1.0Central America and Caribbean 1.0 0.7 0.8 4.0Rest of the world 0.6 0.4 0.4 4.1All developing countries 30.7 22.7 30.4 76.0Asian NIEs 3.9 2.7 3.9 19.3USA 6.6 4.7 6.4 16.5EU 15 6.7 5.2 6.7 21.0EU 10 0.6 0.5 0.6 1.6Japan 7.4 5.9 7.4 23.9Rest of OECD 2.7 2.4 2.7 6.8All developed countries 28.0 21.4 27.7 89.1World total 58.6 44.1 58.2 165.1Developing country share 52.3 51.4 52.3 46.0
Two categories of labor with full employment assumption in developing countriesChina 6.7 4.9 6.8 15.2Indonesia 0.6 0.4 0.5 1.5Vietnam 1.0 0.6 1.2 1.7Rest of ASEAN 1.7 1.3 1.5 4.0India 2.1 1.6 1.8 5.8Bangladesh 0.0 0.0 0.0 0.2Rest of South Asia 0.2 0.2 0.2 0.7Russia and FSU 0.4 0.3 0.5 0.5Middle East and North Africa 1.1 0.7 1.0 3.1South Africa 0.2 0.2 0.2 0.2East Africa -0.1 -0.1 -0.1 0.4Rest of Sub-Saharan Africa -0.2 -0.2 -0.3 2.4Brazil 1.1 0.9 1.0 4.5Mexico 0.2 0.1 0.0 0.1Argentina 0.6 0.5 0.5 1.9Rest of Latin America 0.2 0.2 0.2 0.3Central America and Caribbean 1.0 0.8 0.8 4.1Rest of the world -0.1 -0.1 -0.1 0.1All developing countries 16.4 12.1 15.8 46.7Asian NIEs 3.8 2.6 3.8 19.1USA 6.4 4.6 6.3 16.2EU 15 6.6 5.1 6.6 20.6EU 10 0.6 0.5 0.6 1.6Japan 7.3 5.9 7.4 23.8Rest of OECD 2.7 2.3 2.6 6.8All developed countries 27.5 21.1 27.3 88.1World total 43.9 33.2 43.1 134.8Developing country share 37.4 36.6 36.7 34.6
a. Scenario 3.b. Scenario 6.c. Scenario 4.d. Scenario 9.
among developed and developingcountries.44 However, the effect is in the oppo-site direction from that of unemployment.Depending upon the scenario, the gains todeveloping countries as a group are about 2 to6 percent less if agricultural and unskilled laborforces are modeled as distinct compared withmodeling them as a single unskilled laborgroup. This suggests that models that combinethese two distinct groups into one will tend tooverstate the gains to developing countries,although the overstatement will be small.
These results seem reasonable. Because ofthe presence of initial unemployment, when
global trade liberalization increases demandfor agricultural or manufacturing products orboth, it will increase demand for labor,absorbing agricultural or unskilled labor intothe production process that was previouslyunemployed or underemployed. The presenceof additional productive factors will increaseproduction and income, and thus global andcountry welfare.
The sensitivity analysis indicates that properlymodeling unemployment in the unskilled labormarket is a crucial requirement to accuratelymeasure the welfare impact of trade liberaliza-tion, especially in the short and medium term.
100 Winners and Losers: Impact of the Doha Round on Developing Countries

1. As used in this report, the term “the poorest coun-tries” is interchangeable with least developed coun-tries (LDCs) as defined by the United Nations,based on income per capita (below $750) and otherindicators of economic weakness and vulnerability.
2. The model was constructed by Zhi Wang, theauthor of a highly regarded model that addressedthe impact on the global trading system of China’saccession to the WTO. See appendix A for moredetails of the model and other work by Wang. Theproject was made possible through the generoussupport of the Rockefeller Foundation and itsGlobal Inclusion Program.
3. The Global Trade Analysis Project is an internationalconsortium of researchers from academic, govern-mental, and intergovernmental institutions, whocontribute trade and other economic data. Theproject is coordinated by the Center for GlobalTrade Analysis, which is housed in the Departmentof Agricultural Economics of Purdue University. Thewebsite is www.gtap.agecon.purdue.edu.
4. Thomas W. Hertel and Jeffrey J. Reimer, Predictingthe Poverty Impacts of Trade Reform, World BankPolicy Research Working Paper 3444 (Washington:World Bank, 2004).
5. A few other recent models also attempt to improvethe accuracy of the modeling of labor markets indeveloping countries. These include Centred’Etudes Prospectives et d’InformationsInternationales, or CEPII (November 2004),International Food Policy Research Institute, or IFPRI(April 2005), and United Nations Conference onTrade and Development, or UNCTAD (Coping withTrade Reforms, Geneva: UNCTAD, 2006); availableat http://192.91.247.38/tab/events/namastudy/coping.asp?pf=1. These models are discussed inchapter 4.
6. This is similar to the market equilibrium specificationin J. R. Harris and M. P. Todaro, “Migration,
Unemployment and Development: A Two SectorAnalysis,” American Economic Review 60 (1970):126–142. However, in the Carnegie model, theunskilled labor market equilibrium is formulated as amixed complementarity problem (MCP). In such aformulation, the wage rate will be fixed at the base-line when there is unemployment in the economy.The employment rate will adjust to clear the labormarket. If labor demand is such that full employ-ment is reached, the unemployment rate will thenbe zero and the wage rate will adjust to clear thelabor market.
7. In the model, this is represented as the substi-tutability of one type of labor for the other, with anelasticity of 1.
8. “Economically active population” is a broadmeasure that includes both wage earners and self-employed persons, including farmers. As used inthis report, the term “labor force” refers to thisbroad group.
9. We use trade-weighted averages (including prefer-ential rates) of ad valorem tariffs (including tariff ratequotas) plus the ad valorem equivalents (AVEs) ofspecific tariffs. The data are drawn from the GTAP 6Data Base.
10. Domestic subsidies are modeled as a negative taxon industry gross output. Subsidy cuts are modeledas a reduction in the negative tax. Reductions aretaken from the domestic support data for 2001 fromthe OECD producer support estimate (PSE) / con-sumer support estimate (CSE), incorporated in theGTAP 6 Data Base.
11. These agreements were made in the WTO’s DohaWork Programme Decision Adopted by the GeneralCouncil on August 1, 2004. This is often referred toas the July Framework Agreement. It is available at:www.wto.org/english/tratop_e/dda_e/draft_text_gc_dg_31july04_e.htm.
12. Doha Work Programme Ministerial Declaration
Carnegie Endowment for International Peace 101
Notes

Adopted on December 18, 2005, available at:www.wto.org/english/thewto_e/minist_e/min05_e/final_text_e.htm.
13. NAMA includes both manufactured goods andother nonagricultural goods, such as minerals,petroleum, and forest products.
14. AGE models also can be used to conduct what areknown as dynamic analyses that trace the adjust-ment process of economies between the initial andfinal equilibria. Such exercises project the end pointof the adjustment process to some future date, andincorporate estimated growth from other sources inthe interim. While dynamic modeling allows forinteresting experiments, it also requires taking onadditional theoretical assumptions that may or maynot correspond to reality.
15. The most accurate term for this measure is “equiva-lent variation,” defined as the amount of moneythat, paid to a person, group or economy, wouldmake them as well off as the effects of a specifiedpolicy change. These gains are also referred to as“welfare” gains.
16. Data for 2004, World Trade Organization StatisticsDatabase, available at: http://stat.wto.org.
17. The G-33 countries include Antigua and Barbuda,Barbados, Belize, Benin, Botswana, China, Congo,Côte d’Ivoire, Cuba, Dominican Republic, Grenada,Guyana, Haiti, Honduras, India, Indonesia, Jamaica,Kenya, Korea, Mauritius, Madagascar, Mongolia,Mozambique, Nicaragua, Nigeria, Pakistan, Panama,Peru, Philippines, St. Kitts and Nevis, St. Lucia, St.Vincent and the Grenadines, Senegal, Sri Lanka,Suriname, Tanzania, Trinidad and Tobago, Turkey,Uganda, Venezuela, Zambia, and Zimbabwe.
18. Refer to table 2.4 for full descriptions of the sce-narios.
19. This result is consistent with results from most otherrecent models. For example, the World Bankmodel, which shows greater overall gains from agri-cultural liberalization than the Carnegie model,shows developing countries as a group losing underthe most realistic agricultural scenario modeled.These results are discussed further in chapter 4.
20. This is scenario 3, which reflects net impact of liber-alization of both manufactured goods and agricul-tural products.
21. Many other models predict a similar unwelcomepattern of results for developing countries underagricultural liberalization scenarios, discussedfurther in chapter 4.
22. Antoine Bouët, Lionel Fontagné, and SébastienJean, Is Erosion of Tariff Preferences a SeriousConcern? CEPII Working Paper 2005-14 (Paris:Centre d’Etudes Prospectives et d’InformationsInternationales, 2005).
23. WTO’s Doha Work Programme Decision Adopted
by the General Council on August 1, 2004, availableat: www.wto.org/english/tratop_e/dda_e/draft_text_gc_dg_31july04_e; Doha WorkProgramme Ministerial Declaration Adopted onDecember 18, 2005, available at: www.wto.org/english/thewto_e/minist_e/min05_e/final_text_e.htm.
24. Kym Anderson, Will Martin, and Dominique van derMensbrugghe, “Market and Welfare Implications ofDoha Reform Scenarios,” in Agricultural TradeReform & the Doha Development Agenda, ed. KymAnderson and Will Martin (New York andWashington: Palgrave Macmillan and World Bank,2006), table 12.16.
25. Higher increases for Vietnam are attributable to thecountry’s accession to the WTO, rather than Dohascenarios.
26. Santiago Fernandez de Cordoba and Sam Laird,Coping with Trade Reforms (Geneva: UNCTAD,2006); available at http://192.91.247.38/tab/events/namastudy/coping.asp?pf=1.
27. The figure of 2.5 million is the estimate offered fromthe most current World Bank model under the mostrealistic Doha scenario modeled. Kym Anderson,Will Martin, and Dominique van der Mensbrugghe,“Global Impacts of the Doha Scenarios on Poverty,”in Poverty and the WTO: Impacts of the DohaDevelopment Agenda, ed. Thomas W. Hertel and L.Alan Winters (Washington: World Bank, 2006).Available at: http://siteresources.worldbank.org/INTRANETTRADE/Resources/Topics/285683-1109974429289/Chapter17_Trade&Povertybook_Hertel&Winters.pdf. The higherfigure is found in William R. Cline, Trade Policy andGlobal Poverty (Washington, D.C.: Center for GlobalDevelopment and Institute for InternationalEconomics, 2004), chapter 5 and table 5.3.
28. The CEPII, IFPRI, and UNCTAD models includeother sectors but at highly aggregated levels thatmake them less useful for probing impacts in thosesectors.
29. A useful overview and nontechnical analysis of trademodeling is provided in Roberta Piermartini andRobert Teh, Demystifying Modeling Methods forTrade Policy, Discussion Paper 10 (Geneva: WorldTrade Organization, 2005).
30. The Carnegie model and other models reviewedhere assume that markets are perfectly competitive.In some other models, other market structures areused, including monopolistic competition andincreasing returns to scale. These may be more real-istic in some cases, but they require additionalassumptions and data that may or may not improvethe overall accuracy of the models’ results.
31. The Global Trade Analysis Project is an internationalconsortium of researchers from academic, govern-mental, and intergovernmental institutions who con-tribute trade and other economic data. The project
102 Winners and Losers: Impact of the Doha Round on Developing Countries

is coordinated by the Center for Global TradeAnalysis, which is housed in the Department ofAgricultural Economics of Purdue University. Thewebsite is www.gtap.agecon.purdue.edu.
32. Piermartini and Teh, Demystifying ModelingMethods for Trade Policy, pp. 34–35.
33. The G-20 is a group of developing countries organ-ized around offensive agricultural interests. Thegroup currently has 21 members: Argentina, Bolivia,Brazil, Chile, China, Cuba, Egypt, Guatemala, India,Indonesia, Mexico, Nigeria, Pakistan, Paraguay,Philippines, South Africa, Tanzania, Thailand,Uruguay, Venezuela, and Zimbabwe.
34. In the terminology used in interim agreements ofthe Doha Round at the WTO, “sensitive products”are agricultural products of all member countrieswhich will be subject to lesser liberalization than thenormal reductions that are agreed on. “Specialproducts” are additional agricultural products ofdeveloping countries that will be subject to lesserliberalization than other agricultural products ofdeveloping countries based on consideration oflivelihood security, food security, and rural develop-ment needs.
35. Kym Anderson, Will Martin, and Dominique van derMensbrugghe, “Market and Welfare Implications ofDoha Reform Scenarios,” in Agricultural TradeReform, table 12.16.
36. See table 4.2. For comparative static results, theseare one-time gains. For dynamic results reported bysome other models, the gains are annual, but theyassume that additional investment or productivitygains will be induced by liberalization, so the gainsare not attributable to trade policy changes alone.
37. As noted above, Vietnam’s large apparent gains aremainly attributable to its pending accession to the
WTO rather than to changes in trade policy thatmay be agreed on in the Doha Round.
38. A thorough discussion of the complementary meas-ures that are needed to allow small-scale farmers tosucceed under trade reform can be found in Foodand Agricultural Organization of the United Nations(FAO), The State of Food and Agriculture 2005:Agricultural Trade and Poverty—Can Trade Work forthe Poor? (Rome, FAO, 2005), part I.
39. Zhi Wang, “Impact of China’s WTO Accession onthe Patterns of World Trade,” Journal of PolicyModeling 24, no. 1 (2003): 1–41; Zhi Wang “Impactof China’s WTO Entry on Labor Intensive ExportMarket: A Recursive Dynamic CGE Analysis,” TheWorld Economy 22, no. 3 (1999): 379–405.
40. J. R. Harris and M. P. Todaro, “Migration,Unemployment and Development: A Two SectorAnalysis,” American Economic Review 60 (1970):126–142.
41. Anthony Brook, David Kendrick, and AlexanderMeeraus, GAMS: A User’s Guide (New York:Scientific Press, 1998).
42. Hal Varian, Microeconomic Analysis, 2nd ed. (NewYork: W. W. Norton, 1984), p. 28.
43. Jeffrey D. Lewis, Sherman Robinson, and Zhi Wang,“Beyond the Uruguay Round: The Implication of anAsia Free Trade Area,” China Economic Review, AnInternational Journal 6, no. 1 (Spring 1995): 35–90.
44. This may be due to the relatively simple specifica-tion in the model of the underlying forces that drivemigration between agricultural and unskilled urbanlabor markets. The segmentation of rural and urbanlabor markets in many developing countries andtheir interaction is an issue that should beaddressed more fully in future models.
Carnegie Endowment for International Peace 103

The Carnegie Endowment forInternational Peace is a private,nonprofit organization dedicatedto advancing cooperationbetween nations and promoting
active international engagement by the UnitedStates. Founded in 1910, Carnegie is nonpar-tisan and dedicated to achieving practicalresults. Through research, publishing, conveningand, on occasion, creating new institutions andinternational networks, Endowment associatesshape fresh policy approaches. Their interestsspan geographic regions and the relations
between governments, business, internationalorganizations, and civil society, focusing on theeconomic, political, and technological forcesdriving global change. Through its CarnegieMoscow Center, the Endowment helps todevelop a tradition of public policy analysis inthe states of the former Soviet Union and toimprove relations between Russia and theUnited States. The Endowment publishesFOREIGN POLICY, one of the world’s leading jour-nals of international politics and economics,which reaches readers in more than 120 coun-tries and in several languages.
Carnegie Endowment for International Peace