winning together: 15 by 20.… · all figures are based on year-end 2017, including unallocated...
TRANSCRIPT

Winning together: 15 by 20 Investor update Q1 2018
May 1, 2018

Investor update Q1 2018
Financial: Powerful performance – Maarten de Vries
Operations: Precise processes – David Allen
Commercial: Passion for paint – Ruud Joosten
Strategy: Winning Together – Thierry Vanlancker
Agenda
Winning Together | March 2018 2

AkzoNobel Bullets
Only use the List Level
buttons to apply the
AkzoNobel Branded Bullets
3 Winning Together | March 2018
Strategy: Winning Together Thierry Vanlancker

Crop picture
Select picture > click on tab
“Picture Tools > Format”
Click on the icon
above “Crop”
You will see crop
and scale markers
on the corners
Use the “circular scale icon”
to scale your picture within
the cropped region.
A focused Paints and Coatings company
€9.6bn revenue
€1.2bn EBITDA
€0.9bn EBIT
9.4% ROS
13.9% ROI
35,700 people
North America
12% Mature Europe
33% Asia Pacific
32%
Other countries
5%
Emerging Europe
9%
Latin America
9%
Key regions by revenue
All figures are based on year-end 2017, including unallocated corporate center costs and invested capital 4 Winning Together | March 2018

Title area
max over 2 lines
Insert Topic Icons
Click on the picture icon
and browse to the location
of the Topic Icons
AkzoNobel Bullets
Only use the List Level
buttons to apply the
AkzoNobel Branded Bullets
Global paints and coatings by market sector ~€110 billion, 2017
30%
8% 7%
7%
6%
4%
3%
3% 2%
Automotive OEM (metal); 7%
General Industrial and Other; 14%
Decorative paints
Powder coatings
Protective coatings
Wood finishes
Vehicle refinish
Specialty / plastics
Marine coatings
Coil coatings
Packaging coatings
Automotive OEM (metal)
General Industrial / Other
5 Winning Together | March 2018
Top 3 player with leading positions in large and attractive markets
Source: KNG, Internal estimates
Top 3 players ~30% total market
Top 20 players ~60% total market
Global paints and coatings market
~€110 bn
AkzoNobel active markets
~€70 bn
AkzoNobel
market share
~€10 bn
North America; 10%

Title area
max over 2 lines
Insert Topic Icons
Click on the picture icon
and browse to the location
of the Topic Icons
AkzoNobel Bullets
Only use the List Level
buttons to apply the
AkzoNobel Branded Bullets
Performance versus peers improved; potential for further improvement remains
Winning Together | March 2018 6
AkzoNobel Paints and Coatings
0%
5%
10%
15%
2012 2013 2014 2015 2016 2017Source: Company data, internal estimates
Title area
max over 2 lines
Insert Topic Icons
Click on the picture icon
and browse to the location
of the Topic Icons
AkzoNobel Bullets
Only use the List Level
buttons to apply the
AkzoNobel Branded Bullets
13.9
25.0
2014 2017 2020 guidance²
Unallocated corporatecost and invested capital
9.4
13.5
1.5
2014 2017 2020 guidance²
Unallocatedcorporate cost
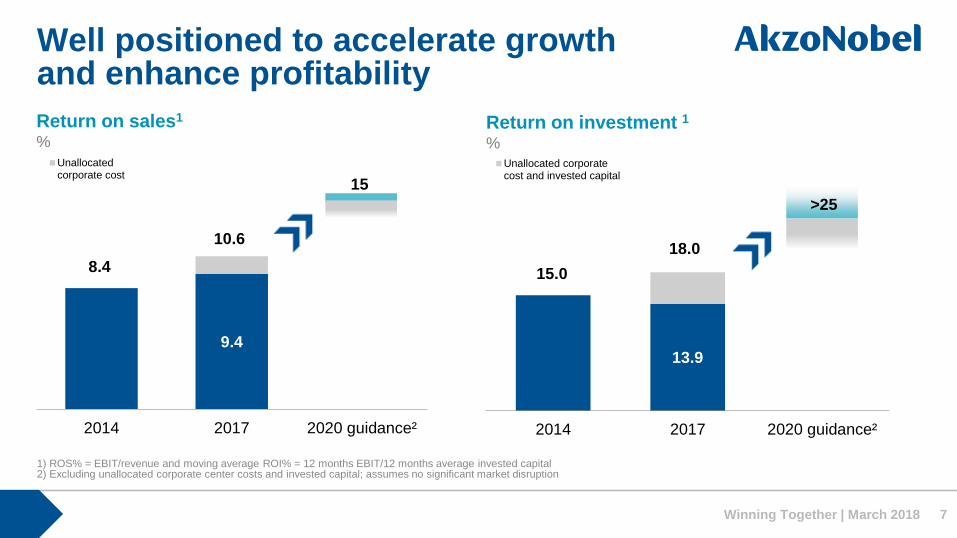
Well positioned to accelerate growth and enhance profitability
15
Return on investment 1 %
Return on sales1 %
>25
Winning Together | March 2018 7
10.6
8.4 18.0
15.0
1) ROS% = EBIT/revenue and moving average ROI% = 12 months EBIT/12 months average invested capital 2) Excluding unallocated corporate center costs and invested capital; assumes no significant market disruption
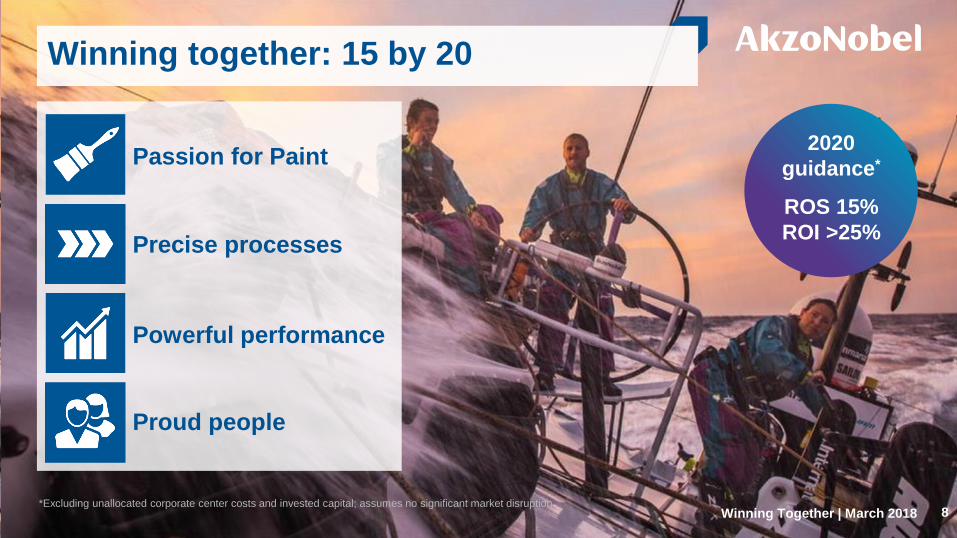
Winning together: 15 by 20
Passion for Paint
Precise processes
Powerful performance
Proud people
2020
guidance*
ROS 15%
ROI >25%
*Excluding unallocated corporate center costs and invested capital; assumes no significant market disruption Winning Together | March 2018 8
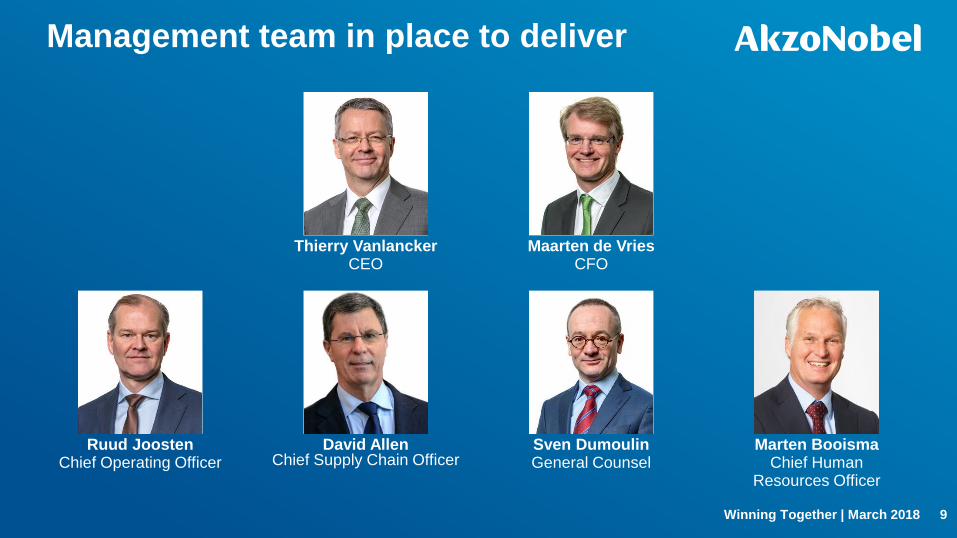
Thierry Vanlancker CEO
Maarten de Vries CFO
Ruud Joosten Chief Operating Officer
David Allen Chief Supply Chain Officer
Sven Dumoulin General Counsel
Marten Booisma Chief Human
Resources Officer
Winning Together | March 2018 9
Management team in place to deliver

Title area
max over 2 lines
Insert Topic Icons
Click on the picture icon
and browse to the location
of the Topic Icons
AkzoNobel Bullets
Only use the List Level
buttons to apply the
AkzoNobel Branded Bullets
10 Winning Together | March 2018
New fit for purpose structure to increase customer focus and drive efficiency
Integrated supply chain
Integrated business planning
Bu
sin
es
s
Customers
Cu
sto
me
r B
usin
es
s
SC
Cu
sto
me
r B
usin
es
s
SC
Cu
sto
me
r B
usin
es
s
SC
Cu
sto
me
r B
usin
es
s
SC
From… To…
Bu
sin
es
s
Bu
sin
es
s
Bu
sin
es
s
Bu
sin
es
s
Bu
sin
es
s
Bu
sin
es
s
Bu
sin
es
s

Title area
max over 2 lines
Insert Topic Icons
Click on the picture icon
and browse to the location
of the Topic Icons
AkzoNobel Bullets
Only use the List Level
buttons to apply the
AkzoNobel Branded Bullets
Winning Together | March 2018 11
Clear path to deliver on 2020 guidance
Fixed cost inflation
10.6%
Continuous Improvement
Integrated Supply Chain
Transformation
SG&A and RD&I Transformation
Growth and net price/ mix
15%
*Excluding unallocated corporate center costs and invested capital; assumes no significant market disruption
2020
guidance*
ROS 15%
ROI >25%
Unallocated corporate cost
2017 2020

AkzoNobel Bullets
Only use the List Level
buttons to apply the
AkzoNobel Branded Bullets
12 Winning Together | March 2018
Commercial: Passion for paint Ruud Joosten

Title area
max over 2 lines
Insert Topic Icons
Click on the picture icon
and browse to the location
of the Topic Icons
AkzoNobel Bullets
Only use the List Level
buttons to apply the
AkzoNobel Branded Bullets
40
50
60
70
80
90
100
110
120
2015 2016 2017
13 Winning Together | March 2018
ROS development*:
Cost control protected margins in short-term
Pricing acceleration
Standardized pricing methodology
Differentiated approach to pricing actions
Centralized and detailed action tracking
‘Surgical’ analysis and full transparency
Price increases implemented and building future capability for pricing acceleration
9.8% 9.4%
2016 2017
World oil price, Brent crude spot, $ per barrel vs. global average TiO2 prices Index (2017 average = 100)
Current and critical challenge
TIO2 price quarterly average
Oil price quarterly average
Raw
material
headwind
~€300m
* Including unallocated corporate costs

Title area
max over 2 lines
Insert Topic Icons
Click on the picture icon
and browse to the location
of the Topic Icons
30 Decorative Paints
Powder Coatings
Marine and
Protective Coatings
Automotive and
Specialty Coatings
Strong portfolio of businesses with leading positions in all segments Segment Strengths and opportunities
Industrial Coatings
Winning Together | March 2018 14
• #1/#2 market positions where we play
• Strong brands and product portfolio
• Leverage global to win local! 1
1/2
1
1
2/3
Position
by revenue
• Extensive product offering
• Strong position with top tier customers
• Urbanization and construction growth
• Interpon #1 global brand
• Sustainable coatings conversions
• Strong product/ technology capabilities
• Marine: consolidated market
• Protective: few global players
• Global technology leadership
• Growth of emerging market consumers
• Leader in digital color
Market growth
2-3%², 2017-20
Source: KNG, internal estimate 1) Excluding ~ €40 billion in regions/segments where we are not present 2) Total market growth (revenue weighted)
Market size
~€bn, 2017¹
12
8
12
11
50% revenue from
emerging markets

Title area
max over 2 lines
Insert Topic Icons
Click on the picture icon
and browse to the location
of the Topic Icons 15
Decorative Europe: Winning model to capture benefits in recovering market
75
80
85
90
95
100
105
2008 2009 2010 2011 2012 2013 2014 2015 2016 2017 2018 2019 2020
Decorative Paints Europe Market Size Index*
15 Winning Together | March 2018
Largest player in fragmented market Market expected to continue recovery
Grow market share and improve profitability:
Build winning brands and leading positions
Reduce complexity
Leverage scale
Optimize portfolio and route to market
Opportunities for consolidation
Leverage global to win local!
*Source: KNG 2017, internal estimate
Smart packaging design
Global guidelines
Local brand assets
+2% CAGR
2016-20
50% #1 positions
30% #2 positions
AkzoNobel
Peer 1
Peer 2
Peer 3
Others
Winning Together | March 2018
Title area
max over 2 lines
Insert Topic Icons
Click on the picture icon
and browse to the location
of the Topic Icons Winning Together | March 2018 16
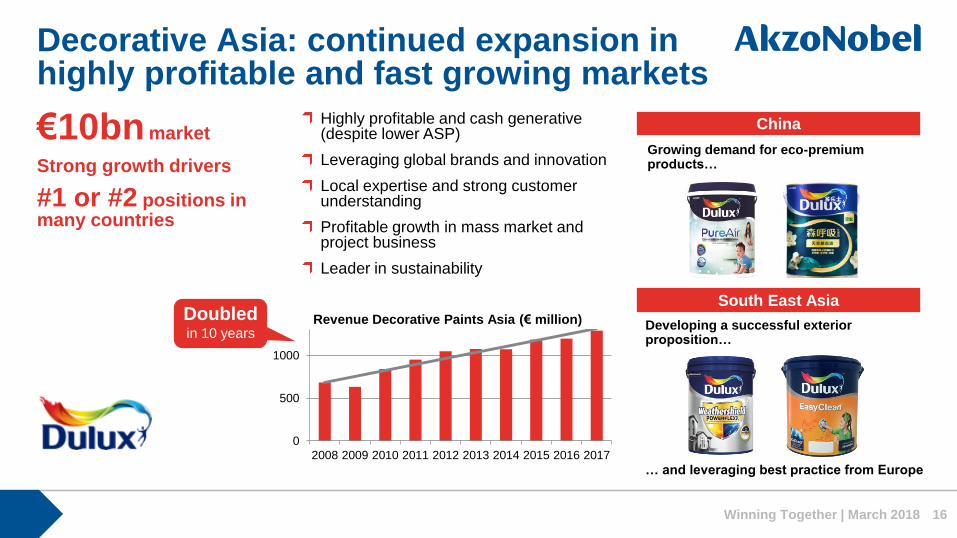
Decorative Asia: continued expansion in highly profitable and fast growing markets
€10bn market
Strong growth drivers
#1 or #2 positions in many countries
Highly profitable and cash generative (despite lower ASP)
Leveraging global brands and innovation
Local expertise and strong customer understanding
Profitable growth in mass market and project business
Leader in sustainability
China
South East Asia
Developing a successful exterior proposition…
… and leveraging best practice from Europe
Growing demand for eco-premium products…
0
500
1000
2008 2009 2010 2011 2012 2013 2014 2015 2016 2017
Revenue Decorative Paints Asia (€ million) Doubled
in 10 years
Title area
max over 2 lines
Insert Topic Icons
Click on the picture icon
and browse to the location
of the Topic Icons Winning Together | March 2018 17
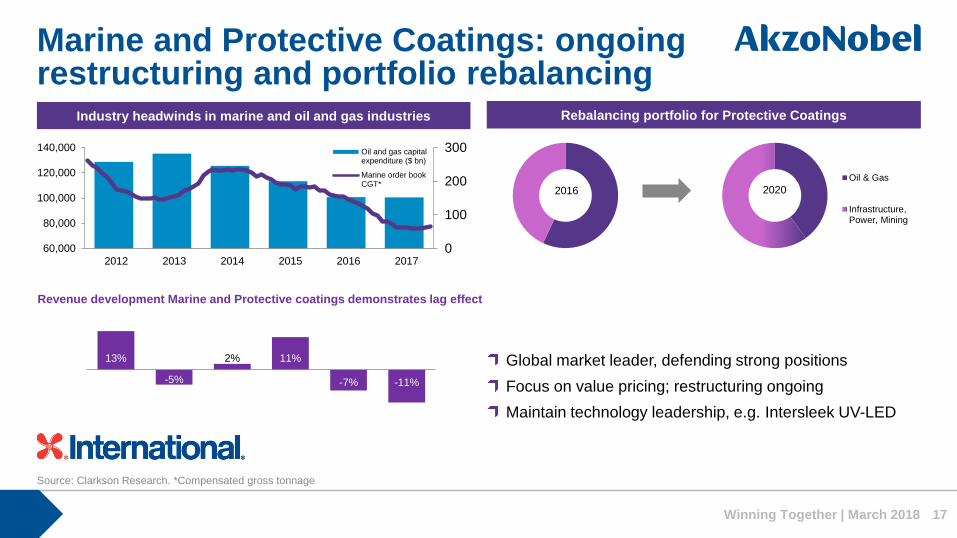
Marine and Protective Coatings: ongoing restructuring and portfolio rebalancing
Source: Clarkson Research. *Compensated gross tonnage
Industry headwinds in marine and oil and gas industries
0
100
200
300
60,000
80,000
100,000
120,000
140,000
2012 2013 2014 2015 2016 2017
Oil and gas capitalexpenditure ($ bn)
Marine order bookCGT*
13%
-5%
2% 11%
-7% -11%
Revenue development Marine and Protective coatings demonstrates lag effect
Rebalancing portfolio for Protective Coatings
2016 2020
Global market leader, defending strong positions
Focus on value pricing; restructuring ongoing
Maintain technology leadership, e.g. Intersleek UV-LED
Oil & Gas
Infrastructure,Power, Mining

Title area
max over 2 lines
Insert Topic Icons
Click on the picture icon
and browse to the location
of the Topic Icons Winning Together | March 2018 18
Powder Coatings: Clear global #1 in fastest growing and highly profitable market
~€8bn market
Growth 2x industrial GDP
#1 with 2x relative market share
Multiple sources of growth (examples):
New
applications
Increased
capacity
Geographic
expansion
Product
innovation
Bolt-on
acquisitions
Architectural and
automotive coatings
Chengdu – Biggest powder
coatings plant in the world
Northern and Western
India and Western China
OneWheel, Interpon Cr
V.Powdertech, Thailand
Sustainability advantages of powder coatings over liquid coatings:
Zero Volatile Organic Compounds (VOCs)
Less waste during application (>95% usage efficiency)
AkzoNobel
Peer 1
Peer 2
Peer 3 Others

AkzoNobel Bullets
Only use the List Level
buttons to apply the
AkzoNobel Branded Bullets
19 Winning Together | March 2018
Operations: Precise processes David Allen

Title area
max over 2 lines
Insert Topic Icons
Click on the picture icon
and browse to the location
of the Topic Icons
AkzoNobel Bullets
Only use the List Level
buttons to apply the
AkzoNobel Branded Bullets
20 Winning Together | March 2018
AkzoNobel Leading Performance System:
Customer excellence
Operational excellence
Leading edge technology
2020 targets:
One organization with a common way of working and aligned set of targets
Note: Total reportable rate (TRR) 1.0 is equivalent to 0.2, in line with OSHA guidelines
15,000 people
123 sites
448 warehouses
€250m CAPEX/ yr
People
Top quartile
engagement
Safety
TRR <1.0
(Top quartile)
Service
98.5% Perfect
Order Index (OTIF)
Cost
4% annual
cost productivity
Capital
Inventories
25% lower
ALPS

Title area
max over 2 lines
Insert Topic Icons
Click on the picture icon
and browse to the location
of the Topic Icons
AkzoNobel Bullets
Only use the List Level
buttons to apply the
AkzoNobel Branded Bullets
Winning Together | March 2018 21
Journey to build a world-class integrated supply chain
2014 - 2017
Today
2020 3
1
2
• Global functional strategy
• Common safety platform
• ALPS Plan, Source, Make, Deliver
End to end ALPS customer and supplier focused
processes to support delivery of 15%
ROS by 2020
Functional ALPS continuous improvement
processes and standardized ways of
working
Integrated ALPS Integrated Business Planning
process for all business units to
improve financial performance
+€200m
annual
cost
savings
by 2020
• Total quality and service excellence
• Supplier collaboration
• ALPS Digitization
• Organization transformation
• ALPS Integrated Business Planning
• Purchase to pay (procurement)
€120m
cost
savings
annually

Title area
max over 2 lines
Insert Topic Icons
Click on the picture icon
and browse to the location
of the Topic Icons
AkzoNobel Bullets
Only use the List Level
buttons to apply the
AkzoNobel Branded Bullets
Plan 35%
planning entities
Source 60%
organization
Make 75%
sites
Deliver 20%
warehouses
22 Winning Together | March 2018
48 ALPS processes designed and deployed
3800 employees trained and certified
~700 ALPS improvement projects per year
67 site and warehouse closures 2014-17
ALPS continuous improvement
1
Safety
TRR 1.0
(Top quartile)
Service
>95.5% OTIF
(Top quartile)
€120m annual cost savings run rate
2014-17
Implementation status (%)

Title area
max over 2 lines
Insert Topic Icons
Click on the picture icon
and browse to the location
of the Topic Icons
AkzoNobel Bullets
Only use the List Level
buttons to apply the
AkzoNobel Branded Bullets
95.5%
98.5%
Service (OTIF)
23 Winning Together | March 2018
ALPS Integrated Business Planning
2
Organization transformation:
One operating model
Integrated Business Planning:
One end-to-end business process
Top Quartile
Performance
+75% Forecast
accuracy
25% Inventory
reduction

Title area
max over 2 lines
Insert Topic Icons
Click on the picture icon
and browse to the location
of the Topic Icons
AkzoNobel Bullets
Only use the List Level
buttons to apply the
AkzoNobel Branded Bullets
24 Winning Together | March 2018
End to end processes
3
Total quality and service excellence
Resource productivity
Asset network optimization
ALPS Digitization
Supplier collaboration
On
e o
pe
rati
ng
mo
de
l
an
d In
teg
rate
d B
us
ine
ss
Pla
nn
ing
Further
€200m annual cost savings
by 2020 in addition to ALPS continuous improvement
Cost of sales
~€5.4bn in 2017

AkzoNobel Bullets
Only use the List Level
buttons to apply the
AkzoNobel Branded Bullets
Financial: Powerful performance Maarten de Vries
Winning Together | March 2018 25

Crop picture
Select picture > click on tab
“Picture Tools > Format”
Click on the icon
above “Crop”
You will see crop
and scale markers
on the corners
Use the “circular scale icon”
to scale your picture within
the cropped region.
Passion for Paint
Precise processes
Decentralized businesses…
Differing levels of maturity…
Fragmented process and system
landscape…
Centrally driven sales excellence and
margin management…
Consistent across all businesses…
Simplified ERP and system platform...
Integrated end-to-end processes…
From… To…
Proud people Diverse cultures…
Fragmented incentive schemes…
One single global team…
Aligned incentives…
High-performance culture
Powerful performance
Independent businesses with
dedicated supply chain…
Many KPIs...
Lean fit-for-purpose organization…
Laser sharp focus on 15% ROS!
Winning together strategy leverages greater focus to accelerate improvements
Winning Together | March 2018 26
Title area
max over 2 lines
Insert Topic Icons
Click on the picture icon
and browse to the location
of the Topic Icons
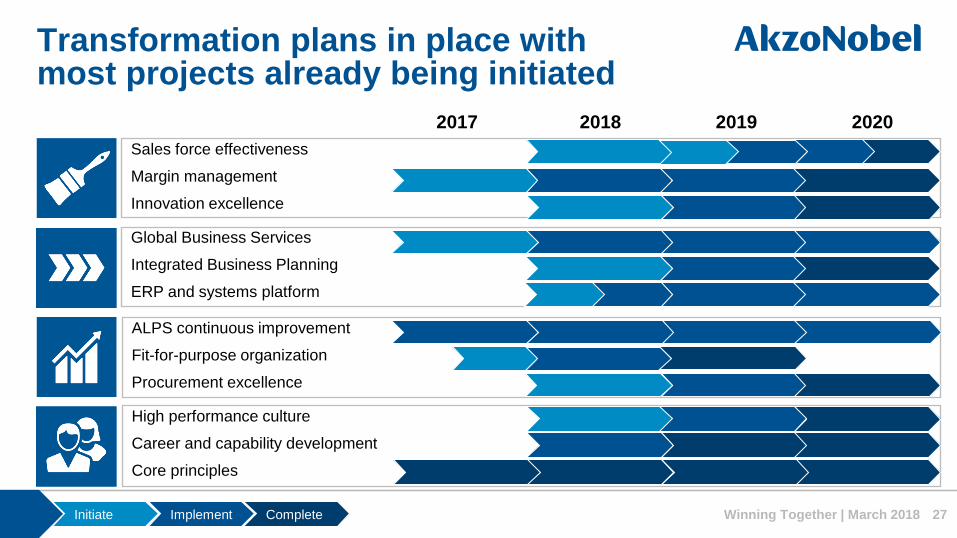
Transformation plans in place with most projects already being initiated
Winning Together | March 2018 27
2017 2018 2019 2020
Sales force effectiveness
Margin management
Innovation excellence
Global Business Services
Integrated Business Planning
ERP and systems platform
ALPS continuous improvement
Fit-for-purpose organization
Procurement excellence
High performance culture
Career and capability development
Core principles
Initiate Implement Complete

Title area
max over 2 lines
Insert Topic Icons
Click on the picture icon
and browse to the location
of the Topic Icons
AkzoNobel Bullets
Only use the List Level
buttons to apply the
AkzoNobel Branded Bullets
Winning Together | March 2018 28
Clear path to deliver on 2020 guidance
Fixed cost inflation
~€100m/ yr
10.6%
Continuous Improvement
Integrated Supply Chain
Transformation €200m by 2020
SG&A and RD&I Transformation
Growth and net price/ mix
~2%/ yr
15% 2020
guidance*
ROS 15%
ROI >25%
Key initiatives:
Fit-for-purpose organization
(€110m in 2018)
Sales force effectiveness
Innovation excellence
Global Business Services
ERP and systems platform
Unallocated corporate cost
*Excluding unallocated corporate center costs and invested capital; assumes no significant market disruption
2017 2020

Title area
max over 2 lines
Insert Topic Icons
Click on the picture icon
and browse to the location
of the Topic Icons
AkzoNobel Bullets
Only use the List Level
buttons to apply the
AkzoNobel Branded Bullets
Working capital
29 Winning Together | March 2018
Significant returns to shareholders:
50% higher dividend for 2017
€1bn special cash dividend (paid)
Vast majority of net proceeds returned*
Continued focus on cash flow and increased shareholder returns
* Specialty Chemicals separation
Cash conversion (EBITDA - capital expenditure)/EBITDA
1210 1181
278 250
77% 79%
-100%
0%
100%
0
200
400
600
800
1000
1200
1400
2016 2017
EBITDA
Capital Expenditure
Cash conversion
831 828 834 927
8.9% 8.7% 9.1% 10.2%
0%0
1000
2014 2015 2016 2017
OWC
OWC % of revenue

Title area
max over 2 lines
Insert Topic Icons
Click on the picture icon
and browse to the location
of the Topic Icons
AkzoNobel Bullets
Only use the List Level
buttons to apply the
AkzoNobel Branded Bullets
Feb 2016: BASF Industrial Coatings
July 2017: Disatech
July 2017: Flexcrete
November 2017: V.Powdertech
Acquisition criteria:
Strategically aligned and value generating
Adding segment, geography and/or technology to the portfolio
Disciplined approach
Strong bolt-on acquisitions completed during 2016 and 2017
Note: Timeline shows date of acquisition announcement
30 Winning Together | March 2018
V.Powdertech
Strengthens our leading
global market position in
powder coatings
BASF Industrial
Coatings
Expands our (technology)
portfolio and strengthens
our market positions,
particularly in coil,
protective and wood
coatings sectors
Disatech
Brings new technologies
and services that
complement existing
portfolio of coatings and
films for the aerospace
and transport sectors
Flexcrete
Expands our offering in
key industrial markets of
downstream oil and gas,
chemical processing,
commercial infrastructure,
power and water

Title area
max over 2 lines
Insert Topic Icons
Click on the picture icon
and browse to the location
of the Topic Icons
AkzoNobel Bullets
Only use the List Level
buttons to apply the
AkzoNobel Branded Bullets
Vast majority of net proceeds returned to shareholders
Retain strong investment grade credit rating
Limit risk and reduce uncertainty
Stable to rising dividend (€1.65 per share for 2018)
Strategically aligned and value generating acquisitions
Enhanced profitability while investing in growth
Capital allocation priorities for long-term value creation
3. Acquisitions
2. Profitable organic growth
4. Dividend
5. Manage pension liabilities
6. Balance sheet
31 Winning Together | March 2018
1. Chemicals separation

Investor update Q1 2018
April 24, 2018

Title area
max over 2 lines
Insert Topic Icons
Click on the picture icon
and browse to the location
of the Topic Icons
AkzoNobel Bullets
Only use the List Level
buttons to apply the
AkzoNobel Branded Bullets
Successfully completed the dual-track process; announced sale of Specialty Chemicals
On track implementing “Winning together: 15 by 20”
Transformation process gaining momentum
Robust pricing initiatives ramping up: price increase successful in Q1 2018; second wave of increases to come
Opened new Powder Coatings plant in Mumbai, India
Progress on transformation into a focused Paints and Coatings company
Investor update | Q1 2018 33

Title area
max over 2 lines
Insert Topic Icons
Click on the picture icon
and browse to the location
of the Topic Icons
Transformation plans in place with most projects already being initiated
Investor update | Q1 2018 34
Sales force effectiveness
Margin management
Innovation excellence
Global Business Services
Integrated Business Planning
ERP and systems platform
ALPS continuous improvement
Fit-for-purpose organization
Procurement excellence
High performance culture
Career and capability development
Core principles
Selling prices up 3% in Q1 Second wave of increases to come in 2018
3 businesses equipped for Integrated Business Planning
€30m continuous improvement savings Savings from fit-for-purpose organization €10m of €110m
Transformation gaining momentum
combined with further cost discipline

Announced sale of Specialty Chemicals to The Carlyle Group and GIC for €10.1bn
Key milestone in creating a focused, high performing Paints and Coatings company
Thorough dual-track process, resulting in best outcome for all stakeholders, and ahead of schedule
Vast majority of net proceeds to be returned to shareholders
Transaction expected to be completed before the end of 2018
Investor update | Q1 2018 35

Crop picture
Select picture > click on tab
“Picture Tools > Format”
Click on the icon
above “Crop”
You will see crop
and scale markers
on the corners
Use the “circular scale icon”
to scale your picture within
the cropped region.
Revenue growth for most businesses; Dealing with temporary headwinds…
Investor update | Q1 2018 36
Asia
Powder Coatings
Oil and gas
industries
Automotive and
Specialty Coatings
EMEA
Marine industry
Latin America
~
Raw Materials
Foreign exchange

Title area
max over 2 lines
Insert Topic Icons
Click on the picture icon
and browse to the location
of the Topic Icons
AkzoNobel Bullets
Only use the List Level
buttons to apply the
AkzoNobel Branded Bullets
Decorative Paints Performance Coatings*
Higher selling prices; volumes lower, mainly due to marine, and oil and gas
Quarterly volume development in % year-on-year
Quarterly price/mix development in % year-on-year
-3 -1
37
066
* Includes impact from acquisitions
Investor update | Q1 2018
Paints and Coatings*
(continuing operations)

Title area
max over 2 lines
Insert Topic Icons
Click on the picture icon
and browse to the location
of the Topic Icons
AkzoNobel Bullets
Only use the List Level
buttons to apply the
AkzoNobel Branded Bullets
Price increases and cost savings not yet fully compensating for higher raw materials
Investor update | Q1 2018 38
€ million Q1 2017¹ Q1 2018 Δ%
Revenue 2,377 2,176 (8)
Adjusted EBITDA 281 209 (26)
Adjusted operating income 208 149 (28)
Operating income 208 108 (48)
ROS%² 8.8 6.8
ROI%² 14.8 13.2
Increase
Decrease
Revenue development Q1 2018 (%)
1. Represented to present the Specialty Chemicals business as discontinued operations.
2. ROS% = Adjusted operating income/Revenue. ROI (in %) = 12 months adjusted operating income/12 months average invested capital
Selling prices up 3% overall and for all businesses
Revenue down, mainly due to adverse foreign currencies (1% lower excluding currencies)
Volumes lower, mainly due to marine, and oil and gas industries
Adjusted operating income impacted by foreign currencies, raw material costs and lower volumes not fully offset by increased selling prices and cost discipline
Operating income includes identified items, mainly related to the transformation
(continuing operations)

Title area
max over 2 lines
Insert Topic Icons
Click on the picture icon
and browse to the location
of the Topic Icons Investor update | Q1 2018 39
Price increases and cost savings not yet fully compensating for higher raw materials
Increase
Decrease
Includes:
Continuous improvement,
fit-for-purpose organization,
cost discipline,
and other items
(continuing operations)

Title area
max over 2 lines
Insert Topic Icons
Click on the picture icon
and browse to the location
of the Topic Icons
AkzoNobel Bullets
Only use the List Level
buttons to apply the
AkzoNobel Branded Bullets
Decorative Paints price increases gaining momentum and up 4% overall
Investor update | Q1 2018
€ million Q1 2017 Q1 2018 Δ%
Revenue 922 846 (8)
Adjusted EBITDA 109 79 (28)
Adjusted operating income 77 56 (27)
Operating income 77 48 (38)
ROS%* 8.4 6.6
ROI%* 13.8 11.7
Revenue development Q1 2018 (%)
Increase
Decrease
Our customers in Pakistan now
have access to Dulux Promise,
a decorative paints product for
the mass market segment,
following the latest launch in
the Asia region.
(continuing operations) 40
*ROS% = Adjusted operating income/revenue. ROI% = 12 months adjusted operating income/12 months average invested capital

Title area
max over 2 lines
Insert Topic Icons
Click on the picture icon
and browse to the location
of the Topic Icons
AkzoNobel Bullets
Only use the List Level
buttons to apply the
AkzoNobel Branded Bullets
Performance Coatings growth offset by marine, and oil and gas industries
Investor update | Q1 2018
Increase
Decrease
Revenue development Q1 2018 (%)
€ million Q1 2017 Q1 2018 Δ%
Revenue 1,471 1,342 (9)
Adjusted EBITDA 225 169 (25)
Adjusted operating income 187 134 (28)
Operating income 187 121 (35)
ROS%* 12.7 10.0
ROI%* 28.6 21.3
(continuing operations) 41
Our commitment to customers
in India has been strengthened
with the opening of a new plant
to produce Powder Coatings.
Located in Thane, Mumbai, the
plant is our sixth production
site in India.
*ROS% = Adjusted operating income/revenue. ROI% = 12 months adjusted operating income/12 months average invested capital
Title area
max over 2 lines
Insert Topic Icons
Click on the picture icon
and browse to the location
of the Topic Icons
AkzoNobel Bullets
Only use the List Level
buttons to apply the
AkzoNobel Branded Bullets
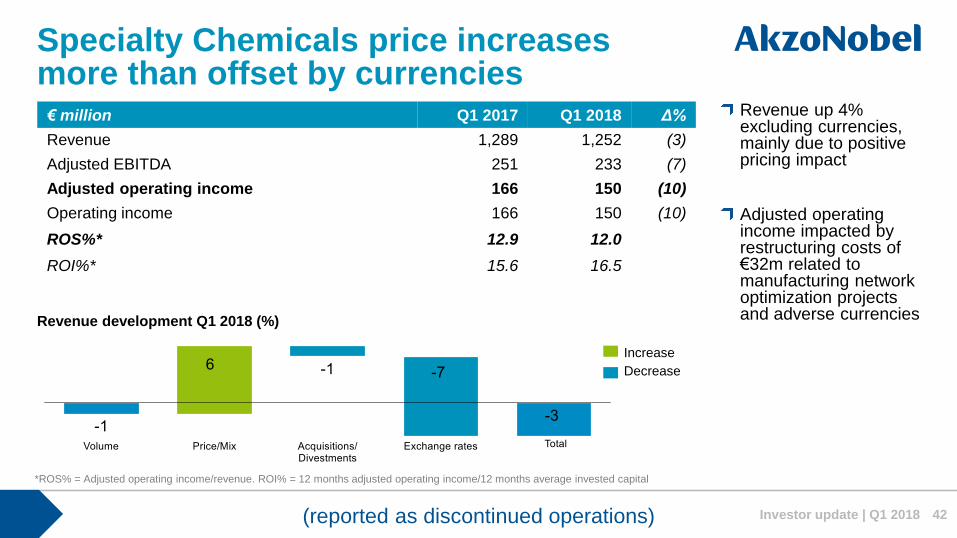
Specialty Chemicals price increases more than offset by currencies
Investor update | Q1 2018
Increase
Decrease
Revenue development Q1 2018 (%)
€ million Q1 2017 Q1 2018 Δ%
Revenue 1,289 1,252 (3)
Adjusted EBITDA 251 233 (7)
Adjusted operating income 166 150 (10)
Operating income 166 150 (10)
ROS%* 12.9 12.0
ROI%* 15.6 16.5
Revenue up 4% excluding currencies, mainly due to positive pricing impact
Adjusted operating income impacted by restructuring costs of €32m related to manufacturing network optimization projects and adverse currencies
(reported as discontinued operations) 42
*ROS% = Adjusted operating income/revenue. ROI% = 12 months adjusted operating income/12 months average invested capital

Title area
max over 2 lines
Insert Topic Icons
Click on the picture icon
and browse to the location
of the Topic Icons
AkzoNobel Bullets
Only use the List Level
buttons to apply the
AkzoNobel Branded Bullets
Free cash flow impacted by lower EBITDA, while CAPEX and pension top-ups reduced
43 Investor update | Q1 2018
€ million Q1 2017 Q1 2018
Adjusted EBITDA 534 417
Interest paid -4 -8
Tax paid -88 -70
Changes in working capital, provisions¹ and other -517 -540
Capital expenditures (including intangible assets) -128 -101
Free cash flow, excluding pension top-up payments -203 -302
Pension top-up payments -212 -174
Free cash flow (from operations)² -415 -476
1. Provisions include recurring pension contributions 2. Free cash flow (from operations) = Net cash from operating activities minus Capital expenditures and Investment in intangibles
(continuing and discontinued operations)
Net Debt (total operations) 1,801 2,964
Net Debt (discontinued operations) N/A 368

Title area
max over 2 lines
Insert Topic Icons
Click on the picture icon
and browse to the location
of the Topic Icons
AkzoNobel Bullets
Only use the List Level
buttons to apply the
AkzoNobel Branded Bullets
Net income up 5% to €253 million, including discontinued operations
44 Investor update | Q1 2018
€ million Q1 2017* Q1 2018
Operating income 208 108
Net financing income/(expenses) (17) 19
Results from associates and joint ventures 6 4
Profit before tax 197 131
Income tax (52) 1
Profit from continuing operations 145 132
Profit from discontinued operations 116 142
Profit for the period 261 274
Non-controlling interests (21) (21)
Net income from total operations 240 253
Earnings per share (in €) Q1 2017* Q1 2018
Total operations 0.96 1.00
Continuing operations 0.50 0.47
Adjusted earnings per share (in €) Q1 2017* Q1 2018
Total operations 0.96 0.93
Continuing operations 0.50 0.35
(continuing and discontinued operations)
* Represented to present the Specialty Chemicals business at discontinued operations

Title area
max over 2 lines
Insert Topic Icons
Click on the picture icon
and browse to the location
of the Topic Icons
AkzoNobel Bullets
Only use the List Level
buttons to apply the
AkzoNobel Branded Bullets
Successfully completed the dual-track process; announced sale of Specialty Chemicals
On track implementing “Winning together: 15 by 20”
Transformation process gaining momentum
Robust pricing initiatives ramping up: price increase successful in Q1 2018; second wave of increases to come
Opened new Powder Coatings plant in Mumbai, India
Progress on transformation into a focused Paints and Coatings company
Investor update | Q1 2018 45
Crop picture
Select picture > click on tab
“Picture Tools > Format”
Click on the icon
above “Crop”
You will see crop
and scale markers
on the corners
Use the “circular scale icon”
to scale your picture within
the cropped region.
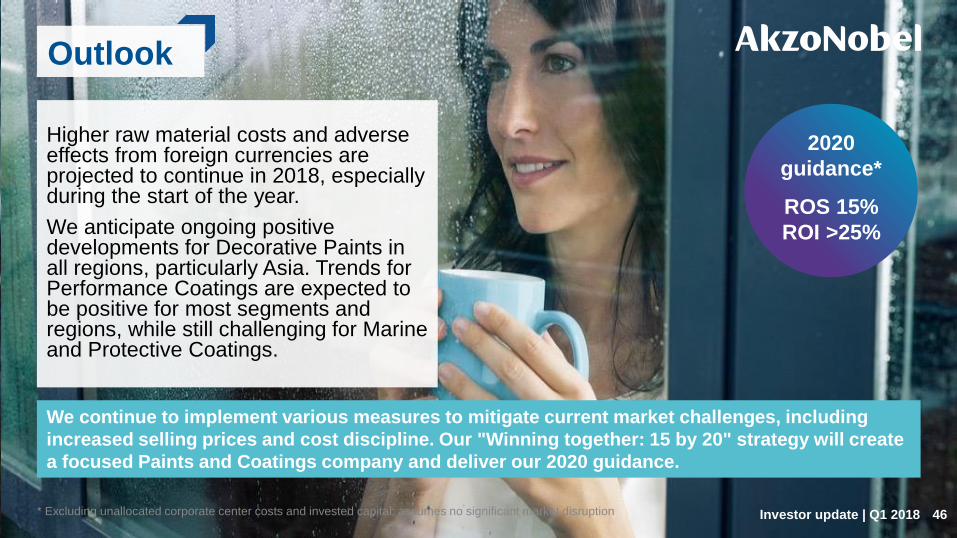
Outlook
Higher raw material costs and adverse effects from foreign currencies are projected to continue in 2018, especially during the start of the year.
We anticipate ongoing positive developments for Decorative Paints in all regions, particularly Asia. Trends for Performance Coatings are expected to be positive for most segments and regions, while still challenging for Marine and Protective Coatings.
Investor update | Q1 2018 * Excluding unallocated corporate center costs and invested capital: assumes no significant market disruption
We continue to implement various measures to mitigate current market challenges, including
increased selling prices and cost discipline. Our "Winning together: 15 by 20" strategy will create
a focused Paints and Coatings company and deliver our 2020 guidance.
46
2020
guidance*
ROS 15%
ROI >25%

Crop picture
Select picture > click on tab
“Picture Tools > Format”
Click on the icon
above “Crop”
You will see crop
and scale markers
on the corners
Use the “circular scale icon”
to scale your picture within
the cropped region.
Upcoming events
Annual General Meeting April 26, 2018
Ex-dividend date of 2017 final dividend April 30, 2018
Payment of cash dividend/ delivery of new shares May 25, 2018
Report for the second quarter 2018 July 18, 2018
Investor update | Q1 2018 47

Title area
max over 2 lines
Insert Topic Icons
Click on the picture icon
and browse to the location
of the Topic Icons
AkzoNobel Bullets
Only use the List Level
buttons to apply the
AkzoNobel Branded Bullets
A focused, high performing Paints and Coatings company
Investor update | Q1 2018
Strong global brands
Leading positions in large and attractive markets
Balanced geographic exposure: 50% revenue from emerging markets
Well positioned to accelerate growth and enhance profitability
Transformation plans in place and clear path to deliver
Significant returns to shareholders
48
2020
guidance*
ROS 15%
ROI >25%
* Excluding unallocated corporate center costs and invested capital; assumes no significant market disruption

AkzoNobel Bullets
Only use the List Level
buttons to apply the
AkzoNobel Branded Bullets
Appendix

Title area
max over 2 lines
Insert Topic Icons
Click on the picture icon
and browse to the location
of the Topic Icons
AkzoNobel Bullets
Only use the List Level
buttons to apply the
AkzoNobel Branded Bullets
Appendix
Full-year
AkzoNobel full-year 2017: Delivering higher revenue and EBIT
EBIT
Adjusted EPS Revenue
2% higher
Total dividend proposed for 2017
Up 52% at €2.50 (2016: €1.65)
EBIT
xx
Q4
6% higher
30% higher
Revenue
4% higher excluding currency impact
Completed acquisition
V.Powdertech Co Ltd
Up 6% at €4.40 (2016: €4.15)
Adjusted EPS
Up 39% at €0.92 (2016: €0.66) excluding currency impact
(continuing and discontinued operations) 50
Title area
max over 2 lines
Insert Topic Icons
Click on the picture icon
and browse to the location
of the Topic Icons
AkzoNobel Bullets
Only use the List Level
buttons to apply the
AkzoNobel Branded Bullets
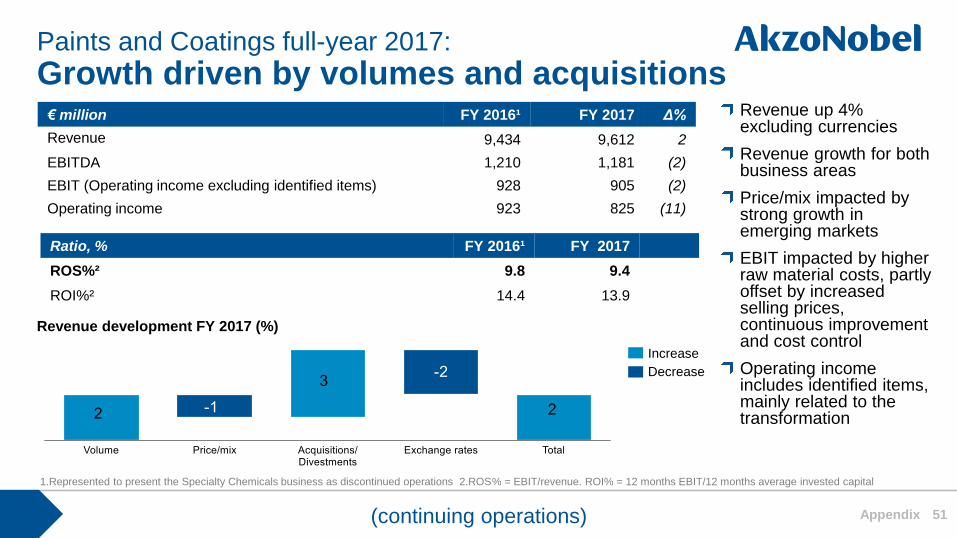
Paints and Coatings full-year 2017:
Growth driven by volumes and acquisitions
Appendix
€ million FY 2016¹ FY 2017 Δ%
Revenue 9,434 9,612 2
EBITDA 1,210 1,181 (2)
EBIT (Operating income excluding identified items) 928 905 (2)
Operating income 923 825 (11)
Ratio, % FY 2016¹ FY 2017
ROS%² 9.8 9.4
ROI%² 14.4 13.9
Increase
Decrease
Revenue development FY 2017 (%)
1.Represented to present the Specialty Chemicals business as discontinued operations 2.ROS% = EBIT/revenue. ROI% = 12 months EBIT/12 months average invested capital
Revenue up 4% excluding currencies
Revenue growth for both business areas
Price/mix impacted by strong growth in emerging markets
EBIT impacted by higher raw material costs, partly offset by increased selling prices, continuous improvement and cost control
Operating income includes identified items, mainly related to the transformation
(continuing operations) 51

Title area
max over 2 lines
Insert Topic Icons
Click on the picture icon
and browse to the location
of the Topic Icons
AkzoNobel Bullets
Only use the List Level
buttons to apply the
AkzoNobel Branded Bullets
Decorative Paints full-year 2017:
Volumes up 7%, with growth in all regions
Appendix
€ million FY 2016 FY 2017 Δ%
Revenue 3,835 3,898 2
EBIT (Operating income excluding identified items) 357 351 (2)
Operating income 366 334 (9)
Ratio, % FY 2016 FY 2017
ROS%* 9.3 9.0
ROI%* 12.8 12.5
Revenue development FY 2017 (%)
*ROS% = EBIT/revenue. ROI% = 12 months EBIT/12 months average invested capital
Increase
Decrease
According to the BrandZ
Top 50 UK report, Dulux
was considered to be the
healthiest UK brand
(continuing operations) 52

Title area
max over 2 lines
Insert Topic Icons
Click on the picture icon
and browse to the location
of the Topic Icons
AkzoNobel Bullets
Only use the List Level
buttons to apply the
AkzoNobel Branded Bullets
Performance Coatings full-year 2017:
Profit lower due to marine and oil and gas
Appendix
Increase
Decrease
Revenue development FY 2017 (%)
€ million FY 2016 FY 2017 Δ%
Revenue 5,665 5,775 2
EBIT (Operating income excluding identified items) 759 669 (12)
Operating income 735 668 (9)
Ratio, % FY 2016 FY 2017
ROS%* 13.4 11.6
ROI%* 29.4 23.4
*ROS% = EBIT/revenue. ROI% = 12 months EBIT/12 months average invested capital
AkzoNobel strengthens its
leading global market
positions in powder
coatings by acquiring V.
Powdertech Co. Ltd, which
brings new technologies
and services to complement
AkzoNobel’s
(continuing operations) 53

Title area
max over 2 lines
Insert Topic Icons
Click on the picture icon
and browse to the location
of the Topic Icons Appendix
Increase
Decrease
Paints and Coatings full-year 2017:
Higher raw material costs, partly offset by continuous improvement and cost control
Includes
Fixed cost
inflation,
cost control,
restructuring
expenses,
and other items
(continuing operations) 54

Title area
max over 2 lines
Insert Topic Icons
Click on the picture icon
and browse to the location
of the Topic Icons
AkzoNobel Bullets
Only use the List Level
buttons to apply the
AkzoNobel Branded Bullets
AkzoNobel full-year 2017:
Free cash flow impacted by changes in working capital, provisions and other items
Appendix
€ million
FY2016 FY2017
EBITDA 2,108 2,132
Interest paid -87 -84
Tax paid -285 -338
Changes in working capital, provisions¹ and other -181 -520
Capital expenditures (including intangible assets) -651 -635
Free cash flow, excluding pension top-up payments 904 555
Pension top-up payments -264 -221
Free cash flow (from operations)² 640 334
1. Provisions include recurring pension contributions 2. Free cash flow (from operations) = Net cash from operating activities minus Capital expenditures and Investment in intangibles
(continuing and discontinued operations) 55

Title area
max over 2 lines
Insert Topic Icons
Click on the picture icon
and browse to the location
of the Topic Icons
AkzoNobel Bullets
Only use the List Level
buttons to apply the
AkzoNobel Branded Bullets
Appendix
AkzoNobel full-year 2017:
Cash management discipline continues
Operating Working Capital € million
OWC as % of LQ revenue x 4
Capital expenditures € million
Paints &
Coatings
Specialty
Chemicals % of revenue
(continuing and discontinued operations) 56

Title area
max over 2 lines
Insert Topic Icons
Click on the picture icon
and browse to the location
of the Topic Icons
AkzoNobel Bullets
Only use the List Level
buttons to apply the
AkzoNobel Branded Bullets
€ million
FY2016 FY2017
Free cash flow 640 334
Dividend paid -336 -1,187
Other* 29 -136
Net cash generation excl. acquisitions and divestments
333 -989
Acquisitions -416 -80
Divestments 53 52
Net cash generation -30 -1,017
Appendix
AkzoNobel Full-Year 2017:
€1bn special cash dividend paid in 2017
*includes: Dividend from associates and joint ventures interest received and issue of shares for stock option plan and other changes
Net Debt (continuing operations) 1,252 1,951
Net Debt (discontinued operations) N/A 386
(continuing and discontinued operations) 57
Title area
max over 2 lines
Insert Topic Icons
Click on the picture icon
and browse to the location
of the Topic Icons
AkzoNobel Bullets
Only use the List Level
buttons to apply the
AkzoNobel Branded Bullets
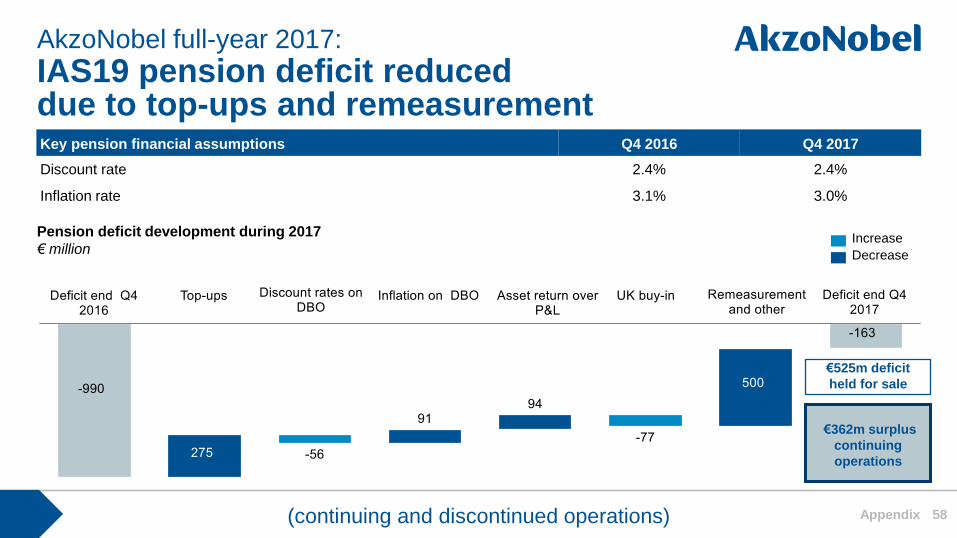
Appendix
AkzoNobel full-year 2017:
IAS19 pension deficit reduced due to top-ups and remeasurement
Pension deficit development during 2017
€ million Decrease
Increase
Key pension financial assumptions Q4 2016 Q4 2017
Discount rate 2.4% 2.4%
Inflation rate 3.1% 3.0%
€525m deficit
held for sale
€362m surplus
continuing
operations
(continuing and discontinued operations) 58

Title area
max over 2 lines
Insert Topic Icons
Click on the picture icon
and browse to the location
of the Topic Icons
AkzoNobel Bullets
Only use the List Level
buttons to apply the
AkzoNobel Branded Bullets
Appendix
AkzoNobel full-year 2017:
Total dividend up 52%
*Based on year-end share price
Interim dividend
Final dividend
Dividend € per share
2.5% 2.5% 2.8% Yield* 3.4%
Additional €4 per share special cash
dividend paid in December 2017
(continuing and discontinued operations) 59
Dividend policy is to pay a “stable to rising” dividend each year
Dividend paid in cash, unless shareholders elect to receive a stock dividend (40% maximum)
Shares cancelled from the €160 million repurchase program in 2017

Title area
max over 2 lines
Insert Topic Icons
Click on the picture icon
and browse to the location
of the Topic Icons
AkzoNobel Bullets
Only use the List Level
buttons to apply the
AkzoNobel Branded Bullets
60 Appendix
Revenue € million – as reported before 2018 2017
Industrial and Powder Coatings 2,974
Marine and Protective Coatings 1,299
Automotive and Specialty Coatings 1,551
Other/intragroup eliminations (49)
Total 5,775
Performance Coatings Revenue by business
Revenue € million – as reported 2018 onwards Q1 17 Q2 17 Q3 17 Q4 17 2017 Q1 18
Powder Coatings 288 303 286 296 1,173 292
Marine and Protective Coatings 380 377 347 319 1,424 300
Automotive and Specialty Coatings 360 362 351 353 1,426 346
Industrial Coatings 454 475 457 419 1,805 423
Other/intragroup eliminations (11) (13) (13) (16) (53) (19)
Total 1,471 1,504 1,428 1,372 5,775 1,342
Figures for 2017 have been represented for the new business unit structure.
(continuing operations)

Title area
max over 2 lines
Insert Topic Icons
Click on the picture icon
and browse to the location
of the Topic Icons
AkzoNobel Bullets
Only use the List Level
buttons to apply the
AkzoNobel Branded Bullets
Disclaimer/ forward-looking statements
This presentation does not constitute or form a part of any offer to sell, or any invitation or other solicitation of any offer, to buy or subscribe
for any securities in the United States or any other jurisdiction.
Some statements in this presentation are 'forward-looking statements'. By their nature, forward-looking statements involve risk and
uncertainty because they relate to events and depend on circumstances that may occur in the future. These forward-looking statements
involve known and unknown risks, uncertainties and other factors that are outside of our control and impossible to predict and may cause
actual results to differ materially from any future results expressed or implied. These forward-looking statements are based on current
expectations, estimates, forecasts, analyses and projections about the industries in which we operate and management's beliefs and
assumptions about possible future events. You are cautioned not to put undue reliance on these forward-looking statements, which only
speak as of the date of this presentation and are neither predictions nor guarantees of possible future events or circumstances. We do not
undertake any obligation to release publicly any revisions to these forward-looking statements to reflect events or circumstances after the
date of this presentation or to reflect the occurrence of unanticipated events, except as may be required under applicable securities laws.
This presentation also contains statements, which address such key issues as AkzoNobel's growth strategy, future financial results, market
positions, product development, products in the pipeline, and product approvals. Such statements should be carefully considered, and it
should be understood that many factors could cause forecasted and actual results to differ from these statements. These factors include,
but are not limited to, price fluctuations, currency fluctuations, developments in raw material and personnel costs, pensions, physical and
environmental risks, legal issues, and legislative, fiscal, and other regulatory measures, as well as the separation of Specialty Chemicals.
Stated competitive positions are based on management estimates supported by information provided by specialized external agencies. For
a more comprehensive discussion of the risk factors affecting our business please see our latest Annual Report, a copy of which can be
found on the company’s corporate website www.akzonobel.com
61