winter cover crops as a best management practice for reducing nitrogen leaching
TRANSCRIPT

Ž .Journal of Contaminant Hydrology 34 1998 1–15
Winter cover crops as a best management practicefor reducing nitrogen leaching
W.F. Ritter a,), R.W. Scarborough, A.E.M. Chirnsidea Bioresources Engineering Department, UniÕersity of Delaware, Newark, DE 19717, USA
Received 16 September 1996; accepted 23 April 1998
Abstract
The role of rye as a winter cover crop to reduce nitrate leaching was investigated over athree-year period on a loamy sand soil. A cover crop was planted after corn in the early fall andkilled in late March or early April the following spring. No-tillage and conventional tillagesystems were compared on large plots with irrigated corn. A replicated randomized block designexperiment was conducted on small plots to evaluate a rye cover crop under no-tillage andconventional tillage and with commercial fertilizer, poultry manure and composted poultry manureas nitrogen fertilizer sources. Nitrogen uptake by the cover crop along with nitrate concentrations
Ž .in groundwater and the soil profile 0–150 cm were measured on the large plots. Soil nitrateconcentrations and nitrogen uptake by the cover crop were measured on the small plots. There wasno significant difference in nitrate concentrations in the groundwater or soil profile with andwithout a cover crop in either no-tillage or conventional tillage. Annual amounts of nitrate–Nleached to the water-table varied from 136.0 to 190.1 kgrha in 1989 and from 82.4 to 116.2kgrha in 1991. Nitrate leaching rates were somewhat lower with a cover crop in 1989, but not in1990. There was no statistically significant difference in corn grain yields between the cover cropand non-cover crop treatments. The planting date and adequate rainfall are very important inmaximizing nitrogen uptake in the fall with a rye cover crop. On the Delmarva Peninsula, thecover crop should probably be planted by October 1 to maximize nitrogen uptake rates in the fall.On loamy sand soils, rye winter cover crops cannot be counted on as a best management practicefor reducing nitrate leaching in the Mid-Atlantic states. q 1998 Elsevier Science B.V. All rightsreserved.
Keywords: Winter cover crop; Reduced nitrogen leaching; Loamy sand soil
) Corresponding author. Fax: q1-302-831-3651; e-mail: [email protected]
0169-7722r98r$19.00 q 1998 Elsevier Science B.V. All rights reserved.Ž .PII: S0169-7722 98 00087-4

( )W.F. Ritter et al.rJournal of Contaminant Hydrology 34 1998 1–152
1. Introduction
Over the past 10 years, there has been increasing concern about the impact ofagricultural chemicals on groundwater resources. This is particularly true in the Chesa-peake and Delaware Bay watersheds. Extensive water quality monitoring has determinednutrient loadings, specifically nitrogen and phosphorus, as the major factor responsible
Žfor the undesirable changes in Chesapeake Bay U.S. Environmental Protection Agency,.1982 . The states in the Chesapeake Bay drainage area agreed in 1985 to reduce nitrogen
and phosphorus inputs into the Bay and its tributaries by 40% by the year 2000. StudiesŽ .by Staver et al. 1989 indicate that groundwater flow paths play a major role in
nonpoint source nitrogen transport into the Chesapeake Bay from Coastal Plain agricul-tural regions.
Historically, cover crops had been used to reduce soil erosion, fix nitrogen, and as asource of forage in integrated agricultural systems. Since 1945, the development ofrelatively inexpensive inorganic fertilizers, and the concurrent spatial separation oflivestock and grain production, has caused a dramatic reduction in the use of wintercover crops. Much of the recent research on cover crops has focused on the use oflegumes to supply nitrogen for future grain crops. Long before nitrogen was recognizedas a problem in the environment, scientists had documented the ability of cereal graincover crops to reduce the leaching of nitrate from the root zone. However, the successfulintegration of cereal grain cover crops into current cropping systems will require anunderstanding of the dynamics of cover crop nitrogen uptake and mineralization in orderto minimize nitrogen losses to the environment while providing maximum benefit to
Ž .following grain crops Rodale Institute, 1993 .Ž .Morgan et al. 1942 documented the ability of cereal grain cover crops to reduce the
leaching of nitrates and other nutrients from the root zone. Excessive nitrogen leachingduring the nongrowing season has been documented by several investigators on Coastal
Ž .Plain soils. Weil et al. 1987 reported that 80 to 150 kgrha of nitrogen was lostbetween October and March from the root zone of irrigated Coastal Plain soils cropped
Ž .to corn without winter cover crops. Ritter et al. 1991 evaluated the effect of irrigationand nitrogen management on groundwater quality for 4 years. In all but 1 year, thelargest mass of nitrate leached was during the fall and winter months when the largest
Ž .amount of recharge occurs. In another study, Ritter et al. 1993 found the mass ofnitrate–N leached from no-tillage irrigated corn ranged from 55.0 to 78.8 kg Nrharyrand on conventional tillage from 57.1 to 94.0 kg Nrharyr. Most of the leachingoccurred during the late fall and winter.
Much of the research on cover crops has centered on the use of legumes to supplyŽ .nitrogen for future grain crops Ebelhar et al., 1984; Hargrove, 1986 . Brinsfield et al.
Ž .1988 found that a rye cover crop planted after corn harvest assimilated 113.8 kgrhaand 51.5 kgrha total nitrogen for conventional and no-tillage systems 90 days afterplanting, respectively. Soil nitrate–N levels declined by more than 10 mgrkg in the top
Ž .15 cm of the soil during the study. In a later study, Brinsfield and Staver 1991 foundleachate nitrate concentrations were consistently lower when there was a cereal graincover crop present than those observed in previous years with no cover crops on two
( )W.F. Ritter et al.rJournal of Contaminant Hydrology 34 1998 1–15 3
Ž .Coastal Plain watersheds. The Rodale Institute 1993 reports nonlegumes are aboutthree times more efficient than legumes at reducing nitrogen leaching.
Since the goal of the Chesapeake Bay plan is to reduce nitrogen inputs into the Bayby 40% by the year 2000, it is important to evaluate crop management practices thatreduce nitrogen loads to the Bay. A large portion of the nitrogen load to the Bay fromthe Delmarva Peninsula is in the baseflow of streams. Nearly all of drinking water onthe Delmarva Peninsula comes from groundwater. Nitrate concentrations are above 10
Žmgrl N in groundwater in many parts of the Delmarva Peninsula Bachman, 1984;.Ritter and Chirnside, 1987 . Because of these factors a cooperative project was initiated
Žin Pennsylvania, Maryland and Delaware to evaluate the management of a rye Secale.cereale L. cover crop to reduce the leaching of nitrate to groundwater and to optimize
nitrogen recycling on the farm.
2. Experimental methods
The research was conducted at the University of Delaware Research and EducationCenter near Georgetown, DE from 1989 to 1991. Two types of studies were initiated toaddress different aspects of cover crops and nitrogen management. In the first study
Ž .involving groundwater monitoring, four large plots 0.25 ha were used to evaluatenitrate leaching in irrigated corn with and without a rye cover crop, under conventionaltillage and no-tillage treatments. The layout of the large plots are shown in Fig. 1. Theplots were level and the soil had an infiltration rate above 15 cmrh so no runoffoccurred. It was not possible to replicate the large plots because of their size and the costof installing monitoring wells, so a second study was conducted on 36 small plotsŽ .9.5=15.2 m in a replicated study to evaluate nitrate leaching with different nitrogensources for irrigated corn with and without a rye cover crop. Commercial fertilizer,poultry manure and composted poultry manure were used as nitrogen sources. Bothconventional tillage and no-tillage were used. Each treatment was replicated three timesin a randomized complete block design. Both experiments were located on Coastal Plain
Žsandy soils. The large plots were located on an Evesboro loamy sand soil mesic, coated,.typic quartzipssaments and the replicated experiment was located on a Matawan loamy
Ž .sand soil fine-loamy, siliceous, mesic, aquic hapludults . Solid-set sprinkler irrigation ata 9.1=9.1 m spacing was used in both experiments. Corn was grown in all plots in1988, the year before the experiments started.
The large plots had monitoring wells at depths of 3.0 and 4.5 m. Three monitoringwells were installed at each depth in each plot. The water-table generally fluctuated from1.5 to 3.5 m below the surface. All monitoring wells were constructed from 3.25 cm
Ž .polyvinyl chloride PVC pipe with the bottom 0.75 m of the well screened with 2.5 mmslot size PVC screen. The monitoring wells were installed by the auger drilling method.The annulus around all wells were sealed with bentonite.
Ž .30% Urea–ammonia–nitrate UAN liquid nitrogen fertilizer was used for thecommercial fertilizer for both experiments. A total of 56 kgrha of nitrogen was appliedat planting, 67 kgrha was side-dressed when the corn was 15 cm high and 101 kgrhawas side-dressed when the corn was 60 cm high. Poultry manure from a complete

( )W.F. Ritter et al.rJournal of Contaminant Hydrology 34 1998 1–154
Fig. 1. Layout of large plots.
cleanout of a broiler house and the composted poultry manure were applied shortlybefore planting at a rate of 280 kgrha total nitrogen based upon a manure analysis onthe small plots. Both the regular poultry manure and composted poultry manure camefrom the same farm all three years. Lime and phosphorus and potassium fertilizer wereapplied according to soil tests. Atrazine, simazine, alachlor and metolachlor were usedfor weed control. The corn was planted at an average population of 70,200 plantsrha in76 cm rows.
The rye winter cover crop was planted on the plots with a cover crop treatment onOctober 2, October 25 and September 24 in 1988, 1989 and 1990, respectively. The ryewinter cover crop was killed on April 13, April 13 and April 15 in 1989, 1990, 1991,
Ž .respectively, with either paraquat or glyphosate Roundup .Biomass samples of the cover crop were taken in late December in 1988, 1990 and
1991 from all plots and analyzed for total nitrogen. No samples were taken in December1989 because of the extremely cold weather and snow cover. A total of 3 biomass
Ž .samples 30 cm=30 cm were randomly taken from each plot. The samples were driedat 1058C and the dry weight was recorded to estimate biomass yields.
Soil samples were taken in all plots from 0–15 and 15–30 cm depth with a 1.9 cmsoil sampling tube when the rye cover crop was planted, and sampled in December andMarch. A total of five cores were taken from each plot and analyzed for nitrate. On the

( )W.F. Ritter et al.rJournal of Contaminant Hydrology 34 1998 1–15 5
large plots soil samples were also taken to a depth of 150 cm with a 7.5 cm bucket augerin the fall from 1988 to 1991 after the growing season and in March of 1989 and 1990.Soil samples were also taken to a depth of 150 cm on the small plots in 1989 and 1990after harvest. A total of 5 cores were taken from each plot and analyzed for nitrate. Soilsamples were frozen until they were analyzed within two months.
Corn grain yields were taken on all plots by harvesting the middle four rows of theplot with a combine. Corn grain was also analyzed for total nitrogen by the kjeldahl
Ž .method American Public Health Association, 1989 .All monitoring wells were sampled monthly with a battery operated peristaltic pump.
The wells were pumped dry and allowed to recharge before a sample was taken. Allgroundwater samples were analyzed for nitrate–N. Water-table depth measurementswere taken each time groundwater samples were collected before purging. Watersamples were stored at 48C until they were analyzed.
Plant biomass nitrogen was analyzed by macro Kjeldahl for total nitrogen. Soilsamples were extracted with 2 N KCl and analyzed on an autoanalyzer for nitrate–N.All water samples were analyzed by the ion chromatograph method for nitrate–NŽ .American Public Health Association, 1989 .
Rainfall was collected with a tipping-bucket rain gage along with air temperature,wind speed solar radiation and soil temperature data. Readings were recorded at 15-minintervals with a data logger. The automated Campbell Scientific weather station waslocated at the Research and Education Center within 100 m of the plots. Soil moisturedata was collected during the growing season with a neutron probe at 15-cm incrementsto a depth of 120 cm.
3. Results and discussion
3.1. Hydrogeology
The water-table aquifer below the plots consists of sands of the Columbia FormationŽ . Ž .Pleistocene and the subcropping of Manokin and Pocomoke sands Miocene . Thethickness of the water-table aquifer varies from 27 to 61 m. The average transmissivityis about 1000 m3rday and the specific yield is 0.14. The annual recharge varies from
Ž .300 to 380 mm Sundstrom and Pickett, 1969 . The boring logs indicated a loamy sandtopsoil from 0 to 0.3 m and the substratum consisted of medium sand with traces of clayfrom 0.3 to 1.0 m and medium to coarse sand with traces of gravel from 1.0 to 4.5 m onthe irrigated plots.
3.2. Rainfall and irrigation
Rainfall and irrigation from 1989 to 1991 for the large plots are presented in Figs.2–4. Total rainfall for both the large and small plots during the growing season was 727,470 and 398 mm for 1989, 1990 and 1991, respectively. In 1989, rainfall was adequatefor good crop growth. A total of 275 mm of rainfall occurred in August. The month ofJune was very dry in 1990 with only 13 mm of rainfall.

( )W.F. Ritter et al.rJournal of Contaminant Hydrology 34 1998 1–156
Fig. 2. Rainfall and irrigation data for 1989.
The large plots received 133, 342 and 269 mm of irrigation water in 1989, 1990 and1991, respectively. No irrigation water was applied to the small plots in 1989 because ofadequate rainfall. In 1990 and 1991, the small plots received 324 and 210 mm of
Fig. 3. Rainfall and irrigation data for 1990.

( )W.F. Ritter et al.rJournal of Contaminant Hydrology 34 1998 1–15 7
Fig. 4. Rainfall and irrigation data for 1991.
irrigation water, respectively. The Matawan soil on the small plots is not quite as welldrained as the Evesboro soil, so the small plots did not require as much irrigation water.
3.3. Corn yields
The corn grain yields for the replicated experiment are presented in Table 1. Thethree-year average analysis of variance showed there was no significant difference in
Table 1Ž .Corn grain yields from 1989–1991 for the small plots as affected by tillage and nitrogen source kgrha
aTreatment Yields
1989 1990 1991 Average
C–NT–P 8517 7323 8106 7982C–NT–CP 8210 7025 8467 7901C–NT–F 8391 7291 8294 7992NC–NT–P 8568 7009 8216 7931NC–NT–CP 8517 6475 7243 7412NC–NT–F 7764 6617 8060 7480C–CT–P 7539 8059 8122 7907C–CT–CP 8109 7401 8091 7867C–CT–F 8379 7605 8372 8119NC–CT–P 8210 8593 8060 8277NC–CT–CP 8963 7558 7871 8131NC–CT–F 8957 7777 8201 8314
Ž .LSD 0.05 458 351 577 364
aC, Cover crop; NC, No cover; NT, No-tillage; CT, Conventional tillage; P, Poultry manure; CP, Compostedpoultry manure; F, Commercial fertilizer.
( )W.F. Ritter et al.rJournal of Contaminant Hydrology 34 1998 1–158
yield between tillage systems, between cover crop or no cover crop and betweennitrogen sources at the 5% level. The conventional tillage yields were somewhat higherthan the no-tillage yields. There were a number of significant differences in yield amongindividual treatments at the 5% level by the LSD test. The no cover no-tillage treatments
Ž .for composted poultry manure and fertilizer NC–NP–CP and NC–NT–F has signifi-cantly lower grain corn yields on a three-year average by the LSD test than the othertreatments. The results indicate that a rye winter cover crop will not depress yields.Average corn grain yields on the large plots for the three years ranged from 7350 kgrhafor the no-tillage, no cover crop treatment to 8036 kgrha for the cover crop no-tillageexperiments.
3.4. CoÕer crop nitrogen uptake
The nitrogen uptake by the rye cover crop for the three years on the large plots andfor the replicated experiments is summarized in Table 2. For the small plots, cover cropnitrogen uptake rates are an average of the three replications for each treatment ofpoultry manure, composted poultry manure and fertilizer. In 1991, the nitrogen uptakeby the rye in the spring on the large plots was 117.8 kgrha for the no-tillage and 165.3kgrha for the conventional tillage. This high level of nitrogen uptake only occurred oneyear. Nitrogen uptake in December 1989 was relatively low. The rye was planted at an
Ž .optimum time September 24 for maximum nitrogen uptake in the fall, but there wasonly 10.4 cm rainfall from October 1 to December 15. No biomass samples were taken
Ž .in the fall of 1989 because of the late plant date October 25 and the extremely coldweather in December. Nitrogen uptake in the spring of 1990 was 7.0 and 10.8 kgrha. In1989, nitrogen uptake varied from 25.4 to 31.9 kgrha.
Nitrogen uptake on the small plots followed the same trends as the large plots. In thespring of 1991, the average nitrogen uptake by the rye was 69.7 kgrha for no-tillage and77.8 kgrha for conventional tillage. Nitrogen uptake in the spring of 1990 was 24.7kgrha for the conventional tillage and 26.1 kgrha for the no-tillage. In the spring of1989, the nitrogen uptake rate was 47.8 kgrha. Prior to the spring of 1989, there was nodistinction between conventional tillage and no-tillage. The rye was planted on Septem-
Table 2Ž .Nitrogen uptake by cover crops on large and small plots kgrha N
aPlots Tillage N uptake
1988–1989 1989–1990 1990–1991
Fall Spring Spring Fall Spring
Large NT 11.2 31.9 10.8 34.8 117.8Large CT 5.8 25.4 7.0 17.8 165.3
bSmall NT 21.7 47.8 26.1 13.7 69.7bSmall CT 21.7 47.8 24.7 16.4 77.8
a NT, No tillage; CT, Conventional tillage.b No distinction between NT and CT because of project startup with identical tillage conditions in fall 1988.

( )W.F. Ritter et al.rJournal of Contaminant Hydrology 34 1998 1–15 9
ber 24, 1988. An analysis of variance indicated that there was no significant differencein the nitrogen uptake between tillage system or nitrogen source.
On the plots where no-cover crop was planted, some weed growth occurred. In thespring of 1989, biomass samples of the weeds were taken on the large plots without acover crop and analyzed for nitrogen. The average nitrogen removal by the weed growthwas 21.7 kgrha. The average cover crop nitrogen removal rate for the two tillagesystems was 28.7 kgrha in 1989.
Ž .Brinsfield et al. 1988 found that a rye cover crop planted after corn harvestassimilated 113.8 and 51.5 kgrha total nitrogen for conventional and no-tillage systems90 days after planting, respectively. Soil nitrate levels declined by more than 10 mgrkgin the top 15 cm of the soil during the study. In a later study, Brinsfield and StaverŽ .1991 found nitrate leachate concentrations were consistently lower when there was acereal grain cover crop present than those observed in previous years with no covercrops on two Coastal Plain watersheds. The research results reported in this paper are
Ž .somewhat different than the results obtained by Brinsfield et al. 1988 at the Universityof Maryland at the Wye Research Center. The research conducted by Brinsfield et al.Ž .1988 was conducted on a silt loam soil with good water holding capacity. Nitrates onsandy soils tend to move more rapidly below the root zone than on silt loam soilsbecause of the higher permeability so there was probably more nitrate available for plantuptake by the cover crop in the root zone on the silt loam soil than in this study. Theamount of nitrogen uptake by cover crops will depend upon the amount of rainfall whichinfluences the amount of nitrate leached below the root zone and on the planting date ofthe cover crop.
3.5. Soil nitrate leÕels
Soil nitrate–N concentrations in the 0–30 cm depth for the large plots for differentsampling dates are presented in Table 3. The top 30 cm is considered the effective rootzone of the cover crop. There was not much difference in soil nitrate concentrationsbetween winter cover and no cover for both no-tillage by the t-test. Nitrate concentra-tions were the lowest in March of 1991 and highest in September 1988 at the beginningof the experiment. Nitrogen uptake was the highest during 1990–1991 and rainfall wasalso the highest from December 1990 to March 1991 for any of the three years. A totalof 407 mm of rainfall occurred during the four months. All plots had weed growth on
Table 3Ž .Soil nitrate concentrations in top 30 cm of soil profile mgrkg N
a bTreatment Oct. Dec. Apr. Oct. Apr. Sept. Dec. Apr. Nov. SE1988 1988 1989 1989 1990 1990 1990 1991 1991
C–NT 9.8 4.0 8.5 8.4 2.9 9.0 6.7 1.4 7.4 2.49NC–NI 10.1 8.1 7.5 7.0 3.6 6.5 8.8 3.0 5.0 2.41C–CT 7.7 6.4 7.7 6.8 2.3 7.3 6.3 1.1 6.8 2.36NC–CT 9.8 4.8 9.9 7.0 3.3 6.6 7.9 2.1 8.8
aC, Cover crop; NC, No cover crop; NT, No tillage; CT, Conventional tillage.bSE, Standard error.
( )W.F. Ritter et al.rJournal of Contaminant Hydrology 34 1998 1–1510
them, so even on the no cover plots some nitrogen would be removed by the weeds asindicated in Section 3.4.
Soil nitrate concentrations in the 0 to 30 cm depth for the small plot are presented inTable 4. There was no correlation in the soil nitrate concentrations among the differenttreatments. There was no significant difference between soil nitrate concentrations in thecover and no cover treatments or for the different nitrogen sources. Nitrate concentra-tions were the lowest in April 1991. The soil nitrate concentrations were slightly lowerwhere a cover crop was planted in April 1991 than without a cover crop.
Ž .In two out of the three years 1988 and 1990 , soil nitrate concentrations were higherin December than October or September. There was a statistically significant differencein 1988 but not in 1990. Nitrification will occur when the temperature is above 58C.Under normal weather conditions, many days in November and December will havetemperatures above 58C.
In 1989, the latter part of November and December had very few days where thetemperature was above 58C which probably limited the late fall nitrification. On theplots where no cover crop was planted, considerable weed growth occurred which wouldalso take up nitrogen. This may be one reason why there was no significant differencebetween the cover and no-cover soil nitrate concentrations in December. One wouldexpect low nitrate concentrations on all the plots in early spring because most of thenitrate would be leached to lower depths by the winter precipitation. Earlier research hasshown that most of the nitrate is leached to the groundwater from December to May,
Ž .when most of the recharge occurs Ritter et al., 1993 .Soil samples taken to a depth of 150 cm indicated that there was considerable amount
of nitrogen below the 30 cm depth that could eventually be leached to the groundwater.In November, 1989 the total mass in the 0 to 150 cm depth ranged from 153 to 213kgrha N.
Table 4Ž .Soil nitrate concentrations in top 30 cm for small plots mgrkg N
aTreatment 1988 1989 1990 1991
Oct. Dec. Apr. Oct. Dec. Apr. Sept. Dec. Apr. Nov.
C–CT–P 2.1 12.8 7.2 6.2 5.4 4.1 5.7 8.4 2.9 5.9C–NT–CP 2.1 12.8 7.2 4.0 7.0 4.1 7.9 9.0 2.9 7.2C–NT–F 2.1 12.8 7.2 4.0 4.4 4.3 4.4 8.4 2.5 5.2NC–NT–P 5.0 10.5 7.2 5.3 5.7 4.7 6.4 9.6 2.5 5.9NC–NT–CP 5.0 10.5 7.2 4.2 4.6 5.4 6.4 11.1 3.5 6.9NC–NT–F 5.0 10.5 7.2 3.9 8.6 4.7 4.7 8.7 3.6 5.5C–CT–P 2.1 12.0 5.5 6.4 3.8 4.4 7.8 7.7 3.4 5.9C–CT–CP 2.1 12.0 5.5 6.7 5.1 4.7 7.6 8.0 4.7 6.2C–CT–F 2.1 12.0 5.5 5.3 4.4 3.9 4.6 7.4 3.8 7.0NC–CT–P 5.0 9.6 9.4 7.4 4.0 4.8 8.3 7.8 5.2 4.0NC–CT–CP 5.0 9.6 9.4 6.2 3.3 4.8 7.7 8.4 4.6 4.2NC–CT–F 5.0 9.6 9.4 6.8 4.6 5.1 5.1 8.9 4.1 5.0
aC, Cover crop; NC, No cover crop; NT, No tillage; CT-Conventional tillage; P, Poultry manure; CP,Composted poultry manure; F, Commercial fertilizer.
( )W.F. Ritter et al.rJournal of Contaminant Hydrology 34 1998 1–15 11
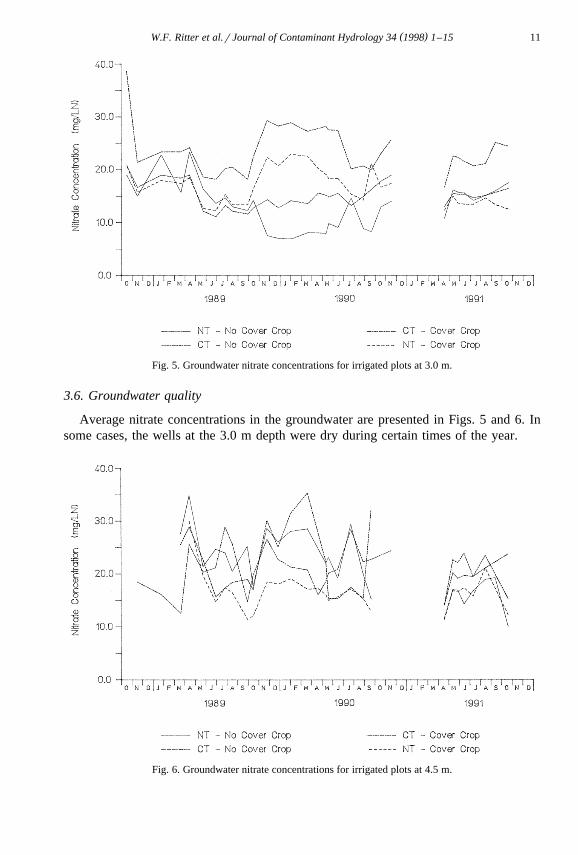
Fig. 5. Groundwater nitrate concentrations for irrigated plots at 3.0 m.
3.6. Groundwater quality
Average nitrate concentrations in the groundwater are presented in Figs. 5 and 6. Insome cases, the wells at the 3.0 m depth were dry during certain times of the year.
Fig. 6. Groundwater nitrate concentrations for irrigated plots at 4.5 m.

( )W.F. Ritter et al.rJournal of Contaminant Hydrology 34 1998 1–1512
Most of the wells had nitrate–N concentrations above 10 mgrl for most samplingdates. It was only during the latter part of 1989 and part of 1990 that the no-tillage, nocover crop plot had average nitrate–N concentrations below 10 mgrl at the 4.5-m depth.The cover crop did not reduce the nitrate concentrations in the groundwater. T-testsindicated there was no significant difference at the 5% level in nitrate concentrations inthe groundwater for cover crop and no cover crop under both conventional tillage andno-tillage. The only trends the data show is in seasonal fluctuations. Nitrate concentra-tions were somewhat lower in the summer and highest during the fall of 1989. Duringthe spring and summer of 1990, nitrate concentrations were higher in the 4.5-m-depthwells than the 3.0-m wells on the conventional tillage plot with a winter cover.
Monthly water budgets were determined from soil moisture, rainfall and irrigationdata to estimate percolation losses. Soil moisture measurements were made weeklyduring the growing season with a neutron probe to a depth of 120 cm. The amount ofirrigation water applied was also measured. Weekly evapotranspiration rates were
Ž .calculated by the Jensen–Haise method Ritter et al., 1983 and totaled for each month.An 80% irrigation efficiency was assumed in calculating the evapotranspiration rates.The monthly deep percolation rate was estimated by the equation:
DPsPq IyETyDS,
where: DPsmonthly deep percolation in cm; Ismonthly irrigation water applied incm; ETsmonthly evapotranspiration rate in cm, and DSschange in soil moisture incm.
During the nongrowing season, it was assumed that the soil moisture was at fieldcapacity and DS was zero. The average monthly nitrate concentrations in the groundwa-
Ž .ter at the 3.0-m depth 4.5-m depth if 3.0-m-depth wells were dry with the estimatedmonthly deep percolation rate to estimate the monthly mass of nitrate leached in eachplot. Mass amounts of nitrate leached for the different seasons are presented in Table 5.The highest amount of nitrate leached was in 1989. The annual nitrate–N leaching lossvaried from 139 kgrha on the cover crop conventional tillage plot to 190 kgrha on theno cover no-tillage plot. There was no general trend in the nitrogen leached from thecover crop and non-cover crop plots or the no-tillage vs. the conventional tillagetreatments. Only in 1989 was an occurrence of less nitrogen leached in the cover croptreatments. For all three years, there was a significant amount of nitrogen leached duringthe growing season. This was all due to several large rainfall events that occurred in Julyand August. In most cases, the soil moisture in the root zone was near field capacitywhen the rainfall occurred because of irrigation. It is difficult to prevent nitrogenleaching under irrigation on sandy soils in humid regions because of the possibility ofheavy rainfall. The transport of nitrates to the groundwater in the Evesboro soil is fairlyrapid. Previous research has shown that 2.5 cm of water will move nitrates 15 cm in an
Ž .Evesboro loamy sand soil Ritter et al., 1991 . Since the water-table varied from 1.7 to3.3 m, deep percolation rates of 28 to 55 cm would move nitrates from the soil surfaceto the water-table. Based upon the water budget, the estimated deep percolation was 86cm in 1989 and 48 cm in 1990.
In 1990, a total of 116 kgrha of nitrate–N was leached to the groundwater for theno-tillage no-cover plot. The nitrogen removed with the corn grain was 95 kgrha and a
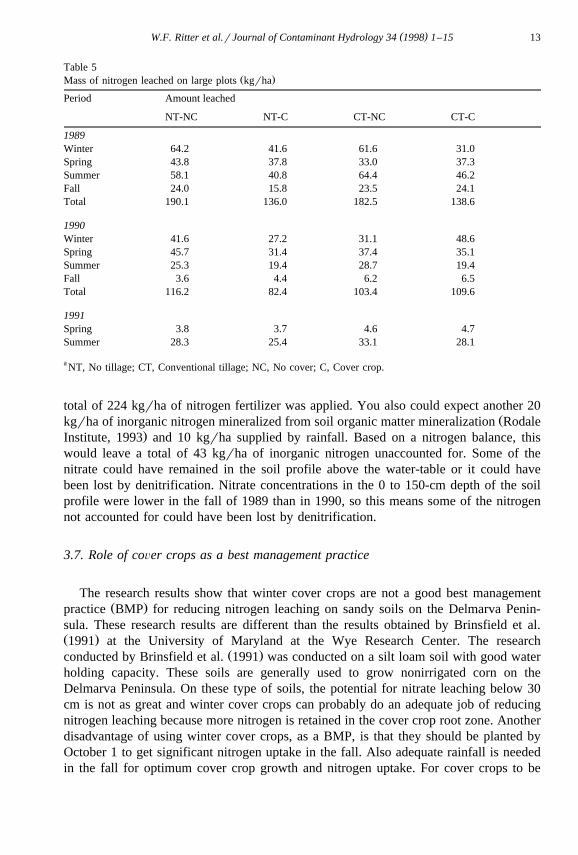
( )W.F. Ritter et al.rJournal of Contaminant Hydrology 34 1998 1–15 13
Table 5Ž .Mass of nitrogen leached on large plots kgrha
Period Amount leached
NT-NC NT-C CT-NC CT-C
1989Winter 64.2 41.6 61.6 31.0Spring 43.8 37.8 33.0 37.3Summer 58.1 40.8 64.4 46.2Fall 24.0 15.8 23.5 24.1Total 190.1 136.0 182.5 138.6
1990Winter 41.6 27.2 31.1 48.6Spring 45.7 31.4 37.4 35.1Summer 25.3 19.4 28.7 19.4Fall 3.6 4.4 6.2 6.5Total 116.2 82.4 103.4 109.6
1991Spring 3.8 3.7 4.6 4.7Summer 28.3 25.4 33.1 28.1
a NT, No tillage; CT, Conventional tillage; NC, No cover; C, Cover crop.
total of 224 kgrha of nitrogen fertilizer was applied. You also could expect another 20Žkgrha of inorganic nitrogen mineralized from soil organic matter mineralization Rodale
.Institute, 1993 and 10 kgrha supplied by rainfall. Based on a nitrogen balance, thiswould leave a total of 43 kgrha of inorganic nitrogen unaccounted for. Some of thenitrate could have remained in the soil profile above the water-table or it could havebeen lost by denitrification. Nitrate concentrations in the 0 to 150-cm depth of the soilprofile were lower in the fall of 1989 than in 1990, so this means some of the nitrogennot accounted for could have been lost by denitrification.
3.7. Role of coÕer crops as a best management practice
The research results show that winter cover crops are not a good best managementŽ .practice BMP for reducing nitrogen leaching on sandy soils on the Delmarva Penin-
sula. These research results are different than the results obtained by Brinsfield et al.Ž .1991 at the University of Maryland at the Wye Research Center. The research
Ž .conducted by Brinsfield et al. 1991 was conducted on a silt loam soil with good waterholding capacity. These soils are generally used to grow nonirrigated corn on theDelmarva Peninsula. On these type of soils, the potential for nitrate leaching below 30cm is not as great and winter cover crops can probably do an adequate job of reducingnitrogen leaching because more nitrogen is retained in the cover crop root zone. Anotherdisadvantage of using winter cover crops, as a BMP, is that they should be planted byOctober 1 to get significant nitrogen uptake in the fall. Also adequate rainfall is neededin the fall for optimum cover crop growth and nitrogen uptake. For cover crops to be

( )W.F. Ritter et al.rJournal of Contaminant Hydrology 34 1998 1–1514
planted by October 1, this means there is a very narrow time frame between when thecorn is harvested and when the cover crop needs to planted. This planting scheduledoesn’t fit into the timetable of many grain farmers on the Delmarva Peninsula whofarm from 500 to 1000 ha. Another alternative to planting the rye would be to fly it onin late August before the corn is harvested. In reviewing agricultural statistics data, itappears the use of a rye winter cover crop as a BMP is limited in Maryland andDelaware. From 1992 to 1994, only 5% of the corn the previous year had a rye cover
Ž .crop planted after it in Maryland Maryland Department of Agriculture, 1994 .
4. Conclusions
A rye winter cover crop will not reduce corn yields the following year if irrigation isused.
The planting date and weather conditions are very important in maximizing nitrogenuptake in the fall with a rye cover crop. On the Delmarva Peninsula, the cover cropshould probably be planted by October 1 to maximize nitrogen uptake rates in the fall.On sandy soils on the Delmarva Peninsula, it is also important to have adequate rainfallin October and November to obtain good cover crop growth and optimum nitrogenuptake. Based upon rainfall probability, there is a chance that rainfall will not besufficient once in three or four years for optimum cover crop growth. For farmers thathave irrigation, supplemental irrigation water could be applied to the cover crop. Lessthan 25% of the corn is irrigated on the Delmarva Peninsula.
On loamy sand soils, rye winter cover crops cannot be counted on as a bestmanagement practice for reducing nitrate leaching in the Mid-Atlantic states.
References
American Public Health Association, 1989. Standard Methods for the Examination of Water and Wastewater,16th edn. New York, NY.
Bachman, 1984.Brinsfield, R.B., Staver, K.W., 1991. Role of Cover Crops in Reduction of Cropland Nonpoint Source
Pollution. Tech. Report, University of Maryland, Agricultural Experiment Station, College Park, MD.Brinsfield, R.B., Staver, K.W., Magette, W., 1988. The role of cover crops in reducing nitrate leaching to
groundwater. In: Agricultural Impacts on Groundwater. National Water Well Association, Dublin, OH, pp.127–146.
Brinsfield et al., 1991.Ebelhar, S.A., Frye, W., Blevins, R., 1984. Nitrogen from legume cover crops for no-tillage corn. Agronomy
Ž .J. 76 1 , 51–55.Ž .Hargrove, W.L., 1986. Winter legumes as a nitrogen source for no-till grain sorghum. Agronomy J. 78 1 ,
70–74.Ž .Maryland Department of Agriculture, 1994. Maryland Agri-Facts. AF 21–94 1994 . Maryland Agricultural
Statistical Service, Annapolis, MD, 4 pp.Morgan, M.F., Jacobson, H., LeCompte Jr., S., 1942. Drainage water losses from a sandy soil as affected by
cropping and cover crops. Connecticut Agric. Exp. Station Bul. 466, 731–759, 26 pp.Ritter, W.F., Chirnside, A.E.M., 1987. Influence of agricultural practices on nitrates in the water-table aquifer.
Biol. Wastes 19, 165–178.

( )W.F. Ritter et al.rJournal of Contaminant Hydrology 34 1998 1–15 15
Ritter, W.F., Williams, T.H., Eastburn, R.P., 1983. Sprinkler irrigation of corn in Delaware. DelawareAgricultural Experiment Station, University of Delaware, Newark, DE, Bull. 446, 58 pp.
Ritter, W.F., Scarborough, R.W., Chirnside, A.E.M., 1991. Nitrate leaching under irrigation on Coastal PlainŽ .soil. J. Irrigation Drainage Eng. 117 4 , 490–502.
Ritter, W.F., Scarborough, R.W., Chirnside, A.E.M., 1993. Nitrate leaching under irrigated corn. J. IrrigationŽ .Drainage Eng. 119 3 , 544–553.
Rodale Institute, 1993. Managing cover crops profitably. Rodale Institute, Emmaus, PA, 78 pp.Staver, K.W., Brinsfield, R.B., Stevenson, J.C., 1989. The effect of best management practices on nitrogen
transport into Chesapeake Bay. In: Toxic Substances in Agricultural Water Supply and Drainage. U.S.Commission on Irrigation and Drainage, Denver, CO, pp. 163–179.
Sundstrom, R.W., Pickett, T.E., 1969. The availability of ground water in Eastern Sussex county. WaterResources Center. University of Delaware, Newark, DE, Tech. Report, 123 pp.
U.S. Environmental Protection Agency, 1982. Chesapeake Bay program technical studies: a synthesis.Ž .Technical Report 24 , EPA Chesapeake Bay Program. Annapolis, MD, 45 pp.
Weil, R.R., Weismiller, R., Turner, R., 1987. Nitrate contamination of groundwater under irrigated CoastalPlain soils. Abstract, American Society of Agronomy Annual Meeting, Atlanta, GA.