wisconsin center district operations review volume ii …
TRANSCRIPT

Preliminary Draft – Subject to Revision Page 0
WISCONSIN CENTER DISTRICT OPERATIONS REVIEW
VOLUME II OF II
Barrett Sports Group, LLCCrossroads Consulting Services, LLC
March 17, 2017
Preliminary Draft – Subject to Revision
Preliminary Draft – Subject to Revision Page 1
TABLE OF CONTENTS
VOLUME I OF II
I. EXECUTIVE SUMMARY
LIMITING CONDITIONS AND ASSUMPTIONS
VOLUME II OF II
I. INTRODUCTION
II. WCD OVERVIEW
III. MARKET OVERVIEW
IV. BENCHMARKING ANALYSIS
V. WCD/VISIT MILWAUKEE STRUCTURE
VI. FINDINGS AND RECOMMENDATIONS
APPENDIX: MARKET DEMOGRAPHICS
LIMITING CONDITIONS AND ASSUMPTIONS
Preliminary Draft – Subject to Revision Page 2
TABLE OF CONTENTS
VOLUME II OF II
I. INTRODUCTION
II. WCD OVERVIEWA. Wisconsin CenterB. UW-Milwaukee Panther ArenaC. Milwaukee TheatreD. Consolidated StatementsE. Lost Business ReportsF. Key Agreement SummariesG. Capital Repairs HistoryH. Site Visit Observations
Preliminary Draft – Subject to Revision Page 3
TABLE OF CONTENTS
VOLUME II OF II
III. MARKET OVERVIEWA. Demographic OverviewB. Hotel and Airport DataC. Competitive FacilitiesD. Demographic ComparisonE. Comparable ComplexesF. Comparable Complex Case StudiesG. Local Sports TeamsH. Festivals/Other EventsI. Downtown DevelopmentJ. General Observations
IV. BENCHMARKING ANALYSISA. WCD BenchmarkingB. Wisconsin Center BenchmarkingC. UWM Panther Arena BenchmarkingD. Milwaukee Theatre Benchmarking
Preliminary Draft – Subject to Revision Page 4
TABLE OF CONTENTS
VOLUME II OF II
V. WCD/VISIT MILWAUKEE STRUCTURE
VI. FINDINGS AND RECOMMENDATIONSA. WCD SWOTB. Strategic Recommendations
APPENDIX: MARKET DEMOGRAPHICS
LIMITING CONDITIONS AND ASSUMPTIONS

I. INTRODUCTION

Preliminary Draft – Subject to Revision Page 6
Introduction
Barrett Sports Group, LLC (BSG) and Crossroads Consulting Services, LLC (Crossroads) are pleasedto present our review of the Wisconsin Center District (WCD) operations
Purpose of the Study Provide an independent, objective evaluation of the current management and operations of the
WCD facilities Develop strategic recommendations and operating strategies to optimize performance and assist
the WCD in future planning efforts Although we did consider the existing (or potential) relationships of the WCD and VISIT
Milwaukee or the Marcus Center, we did not review the operations of those entities We did not complete a convention center expansion feasibility study
The WCD’s mission statement is a critical element as it dictates the operating strategy for themanagement team Maintain, and continuously build, our professional reputation in the convention, entertainment,
and sporting events industry on all levels, both locally and nationally Present first-class facilities in the 21st century Provide the most effective use of space for our clients by utilizing the collective talents of all
WCD employees Create and sustain jobs, income, and prosperity in the greater Milwaukee community
I. INTRODUCTION
Preliminary Draft – Subject to Revision Page 7
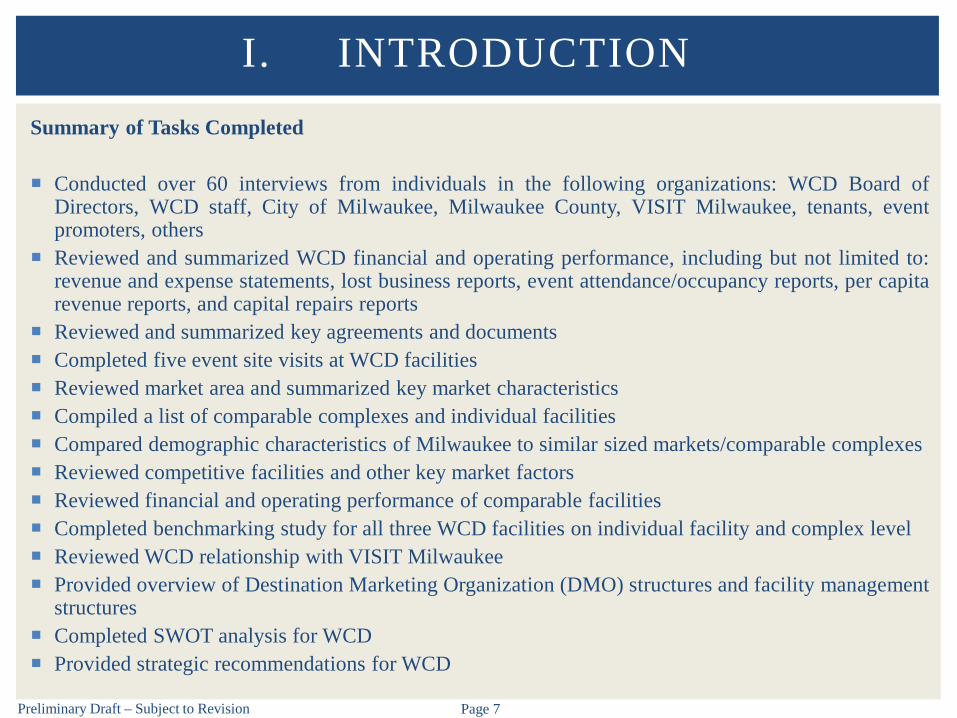
Summary of Tasks Completed
Conducted over 60 interviews from individuals in the following organizations: WCD Board ofDirectors, WCD staff, City of Milwaukee, Milwaukee County, VISIT Milwaukee, tenants, eventpromoters, others
Reviewed and summarized WCD financial and operating performance, including but not limited to:revenue and expense statements, lost business reports, event attendance/occupancy reports, per capitarevenue reports, and capital repairs reports
Reviewed and summarized key agreements and documents Completed five event site visits at WCD facilities Reviewed market area and summarized key market characteristics Compiled a list of comparable complexes and individual facilities Compared demographic characteristics of Milwaukee to similar sized markets/comparable complexes Reviewed competitive facilities and other key market factors Reviewed financial and operating performance of comparable facilities Completed benchmarking study for all three WCD facilities on individual facility and complex level Reviewed WCD relationship with VISIT Milwaukee Provided overview of Destination Marketing Organization (DMO) structures and facility management
structures Completed SWOT analysis for WCD Provided strategic recommendations for WCD
I. INTRODUCTION
Preliminary Draft – Subject to Revision Page 8
The Consulting TeamBarrett Sports Group, LLC
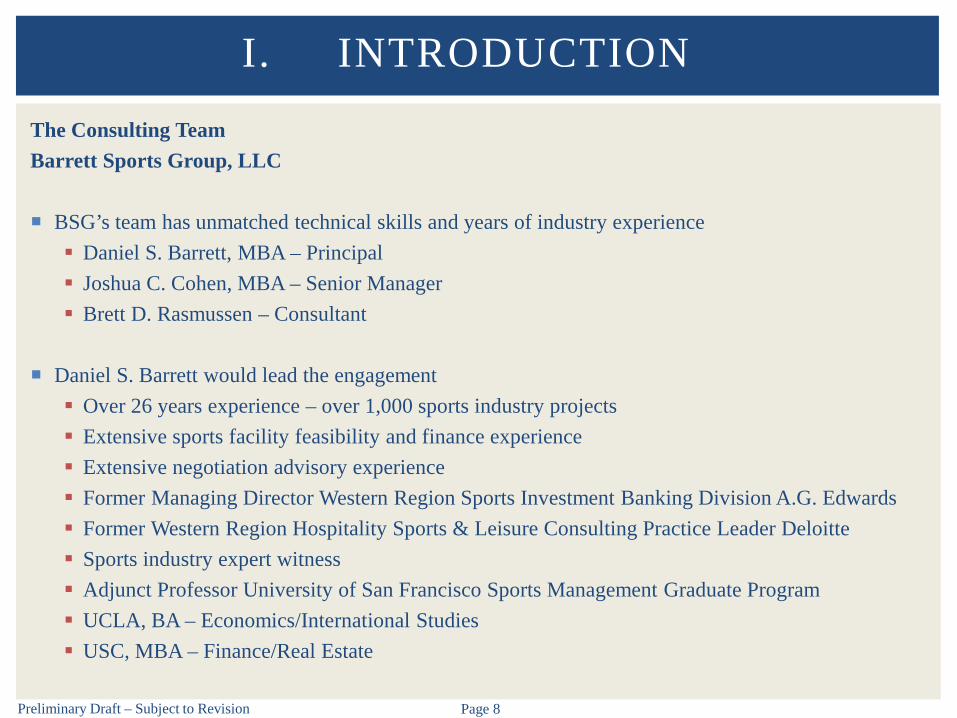
BSG’s team has unmatched technical skills and years of industry experience Daniel S. Barrett, MBA – Principal Joshua C. Cohen, MBA – Senior Manager Brett D. Rasmussen – Consultant
Daniel S. Barrett would lead the engagement Over 26 years experience – over 1,000 sports industry projects Extensive sports facility feasibility and finance experience Extensive negotiation advisory experience Former Managing Director Western Region Sports Investment Banking Division A.G. Edwards Former Western Region Hospitality Sports & Leisure Consulting Practice Leader Deloitte Sports industry expert witness Adjunct Professor University of San Francisco Sports Management Graduate Program UCLA, BA – Economics/International Studies USC, MBA – Finance/Real Estate
I. INTRODUCTION
Preliminary Draft – Subject to Revision Page 9
The Consulting TeamBarrett Sports Group, LLC
I. INTRODUCTION
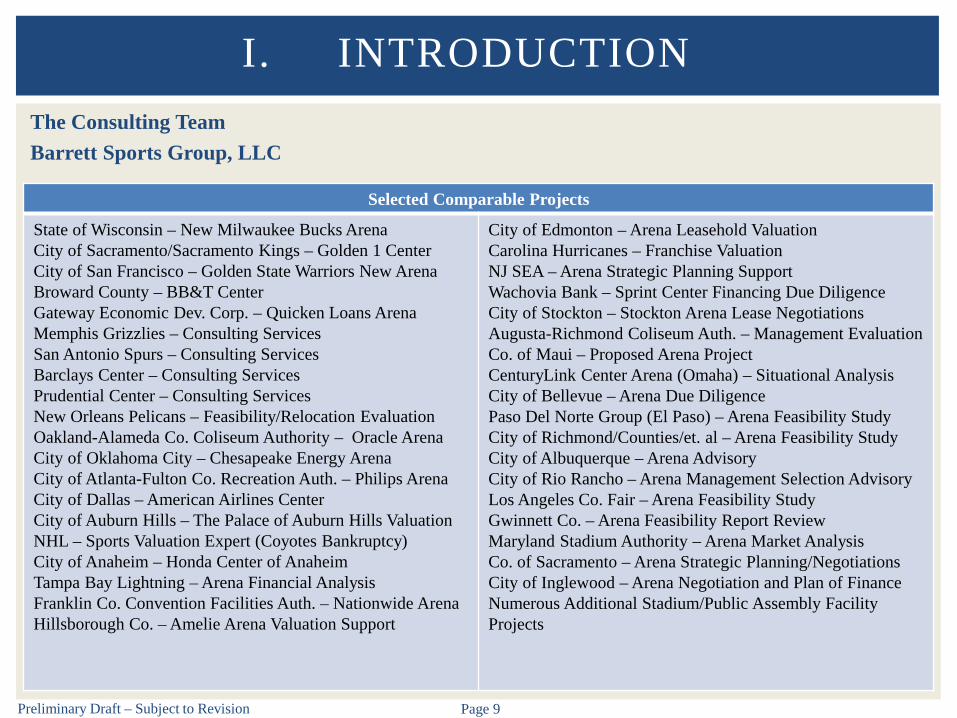
Selected Comparable Projects
State of Wisconsin – New Milwaukee Bucks Arena City of Sacramento/Sacramento Kings – Golden 1 CenterCity of San Francisco – Golden State Warriors New ArenaBroward County – BB&T Center Gateway Economic Dev. Corp. – Quicken Loans ArenaMemphis Grizzlies – Consulting ServicesSan Antonio Spurs – Consulting ServicesBarclays Center – Consulting ServicesPrudential Center – Consulting ServicesNew Orleans Pelicans – Feasibility/Relocation EvaluationOakland-Alameda Co. Coliseum Authority – Oracle ArenaCity of Oklahoma City – Chesapeake Energy ArenaCity of Atlanta-Fulton Co. Recreation Auth. – Philips ArenaCity of Dallas – American Airlines CenterCity of Auburn Hills – The Palace of Auburn Hills ValuationNHL – Sports Valuation Expert (Coyotes Bankruptcy)City of Anaheim – Honda Center of AnaheimTampa Bay Lightning – Arena Financial AnalysisFranklin Co. Convention Facilities Auth. – Nationwide ArenaHillsborough Co. – Amelie Arena Valuation Support
City of Edmonton – Arena Leasehold ValuationCarolina Hurricanes – Franchise ValuationNJ SEA – Arena Strategic Planning SupportWachovia Bank – Sprint Center Financing Due DiligenceCity of Stockton – Stockton Arena Lease Negotiations Augusta-Richmond Coliseum Auth. – Management EvaluationCo. of Maui – Proposed Arena ProjectCenturyLink Center Arena (Omaha) – Situational AnalysisCity of Bellevue – Arena Due DiligencePaso Del Norte Group (El Paso) – Arena Feasibility StudyCity of Richmond/Counties/et. al – Arena Feasibility StudyCity of Albuquerque – Arena Advisory City of Rio Rancho – Arena Management Selection AdvisoryLos Angeles Co. Fair – Arena Feasibility StudyGwinnett Co. – Arena Feasibility Report Review Maryland Stadium Authority – Arena Market AnalysisCo. of Sacramento – Arena Strategic Planning/Negotiations City of Inglewood – Arena Negotiation and Plan of FinanceNumerous Additional Stadium/Public Assembly Facility Projects

Preliminary Draft – Subject to Revision Page 10
The Consulting TeamCrossroads Consulting Services, LLC
Crossroads is a market leader in providing advisory and development planning services to the ConventionCenter industry
Susan Sieger – Managing Principal Over 25 years experience in convention, sports, entertainment, hospitality, and tourism industries Previously National Director of KPMG’s Convention, Sports, and Entertainment Practice Conducted 400+ studies including multiple performance audits/operational assessments Unparalleled reputation for providing credible, reliable advice to public and private sector clients First-hand facility management experience working which offers unique industry-related insights Ohio University – Master of Science in Sports Administration University of Virginia – Bachelor of Arts
Amy Brown – Senior Analyst Over 25 years of industry experience including operating arenas in Spokane and Boston Involved with operations reviews, strategic planning studies, market/economic analyses Extensive experience in facility operations University of Massachusetts at Amherst - Master of Science in Sports Management Boston College - Bachelor of Arts
I. INTRODUCTION
Preliminary Draft – Subject to Revision Page 11
The Consulting TeamCrossroads Consulting Services, LLC
I. INTRODUCTION
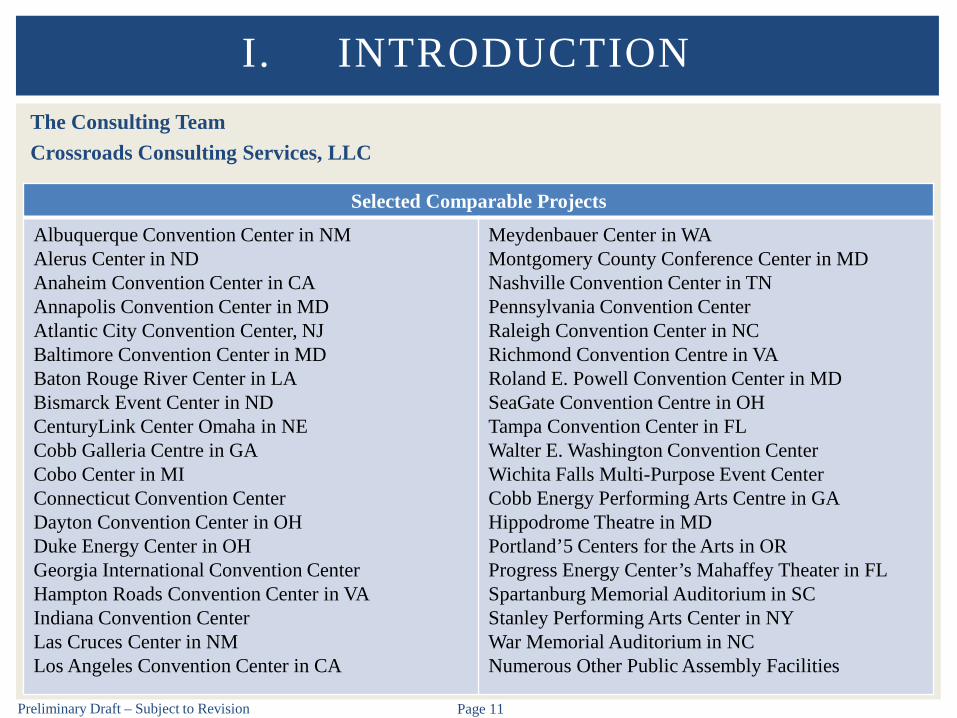
Selected Comparable Projects
Albuquerque Convention Center in NMAlerus Center in NDAnaheim Convention Center in CAAnnapolis Convention Center in MDAtlantic City Convention Center, NJBaltimore Convention Center in MDBaton Rouge River Center in LABismarck Event Center in NDCenturyLink Center Omaha in NECobb Galleria Centre in GACobo Center in MIConnecticut Convention CenterDayton Convention Center in OHDuke Energy Center in OHGeorgia International Convention Center Hampton Roads Convention Center in VAIndiana Convention CenterLas Cruces Center in NMLos Angeles Convention Center in CA
Meydenbauer Center in WAMontgomery County Conference Center in MDNashville Convention Center in TNPennsylvania Convention CenterRaleigh Convention Center in NCRichmond Convention Centre in VARoland E. Powell Convention Center in MD SeaGate Convention Centre in OHTampa Convention Center in FLWalter E. Washington Convention CenterWichita Falls Multi-Purpose Event CenterCobb Energy Performing Arts Centre in GAHippodrome Theatre in MDPortland’5 Centers for the Arts in ORProgress Energy Center’s Mahaffey Theater in FLSpartanburg Memorial Auditorium in SCStanley Performing Arts Center in NYWar Memorial Auditorium in NCNumerous Other Public Assembly Facilities

II. WCD OVERVIEW
Preliminary Draft – Subject to Revision Page 13
Background
In 1974, the Milwaukee Exposition & Convention Center Authority (MECCA) was formed to operatethe existing Milwaukee Auditorium (opened 1909) and Milwaukee Arena (opened 1950), and a newconvention center. MECCA and its assets were owned and operated by the City of Milwaukee.
In 1994, the Wisconsin State Legislature enacted enabling legislation authorizing municipalities tocreate special purpose districts for purposes of acquiring, constructing, and operating expositioncenters and exposition center facilities. The City of Milwaukee voted to create such a district, theWCD, and the City transferred all MECCA assets to WCD. The WCD is the owner and operator ofthe Wisconsin Center, UW-Milwaukee Panther Arena, and Milwaukee Theatre.
In 2015, the Wisconsin State Legislature enacted legislation known as Act 60 that expanded theWCD’s powers to include acquiring, constructing, and equipping a sports and entertainment arena.Act 60 also established a framework for financing a new sports and entertainment arena and modifiedthe composition of the WCD Board of Directors. The WCD is overseeing construction of the newMilwaukee Bucks arena and demolition of the BMO Harris Bank Bradley Center.
II. WCD OVERVIEW

Preliminary Draft – Subject to Revision Page 14
Funding
The WCD does not receive property tax money or Federal, State, or local subsidy. Its operations arefunded by operating revenues.
Special sales taxes on hotel rooms, prepared food and drinks sold in restaurants and taverns, and carrentals repay a $185 million bond issue that funded the Wisconsin Center project, capital projects,VISIT Milwaukee, and certain unrestricted funds are utilized for WCD operations
WCD collects 2.5% on rooms, 3.0% on car rentals, and 0.5% on food and beverage sales in additionto a 7.0% hotel room tax formerly collected by the City of Milwaukee.
In January 2011, the county-wide hotel room tax of 2.0% increased to 2.5% at the request of hoteliersto provide additional funding for VISIT Milwaukee.
II. WCD OVERVIEW
Preliminary Draft – Subject to Revision Page 15
Governance
The WCD is governed by an unpaid, 17-member Board of Directors. The Act 60 legislation willmodify the composition of the Board after the construction of the new arena facilities is completed,however, the number of members will remain consistent at 17.
Current Board Composition: Two members appointed by the Mayor Three members appointed by the President of the Common Council Three members appointed by the County Executive City Comptroller Secretary of the Department of Administration Three members appointed by the Governor Assembly Speaker, Senate Majority Leader, Assembly Minority Speaker, Senate Minority Leader
Future Board Composition (Post-Arena Construction): Two members appointed by the Mayor Three members appointed by the President of the Common Council Five members appointed by the County Executive County Comptroller City Comptroller Secretary of the Department of Administration or Designee Assembly Speaker, Senate Majority Leader, Assembly Minority Speaker, Senate Minority Leader
II. WCD OVERVIEW
Preliminary Draft – Subject to Revision Page 16
Staffing
An analysis of comparable facilities in the U.S. indicates that the permanent full-time staffing plansvary based on several factors Management philosophy of maintaining event-related personnel as full-time or part-time staff Whether the facility is stand-alone or part of a complex Union labor atmosphere Extent of contract services vs. providing services in-house for areas such as concessions,
janitorial cleaning, and security
WCD utilizes staff at all three of its facilities 68 full-time employees (includes recently added staff resulting from additions of Admirals) Approximately 220 part-time employees, excluding third party contract employees Business development and social media functions are handled by part-time staff
II. WCD OVERVIEW

Preliminary Draft – Subject to Revision Page 17
II. WCD OVERVIEWStaffing
Note: Does not include contract vendors
President/CEO (1)
Administration
Accounting & Human Resources (4)
Executive Assistant (1)
Information Technology (5)
Building Operations
Building Services (16)
Public Safety & Special Services (8)
Event Services
Event Services (8)
Setup & Cleaning (16)
Marketing & Sales
Assistants (2)
Box Office (3)
Sales (4)
Preliminary Draft – Subject to Revision Page 18
Booking/Marketing
Booking
The WCD contracts with VISIT Milwaukee to serve as the non-exclusive principal booking agent for theWisconsin Center
VISIT Milwaukee is given booking priority on all dates more than 18 months in the future
VISIT Milwaukee receives an amount equal to ½% of Milwaukee County hotel tax (net of fees)
Marketing
The Wisconsin Center does not have a formal marketing plan
The District recently added a part-time Business Development position and a Director of Communications& Public Affairs
The WCD is a member of Venue Coalition, an organization that helps venues secure event content for theirfacilities either through renting the facility, co-promoting with other promoters, or self-promoting
The goal of this membership is to increase programming for UW-Milwaukee Panther Arena and theMilwaukee Theatre
II. WCD OVERVIEW

A. WISCONSIN CENTER
Preliminary Draft – Subject to Revision Page 20
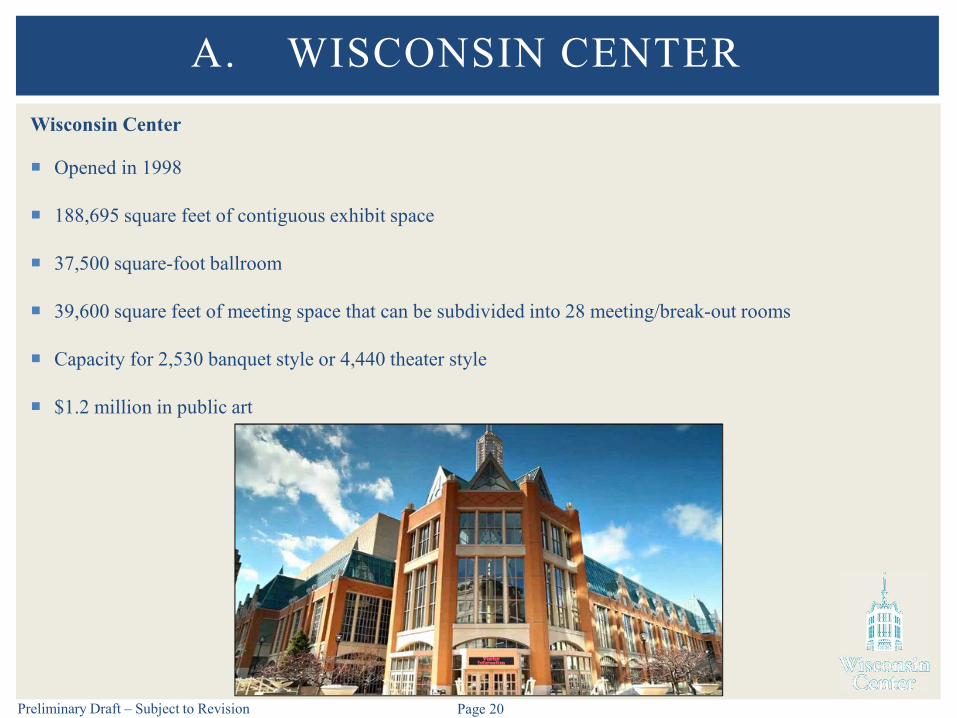
Wisconsin Center
Opened in 1998
188,695 square feet of contiguous exhibit space
37,500 square-foot ballroom
39,600 square feet of meeting space that can be subdivided into 28 meeting/break-out rooms
Capacity for 2,530 banquet style or 4,440 theater style
$1.2 million in public art
A. WISCONSIN CENTER

Preliminary Draft – Subject to Revision Page 21
Wisconsin Center
Street Level
Main Lobby
Ballroom Divisible into four rooms Total of 37,500 SF
Meeting Rooms
101 Divisible into four rooms Total of 5,200 SF
102 Divisible into five rooms Total of 8,300 SF
103 Divisible into five rooms Total of 6,300 SF
A. WISCONSIN CENTER

Preliminary Draft – Subject to Revision Page 22
Wisconsin Center
Mezzanine Level
Administration Offices
Meeting Rooms
201 Divisible into four rooms Total of 5,200 SF
202 Divisible into five rooms Total of 8,300 SF
203 Divisible into five rooms Total of 6,300 SF
A. WISCONSIN CENTER

Preliminary Draft – Subject to Revision Page 23
Wisconsin Center
Upper Level
Exhibit Hall
Divisible into four parts Hall A – 63,060 SF Hall B – 31,005 SF Hall C – 31,115 SF Hall D – 63, 515 SF
Total of 188,695 SF
A. WISCONSIN CENTER
Preliminary Draft – Subject to Revision Page 24
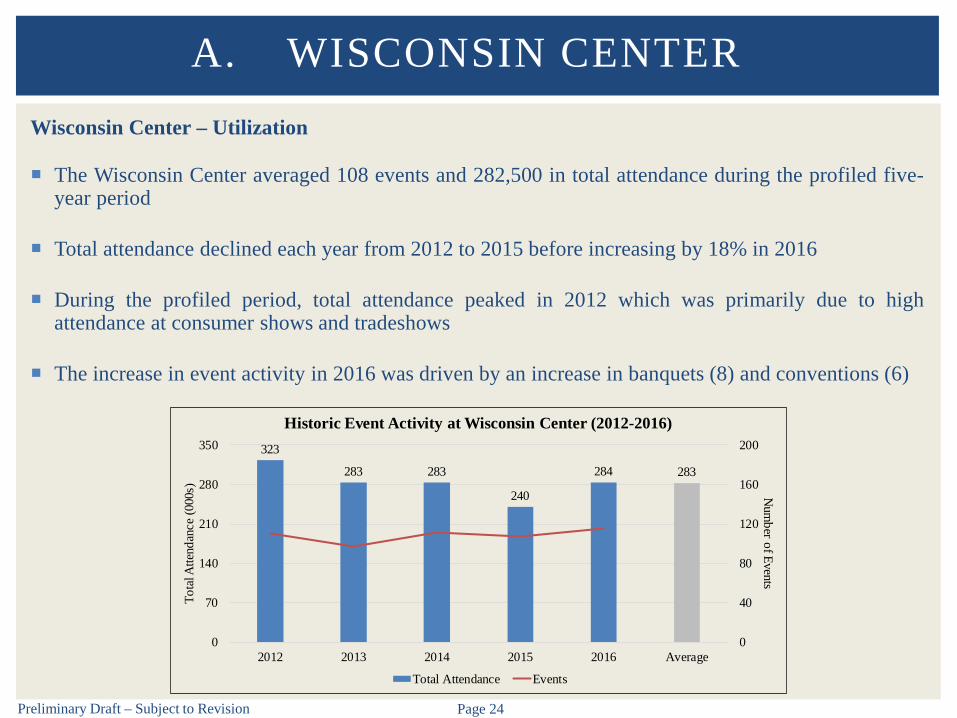
Wisconsin Center – Utilization
The Wisconsin Center averaged 108 events and 282,500 in total attendance during the profiled five-year period
Total attendance declined each year from 2012 to 2015 before increasing by 18% in 2016
During the profiled period, total attendance peaked in 2012 which was primarily due to highattendance at consumer shows and tradeshows
The increase in event activity in 2016 was driven by an increase in banquets (8) and conventions (6)
A. WISCONSIN CENTER
323
283 283
240
284 283
0
40
80
120
160
200
0
70
140
210
280
350
2012 2013 2014 2015 2016 Average
Num
ber of EventsTo
tal A
ttend
ance
(000
s)
Historic Event Activity at Wisconsin Center (2012-2016)
Total Attendance Events

Preliminary Draft – Subject to Revision Page 25
Wisconsin Center – Utilization
During the profiled five-year period, the Wisconsin Center hosted an average of 26 conventions/tradeshows which accounted for 84 event days and approximately 67,100 in total attendance
From 2012 to 2016, conventions/tradeshows averaged 24% of total attendance at the WisconsinCenter
In 2015, the Wisconsin Center hosted 17 convention/tradeshows, which was the lowest number duringthe profiled period
In 2016, the number of conventions/tradeshows increased to 23
Meetings/conferences/seminars accounted for the highest percentage of events (40%) and event days(35%) during the profiled period
Consumer/public shows averaged 41% of total attendance from 2012 to 2016
During the profiled period, conventions/tradeshows averaged 3.3 event days and consumer/publicshows averaged 4.5 event days
A. WISCONSIN CENTER

Preliminary Draft – Subject to Revision Page 26
Wisconsin Center – Utilization
A. WISCONSIN CENTER
Events 2012 2013 2014 2015 2016 Five-Year AverageConvention/Tradeshows 28 26 35 17 23 26Consumer/Public Shows 9 8 7 6 5 7Meetings/Conferences/Seminars 47 39 29 53 48 43Banquets/Receptions 15 12 20 15 23 17Sporting Events 7 7 8 10 8 8Other 4 5 12 6 8 7Total 110 97 111 107 115 108
Event Days 2012 2013 2014 2015 2016 Five-Year AverageConvention/Tradeshows 75 93 111 50 91 84Consumer/Public Shows 41 39 28 25 25 32Meetings/Conferences/Seminars 95 86 61 115 85 88Banquets/Receptions 16 14 21 15 25 18Sporting Events 16 15 17 21 18 17Other 4 27 16 12 8 13Total 247 274 254 238 252 253
Total Attendance 2012 2013 2014 2015 2016 Five-Year AverageConvention/Tradeshows 85,200 63,200 75,500 50,600 61,100 67,100Consumer/Public Shows 142,700 130,200 119,200 84,600 103,100 116,000Meetings/Conferences/Seminars 39,300 31,100 18,000 32,900 40,200 32,300Banquets/Receptions 16,400 15,700 22,700 18,700 25,400 19,800Sporting Events 24,100 31,300 22,200 39,100 35,100 30,400Other 15,000 11,800 25,500 14,100 18,600 17,000Total 322,700 283,300 283,100 240,000 283,500 282,500
Average Attendance Per Event 2012 2013 2014 2015 2016 Five-Year AverageConvention/Tradeshows 3,000 2,400 2,200 3,000 2,700 2,700Consumer/Public Shows 15,900 16,300 17,000 14,100 20,600 16,800Meetings/Conferences/Seminars 800 800 600 600 800 700Banquets/Receptions 1,100 1,300 1,100 1,200 1,100 1,200Sporting Events 3,400 4,500 2,800 3,900 4,400 3,800Other 3,800 2,400 2,100 2,400 2,300 2,600Source: WCD.
Summary of Historical Event Activity at the Wisconsin Center
Preliminary Draft – Subject to Revision Page 27
Wisconsin Center – Bookings vs. Rebookings
From 2012 to 2016, the Wisconsin Center rebooked between 53 and 55 events each year, whichresulted in an average rebooking rate of 50%
From 2012 to 2016, rebooked events accounted for an average of 72% of total attendance, with a highof 82% in 2015
The percentage of room nights (43%) and economic impact (39%) resulting from rebooked businessis lower than for events and attendance
During the profiled period, banquets, meetings and consumer shows accounted for 35% to 45% ofrebooked events and 45% to 60% of rebooked attendance
However, these events accounted for a relatively minimal number of room nights and economicimpact
The majority of room nights and economic impact are associated with conferences, conventions,sporting events and tradeshows
A. WISCONSIN CENTER
Preliminary Draft – Subject to Revision Page 28
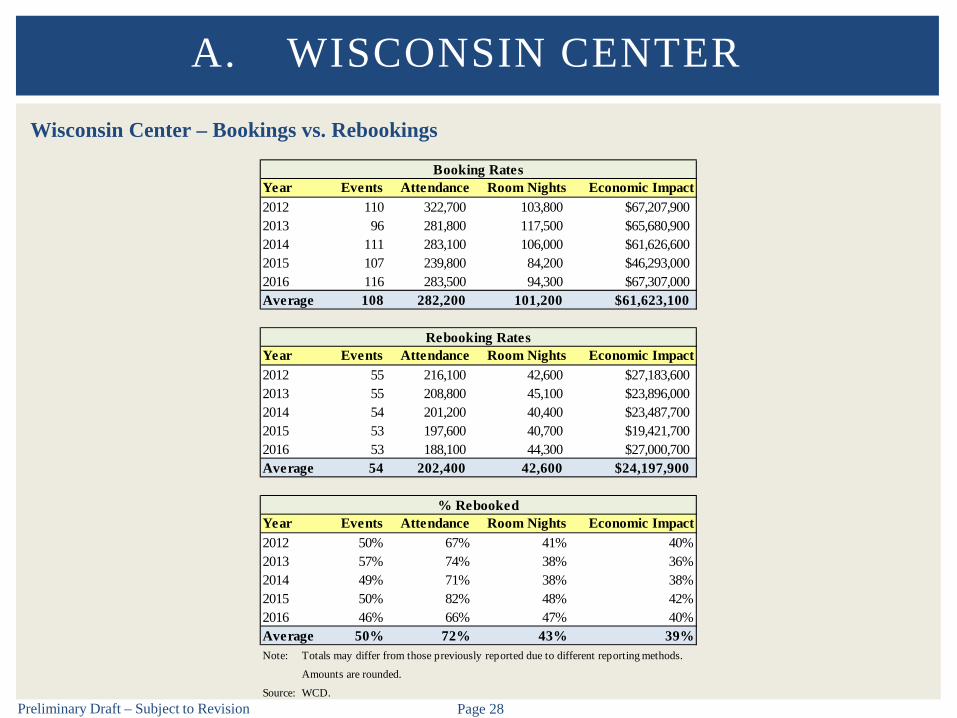
Wisconsin Center – Bookings vs. Rebookings
A. WISCONSIN CENTER
Year Events Attendance Room Nights Economic Impact2012 110 322,700 103,800 $67,207,9002013 96 281,800 117,500 $65,680,9002014 111 283,100 106,000 $61,626,6002015 107 239,800 84,200 $46,293,0002016 116 283,500 94,300 $67,307,000Average 108 282,200 101,200 $61,623,100
Year Events Attendance Room Nights Economic Impact2012 55 216,100 42,600 $27,183,6002013 55 208,800 45,100 $23,896,0002014 54 201,200 40,400 $23,487,7002015 53 197,600 40,700 $19,421,7002016 53 188,100 44,300 $27,000,700Average 54 202,400 42,600 $24,197,900
Year Events Attendance Room Nights Economic Impact2012 50% 67% 41% 40%2013 57% 74% 38% 36%2014 49% 71% 38% 38%2015 50% 82% 48% 42%2016 46% 66% 47% 40%Average 50% 72% 43% 39%Note: Totals may differ from those previously reported due to different reporting methods.
Amounts are rounded.
Source: WCD.
Booking Rates
Rebooking Rates
% Rebooked
Preliminary Draft – Subject to Revision Page 29
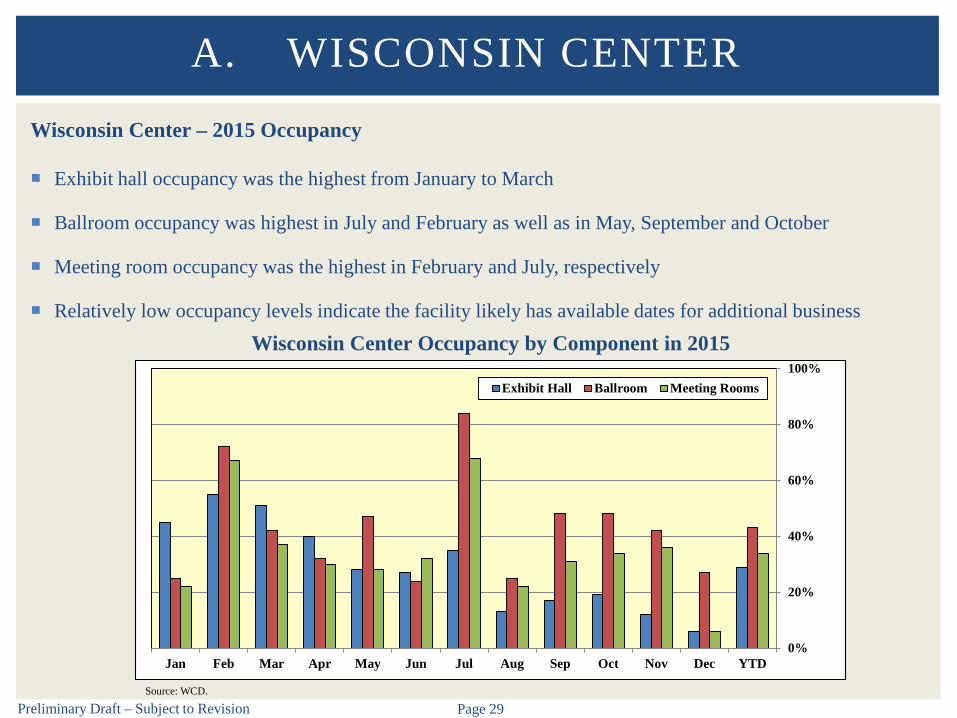
Wisconsin Center – 2015 Occupancy
Exhibit hall occupancy was the highest from January to March
Ballroom occupancy was highest in July and February as well as in May, September and October
Meeting room occupancy was the highest in February and July, respectively
Relatively low occupancy levels indicate the facility likely has available dates for additional business
A. WISCONSIN CENTER
Jan Feb Mar Apr May Jun Jul Aug Sep Oct Nov Dec YTD0%
20%
40%
60%
80%
100%Exhibit Hall Ballroom Meeting Rooms
Source: WCD.
Wisconsin Center Occupancy by Component in 2015
Preliminary Draft – Subject to Revision Page 30
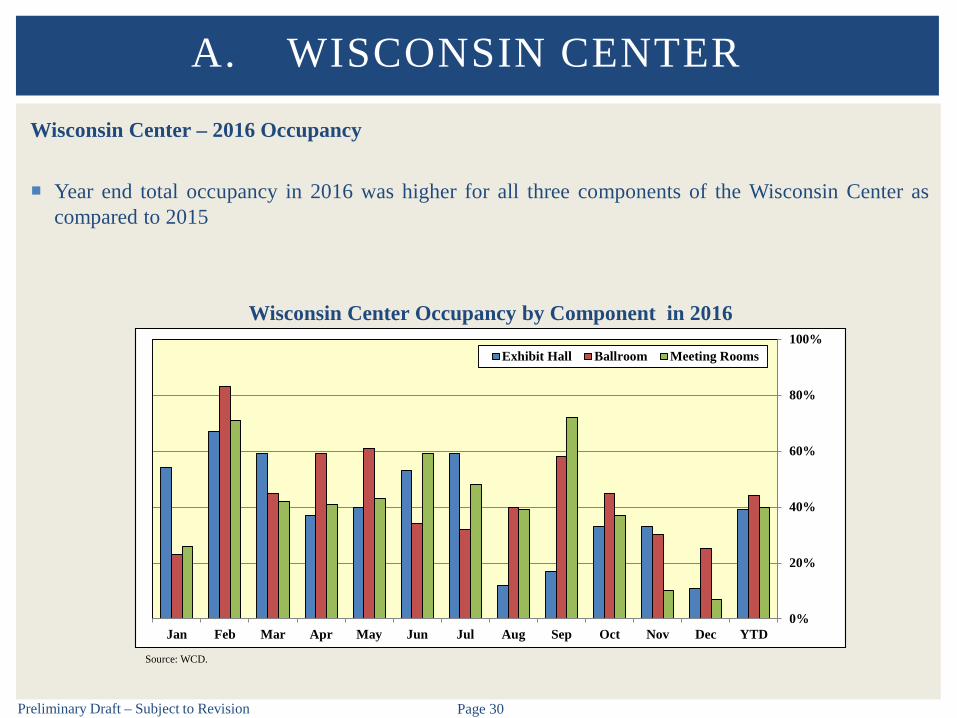
Wisconsin Center – 2016 Occupancy
Year end total occupancy in 2016 was higher for all three components of the Wisconsin Center ascompared to 2015
A. WISCONSIN CENTER
Jan Feb Mar Apr May Jun Jul Aug Sep Oct Nov Dec YTD0%
20%
40%
60%
80%
100%Exhibit Hall Ballroom Meeting Rooms
Source: WCD.
Wisconsin Center Occupancy by Component in 2016
Preliminary Draft – Subject to Revision Page 31
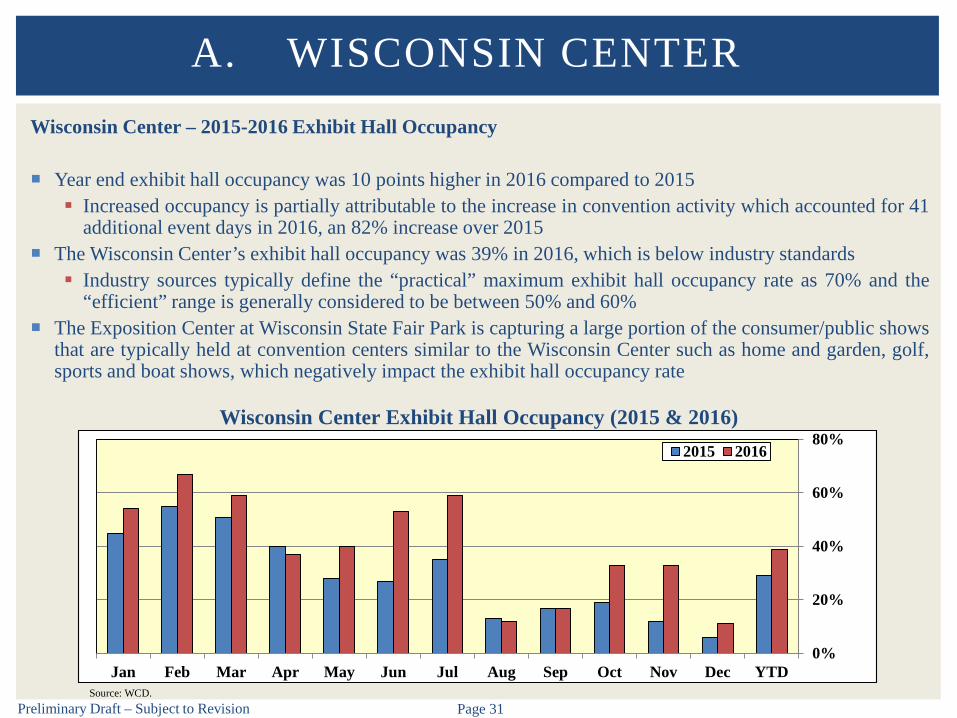
Wisconsin Center – 2015-2016 Exhibit Hall Occupancy
Year end exhibit hall occupancy was 10 points higher in 2016 compared to 2015 Increased occupancy is partially attributable to the increase in convention activity which accounted for 41
additional event days in 2016, an 82% increase over 2015 The Wisconsin Center’s exhibit hall occupancy was 39% in 2016, which is below industry standards Industry sources typically define the “practical” maximum exhibit hall occupancy rate as 70% and the
“efficient” range is generally considered to be between 50% and 60% The Exposition Center at Wisconsin State Fair Park is capturing a large portion of the consumer/public shows
that are typically held at convention centers similar to the Wisconsin Center such as home and garden, golf,sports and boat shows, which negatively impact the exhibit hall occupancy rate
A. WISCONSIN CENTER
Source: WCD.
Wisconsin Center Exhibit Hall Occupancy (2015 & 2016)
Jan Feb Mar Apr May Jun Jul Aug Sep Oct Nov Dec YTD0%
20%
40%
60%
80%2015 2016
Preliminary Draft – Subject to Revision Page 32
WCD vs. VISIT Milwaukee Bookings
The following table shows the distribution of total license agreement fee and food and beveragerevenue as well as the number of events booked by both the WCD and VISIT Milwaukee from 2012to 2016 at the Wisconsin Center
On average, WCD bookings accounted for 78% of events from 2012 to 2016 and 63% of revenuesgenerated from license agreement fees and food and beverage
The average revenue per event booked by VISIT Milwaukee ($111,800) was more than twice that ofevents booked by WCD ($52,400)
A. WISCONSIN CENTER

Preliminary Draft – Subject to Revision Page 33
WCD vs. VISIT Milwaukee Bookings
A. WISCONSIN CENTER
Year
Total License Agreement Fee
Revenue
Total Food & Beverage Revenue
Grand Total Revenue
Percentage of Grand Total
RevenueTotal Number
of EventsPercentage of
Events
2012 $1,611,775 $3,812,263 $5,424,038 71% 87 79%2013 $1,363,415 $2,799,561 $4,162,976 63% 68 71%2014 $1,396,381 $2,771,140 $4,167,521 54% 88 79%2015 $1,401,609 $2,666,298 $4,067,907 68% 86 80%2016 $1,444,014 $2,748,311 $4,192,325 58% 91 79%
2012 $654,565 $1,566,920 $2,221,485 29% 23 21%2013 $873,966 $1,589,298 $2,463,264 37% 28 29%2014 $957,917 $2,625,573 $3,583,490 46% 23 21%2015 $555,620 $1,387,784 $1,943,404 32% 21 20%2016 $897,920 $2,194,953 $3,092,873 42% 24 21%
2012 $2,266,340 $5,379,183 $7,645,523 100% 110 100%2013 $2,237,381 $4,388,859 $6,626,240 100% 96 100%2014 $2,354,298 $5,396,713 $7,751,011 100% 111 100%2015 $1,957,229 $4,054,082 $6,011,311 100% 107 100%2016 $2,341,934 $4,943,264 $7,285,198 100% 115 100%
Source: WCD.
Total
Wisconsin Center District
VISIT Milwaukee
Summary of Revenue Allocation for the Wisconsin Center (2012-2016)

Preliminary Draft – Subject to Revision Page 34
Wisconsin Center – Events & Room Nights
The adjacent table illustrates estimated definite roomnights booked by VISIT Milwaukee at the WisconsinCenter from 2017 to 2023
There are a total of 130 definite events bookedthrough 2023 according to VISIT Milwaukee
Approximately 351,000 definite room nights areassociated with these events
A. WISCONSIN CENTER
YearDefinite Events
Definite Room Nights
2017 48 87,8002018 29 60,3002019 25 73,2002020 12 56,0002021 8 31,3002022 5 23,3002023 3 19,100Total 130 351,000Notes: Data represents room nights generated by
Convention Sales Department as of 12/31
Amounts are rounded.
Sources: The Tap Report & VISIT Milwaukee.
VISIT Milwaukee Definite Bookings Related to Convention Center Business
Preliminary Draft – Subject to Revision Page 35
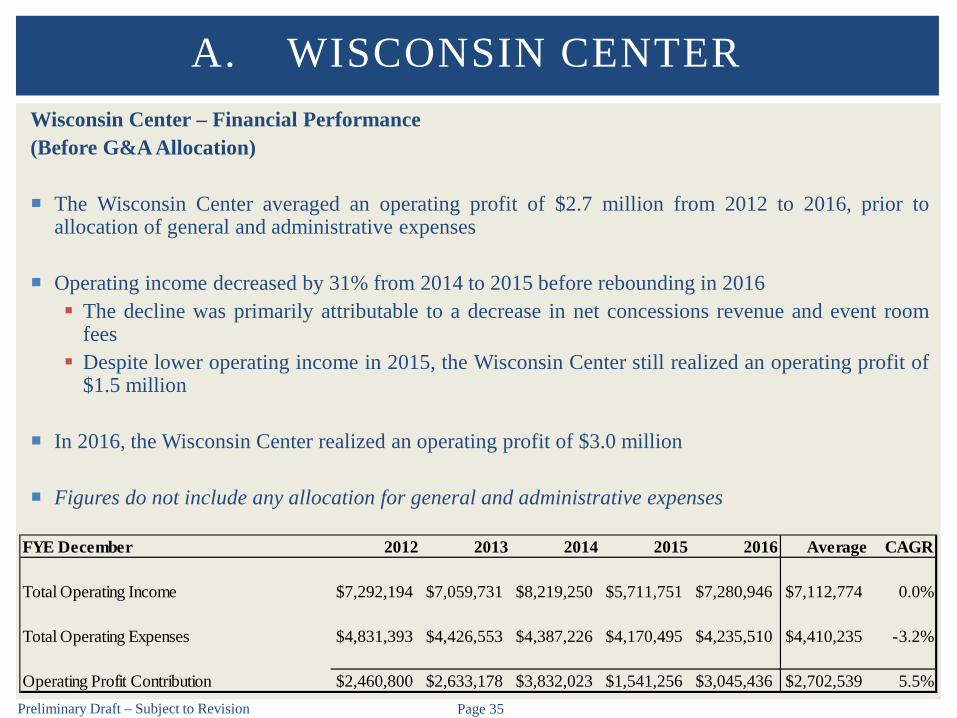
Wisconsin Center – Financial Performance(Before G&A Allocation)
The Wisconsin Center averaged an operating profit of $2.7 million from 2012 to 2016, prior toallocation of general and administrative expenses
Operating income decreased by 31% from 2014 to 2015 before rebounding in 2016 The decline was primarily attributable to a decrease in net concessions revenue and event room
fees Despite lower operating income in 2015, the Wisconsin Center still realized an operating profit of
$1.5 million
In 2016, the Wisconsin Center realized an operating profit of $3.0 million
Figures do not include any allocation for general and administrative expenses
A. WISCONSIN CENTER
FYE December 2012 2013 2014 2015 2016 Average CAGR
Total Operating Income $7,292,194 $7,059,731 $8,219,250 $5,711,751 $7,280,946 $7,112,774 0.0%
Total Operating Expenses $4,831,393 $4,426,553 $4,387,226 $4,170,495 $4,235,510 $4,410,235 -3.2%
Operating Profit Contribution $2,460,800 $2,633,178 $3,832,023 $1,541,256 $3,045,436 $2,702,539 5.5%
Preliminary Draft – Subject to Revision Page 36
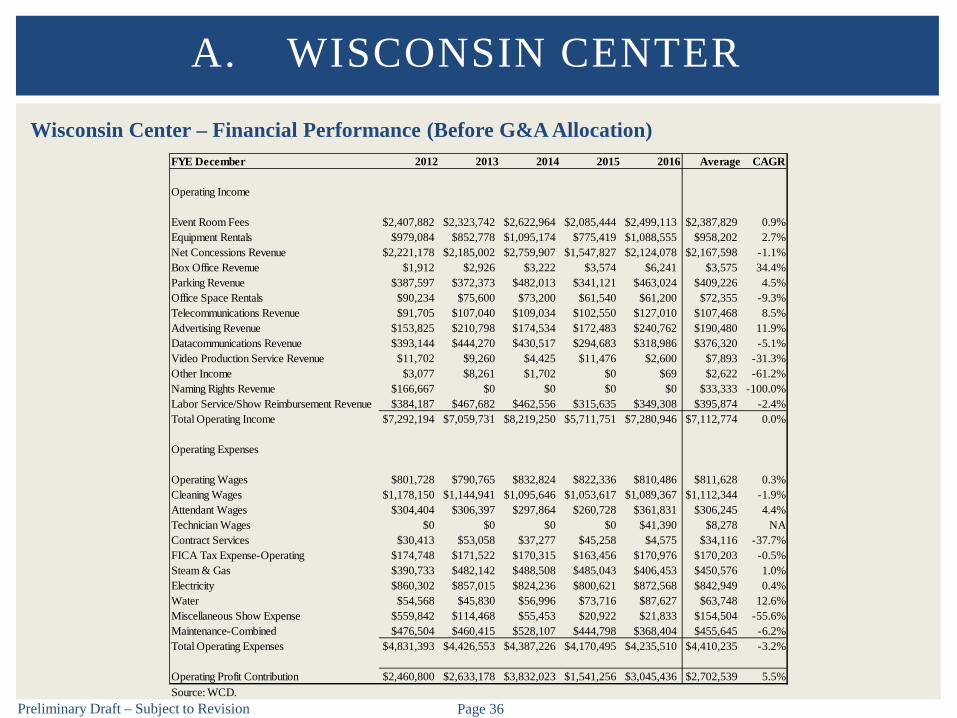
Wisconsin Center – Financial Performance (Before G&A Allocation)
A. WISCONSIN CENTER
FYE December 2012 2013 2014 2015 2016 Average CAGR
Operating Income
Event Room Fees $2,407,882 $2,323,742 $2,622,964 $2,085,444 $2,499,113 $2,387,829 0.9%Equipment Rentals $979,084 $852,778 $1,095,174 $775,419 $1,088,555 $958,202 2.7%Net Concessions Revenue $2,221,178 $2,185,002 $2,759,907 $1,547,827 $2,124,078 $2,167,598 -1.1%Box Office Revenue $1,912 $2,926 $3,222 $3,574 $6,241 $3,575 34.4%Parking Revenue $387,597 $372,373 $482,013 $341,121 $463,024 $409,226 4.5%Office Space Rentals $90,234 $75,600 $73,200 $61,540 $61,200 $72,355 -9.3%Telecommunications Revenue $91,705 $107,040 $109,034 $102,550 $127,010 $107,468 8.5%Advertising Revenue $153,825 $210,798 $174,534 $172,483 $240,762 $190,480 11.9%Datacommunications Revenue $393,144 $444,270 $430,517 $294,683 $318,986 $376,320 -5.1%Video Production Service Revenue $11,702 $9,260 $4,425 $11,476 $2,600 $7,893 -31.3%Other Income $3,077 $8,261 $1,702 $0 $69 $2,622 -61.2%Naming Rights Revenue $166,667 $0 $0 $0 $0 $33,333 -100.0%Labor Service/Show Reimbursement Revenue $384,187 $467,682 $462,556 $315,635 $349,308 $395,874 -2.4%Total Operating Income $7,292,194 $7,059,731 $8,219,250 $5,711,751 $7,280,946 $7,112,774 0.0%
Operating Expenses
Operating Wages $801,728 $790,765 $832,824 $822,336 $810,486 $811,628 0.3%Cleaning Wages $1,178,150 $1,144,941 $1,095,646 $1,053,617 $1,089,367 $1,112,344 -1.9%Attendant Wages $304,404 $306,397 $297,864 $260,728 $361,831 $306,245 4.4%Technician Wages $0 $0 $0 $0 $41,390 $8,278 NAContract Services $30,413 $53,058 $37,277 $45,258 $4,575 $34,116 -37.7%FICA Tax Expense-Operating $174,748 $171,522 $170,315 $163,456 $170,976 $170,203 -0.5%Steam & Gas $390,733 $482,142 $488,508 $485,043 $406,453 $450,576 1.0%Electricity $860,302 $857,015 $824,236 $800,621 $872,568 $842,949 0.4%Water $54,568 $45,830 $56,996 $73,716 $87,627 $63,748 12.6%Miscellaneous Show Expense $559,842 $114,468 $55,453 $20,922 $21,833 $154,504 -55.6%Maintenance-Combined $476,504 $460,415 $528,107 $444,798 $368,404 $455,645 -6.2%Total Operating Expenses $4,831,393 $4,426,553 $4,387,226 $4,170,495 $4,235,510 $4,410,235 -3.2%
Operating Profit Contribution $2,460,800 $2,633,178 $3,832,023 $1,541,256 $3,045,436 $2,702,539 5.5%Source: WCD.

Preliminary Draft – Subject to Revision Page 37
Wisconsin Center – Operating Revenue
Event room fee revenue increased significantly in 2014 and 2016 – five year average of $2.4 million
A. WISCONSIN CENTER
$2,408 $2,324
$2,623
$2,085
$2,499 $2,388
$0
$500
$1,000
$1,500
$2,000
$2,500
$3,000
2012 2013 2014 2015 2016 Average
Wisconsin CenterEvent Room Fees ($000s)
Preliminary Draft – Subject to Revision Page 38
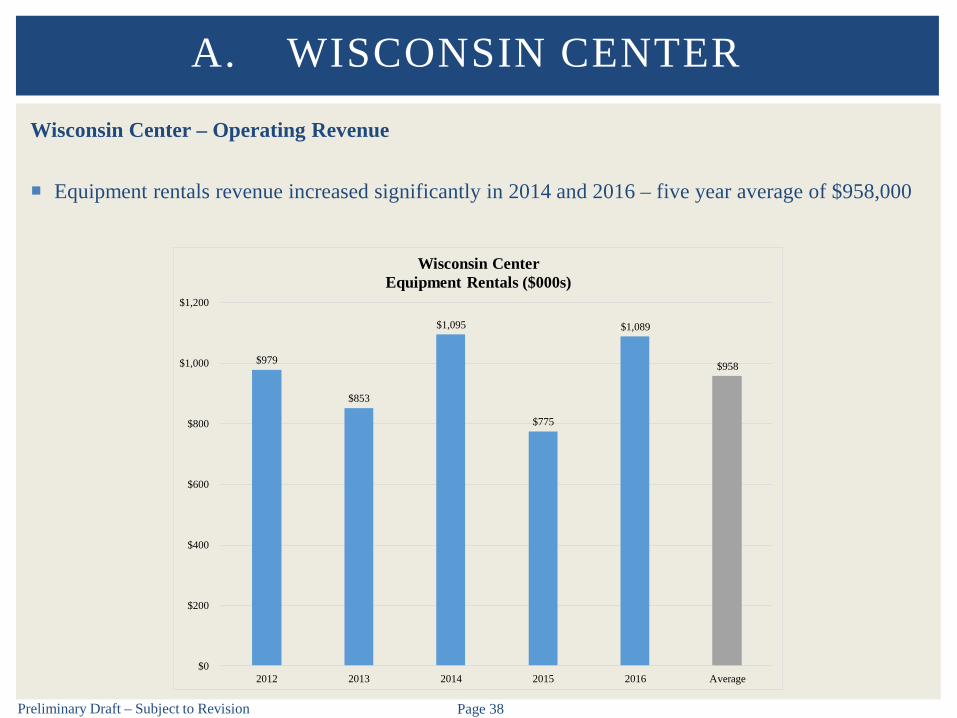
Wisconsin Center – Operating Revenue
Equipment rentals revenue increased significantly in 2014 and 2016 – five year average of $958,000
A. WISCONSIN CENTER
$979
$853
$1,095
$775
$1,089
$958
$0
$200
$400
$600
$800
$1,000
$1,200
2012 2013 2014 2015 2016 Average
Wisconsin CenterEquipment Rentals ($000s)

Preliminary Draft – Subject to Revision Page 39
Wisconsin Center – Operating Revenue
Net concessions revenue increased significantly in 2014 and 2016 – five year average of $2.2 million
A. WISCONSIN CENTER
$2,221 $2,185
$2,760
$1,548
$2,124 $2,168
$0
$500
$1,000
$1,500
$2,000
$2,500
$3,000
2012 2013 2014 2015 2016 Average
Wisconsin CenterNet Concessions Revenue ($000s)
Preliminary Draft – Subject to Revision Page 40
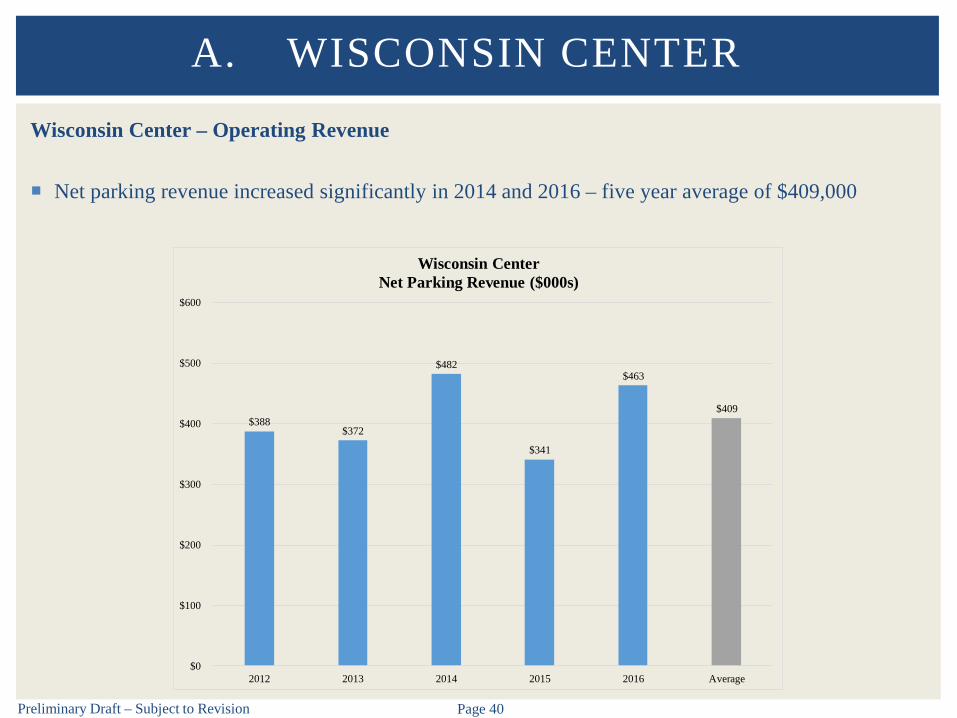
Wisconsin Center – Operating Revenue
Net parking revenue increased significantly in 2014 and 2016 – five year average of $409,000
A. WISCONSIN CENTER
$388 $372
$482
$341
$463
$409
$0
$100
$200
$300
$400
$500
$600
2012 2013 2014 2015 2016 Average
Wisconsin CenterNet Parking Revenue ($000s)
Preliminary Draft – Subject to Revision Page 41
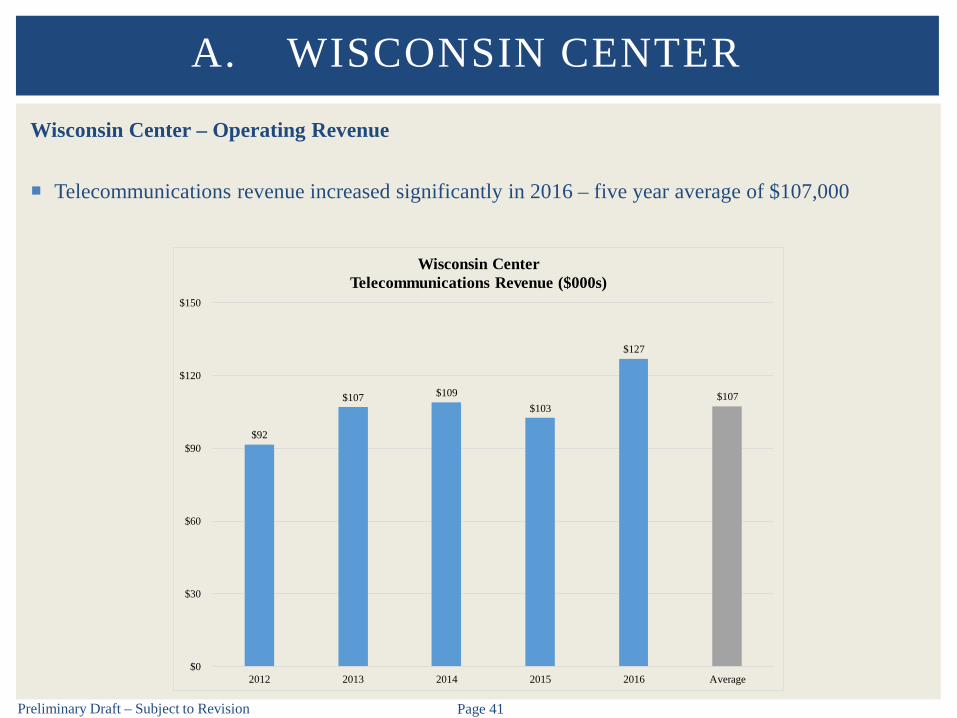
Wisconsin Center – Operating Revenue
Telecommunications revenue increased significantly in 2016 – five year average of $107,000
A. WISCONSIN CENTER
$92
$107 $109 $103
$127
$107
$0
$30
$60
$90
$120
$150
2012 2013 2014 2015 2016 Average
Wisconsin CenterTelecommunications Revenue ($000s)

Preliminary Draft – Subject to Revision Page 42
Wisconsin Center – Operating Revenue
Advertising revenue increased significantly in 2013 and 2016 – five year average of $190,000
A. WISCONSIN CENTER
$154
$211
$175 $172
$241
$190
$0
$50
$100
$150
$200
$250
$300
2012 2013 2014 2015 2016 Average
Wisconsin CenterAdvertising Revenue ($000s)

Preliminary Draft – Subject to Revision Page 43
Wisconsin Center – Operating Revenue
Datacommunications revenue has decreased in recent years – five year average of $376,000
A. WISCONSIN CENTER
$393
$444 $431
$295 $319
$376
$0
$100
$200
$300
$400
$500
2012 2013 2014 2015 2016 Average
Wisconsin CenterDatacommunications Revenue ($000s)
Preliminary Draft – Subject to Revision Page 44
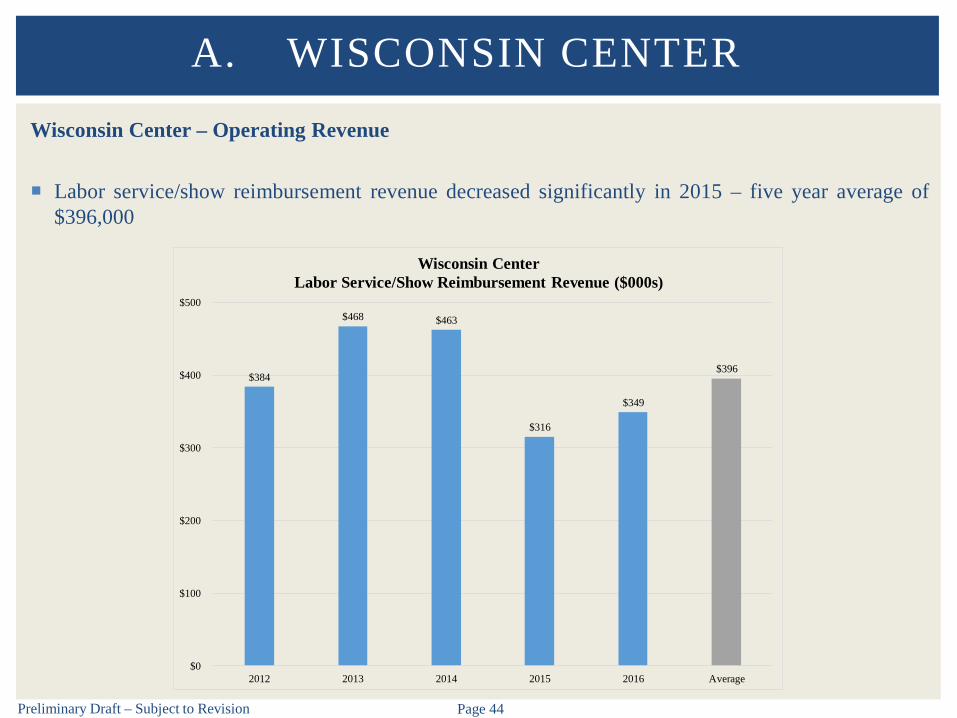
Wisconsin Center – Operating Revenue
Labor service/show reimbursement revenue decreased significantly in 2015 – five year average of$396,000
A. WISCONSIN CENTER
$384
$468 $463
$316
$349
$396
$0
$100
$200
$300
$400
$500
2012 2013 2014 2015 2016 Average
Wisconsin CenterLabor Service/Show Reimbursement Revenue ($000s)

Preliminary Draft – Subject to Revision Page 45
Wisconsin Center – Operating Revenue
Total operating income increased significantly in 2014 and 2016 – five year average of $7.1 million
A. WISCONSIN CENTER
$7,292 $7,060
$8,219
$5,712
$7,281 $7,113
$0
$2,000
$4,000
$6,000
$8,000
$10,000
2012 2013 2014 2015 2016 Average
Wisconsin CenterTotal Operating Income ($000s)
Preliminary Draft – Subject to Revision Page 46
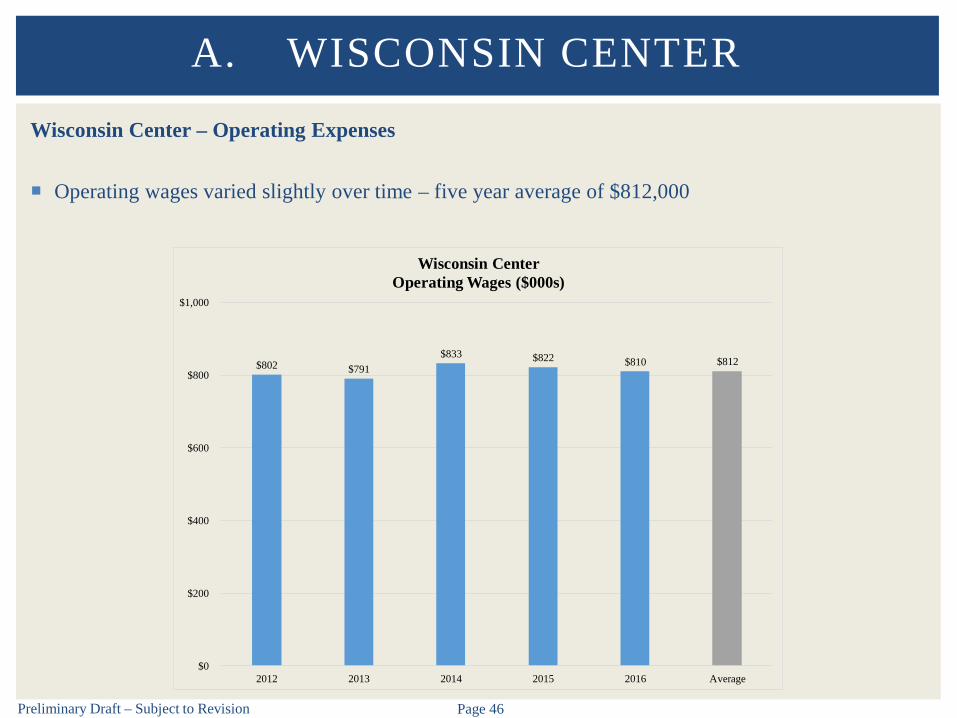
Wisconsin Center – Operating Expenses
Operating wages varied slightly over time – five year average of $812,000
A. WISCONSIN CENTER
$802 $791 $833 $822 $810 $812
$0
$200
$400
$600
$800
$1,000
2012 2013 2014 2015 2016 Average
Wisconsin CenterOperating Wages ($000s)

Preliminary Draft – Subject to Revision Page 47
Wisconsin Center – Operating Expenses
Cleaning wages have generally decreased slightly over time – five year average of $1.1 million
A. WISCONSIN CENTER
$1,178 $1,145
$1,096 $1,054
$1,089 $1,112
$0
$300
$600
$900
$1,200
$1,500
2012 2013 2014 2015 2016 Average
Wisconsin CenterCleaning Wages ($000s)

Preliminary Draft – Subject to Revision Page 48
Wisconsin Center – Operating Expenses
Attendant wages increased significantly in 2016 – five year average of $306,000
A. WISCONSIN CENTER
$304 $306 $298
$261
$362
$306
$0
$100
$200
$300
$400
2012 2013 2014 2015 2016 Average
Wisconsin CenterAttendant Wages ($000s)

Preliminary Draft – Subject to Revision Page 49
Wisconsin Center – Operating Expenses
FICA tax expense-operating has varied slightly over time – five year average of $170,000
A. WISCONSIN CENTER
$175 $172 $170 $163
$171 $170
$0
$40
$80
$120
$160
$200
2012 2013 2014 2015 2016 Average
Wisconsin CenterFICA Tax Expense-Operating ($000s)

Preliminary Draft – Subject to Revision Page 50
Wisconsin Center – Operating Expenses
Steam & gas expense has varied over time – five year average of $451,000
A. WISCONSIN CENTER
$391
$482 $489 $485
$406
$451
$0
$100
$200
$300
$400
$500
$600
2012 2013 2014 2015 2016 Average
Wisconsin CenterSteam & Gas ($000s)

Preliminary Draft – Subject to Revision Page 51
Wisconsin Center – Operating Expenses
Electricity expense has varied over time – five year average of $843,000
A. WISCONSIN CENTER
$860 $857 $824
$801
$873 $843
$0
$200
$400
$600
$800
$1,000
2012 2013 2014 2015 2016 Average
Wisconsin CenterElectricity ($000s)

Preliminary Draft – Subject to Revision Page 52
Wisconsin Center – Operating Expenses
Miscellaneous show expense decreased significantly after 2012 and is now nominal – five yearaverage of $155,000
A. WISCONSIN CENTER
$560
$114
$55
$21 $22
$155
$0
$100
$200
$300
$400
$500
$600
2012 2013 2014 2015 2016 Average
Wisconsin CenterMiscellaneous Show Expense ($000s)
Preliminary Draft – Subject to Revision Page 53
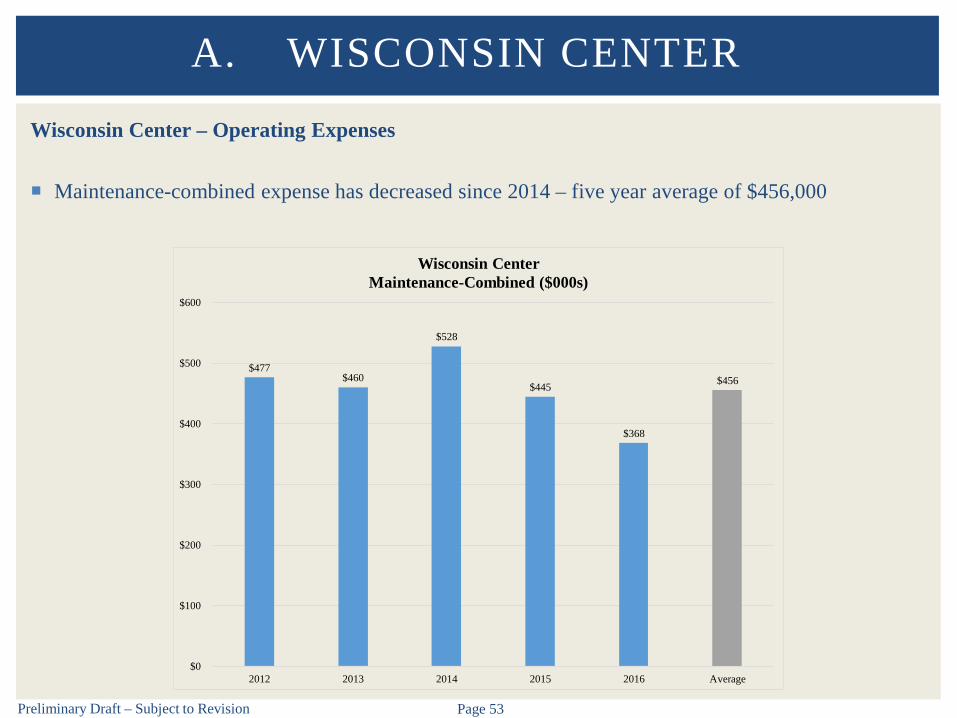
Wisconsin Center – Operating Expenses
Maintenance-combined expense has decreased since 2014 – five year average of $456,000
A. WISCONSIN CENTER
$477 $460
$528
$445
$368
$456
$0
$100
$200
$300
$400
$500
$600
2012 2013 2014 2015 2016 Average
Wisconsin CenterMaintenance-Combined ($000s)
Preliminary Draft – Subject to Revision Page 54
Wisconsin Center – Operating Expenses
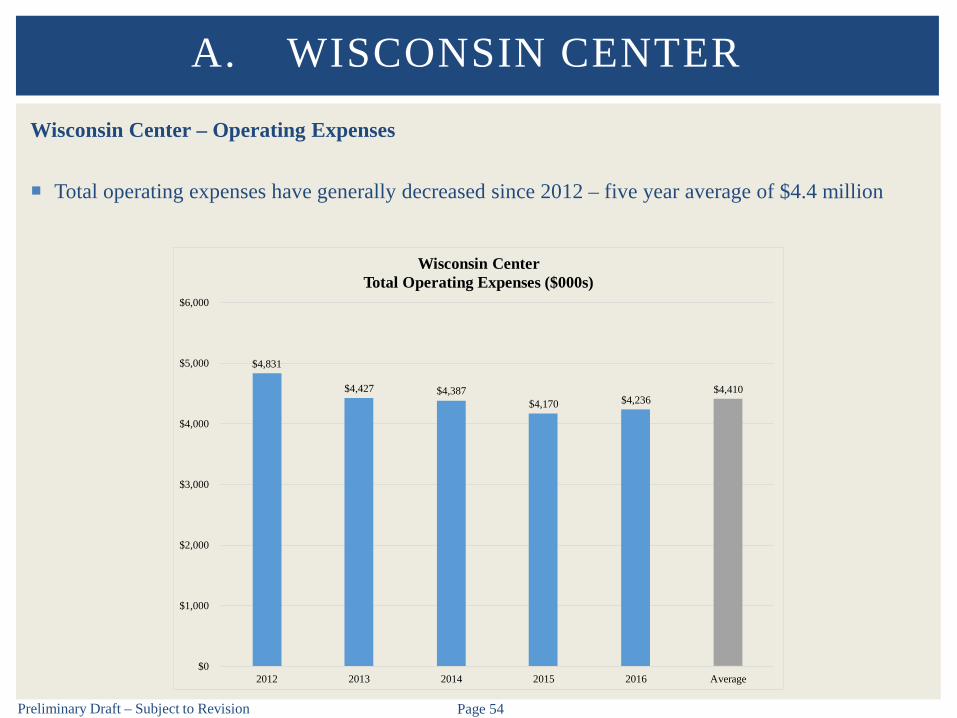
Total operating expenses have generally decreased since 2012 – five year average of $4.4 million
A. WISCONSIN CENTER
$4,831
$4,427 $4,387 $4,170 $4,236
$4,410
$0
$1,000
$2,000
$3,000
$4,000
$5,000
$6,000
2012 2013 2014 2015 2016 Average
Wisconsin CenterTotal Operating Expenses ($000s)

Preliminary Draft – Subject to Revision Page 55
Wisconsin Center – Operating Profit Contribution (Before G&A Allocation)
Operating profit contribution increased significantly in 2014 and 2016 – five year average of $2.7million
A. WISCONSIN CENTER
$2,461 $2,633
$3,832
$1,541
$3,045
$2,703
$0
$1,000
$2,000
$3,000
$4,000
2012 2013 2014 2015 2016 Average
Wisconsin CenterOperating Profit Contribution ($000s)
Preliminary Draft – Subject to Revision Page 56
Wisconsin Center – Event Feedback
The WCD conducts customer service surveys with meeting/event planners after their event at theWisconsin Center related to overall satisfaction and willingness to hold additional events at the WCD License agreements Facility set-up Cleanliness Physical environment Quality of service Levy Restaurants In-house audio visual services Individual staff members Other
Questions were either posed as Yes/No or on a Rating Scale as follows: A – Excellent B – Good C – Adequate
Results were analyzed for feedback received from 2014 to 2016 which included 43 event surveys
A. WISCONSIN CENTER
Preliminary Draft – Subject to Revision Page 57
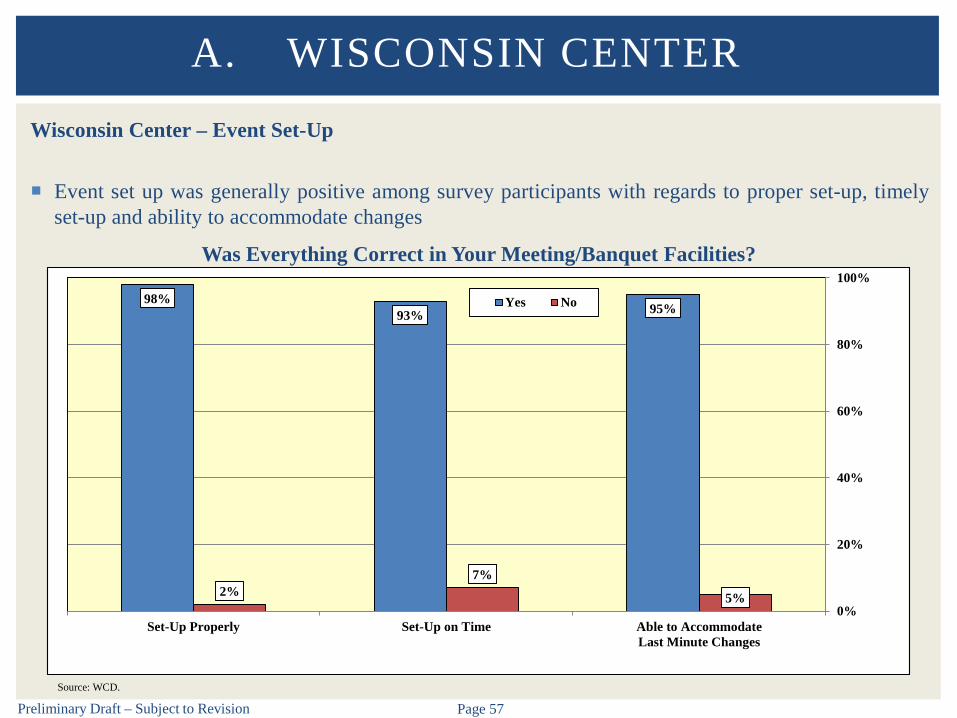
Wisconsin Center – Event Set-Up
Event set up was generally positive among survey participants with regards to proper set-up, timelyset-up and ability to accommodate changes
A. WISCONSIN CENTER
Was Everything Correct in Your Meeting/Banquet Facilities?
Source: WCD.
98%93% 95%
2%7%
5%
Set-Up Properly Set-Up on Time Able to AccommodateLast Minute Changes
0%
20%
40%
60%
80%
100%
Yes No

Preliminary Draft – Subject to Revision Page 58
Wisconsin Center – Cleanliness of Facilities
Cleanliness of facilities is an important factor for overall customer satisfaction
Survey respondents gave the best overall ratings to building exterior cleanliness
Restrooms received the highest number of “B” or “Good” ratings indicating an opportunity for futureimprovement
A. WISCONSIN CENTER
Cleanliness of Facilities
Source: WCD.
98% 97%89%
74%
2% 3%8%
23%
3% 2%
Building Exteriors Exhibit Areas Meeting Rooms Restrooms0%
20%
40%
60%
80%
100%A B C
Preliminary Draft – Subject to Revision Page 59
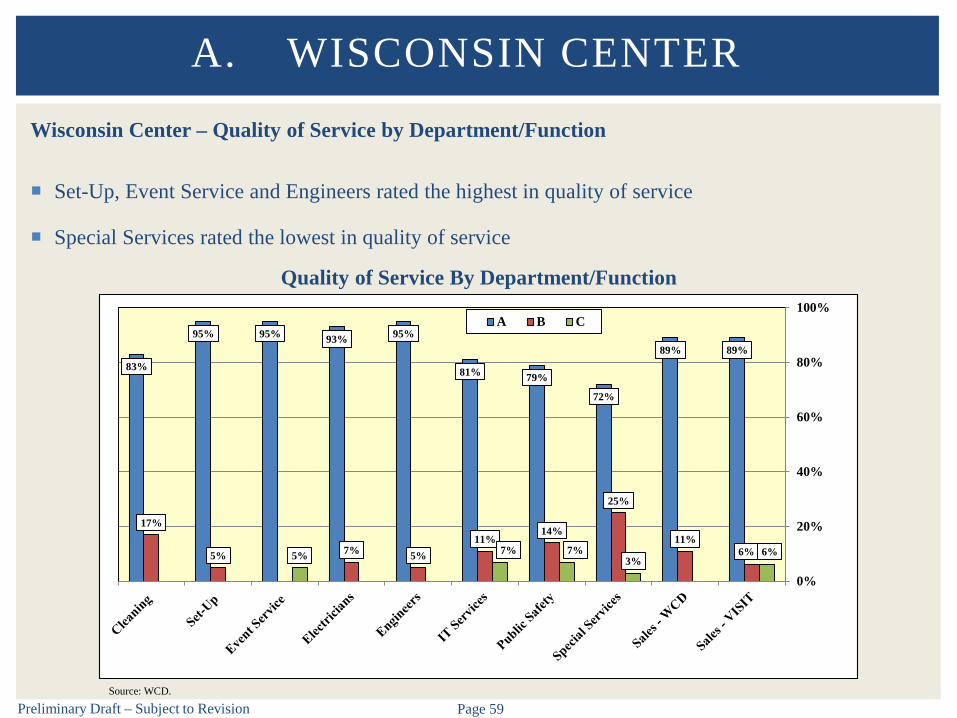
Wisconsin Center – Quality of Service by Department/Function
Set-Up, Event Service and Engineers rated the highest in quality of service
Special Services rated the lowest in quality of service
A. WISCONSIN CENTER
Quality of Service By Department/Function
Source: WCD.
83%
95% 95% 93% 95%
81% 79%
72%
89% 89%
17%
5% 7% 5%11%
14%
25%
11%6%5% 7% 7%
3%6%
0%
20%
40%
60%
80%
100%A B C

Preliminary Draft – Subject to Revision Page 60
Wisconsin Center – Levy Restaurants
74% of survey respondents utilized Levy Restaurants
80% of respondents rated the Sales Staff as Excellent
Concessions stands ranked the lowest which indicates an opportunity for improvement
A. WISCONSIN CENTER
Levy Restaurants
Source: WCD.
70%
80%
68%74%
55%
27%
13%
29%
19%
27%
3%7%
3% 6%
18%
F&B Portions F&B Sales Staff F&B Quality F&B Service Staff Concessions Stands0%
20%
40%
60%
80%
100%A B C
Preliminary Draft – Subject to Revision Page 61
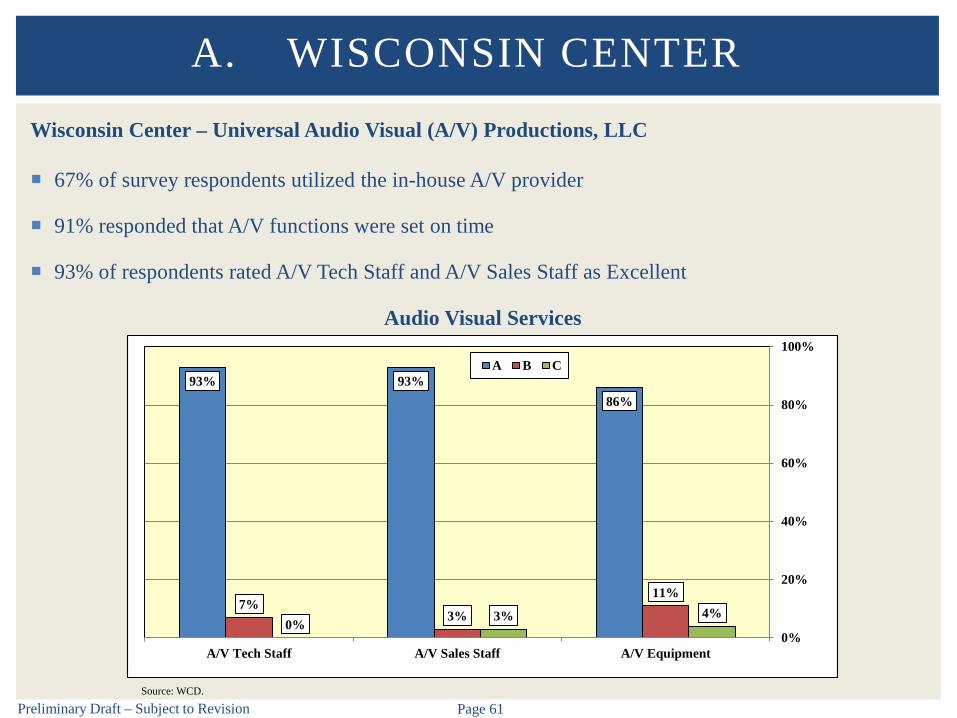
Wisconsin Center – Universal Audio Visual (A/V) Productions, LLC
67% of survey respondents utilized the in-house A/V provider
91% responded that A/V functions were set on time
93% of respondents rated A/V Tech Staff and A/V Sales Staff as Excellent
A. WISCONSIN CENTER
Audio Visual Services
Source: WCD.
93% 93%86%
7%3%
11%
0% 3% 4%
A/V Tech Staff A/V Sales Staff A/V Equipment0%
20%
40%
60%
80%
100%A B C

Preliminary Draft – Subject to Revision Page 62
Wisconsin Center – Overall Satisfaction
While survey respondents cited some problem areas, the overall rating of facilities and staff waspositive with 93% giving an “A” rating
Positive feedback included: Excellent venues Great service from the staff An overall positive experience with all aspects of the event
A. WISCONSIN CENTER
Overall Rating of Our Facilities and Staff
Source: WCD.
93%
7%
A B0%
20%
40%
60%
80%
100%

Preliminary Draft – Subject to Revision Page 63
Wisconsin Center – Return Business
Approximately 74% of respondents indicated that they would return to WCD facilities
Approximately two-thirds (67%) of respondents indicated that they plan to host another event at theWisconsin Center in the near future
The most common reason indicated for not returning was the event rotates between various cities
A. WISCONSIN CENTER
Will You Return to WCD Facilities?
Source: WCD.
67%74%
33%26%
Do you plan to hold another event here in thenear future
Will you return to our facilities0%
20%
40%
60%
80%
100%Yes No
Preliminary Draft – Subject to Revision Page 64
Wisconsin Center – User Feedback
VISIT Milwaukee also conducts customer service surveys with meeting/event planners
The survey consists of 35 questions that seek feedback regarding Event attributes Services/contractors utilized Impressions of Milwaukee and the Wisconsin Center Experience at hotels Other
Approximately 70 surveys were received from January 2014 to November 2016
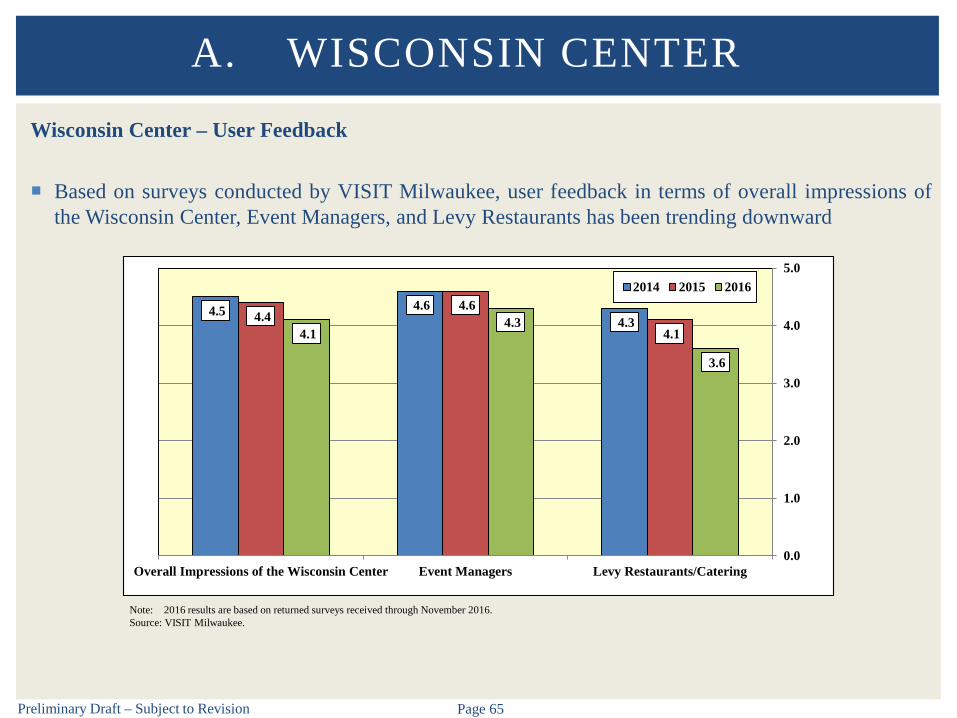
Based on a scale of 1 (Poor) to 5 (Excellent), ratings have been trending downward in overallimpressions of the Wisconsin Center, Event Managers and Levy Restaurants/Catering
In 2016, meeting planners ranked their overall impressions of the Wisconsin Center as Very Good(4.1), event managers at 4.3 and Levy Restaurants/Catering at 3.6 which indicates an opportunity forimprovement
A. WISCONSIN CENTER
Preliminary Draft – Subject to Revision Page 65
Wisconsin Center – User Feedback
Based on surveys conducted by VISIT Milwaukee, user feedback in terms of overall impressions ofthe Wisconsin Center, Event Managers, and Levy Restaurants has been trending downward
A. WISCONSIN CENTER
Note: 2016 results are based on returned surveys received through November 2016.Source: VISIT Milwaukee.
4.5 4.6 4.3 4.4
4.6
4.1 4.1 4.3
3.6
Overall Impressions of the Wisconsin Center Event Managers Levy Restaurants/Catering0.0
1.0
2.0
3.0
4.0
5.02014 2015 2016

Preliminary Draft – Subject to Revision Page 66
Expansion Study
The WCD and VISIT Milwaukee engaged HVS and tvsdesign to conduct an expansion analysis forthe Wisconsin Center that was completed in 2014
The study found that market conditions were generally positive, but many potential users of thebuilding cited that the destination appeal of downtown Milwaukee needed to be improved Issues cited included insufficient hotel rooms, lack of air access, poor local transportation, and an
overall lack of destination appeal
The study concluded that the Wisconsin Center offered a limited amount of space, particularly exhibitand meeting space, compared to its national competitors
The conceptual plan, developed by tvsdesign, proposed an expansion to the north that added space onall three levels of the Wisconsin Center. The study recommended expanding exhibit space to 250,000SF, ballroom space to 50,000 SF, and meeting space to 75,000 SF
If expansion is pursued, the Wisconsin Center would be in a better position to attract new national,regional and State conventions and tradeshows to the Milwaukee market according to the study
A. WISCONSIN CENTER

Preliminary Draft – Subject to Revision Page 67
Expansion Study
The study estimated that an expanded facility would result in an increase of 48 events and 145,000 intotal attendance in a stabilized year of operation as well as additional room nights, operating revenuesand economic and fiscal benefits as compared to a status quo scenario These increases included the addition of 10 conventions/tradeshows, five consumer shows/fairs,
12 conferences, nine meetings, eight banquets and four exhibit hall events annually
Without expansion, HVS projected that the decline in event activity would continue
A. WISCONSIN CENTER

B. UW-MILWAUKEE PANTHER ARENA
Preliminary Draft – Subject to Revision Page 69
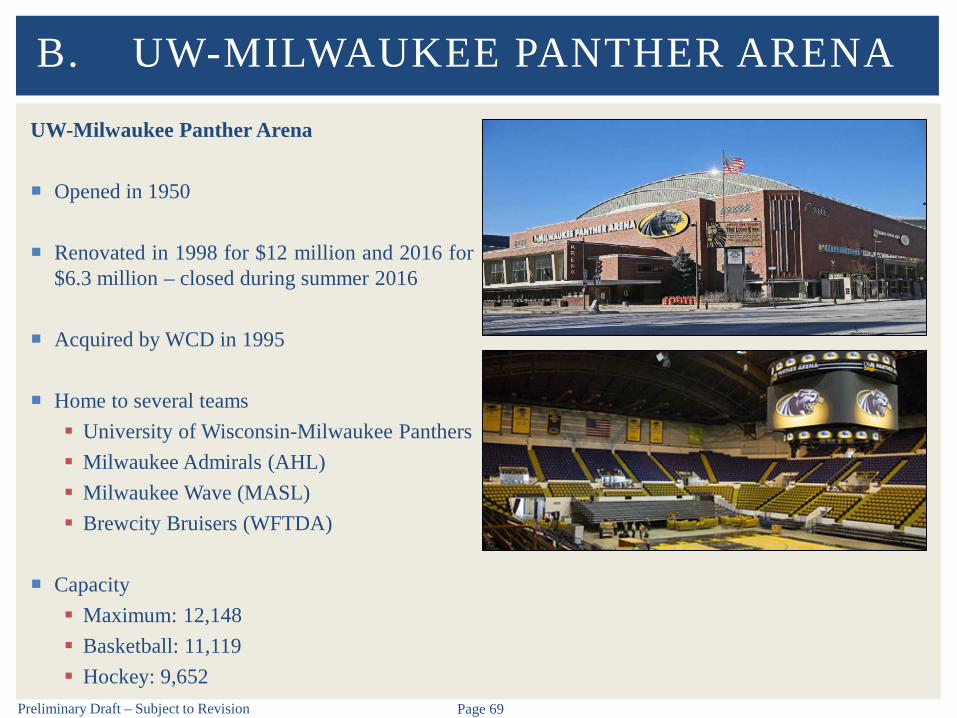
UW-Milwaukee Panther Arena
Opened in 1950
Renovated in 1998 for $12 million and 2016 for$6.3 million – closed during summer 2016
Acquired by WCD in 1995
Home to several teams University of Wisconsin-Milwaukee Panthers Milwaukee Admirals (AHL) Milwaukee Wave (MASL) Brewcity Bruisers (WFTDA)
Capacity Maximum: 12,148 Basketball: 11,119 Hockey: 9,652
B. UW-MILWAUKEE PANTHER ARENA

Preliminary Draft – Subject to Revision Page 70
UW-Milwaukee Panther Arena – Utilization
UW-Milwaukee Panther Arena averaged 115 event days and 259,200 in total attendance during theprofiled five-year period
Total attendance declined each year from 2012 to 2015 before increasing by 36% in 2016 The increase can be primarily attributed to the Admirals, graduations, and assemblies
B. UW-MILWAUKEE PANTHER ARENA
287265
248
210
286259
0
40
80
120
160
200
0
70
140
210
280
350
2012 2013 2014 2015 2016 Average
Num
ber of Event DaysTo
tal A
ttend
ance
(000
s)
Historic Event Activity at UW-Milwaukee Panther Arena (2012-2016)
Total Attendance Event Days
Preliminary Draft – Subject to Revision Page 71
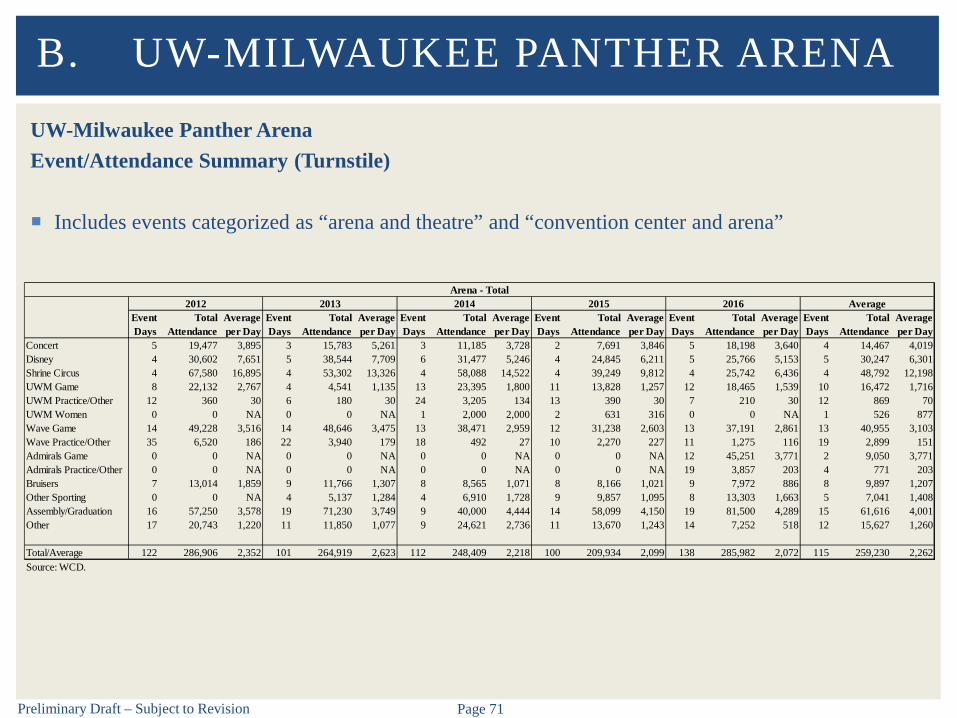
UW-Milwaukee Panther ArenaEvent/Attendance Summary (Turnstile)
Includes events categorized as “arena and theatre” and “convention center and arena”
B. UW-MILWAUKEE PANTHER ARENA
Event Days
Total Attendance
Average per Day
Event Days
Total Attendance
Average per Day
Event Days
Total Attendance
Average per Day
Event Days
Total Attendance
Average per Day
Event Days
Total Attendance
Average per Day
Event Days
Total Attendance
Average per Day
Concert 5 19,477 3,895 3 15,783 5,261 3 11,185 3,728 2 7,691 3,846 5 18,198 3,640 4 14,467 4,019Disney 4 30,602 7,651 5 38,544 7,709 6 31,477 5,246 4 24,845 6,211 5 25,766 5,153 5 30,247 6,301Shrine Circus 4 67,580 16,895 4 53,302 13,326 4 58,088 14,522 4 39,249 9,812 4 25,742 6,436 4 48,792 12,198UWM Game 8 22,132 2,767 4 4,541 1,135 13 23,395 1,800 11 13,828 1,257 12 18,465 1,539 10 16,472 1,716UWM Practice/Other 12 360 30 6 180 30 24 3,205 134 13 390 30 7 210 30 12 869 70UWM Women 0 0 NA 0 0 NA 1 2,000 2,000 2 631 316 0 0 NA 1 526 877Wave Game 14 49,228 3,516 14 48,646 3,475 13 38,471 2,959 12 31,238 2,603 13 37,191 2,861 13 40,955 3,103Wave Practice/Other 35 6,520 186 22 3,940 179 18 492 27 10 2,270 227 11 1,275 116 19 2,899 151Admirals Game 0 0 NA 0 0 NA 0 0 NA 0 0 NA 12 45,251 3,771 2 9,050 3,771Admirals Practice/Other 0 0 NA 0 0 NA 0 0 NA 0 0 NA 19 3,857 203 4 771 203Bruisers 7 13,014 1,859 9 11,766 1,307 8 8,565 1,071 8 8,166 1,021 9 7,972 886 8 9,897 1,207Other Sporting 0 0 NA 4 5,137 1,284 4 6,910 1,728 9 9,857 1,095 8 13,303 1,663 5 7,041 1,408Assembly/Graduation 16 57,250 3,578 19 71,230 3,749 9 40,000 4,444 14 58,099 4,150 19 81,500 4,289 15 61,616 4,001Other 17 20,743 1,220 11 11,850 1,077 9 24,621 2,736 11 13,670 1,243 14 7,252 518 12 15,627 1,260
Total/Average 122 286,906 2,352 101 264,919 2,623 112 248,409 2,218 100 209,934 2,099 138 285,982 2,072 115 259,230 2,262Source: WCD.
Arena - Total2012 2013 2014 2015 2016 Average

Preliminary Draft – Subject to Revision Page 72
UW-Milwaukee Panther ArenaUW-Milwaukee Men’s Basketball Attendance
The Panthers have averaged 1,739 in attendance over the past five years
B. UW-MILWAUKEE PANTHER ARENA
2,767
1,135
1,800
1,257
1,539
1,739
0
3
6
9
12
15
18
0
500
1,000
1,500
2,000
2,500
3,000
2012 2013 2014 2015 2016 Average
Num
ber of Event Days/G
ames
Aver
age
Atte
ndan
ce
University of Wisconsin-Milwaukee BasketballAverage Attendance (per Game)
Average per Day Event Days

Preliminary Draft – Subject to Revision Page 73
UW-Milwaukee Panther ArenaMilwaukee Wave Attendance
The Milwaukee Wave have averaged 3,059 attendance over the past five years
B. UW-MILWAUKEE PANTHER ARENA
3,516 3,475
2,959
2,603
2,8613,059
0
4
8
12
16
0
1,000
2,000
3,000
4,000
2012 2013 2014 2015 2016 Average
Num
ber of Event Days/G
ames
Aver
age
Atte
ndan
ce
Milwaukee WaveAverage Attendance (per Game)
Average per Day Event Days

Preliminary Draft – Subject to Revision Page 74
UW-Milwaukee Panther ArenaTripoli Shrine Circus Attendance
Shrine Circus attendance has decreased in recent years – 2016 took place in April, spring break forchildren may have played a factor
B. UW-MILWAUKEE PANTHER ARENA
16,895
13,326
14,522
9,812
6,436
13,121
0
2
4
6
8
10
0
4,000
8,000
12,000
16,000
20,000
2012 2013 2014 2015 2016 Average
Num
ber of Event Days/G
ames
Aver
age
Atte
ndan
ce
Tripoli Shrine CircusAverage Attendance (per Day)
Average per Day Event Days

Preliminary Draft – Subject to Revision Page 75
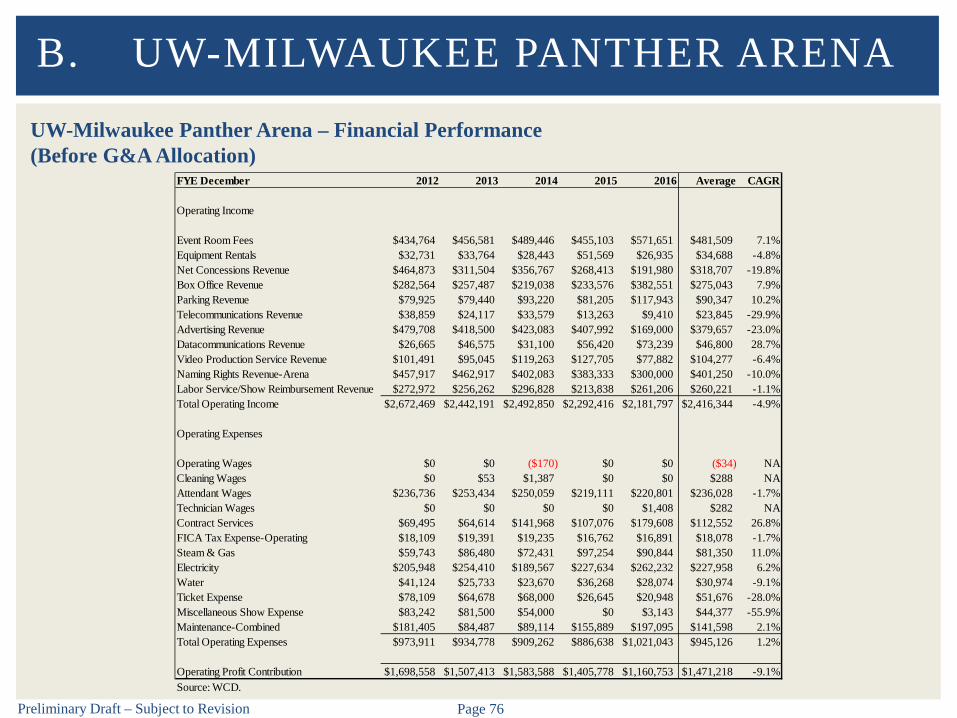
UW-Milwaukee Panther Arena – Financial Performance(Before G&A Allocation)
Operating profit contribution averaged $1.47 million per year
Operating profit contribution has generally declined, reaching a low of $1.16 million in 2016
Figures do not include general and administrative allocation
B. UW-MILWAUKEE PANTHER ARENA
FYE December 2012 2013 2014 2015 2016 Average CAGR
Total Operating Income $2,672,469 $2,442,191 $2,492,850 $2,292,416 $2,181,797 $2,416,344 -4.9%
Total Operating Expenses $973,911 $934,778 $909,262 $886,638 $1,021,043 $945,126 1.2%
Operating Profit Contribution $1,698,558 $1,507,413 $1,583,588 $1,405,778 $1,160,753 $1,471,218 -9.1%
Preliminary Draft – Subject to Revision Page 76
UW-Milwaukee Panther Arena – Financial Performance(Before G&A Allocation)
B. UW-MILWAUKEE PANTHER ARENA
FYE December 2012 2013 2014 2015 2016 Average CAGR
Operating Income
Event Room Fees $434,764 $456,581 $489,446 $455,103 $571,651 $481,509 7.1%Equipment Rentals $32,731 $33,764 $28,443 $51,569 $26,935 $34,688 -4.8%Net Concessions Revenue $464,873 $311,504 $356,767 $268,413 $191,980 $318,707 -19.8%Box Office Revenue $282,564 $257,487 $219,038 $233,576 $382,551 $275,043 7.9%Parking Revenue $79,925 $79,440 $93,220 $81,205 $117,943 $90,347 10.2%Telecommunications Revenue $38,859 $24,117 $33,579 $13,263 $9,410 $23,845 -29.9%Advertising Revenue $479,708 $418,500 $423,083 $407,992 $169,000 $379,657 -23.0%Datacommunications Revenue $26,665 $46,575 $31,100 $56,420 $73,239 $46,800 28.7%Video Production Service Revenue $101,491 $95,045 $119,263 $127,705 $77,882 $104,277 -6.4%Naming Rights Revenue-Arena $457,917 $462,917 $402,083 $383,333 $300,000 $401,250 -10.0%Labor Service/Show Reimbursement Revenue $272,972 $256,262 $296,828 $213,838 $261,206 $260,221 -1.1%Total Operating Income $2,672,469 $2,442,191 $2,492,850 $2,292,416 $2,181,797 $2,416,344 -4.9%
Operating Expenses
Operating Wages $0 $0 ($170) $0 $0 ($34) NACleaning Wages $0 $53 $1,387 $0 $0 $288 NAAttendant Wages $236,736 $253,434 $250,059 $219,111 $220,801 $236,028 -1.7%Technician Wages $0 $0 $0 $0 $1,408 $282 NAContract Services $69,495 $64,614 $141,968 $107,076 $179,608 $112,552 26.8%FICA Tax Expense-Operating $18,109 $19,391 $19,235 $16,762 $16,891 $18,078 -1.7%Steam & Gas $59,743 $86,480 $72,431 $97,254 $90,844 $81,350 11.0%Electricity $205,948 $254,410 $189,567 $227,634 $262,232 $227,958 6.2%Water $41,124 $25,733 $23,670 $36,268 $28,074 $30,974 -9.1%Ticket Expense $78,109 $64,678 $68,000 $26,645 $20,948 $51,676 -28.0%Miscellaneous Show Expense $83,242 $81,500 $54,000 $0 $3,143 $44,377 -55.9%Maintenance-Combined $181,405 $84,487 $89,114 $155,889 $197,095 $141,598 2.1%Total Operating Expenses $973,911 $934,778 $909,262 $886,638 $1,021,043 $945,126 1.2%
Operating Profit Contribution $1,698,558 $1,507,413 $1,583,588 $1,405,778 $1,160,753 $1,471,218 -9.1%Source: WCD.

Preliminary Draft – Subject to Revision Page 77
UW-Milwaukee Panther Arena – Operating Revenue
Event room fees increased significantly in 2016 – five year average of $482,000
B. UW-MILWAUKEE PANTHER ARENA
$435 $457
$489
$455
$572
$482
$0
$100
$200
$300
$400
$500
$600
2012 2013 2014 2015 2016 Average
UW-Milwaukee Panther ArenaEvent Room Fees ($000s)

Preliminary Draft – Subject to Revision Page 78
UW-Milwaukee Panther Arena – Operating Revenue
Net concessions revenue has generally decreased over time – five year average of $319,000
B. UW-MILWAUKEE PANTHER ARENA
$465
$312
$357
$268
$192
$319
$0
$100
$200
$300
$400
$500
2012 2013 2014 2015 2016 Average
UW-Milwaukee Panther ArenaNet Concessions Revenue ($000s)

Preliminary Draft – Subject to Revision Page 79
UW-Milwaukee Panther Arena – Operating Revenue
Box office revenue increased significantly in 2016 – five year average of $275,000
B. UW-MILWAUKEE PANTHER ARENA
$283
$257
$219 $234
$383
$275
$0
$100
$200
$300
$400
2012 2013 2014 2015 2016 Average
UW-Milwaukee Panther ArenaBox Office Revenue ($000s)

Preliminary Draft – Subject to Revision Page 80
UW-Milwaukee Panther Arena – Operating Revenue
Advertising revenue decreased significantly in 2016 – five year average of $380,000
B. UW-MILWAUKEE PANTHER ARENA
$480
$419 $423 $408
$169
$380
$0
$100
$200
$300
$400
$500
2012 2013 2014 2015 2016 Average
UW-Milwaukee Panther ArenaAdvertising Revenue ($000s)

Preliminary Draft – Subject to Revision Page 81
UW-Milwaukee Panther Arena – Operating Revenue
Video production service revenue decreased significantly in 2016 – five year average of $104,000
B. UW-MILWAUKEE PANTHER ARENA
$101 $95
$119
$128
$78
$104
$0
$30
$60
$90
$120
$150
2012 2013 2014 2015 2016 Average
UW-Milwaukee Panther ArenaVideo Production Service Revenue ($000s)
Preliminary Draft – Subject to Revision Page 82
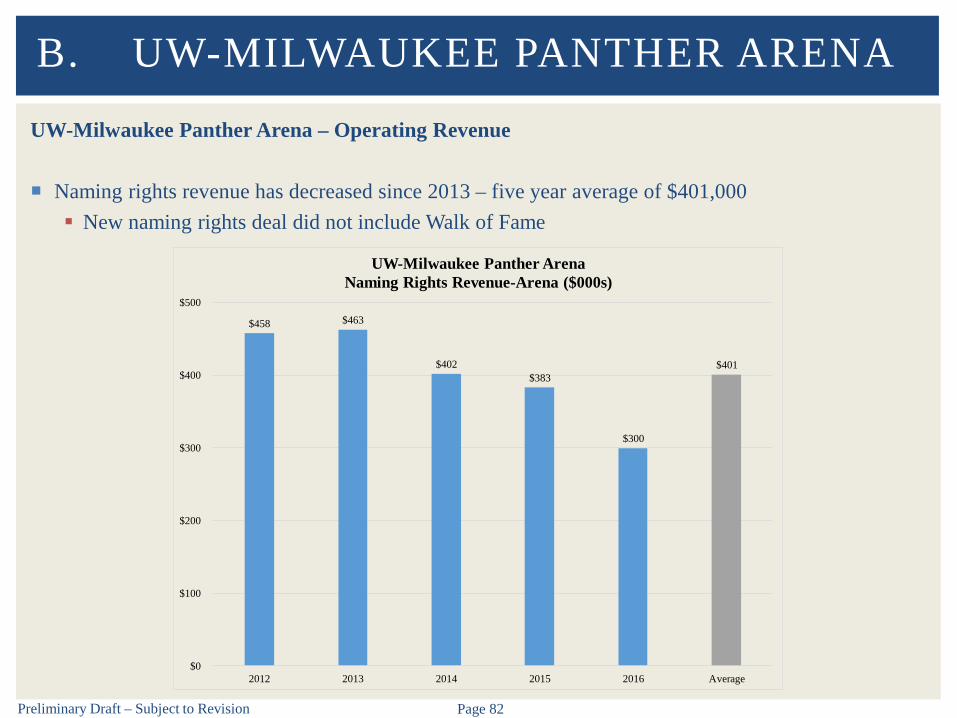
UW-Milwaukee Panther Arena – Operating Revenue
Naming rights revenue has decreased since 2013 – five year average of $401,000 New naming rights deal did not include Walk of Fame
B. UW-MILWAUKEE PANTHER ARENA
$458 $463
$402 $383
$300
$401
$0
$100
$200
$300
$400
$500
2012 2013 2014 2015 2016 Average
UW-Milwaukee Panther ArenaNaming Rights Revenue-Arena ($000s)

Preliminary Draft – Subject to Revision Page 83
UW-Milwaukee Panther Arena – Operating Revenue
Labor service/show reimbursement revenue has varied over time – five year average of $260,000
B. UW-MILWAUKEE PANTHER ARENA
$273 $256
$297
$214
$261 $260
$0
$100
$200
$300
$400
2012 2013 2014 2015 2016 Average
UW-Milwaukee Panther ArenaLabor Service/Show Reimbursement Revenue ($000s)
Preliminary Draft – Subject to Revision Page 84
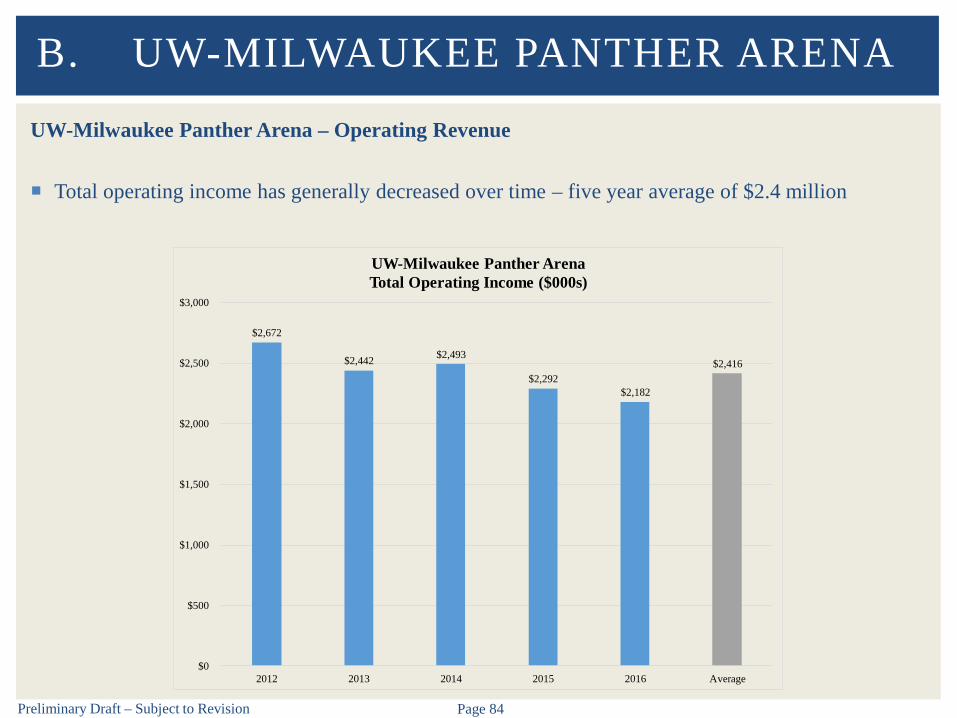
UW-Milwaukee Panther Arena – Operating Revenue
Total operating income has generally decreased over time – five year average of $2.4 million
B. UW-MILWAUKEE PANTHER ARENA
$2,672
$2,442 $2,493
$2,292 $2,182
$2,416
$0
$500
$1,000
$1,500
$2,000
$2,500
$3,000
2012 2013 2014 2015 2016 Average
UW-Milwaukee Panther ArenaTotal Operating Income ($000s)
Preliminary Draft – Subject to Revision Page 85
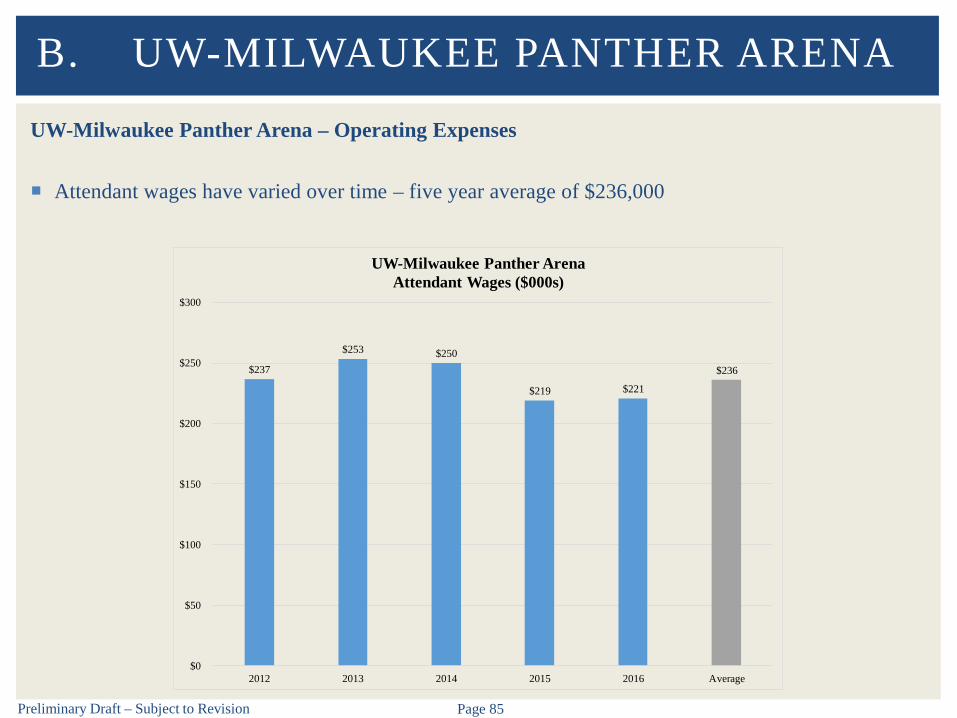
UW-Milwaukee Panther Arena – Operating Expenses
Attendant wages have varied over time – five year average of $236,000
B. UW-MILWAUKEE PANTHER ARENA
$237
$253 $250
$219 $221
$236
$0
$50
$100
$150
$200
$250
$300
2012 2013 2014 2015 2016 Average
UW-Milwaukee Panther ArenaAttendant Wages ($000s)

Preliminary Draft – Subject to Revision Page 86
UW-Milwaukee Panther Arena – Operating Expenses
Contract services expense increased significantly in 2014 and 2016 – five year average of $113,000
B. UW-MILWAUKEE PANTHER ARENA
$69 $65
$142
$107
$180
$113
$0
$50
$100
$150
$200
2012 2013 2014 2015 2016 Average
UW-Milwaukee Panther ArenaContract Services ($000s)
Preliminary Draft – Subject to Revision Page 87
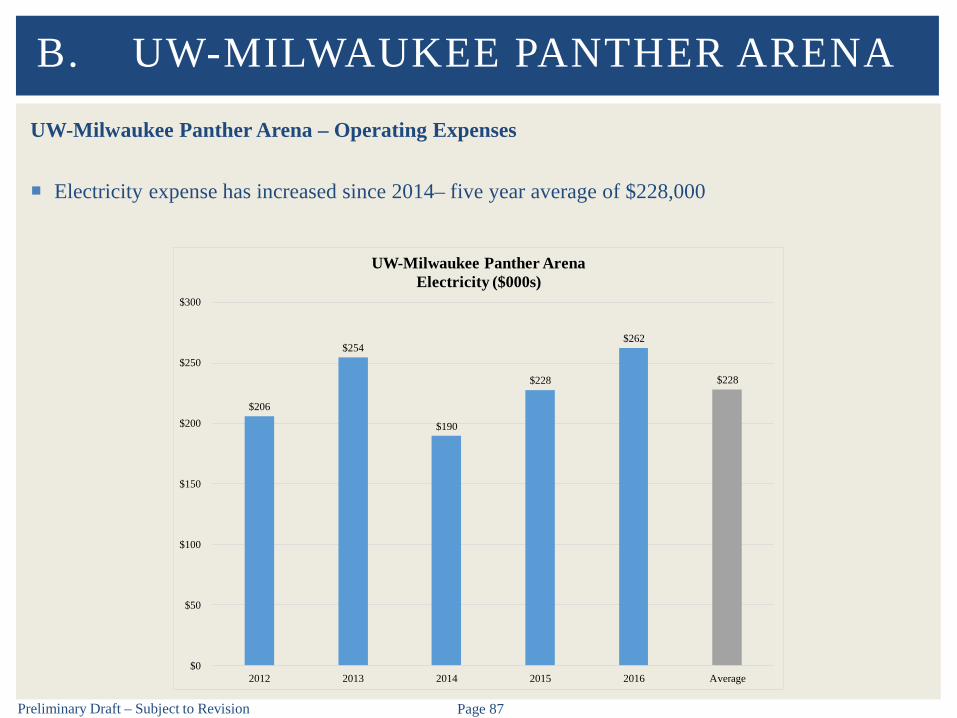
UW-Milwaukee Panther Arena – Operating Expenses
Electricity expense has increased since 2014– five year average of $228,000
B. UW-MILWAUKEE PANTHER ARENA
$206
$254
$190
$228
$262
$228
$0
$50
$100
$150
$200
$250
$300
2012 2013 2014 2015 2016 Average
UW-Milwaukee Panther ArenaElectricity ($000s)

Preliminary Draft – Subject to Revision Page 88
UW-Milwaukee Panther Arena – Operating Expenses
Maintenance-combined expense has increased since 2013 – five year average of $142,000
B. UW-MILWAUKEE PANTHER ARENA
$181
$84 $89
$156
$197
$142
$0
$50
$100
$150
$200
$250
2012 2013 2014 2015 2016 Average
UW-Milwaukee Panther ArenaMaintenance-Combined ($000s)
Preliminary Draft – Subject to Revision Page 89
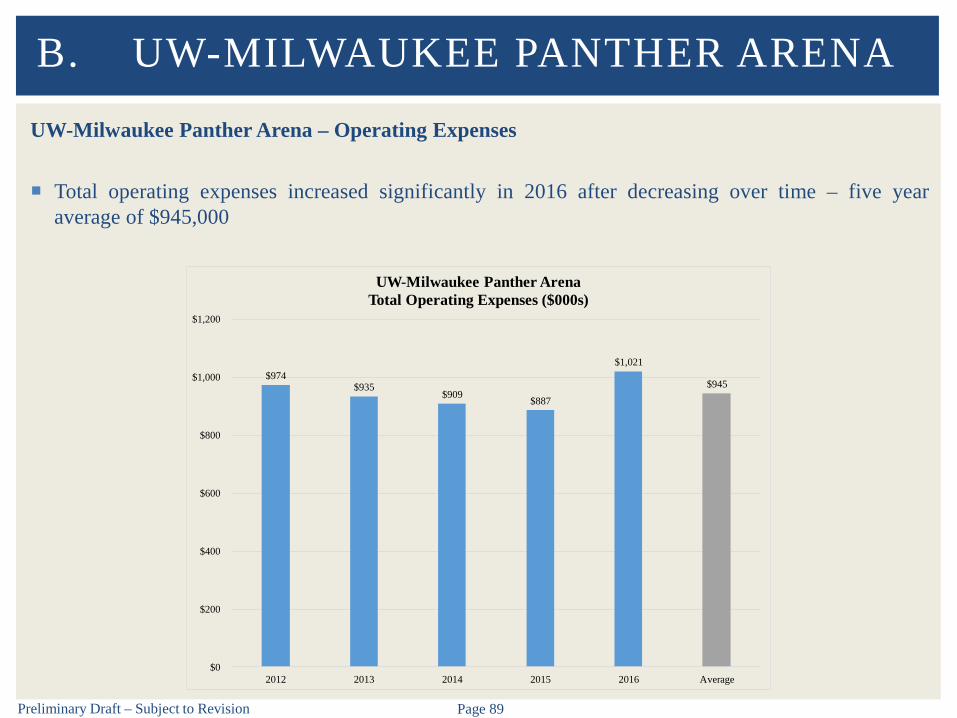
UW-Milwaukee Panther Arena – Operating Expenses
Total operating expenses increased significantly in 2016 after decreasing over time – five yearaverage of $945,000
B. UW-MILWAUKEE PANTHER ARENA
$974 $935
$909 $887
$1,021
$945
$0
$200
$400
$600
$800
$1,000
$1,200
2012 2013 2014 2015 2016 Average
UW-Milwaukee Panther ArenaTotal Operating Expenses ($000s)
Preliminary Draft – Subject to Revision Page 90
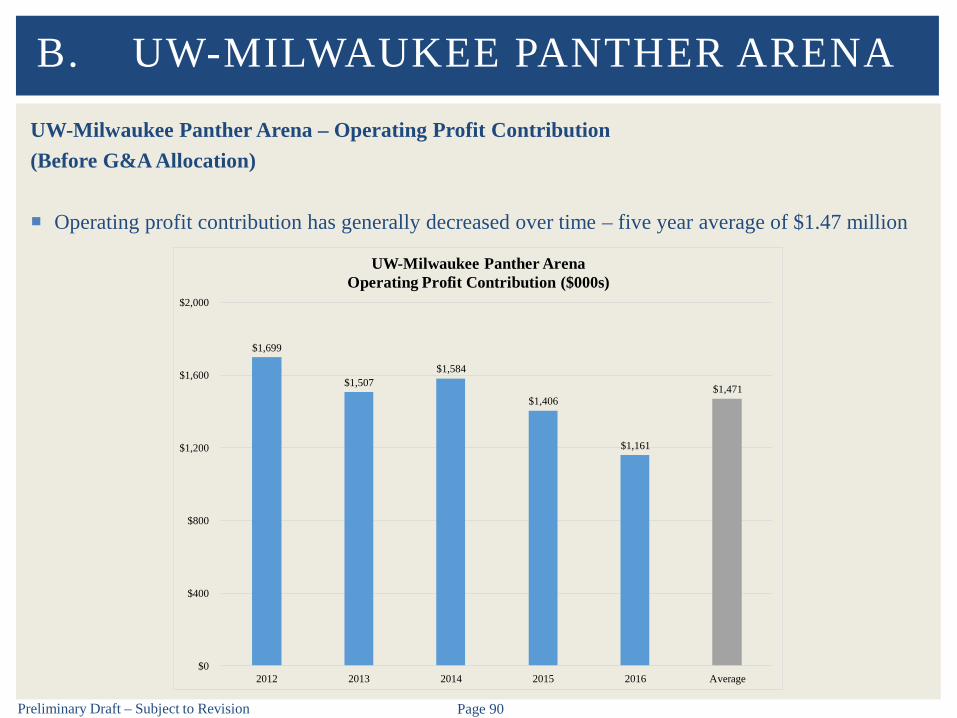
UW-Milwaukee Panther Arena – Operating Profit Contribution(Before G&A Allocation)
Operating profit contribution has generally decreased over time – five year average of $1.47 million
B. UW-MILWAUKEE PANTHER ARENA
$1,699
$1,507 $1,584
$1,406
$1,161
$1,471
$0
$400
$800
$1,200
$1,600
$2,000
2012 2013 2014 2015 2016 Average
UW-Milwaukee Panther ArenaOperating Profit Contribution ($000s)

C. MILWAUKEE THEATRE
Preliminary Draft – Subject to Revision Page 92
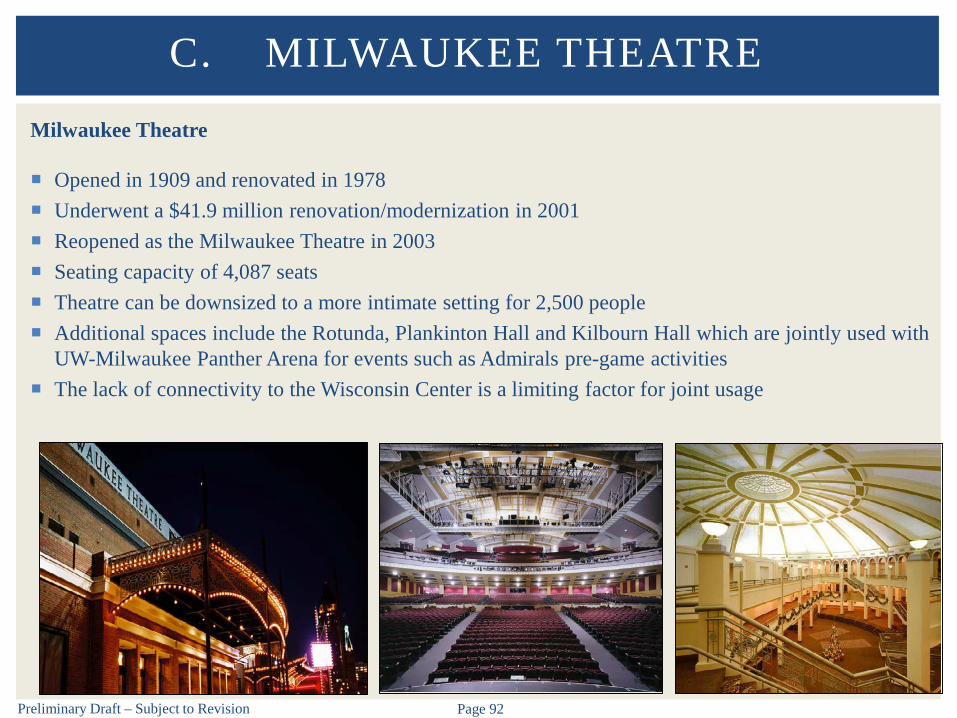
Milwaukee Theatre
Opened in 1909 and renovated in 1978 Underwent a $41.9 million renovation/modernization in 2001 Reopened as the Milwaukee Theatre in 2003 Seating capacity of 4,087 seats Theatre can be downsized to a more intimate setting for 2,500 people Additional spaces include the Rotunda, Plankinton Hall and Kilbourn Hall which are jointly used with
UW-Milwaukee Panther Arena for events such as Admirals pre-game activities The lack of connectivity to the Wisconsin Center is a limiting factor for joint usage
C. MILWAUKEE THEATRE

Preliminary Draft – Subject to Revision Page 93
Milwaukee Theatre – Utilization
The Milwaukee Theatre averaged 64 event days and 131,800 in total turnstile attendance during the profiledfive-year period
In 2014, the Milwaukee Theatre hosted Disney’s The Lion King which was primarily responsible for thesignificant increase in event days and attendance
In 2016, the Milwaukee Theatre hosted the highest number of event days (78) during the five-year period This increase is partially attributable to a shift in booking focus towards concerts with WCD creating a
relationship with Venue Coalition (a booking advocate) and establishing relationships with local, regional,and national concert promoters and agents
C. MILWAUKEE THEATRE
130 126
205
76
122 132
0
20
40
60
80
100
0
50
100
150
200
250
2012 2013 2014 2015 2016 Average
Num
ber of Event DaysTo
tal A
ttend
ance
(000
s)
Historic Event Activity at Milwaukee Theatre (2012-2016)
Total Attendance Event Days
Preliminary Draft – Subject to Revision Page 94
Milwaukee Theatre – Utilization
The Milwaukee Theatre does not have a tenant organization (e.g., Broadway series, Symphony, Ballet,etc.) which results in a lack of a steady base of event activity but increases the number of availabledates
The Theatre’s bookings are led by entertainment events, other events, and assembly/graduationevents, respectively
In 2014, the number of event days and associated attendance increased significantly due to Disney’sThe Lion King
From 2015 to 2016, the Milwaukee Theatre experienced a significant increase in the number of eventdays and total attendance which was partially attributable to management’s proactive and aggressivebooking strategy It is anticipated that this trend will continue as the WCD recently added a part-time Business
Development position and as the WCD continues to actively work with Venue Coalition andpursue event programming
Entertainment acts accounted for the highest number of events, event days and attendance during theprofiled five-year period
C. MILWAUKEE THEATRE

Preliminary Draft – Subject to Revision Page 95
Milwaukee Theatre – UtilizationEvent/Attendance Summary (Turnstile)
Includes events categorized as “arena and theatre” and “convention center and theatre”
C. MILWAUKEE THEATRE
Event Days
Total Attendance
Average per Day
Event Days
Total Attendance
Average per Day
Event Days
Total Attendance
Average per Day
Event Days
Total Attendance
Average per Day
Event Days
Total Attendance
Average per Day
Event Days
Total Attendance
Average per Day
Concert 28 68,684 2,453 25 39,271 1,571 19 39,439 2,076 13 22,712 1,747 33 62,114 1,882 24 46,444 1,968Disney 1 2,779 2,779 1 2,748 2,748 0 0 NA 0 0 NA 0 0 NA 0 1,105 2,764Assembly/Graduation 7 23,200 3,314 15 41,436 2,762 23 57,753 2,511 16 36,170 2,261 12 32,545 2,712 15 38,221 2,618Broadway 0 0 NA 0 0 NA 28 92,396 3,300 0 0 NA 0 0 NA 6 18,479 3,300Other 23 35,660 1,550 21 42,330 2,016 7 15,300 2,186 15 16,750 1,117 33 27,517 834 20 27,511 1,389
Total/Average 59 130,323 2,209 62 125,785 2,029 77 204,888 2,661 44 75,632 1,719 78 122,176 1,566 64 131,761 2,059Source: WCD.
Theatre - Total2012 2013 2014 2015 2016 Five-Year Average
Preliminary Draft – Subject to Revision Page 96
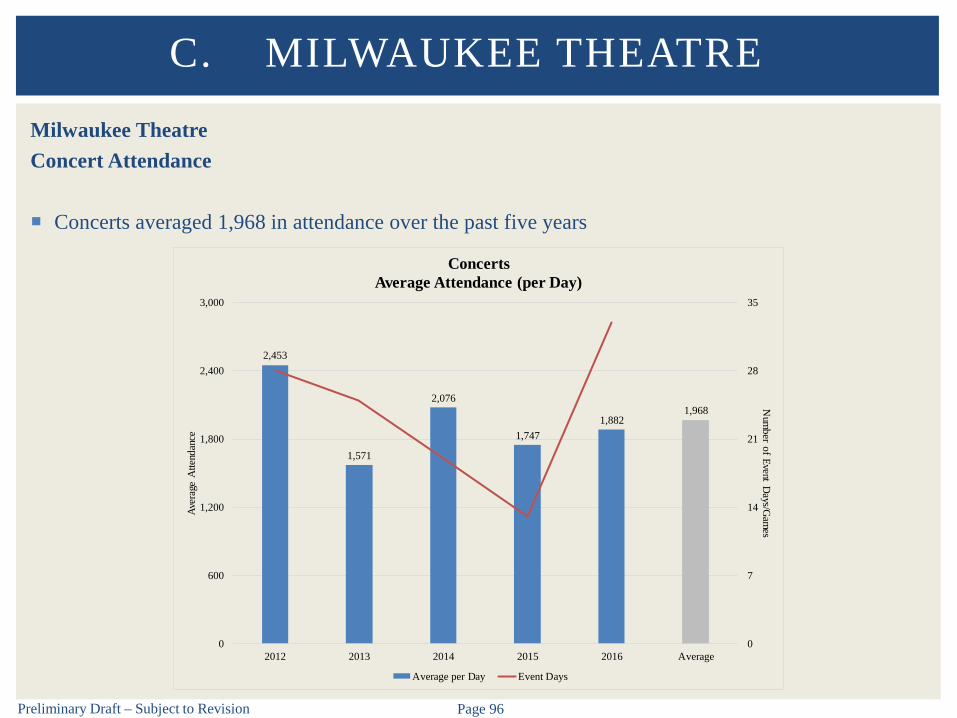
Milwaukee TheatreConcert Attendance
Concerts averaged 1,968 in attendance over the past five years
C. MILWAUKEE THEATRE
2,453
1,571
2,076
1,7471,882
1,968
0
7
14
21
28
35
0
600
1,200
1,800
2,400
3,000
2012 2013 2014 2015 2016 Average
Num
ber of Event Days/G
ames
Aver
age
Atte
ndan
ce
ConcertsAverage Attendance (per Day)
Average per Day Event Days

Preliminary Draft – Subject to Revision Page 97
Milwaukee TheatreAssembly/Graduation Attendance
Assembly/graduation events averaged 2,618 per event day over the last five years
C. MILWAUKEE THEATRE
3,314
2,762
2,511
2,261
2,7122,618
0
4
8
12
16
20
24
0
600
1,200
1,800
2,400
3,000
3,600
2012 2013 2014 2015 2016 Average
Num
ber of Event Days/G
ames
Aver
age
Atte
ndan
ce
Assembly/GraduationAverage Attendance (per Day)
Average per Day Event Days
Preliminary Draft – Subject to Revision Page 98
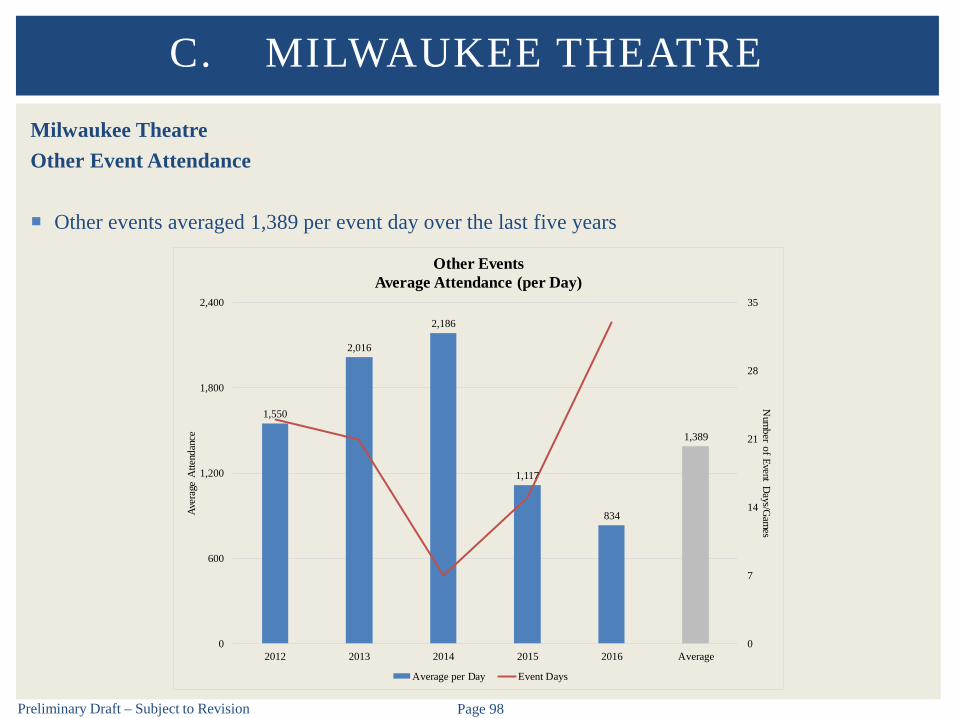
Milwaukee TheatreOther Event Attendance
Other events averaged 1,389 per event day over the last five years
C. MILWAUKEE THEATRE
1,550
2,016
2,186
1,117
834
1,389
0
7
14
21
28
35
0
600
1,200
1,800
2,400
2012 2013 2014 2015 2016 Average
Num
ber of Event Days/G
ames
Aver
age
Atte
ndan
ce
Other EventsAverage Attendance (per Day)
Average per Day Event Days
Preliminary Draft – Subject to Revision Page 99
Milwaukee Theatre – Financial Performance(Before G&A Allocation)
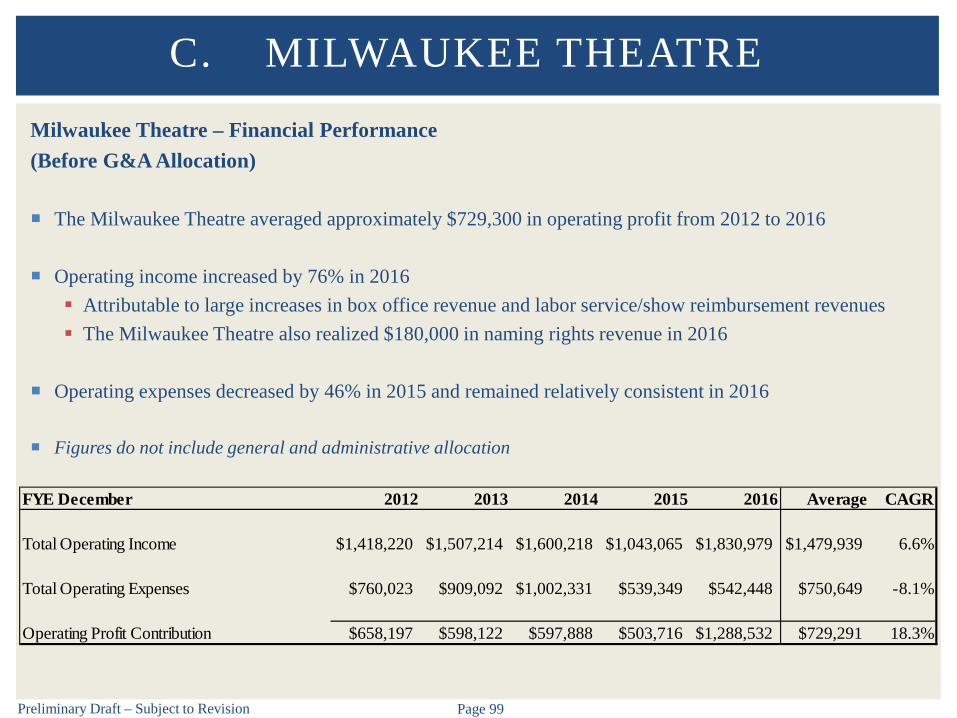
The Milwaukee Theatre averaged approximately $729,300 in operating profit from 2012 to 2016
Operating income increased by 76% in 2016 Attributable to large increases in box office revenue and labor service/show reimbursement revenues The Milwaukee Theatre also realized $180,000 in naming rights revenue in 2016
Operating expenses decreased by 46% in 2015 and remained relatively consistent in 2016
Figures do not include general and administrative allocation
C. MILWAUKEE THEATRE
FYE December 2012 2013 2014 2015 2016 Average CAGR
Total Operating Income $1,418,220 $1,507,214 $1,600,218 $1,043,065 $1,830,979 $1,479,939 6.6%
Total Operating Expenses $760,023 $909,092 $1,002,331 $539,349 $542,448 $750,649 -8.1%
Operating Profit Contribution $658,197 $598,122 $597,888 $503,716 $1,288,532 $729,291 18.3%

Preliminary Draft – Subject to Revision Page 100
Milwaukee Theatre – Financial Performance(Before G&A Allocation)
C. MILWAUKEE THEATRE
FYE December 2012 2013 2014 2015 2016 Average CAGR
Operating Income
Event Room Fees $195,250 $167,750 $318,585 $223,875 $275,305 $236,153 9.0%Equipment Rentals $16,505 $19,358 $18,975 $40,808 $26,666 $24,462 12.7%Net Concessions Revenue $113,830 $77,796 $131,867 $145,900 $149,540 $123,787 7.1%Box Office Revenue $234,028 $202,018 $330,564 $130,818 $343,218 $248,129 10.0%Parking Revenue $116,610 $125,790 $136,475 $127,500 $105,560 $122,387 -2.5%Office Space Rentals $154,387 $185,321 $179,184 $62,024 $109,222 $138,028 -8.3%Telecommunications Revenue $11,734 $9,098 $11,259 $25,834 $23,536 $16,292 19.0%Advertising Revenue $154,500 $198,167 $159,000 $18,000 $18,000 $109,533 -41.6%Miscellaneous Income-Activity Committee $9,489 $10,678 $6,302 $0 $0 $5,294 -100.0%Datacommunications Revenue $8,495 $9,055 $0 $11,500 $9,982 $7,806 4.1%Video Production Service Revenue $38,435 $33,528 $24,364 $22,805 $16,250 $27,076 -19.4%Naming Rights $0 $0 $0 $0 $180,000 $36,000 NALabor Service/Show Reimbursement Revenue $364,958 $468,655 $283,643 $234,003 $573,700 $384,992 12.0%Total Operating Income $1,418,220 $1,507,214 $1,600,218 $1,043,065 $1,830,979 $1,479,939 6.6%
Operating Expenses
Attendant Wages $76,208 $70,169 $140,694 $48,691 $53,548 $77,862 -8.4%Contract Services $947 $0 $15,084 $2,552 $744 $3,866 -5.9%FICA Tax Expense-Operating $5,830 $5,368 $10,763 $3,725 $4,096 $5,956 -8.4%Steam & Gas $57,060 $96,700 $96,576 $78,644 $55,143 $76,825 -0.9%Electricity $205,423 $164,644 $222,154 $210,833 $210,327 $202,676 0.6%Water $10,610 $23,890 $17,588 $15,063 $9,805 $15,391 -2.0%Show Expense $341,263 $458,109 $374,116 $92,953 $159,507 $285,190 -17.3%Maintenance-Combined $62,681 $90,213 $125,355 $86,888 $49,276 $82,883 -5.8%Total Operating Expenses $760,023 $909,092 $1,002,331 $539,349 $542,448 $750,649 -8.1%
Operating Profit Contribution $658,197 $598,122 $597,888 $503,716 $1,288,532 $729,291 18.3%Source: WCD.

Preliminary Draft – Subject to Revision Page 101
Milwaukee Theatre – Operating Revenue
Event room fees increased significantly in 2014 and 2016 – five year average of $236,000
C. MILWAUKEE THEATRE
$195
$168
$319
$224
$275
$236
$0
$100
$200
$300
$400
2012 2013 2014 2015 2016 Average
Milwaukee TheatreEvent Room Fees ($000s)

Preliminary Draft – Subject to Revision Page 102
Milwaukee Theatre – Operating Revenue
Net concessions revenue has increased since 2013 – five year average of $124,000
C. MILWAUKEE THEATRE
$114
$78
$132
$146 $150
$124
$0
$50
$100
$150
$200
2012 2013 2014 2015 2016 Average
Milwaukee TheatreNet Concessions Revenue ($000s)

Preliminary Draft – Subject to Revision Page 103
Milwaukee Theatre – Operating Revenue
Box office revenue increased significantly in 2014 and 2016 – five year average of $248,000
C. MILWAUKEE THEATRE
$234
$202
$331
$131
$343
$248
$0
$100
$200
$300
$400
2012 2013 2014 2015 2016 Average
Milwaukee TheatreBox Office Revenue ($000s)
Preliminary Draft – Subject to Revision Page 104
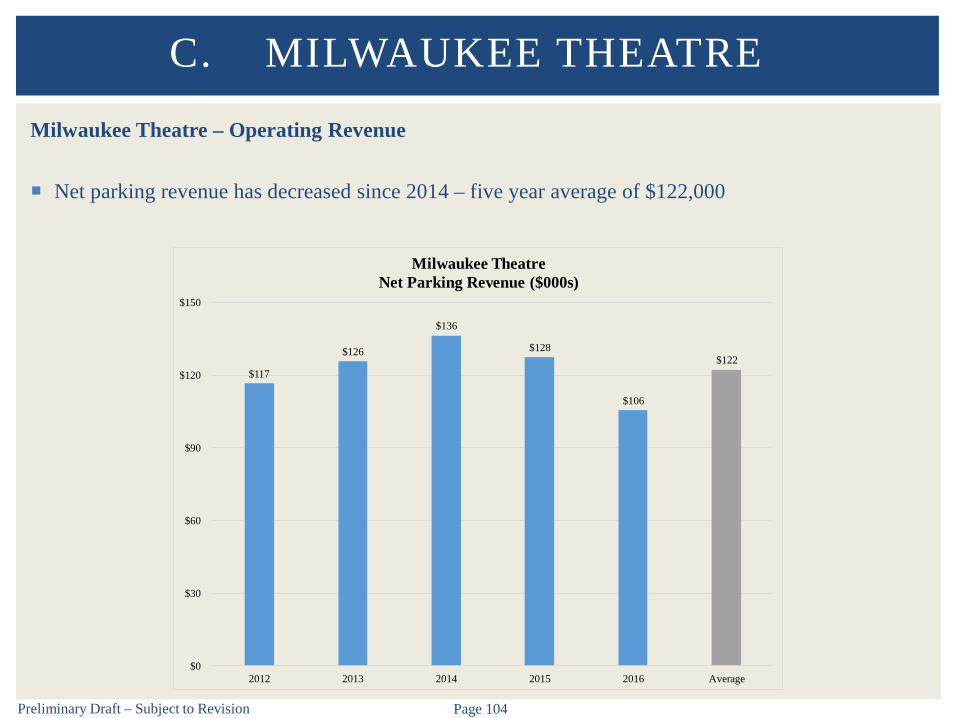
Milwaukee Theatre – Operating Revenue
Net parking revenue has decreased since 2014 – five year average of $122,000
C. MILWAUKEE THEATRE
$117
$126
$136
$128
$106
$122
$0
$30
$60
$90
$120
$150
2012 2013 2014 2015 2016 Average
Milwaukee TheatreNet Parking Revenue ($000s)
Preliminary Draft – Subject to Revision Page 105
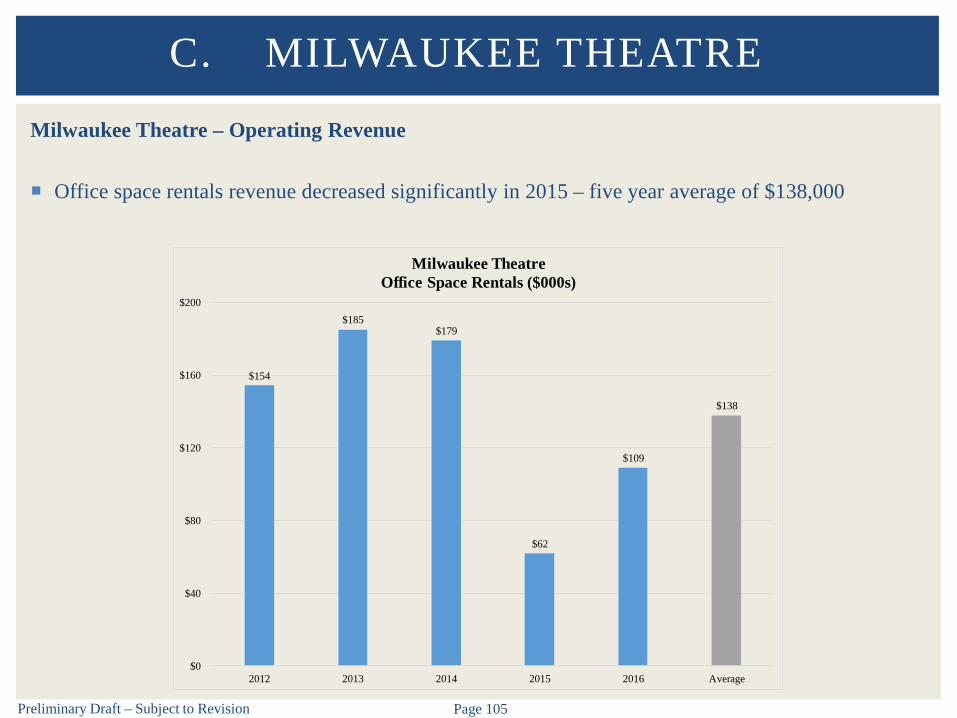
Milwaukee Theatre – Operating Revenue
Office space rentals revenue decreased significantly in 2015 – five year average of $138,000
C. MILWAUKEE THEATRE
$154
$185 $179
$62
$109
$138
$0
$40
$80
$120
$160
$200
2012 2013 2014 2015 2016 Average
Milwaukee TheatreOffice Space Rentals ($000s)

Preliminary Draft – Subject to Revision Page 106
Milwaukee Theatre – Operating Revenue
Advertising revenue decreased significantly in 2015 and has remained nominal – five year average of$110,000 Staffing related issues have taken focus from this area
C. MILWAUKEE THEATRE
$155
$198
$159
$18 $18
$110
$0
$40
$80
$120
$160
$200
2012 2013 2014 2015 2016 Average
Milwaukee TheatreAdvertising Revenue ($000s)
Preliminary Draft – Subject to Revision Page 107
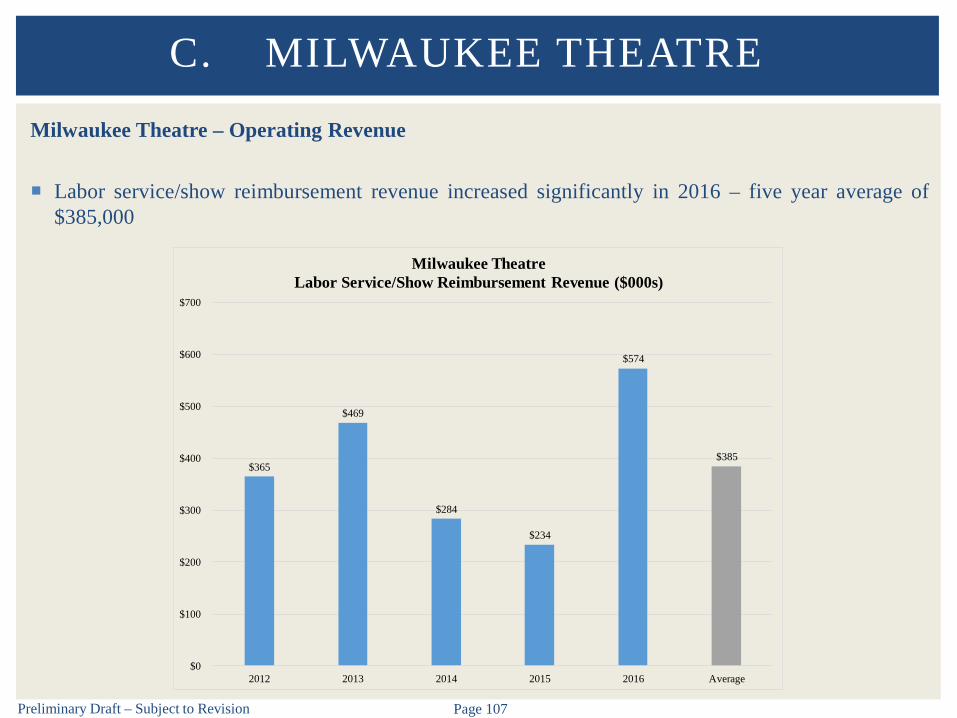
Milwaukee Theatre – Operating Revenue
Labor service/show reimbursement revenue increased significantly in 2016 – five year average of$385,000
C. MILWAUKEE THEATRE
$365
$469
$284
$234
$574
$385
$0
$100
$200
$300
$400
$500
$600
$700
2012 2013 2014 2015 2016 Average
Milwaukee TheatreLabor Service/Show Reimbursement Revenue ($000s)
Preliminary Draft – Subject to Revision Page 108
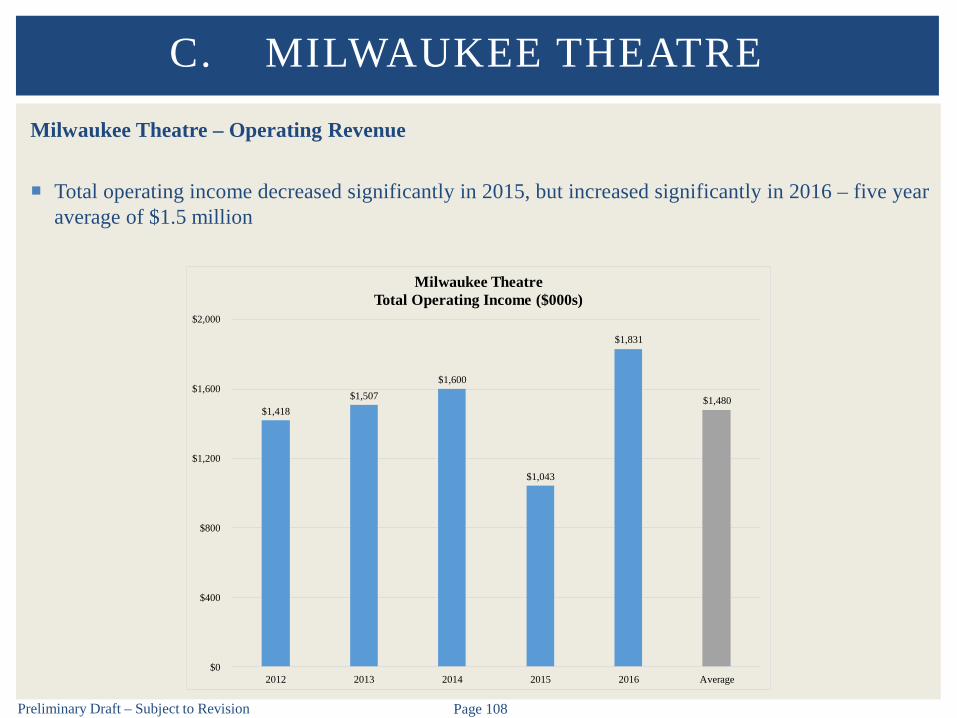
Milwaukee Theatre – Operating Revenue
Total operating income decreased significantly in 2015, but increased significantly in 2016 – five yearaverage of $1.5 million
C. MILWAUKEE THEATRE
$1,418 $1,507
$1,600
$1,043
$1,831
$1,480
$0
$400
$800
$1,200
$1,600
$2,000
2012 2013 2014 2015 2016 Average
Milwaukee TheatreTotal Operating Income ($000s)
Preliminary Draft – Subject to Revision Page 109
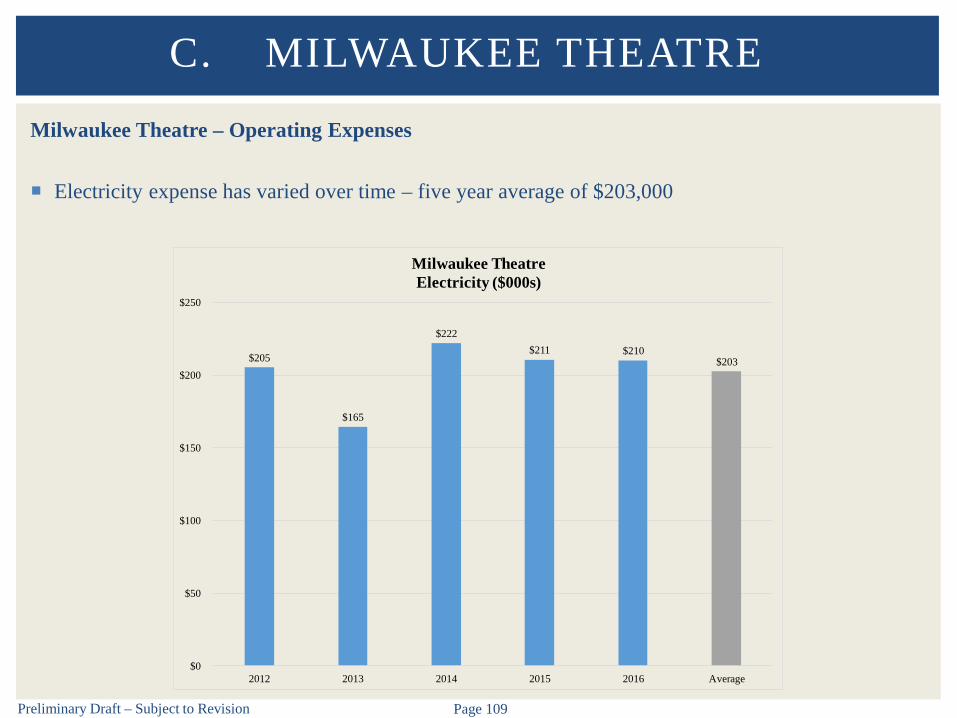
Milwaukee Theatre – Operating Expenses
Electricity expense has varied over time – five year average of $203,000
C. MILWAUKEE THEATRE
$205
$165
$222 $211 $210
$203
$0
$50
$100
$150
$200
$250
2012 2013 2014 2015 2016 Average
Milwaukee TheatreElectricity ($000s)

Preliminary Draft – Subject to Revision Page 110
Milwaukee Theatre – Operating Expenses
Show expense decreased significantly in 2015 – five year average of $285,000
C. MILWAUKEE THEATRE
$341
$458
$374
$93
$160
$285
$0
$100
$200
$300
$400
$500
2012 2013 2014 2015 2016 Average
Milwaukee TheatreShow Expense ($000s)

Preliminary Draft – Subject to Revision Page 111
Milwaukee Theatre – Operating Expenses
Total operating expenses decreased significantly in 2015 – five year average of $751,000
C. MILWAUKEE THEATRE
$760
$909
$1,002
$539 $542
$751
$0
$200
$400
$600
$800
$1,000
$1,200
2012 2013 2014 2015 2016 Average
Milwaukee TheatreTotal Operating Expenses ($000s)

Preliminary Draft – Subject to Revision Page 112
Milwaukee Theatre – Operating Profit Contribution (Before G&A Allocation)
Operating profit contribution had been declining from 2012 to 2015, but increased significantly in2016 – five year average of $729,000
C. MILWAUKEE THEATRE
$658 $598 $598
$504
$1,289
$729
$0
$300
$600
$900
$1,200
$1,500
2012 2013 2014 2015 2016 Average
Milwaukee TheatreOperating Profit Contribution ($000s)

D. CONSOLIDATED STATEMENTS

Preliminary Draft – Subject to Revision Page 114
Revenue Allocation for WCD Facilities
The following table shows the total license agreement fee and food and beverage revenue, as well asthe number of events booked by both the WCD and VISIT Milwaukee from 2012 to 2016 for eventsoccurring at all WCD facilities
In aggregate, WCD bookings averaged 89% of event activity and 71% of revenues from 2012 to 2016
However, the average revenue per event booked by VISIT Milwaukee ($106,000) was more than threetimes that of events booked by WCD ($30,000) during the profiled period
D. CONSOLIDATED STATEMENTS
Year
Total License Agreement Fee
Revenue
Total Food & Beverage Revenue
Grand Total Revenue
Percentage of Grand Total
RevenueTotal Number
of EventsPercentage of
Events
2012 $2,160,367 $4,955,882 $7,116,249 76% 215 89%2013 $1,932,013 $3,976,379 $5,908,392 70% 180 85%2014 $2,162,077 $4,128,706 $6,290,783 63% 210 89%2015 $2,052,832 $3,889,293 $5,942,125 75% 209 90%2016 $2,295,544 $4,641,274 $6,936,818 69% 258 91%
2012 $712,475 $1,582,506 $2,294,981 24% 26 11%2013 $938,366 $1,652,796 $2,591,162 30% 31 15%2014 $1,016,517 $2,690,366 $3,706,883 37% 26 11%2015 $582,620 $1,403,227 $1,985,847 25% 22 10%2016 $897,920 $2,194,953 $3,092,873 31% 24 9%
2012 $2,872,842 $6,538,388 $9,411,230 100% 241 100%2013 $2,870,379 $5,629,175 $8,499,554 100% 211 100%2014 $3,178,594 $6,819,072 $9,997,666 100% 236 100%2015 $2,635,452 $5,292,520 $7,927,972 100% 231 100%2016 $3,193,464 $6,836,227 $10,029,691 100% 282 100%
Note: Data is as of February 2017.
Source: WCD.
Total
Wisconsin Center District
VISIT Milwaukee
Summary of Revenue Allocation for WCD Facilities (2012-2016)

Preliminary Draft – Subject to Revision Page 115
2015 Occupancy – All Three Facilities
The Wisconsin Center’s occupancy was 33% in 2015, which was well below industry standards
The Milwaukee Theatre experienced its highest levels of occupancy in May, October and November,but these levels were under 20% in all other months
UW-Milwaukee Panther Arena’s occupancy declined sharply outside the seasons of its sports tenants
D. CONSOLIDATED STATEMENTS
Jan Feb Mar Apr May Jun Jul Aug Sep Oct Nov Dec YTD0%
20%
40%
60%
80%
Wisconsin Center UW-Milwaukee Panther Arena Milwaukee Theatre
WCD Occupancy by Facility – 2015
Source: WCD.
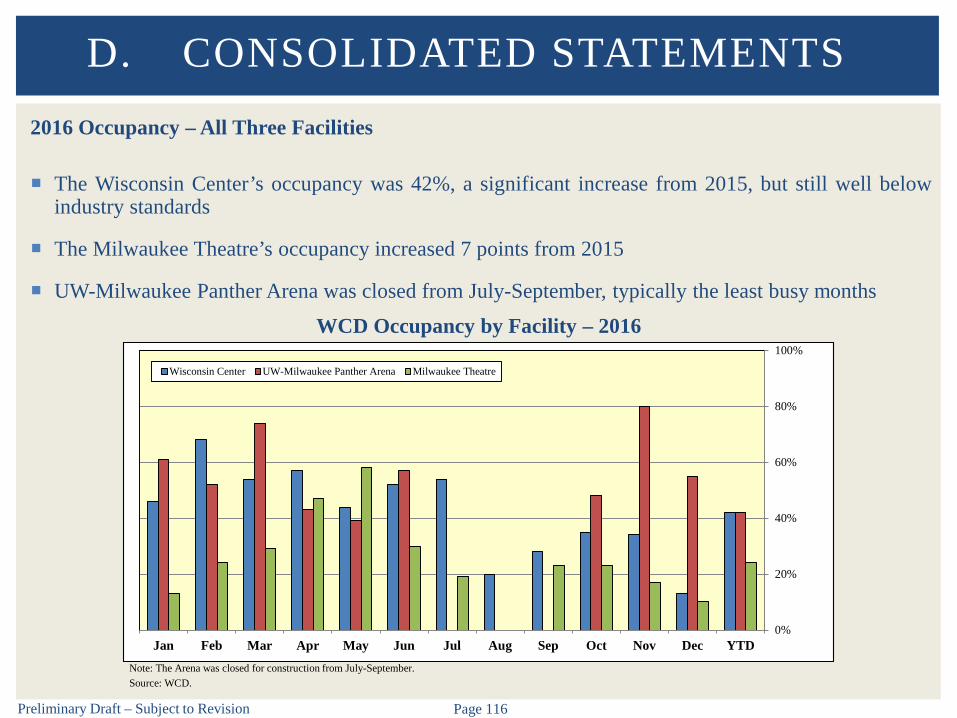
Preliminary Draft – Subject to Revision Page 116
2016 Occupancy – All Three Facilities
The Wisconsin Center’s occupancy was 42%, a significant increase from 2015, but still well belowindustry standards
The Milwaukee Theatre’s occupancy increased 7 points from 2015
UW-Milwaukee Panther Arena was closed from July-September, typically the least busy months
D. CONSOLIDATED STATEMENTS
Jan Feb Mar Apr May Jun Jul Aug Sep Oct Nov Dec YTD0%
20%
40%
60%
80%
100%
Wisconsin Center UW-Milwaukee Panther Arena Milwaukee Theatre
Note: The Arena was closed for construction from July-September.
WCD Occupancy by Facility – 2016
Source: WCD.

Preliminary Draft – Subject to Revision Page 117
Revenue and Expense StatementsConsolidated – Operating(Before G&A Allocation)
On a consolidated basis, the WCD averaged approximately $3.7 million in operating profit from 2012to 2016
Operating income increased by 42% in 2016 22% when excluding $2 million contribution from Admirals
D. CONSOLIDATED STATEMENTS
FYE December 2012 2013 2014 2015 2016 Average CAGR
Total Operating Income $12,110,256 $11,858,625 $13,105,398 $9,983,980 $14,180,184 $12,247,689 4.0%
Total Operating Expenses $9,259,708 $8,837,809 $8,571,872 $7,835,187 $8,592,377 $8,619,391 -1.9%
Operating Revenues Over Expenses $2,850,548 $3,020,816 $4,533,526 $2,148,793 $5,587,807 $3,628,298 18.3%
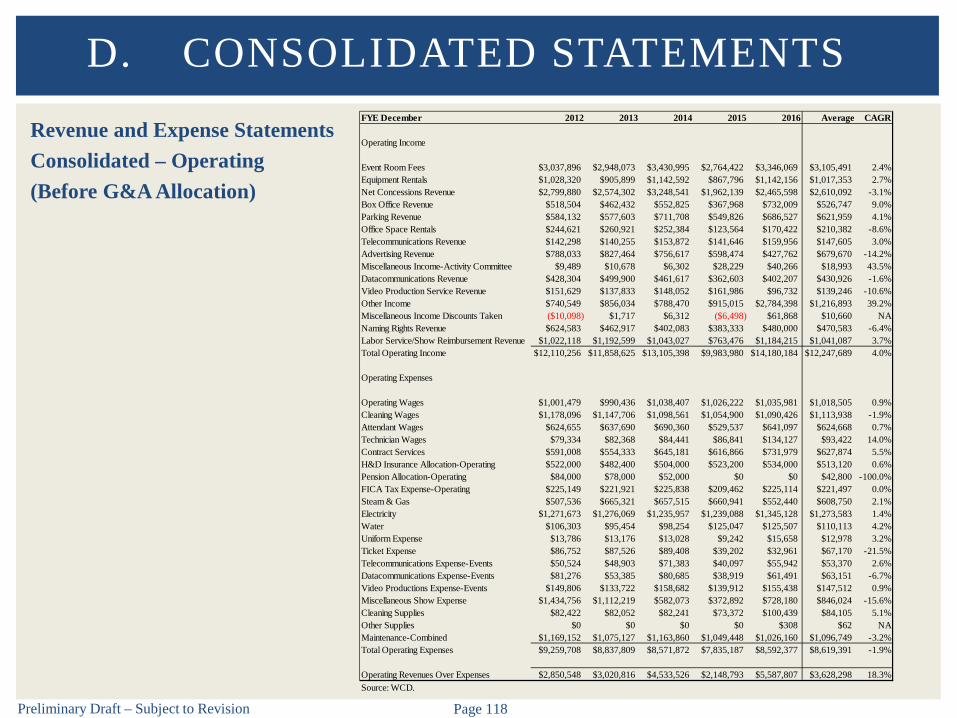
Preliminary Draft – Subject to Revision Page 118
Revenue and Expense StatementsConsolidated – Operating(Before G&A Allocation)
D. CONSOLIDATED STATEMENTSFYE December 2012 2013 2014 2015 2016 Average CAGR
Operating Income
Event Room Fees $3,037,896 $2,948,073 $3,430,995 $2,764,422 $3,346,069 $3,105,491 2.4%Equipment Rentals $1,028,320 $905,899 $1,142,592 $867,796 $1,142,156 $1,017,353 2.7%Net Concessions Revenue $2,799,880 $2,574,302 $3,248,541 $1,962,139 $2,465,598 $2,610,092 -3.1%Box Office Revenue $518,504 $462,432 $552,825 $367,968 $732,009 $526,747 9.0%Parking Revenue $584,132 $577,603 $711,708 $549,826 $686,527 $621,959 4.1%Office Space Rentals $244,621 $260,921 $252,384 $123,564 $170,422 $210,382 -8.6%Telecommunications Revenue $142,298 $140,255 $153,872 $141,646 $159,956 $147,605 3.0%Advertising Revenue $788,033 $827,464 $756,617 $598,474 $427,762 $679,670 -14.2%Miscellaneous Income-Activity Committee $9,489 $10,678 $6,302 $28,229 $40,266 $18,993 43.5%Datacommunications Revenue $428,304 $499,900 $461,617 $362,603 $402,207 $430,926 -1.6%Video Production Service Revenue $151,629 $137,833 $148,052 $161,986 $96,732 $139,246 -10.6%Other Income $740,549 $856,034 $788,470 $915,015 $2,784,398 $1,216,893 39.2%Miscellaneous Income Discounts Taken ($10,098) $1,717 $6,312 ($6,498) $61,868 $10,660 NANaming Rights Revenue $624,583 $462,917 $402,083 $383,333 $480,000 $470,583 -6.4%Labor Service/Show Reimbursement Revenue $1,022,118 $1,192,599 $1,043,027 $763,476 $1,184,215 $1,041,087 3.7%Total Operating Income $12,110,256 $11,858,625 $13,105,398 $9,983,980 $14,180,184 $12,247,689 4.0%
Operating Expenses
Operating Wages $1,001,479 $990,436 $1,038,407 $1,026,222 $1,035,981 $1,018,505 0.9%Cleaning Wages $1,178,096 $1,147,706 $1,098,561 $1,054,900 $1,090,426 $1,113,938 -1.9%Attendant Wages $624,655 $637,690 $690,360 $529,537 $641,097 $624,668 0.7%Technician Wages $79,334 $82,368 $84,441 $86,841 $134,127 $93,422 14.0%Contract Services $591,008 $554,333 $645,181 $616,866 $731,979 $627,874 5.5%H&D Insurance Allocation-Operating $522,000 $482,400 $504,000 $523,200 $534,000 $513,120 0.6%Pension Allocation-Operating $84,000 $78,000 $52,000 $0 $0 $42,800 -100.0%FICA Tax Expense-Operating $225,149 $221,921 $225,838 $209,462 $225,114 $221,497 0.0%Steam & Gas $507,536 $665,321 $657,515 $660,941 $552,440 $608,750 2.1%Electricity $1,271,673 $1,276,069 $1,235,957 $1,239,088 $1,345,128 $1,273,583 1.4%Water $106,303 $95,454 $98,254 $125,047 $125,507 $110,113 4.2%Uniform Expense $13,786 $13,176 $13,028 $9,242 $15,658 $12,978 3.2%Ticket Expense $86,752 $87,526 $89,408 $39,202 $32,961 $67,170 -21.5%Telecommunications Expense-Events $50,524 $48,903 $71,383 $40,097 $55,942 $53,370 2.6%Datacommunications Expense-Events $81,276 $53,385 $80,685 $38,919 $61,491 $63,151 -6.7%Video Productions Expense-Events $149,806 $133,722 $158,682 $139,912 $155,438 $147,512 0.9%Miscellaneous Show Expense $1,434,756 $1,112,219 $582,073 $372,892 $728,180 $846,024 -15.6%Cleaning Supplies $82,422 $82,052 $82,241 $73,372 $100,439 $84,105 5.1%Other Supplies $0 $0 $0 $0 $308 $62 NAMaintenance-Combined $1,169,152 $1,075,127 $1,163,860 $1,049,448 $1,026,160 $1,096,749 -3.2%Total Operating Expenses $9,259,708 $8,837,809 $8,571,872 $7,835,187 $8,592,377 $8,619,391 -1.9%
Operating Revenues Over Expenses $2,850,548 $3,020,816 $4,533,526 $2,148,793 $5,587,807 $3,628,298 18.3%Source: WCD.

Preliminary Draft – Subject to Revision Page 119
Budgeting
The following table compares actual financial data for the WCD to budgeted amounts
D. CONSOLIDATED STATEMENTS
Year 2012 2013 2014 2015 2016ActualOperating Income 12,110,000$ 11,859,000$ 13,105,000$ 9,984,000$ 14,180,000$ Operating Expenses 9,260,000$ 8,838,000$ 8,572,000$ 7,835,000$ 8,592,000$ Operating Profit 2,850,000$ 3,021,000$ 4,533,000$ 2,149,000$ 5,588,000$ % Change 6% 50% -53% 160%
BudgetOperating Income 12,761,000$ 12,883,000$ 12,973,000$ 12,285,000$ 11,093,000$ Operating Expenses 9,343,000$ 9,410,000$ 9,509,000$ 8,971,000$ 8,624,000$ Operating Profit 3,418,000$ 3,473,000$ 3,464,000$ 3,314,000$ 2,469,000$ % Change 2% 0% -4% -25%
Actual vs BudgetOperating Income (651,000)$ (1,024,000)$ 132,000$ (2,301,000)$ 3,087,000$ Operating Expenses (83,000)$ (572,000)$ (937,000)$ (1,136,000)$ (32,000)$ Operating Profit (568,000)$ (452,000)$ 1,069,000$ (1,165,000)$ 3,119,000$ % Change -20% -337% -209% -368%
Note: Amounts are rounded.
Source: WCD.
WCD Financial Comparison - Actual vs. Budget

Preliminary Draft – Subject to Revision Page 120
Revenue and Expense StatementsConsolidated – Operating Revenue
Event room fees increased significantly in 2014 and 2016 – five year average of $3.1 million
D. CONSOLIDATED STATEMENTS
$3,038 $2,948
$3,431
$2,764
$3,346
$3,105
$0
$1,000
$2,000
$3,000
$4,000
2012 2013 2014 2015 2016 Average
ConsolidatedEvent Room Fees ($000s)
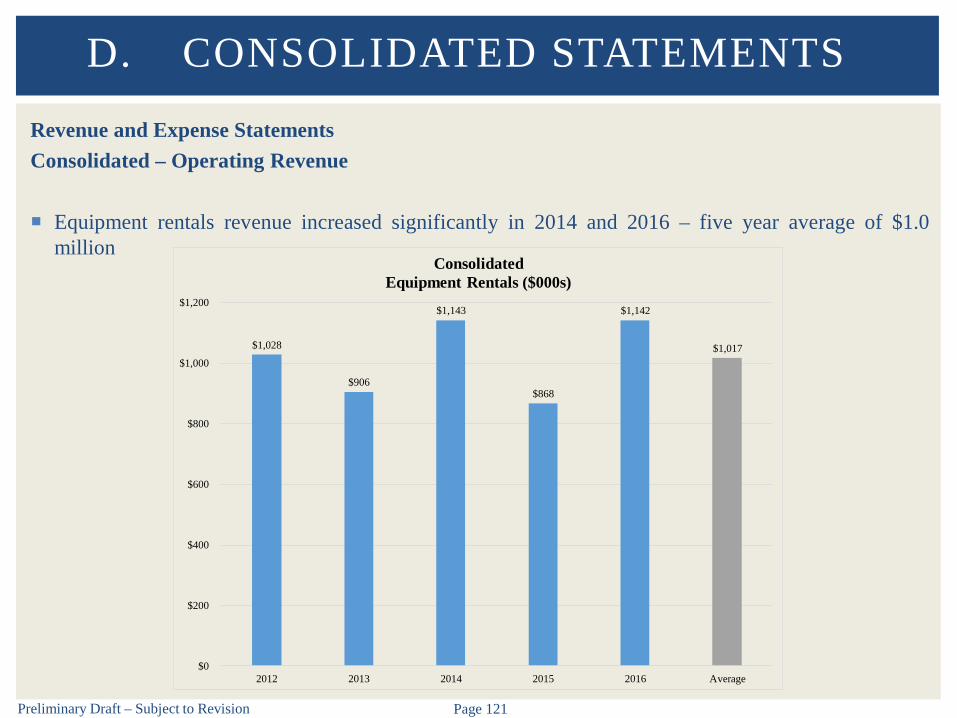
Preliminary Draft – Subject to Revision Page 121
Revenue and Expense StatementsConsolidated – Operating Revenue
Equipment rentals revenue increased significantly in 2014 and 2016 – five year average of $1.0million
D. CONSOLIDATED STATEMENTS
$1,028
$906
$1,143
$868
$1,142
$1,017
$0
$200
$400
$600
$800
$1,000
$1,200
2012 2013 2014 2015 2016 Average
ConsolidatedEquipment Rentals ($000s)

Preliminary Draft – Subject to Revision Page 122
Revenue and Expense StatementsConsolidated – Operating Revenue
Net concessions revenue increased significantly in 2014 and 2016 – five year average of $2.6 million
D. CONSOLIDATED STATEMENTS
$2,800
$2,574
$3,249
$1,962
$2,466 $2,610
$0
$1,000
$2,000
$3,000
$4,000
2012 2013 2014 2015 2016 Average
ConsolidatedNet Concessions Revenue ($000s)

Preliminary Draft – Subject to Revision Page 123
Revenue and Expense StatementsConsolidated – Operating Revenue
Box office revenue increased significantly in 2016 – five year average of $527,000
D. CONSOLIDATED STATEMENTS
$519
$462
$553
$368
$732
$527
$0
$200
$400
$600
$800
2012 2013 2014 2015 2016 Average
ConsolidatedBox Office Revenue ($000s)
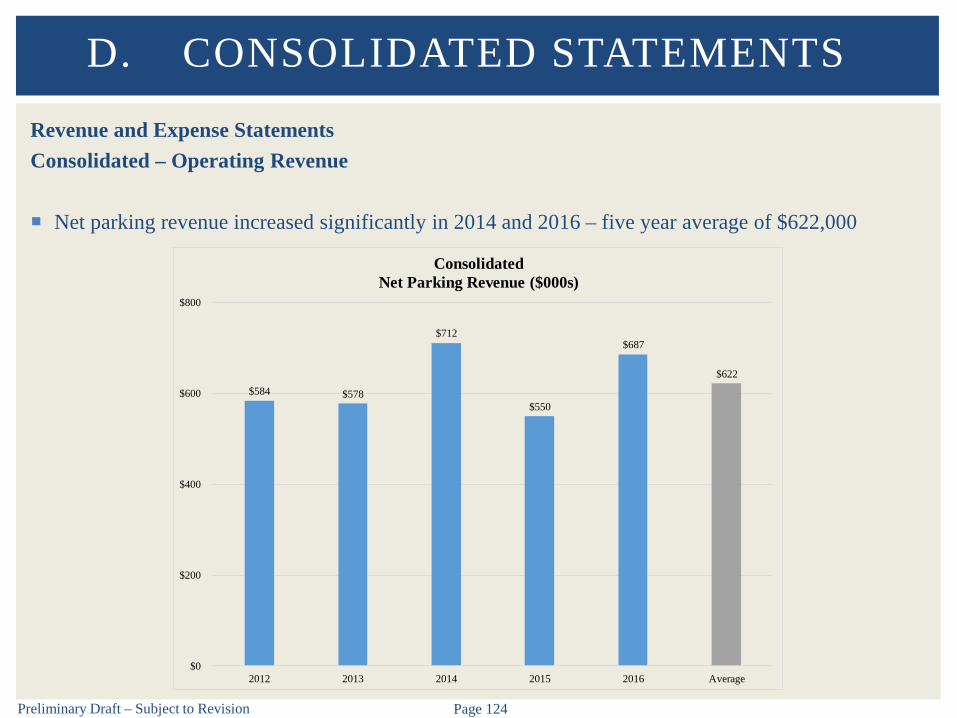
Preliminary Draft – Subject to Revision Page 124
Revenue and Expense StatementsConsolidated – Operating Revenue
Net parking revenue increased significantly in 2014 and 2016 – five year average of $622,000
D. CONSOLIDATED STATEMENTS
$584 $578
$712
$550
$687
$622
$0
$200
$400
$600
$800
2012 2013 2014 2015 2016 Average
ConsolidatedNet Parking Revenue ($000s)
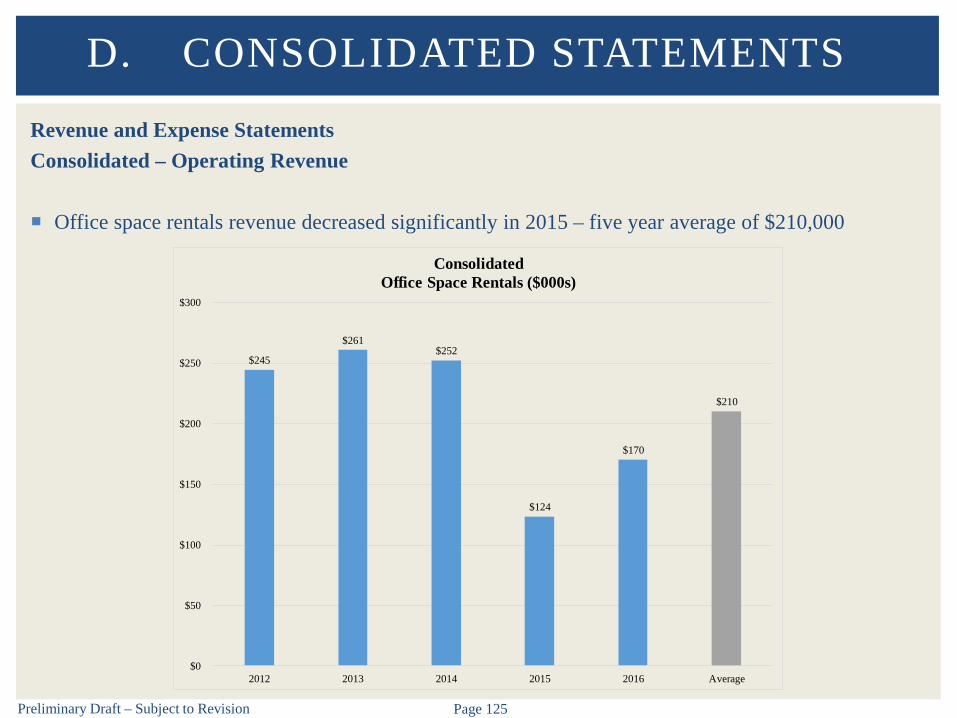
Preliminary Draft – Subject to Revision Page 125
Revenue and Expense StatementsConsolidated – Operating Revenue
Office space rentals revenue decreased significantly in 2015 – five year average of $210,000
D. CONSOLIDATED STATEMENTS
$245
$261 $252
$124
$170
$210
$0
$50
$100
$150
$200
$250
$300
2012 2013 2014 2015 2016 Average
ConsolidatedOffice Space Rentals ($000s)
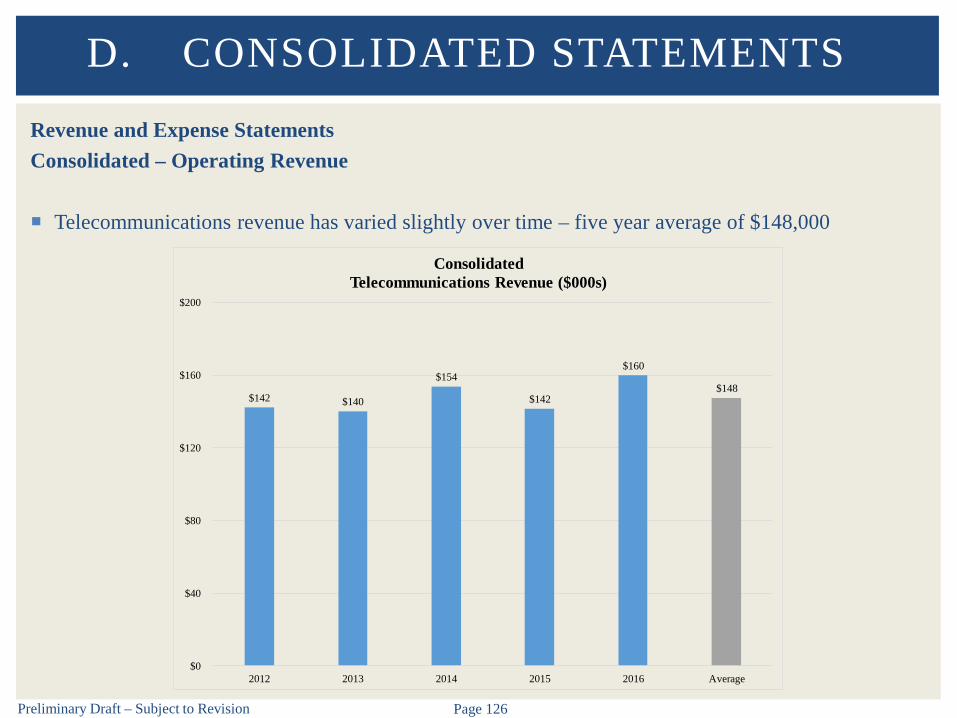
Preliminary Draft – Subject to Revision Page 126
Revenue and Expense StatementsConsolidated – Operating Revenue
Telecommunications revenue has varied slightly over time – five year average of $148,000
D. CONSOLIDATED STATEMENTS
$142 $140
$154
$142
$160
$148
$0
$40
$80
$120
$160
$200
2012 2013 2014 2015 2016 Average
ConsolidatedTelecommunications Revenue ($000s)

Preliminary Draft – Subject to Revision Page 127
Revenue and Expense StatementsConsolidated – Operating Revenue
Advertising revenue has generally declined over time – five year average of $680,000
D. CONSOLIDATED STATEMENTS
$788 $827
$757
$598
$428
$680
$0
$250
$500
$750
$1,000
2012 2013 2014 2015 2016 Average
ConsolidatedAdvertising Revenue ($000s)
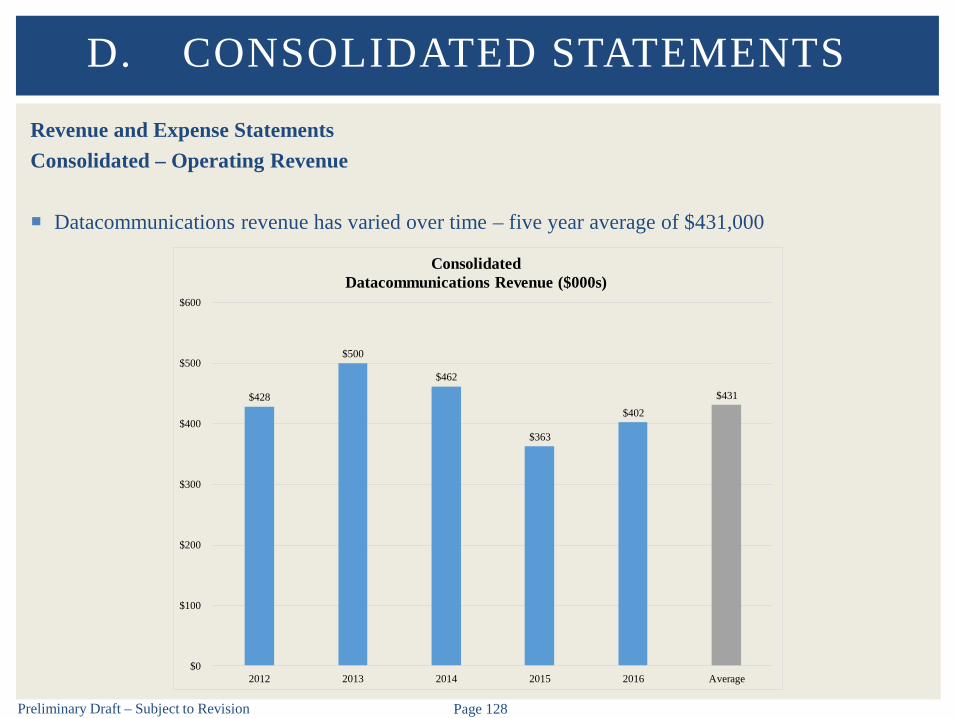
Preliminary Draft – Subject to Revision Page 128
Revenue and Expense StatementsConsolidated – Operating Revenue
Datacommunications revenue has varied over time – five year average of $431,000
D. CONSOLIDATED STATEMENTS
$428
$500
$462
$363
$402 $431
$0
$100
$200
$300
$400
$500
$600
2012 2013 2014 2015 2016 Average
ConsolidatedDatacommunications Revenue ($000s)
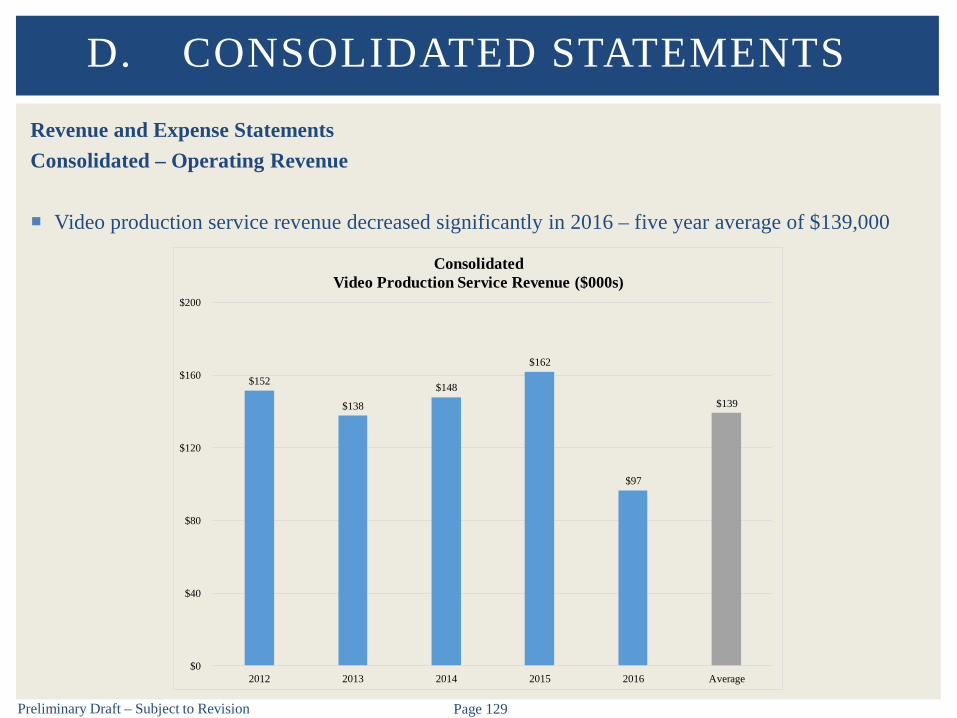
Preliminary Draft – Subject to Revision Page 129
Revenue and Expense StatementsConsolidated – Operating Revenue
Video production service revenue decreased significantly in 2016 – five year average of $139,000
D. CONSOLIDATED STATEMENTS
$152
$138
$148
$162
$97
$139
$0
$40
$80
$120
$160
$200
2012 2013 2014 2015 2016 Average
ConsolidatedVideo Production Service Revenue ($000s)

Preliminary Draft – Subject to Revision Page 130
Revenue and Expense StatementsConsolidated – Operating Revenue
Other income increased significantly in 2016 – five year average of $1.2 million Milwaukee Admirals contributed $2 million in 2016 toward arena upgrades
D. CONSOLIDATED STATEMENTS
$741 $856
$788 $915
$2,784
$1,217
$0
$500
$1,000
$1,500
$2,000
$2,500
$3,000
2012 2013 2014 2015 2016 Average
ConsolidatedOther Income ($000s)
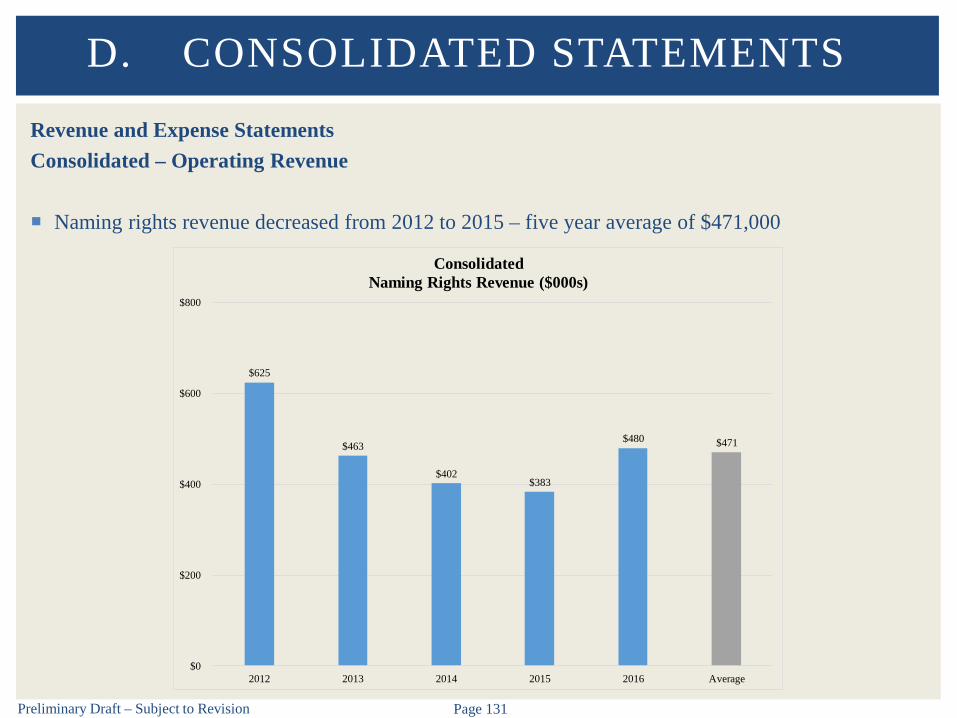
Preliminary Draft – Subject to Revision Page 131
Revenue and Expense StatementsConsolidated – Operating Revenue
Naming rights revenue decreased from 2012 to 2015 – five year average of $471,000
D. CONSOLIDATED STATEMENTS
$625
$463
$402 $383
$480 $471
$0
$200
$400
$600
$800
2012 2013 2014 2015 2016 Average
ConsolidatedNaming Rights Revenue ($000s)
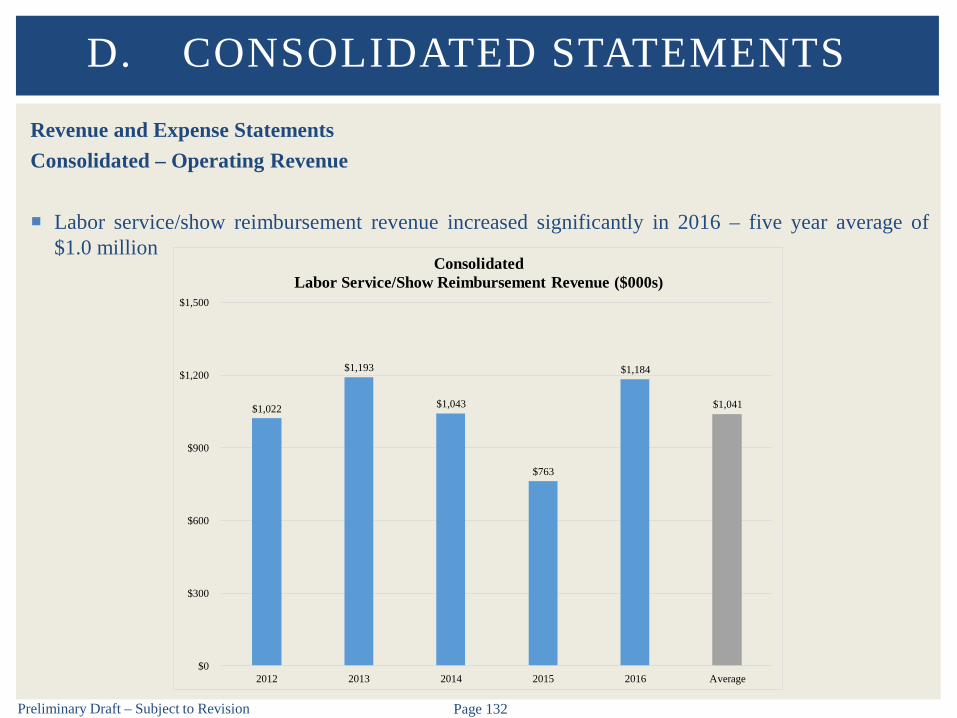
Preliminary Draft – Subject to Revision Page 132
Revenue and Expense StatementsConsolidated – Operating Revenue
Labor service/show reimbursement revenue increased significantly in 2016 – five year average of$1.0 million
D. CONSOLIDATED STATEMENTS
$1,022
$1,193
$1,043
$763
$1,184
$1,041
$0
$300
$600
$900
$1,200
$1,500
2012 2013 2014 2015 2016 Average
ConsolidatedLabor Service/Show Reimbursement Revenue ($000s)
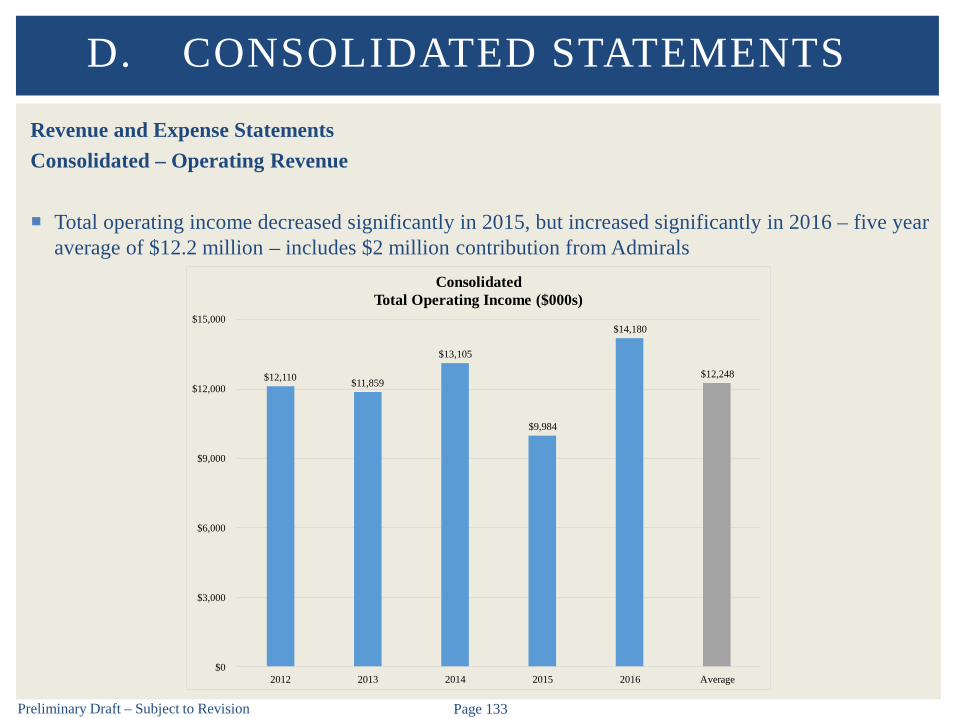
Preliminary Draft – Subject to Revision Page 133
Revenue and Expense StatementsConsolidated – Operating Revenue
Total operating income decreased significantly in 2015, but increased significantly in 2016 – five yearaverage of $12.2 million – includes $2 million contribution from Admirals
D. CONSOLIDATED STATEMENTS
$12,110 $11,859
$13,105
$9,984
$14,180
$12,248
$0
$3,000
$6,000
$9,000
$12,000
$15,000
2012 2013 2014 2015 2016 Average
ConsolidatedTotal Operating Income ($000s)

Preliminary Draft – Subject to Revision Page 134
Revenue and Expense StatementsConsolidated – Operating Expenses
Operating wages have remained relatively constant over time – five year average of $1.0 million
D. CONSOLIDATED STATEMENTS
$1,001 $990 $1,038 $1,026 $1,036 $1,019
$0
$300
$600
$900
$1,200
$1,500
2012 2013 2014 2015 2016 Average
ConsolidatedOperating Wages ($000s)

Preliminary Draft – Subject to Revision Page 135
Revenue and Expense StatementsConsolidated – Operating Expenses
Cleaning wages have remained relatively constant over time – five year average of $1.1 million
D. CONSOLIDATED STATEMENTS
$1,178 $1,148
$1,099 $1,055
$1,090 $1,114
$0
$300
$600
$900
$1,200
$1,500
2012 2013 2014 2015 2016 Average
ConsolidatedCleaning Wages ($000s)
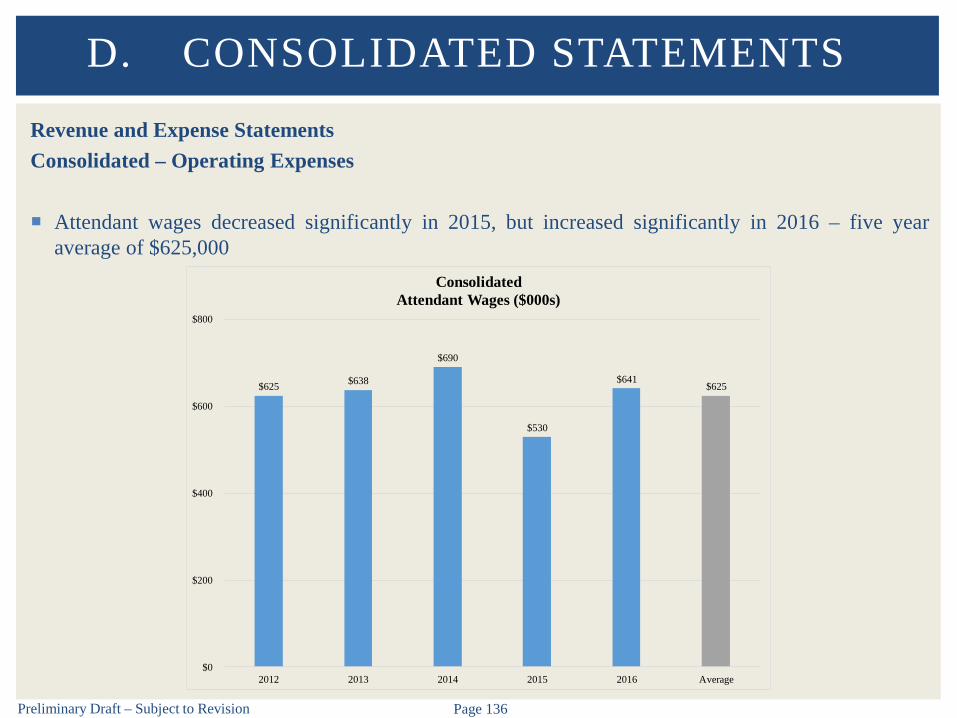
Preliminary Draft – Subject to Revision Page 136
Revenue and Expense StatementsConsolidated – Operating Expenses
Attendant wages decreased significantly in 2015, but increased significantly in 2016 – five yearaverage of $625,000
D. CONSOLIDATED STATEMENTS
$625 $638
$690
$530
$641 $625
$0
$200
$400
$600
$800
2012 2013 2014 2015 2016 Average
ConsolidatedAttendant Wages ($000s)
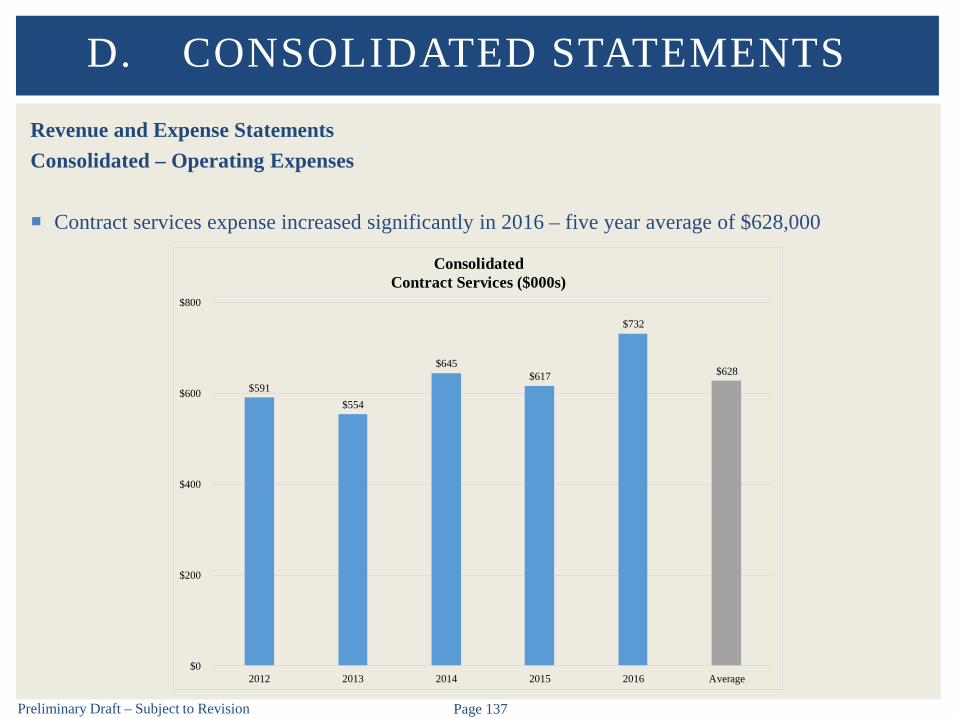
Preliminary Draft – Subject to Revision Page 137
Revenue and Expense StatementsConsolidated – Operating Expenses
Contract services expense increased significantly in 2016 – five year average of $628,000
D. CONSOLIDATED STATEMENTS
$591 $554
$645 $617
$732
$628
$0
$200
$400
$600
$800
2012 2013 2014 2015 2016 Average
ConsolidatedContract Services ($000s)

Preliminary Draft – Subject to Revision Page 138
Revenue and Expense StatementsConsolidated – Operating Expenses
H&D Insurance allocation has increased somewhat since 2013 – five year average of $513,000
D. CONSOLIDATED STATEMENTS
$522
$482 $504
$523 $534 $513
$0
$100
$200
$300
$400
$500
$600
2012 2013 2014 2015 2016 Average
ConsolidatedH&D Insurance Allocation-Operating ($000s)

Preliminary Draft – Subject to Revision Page 139
Revenue and Expense StatementsConsolidated – Operating Expenses
FICA tax expense-operating has varied over time – five year average of $221,000
D. CONSOLIDATED STATEMENTS
$225 $222 $226
$209
$225 $221
$0
$50
$100
$150
$200
$250
2012 2013 2014 2015 2016 Average
ConsolidatedFICA Tax Expense-Operating ($000s)
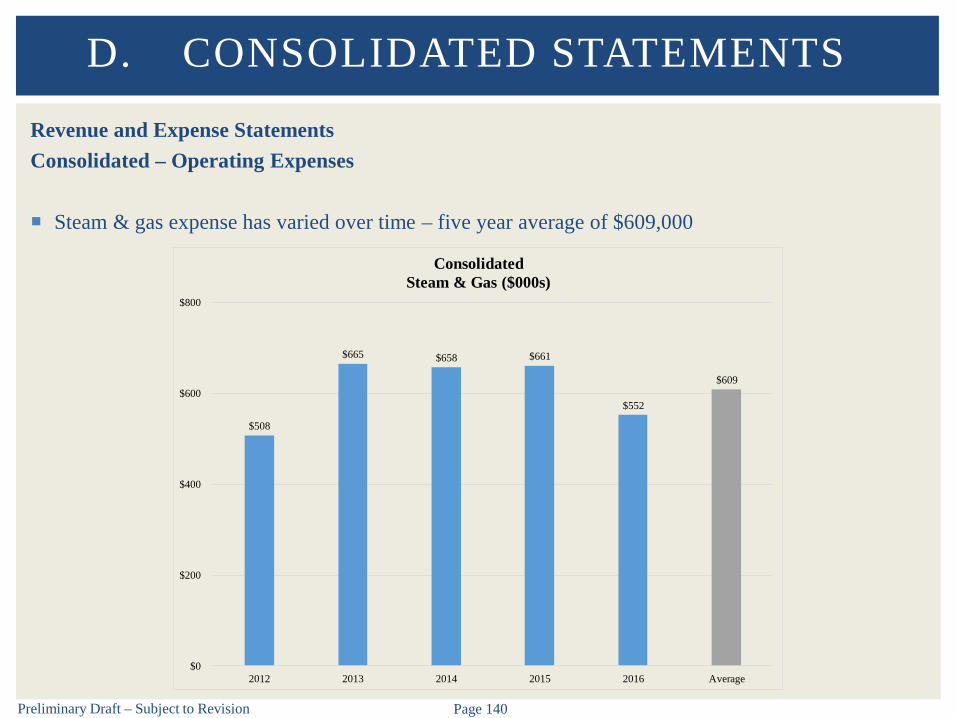
Preliminary Draft – Subject to Revision Page 140
Revenue and Expense StatementsConsolidated – Operating Expenses
Steam & gas expense has varied over time – five year average of $609,000
D. CONSOLIDATED STATEMENTS
$508
$665 $658 $661
$552
$609
$0
$200
$400
$600
$800
2012 2013 2014 2015 2016 Average
ConsolidatedSteam & Gas ($000s)
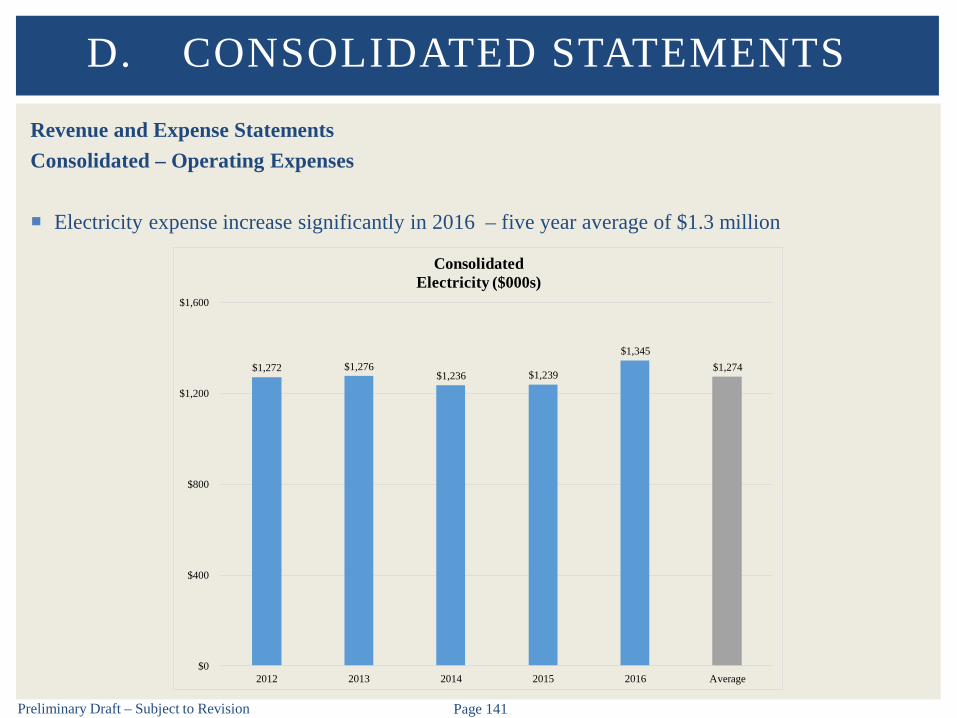
Preliminary Draft – Subject to Revision Page 141
Revenue and Expense StatementsConsolidated – Operating Expenses
Electricity expense increase significantly in 2016 – five year average of $1.3 million
D. CONSOLIDATED STATEMENTS
$1,272 $1,276 $1,236 $1,239
$1,345 $1,274
$0
$400
$800
$1,200
$1,600
2012 2013 2014 2015 2016 Average
ConsolidatedElectricity ($000s)
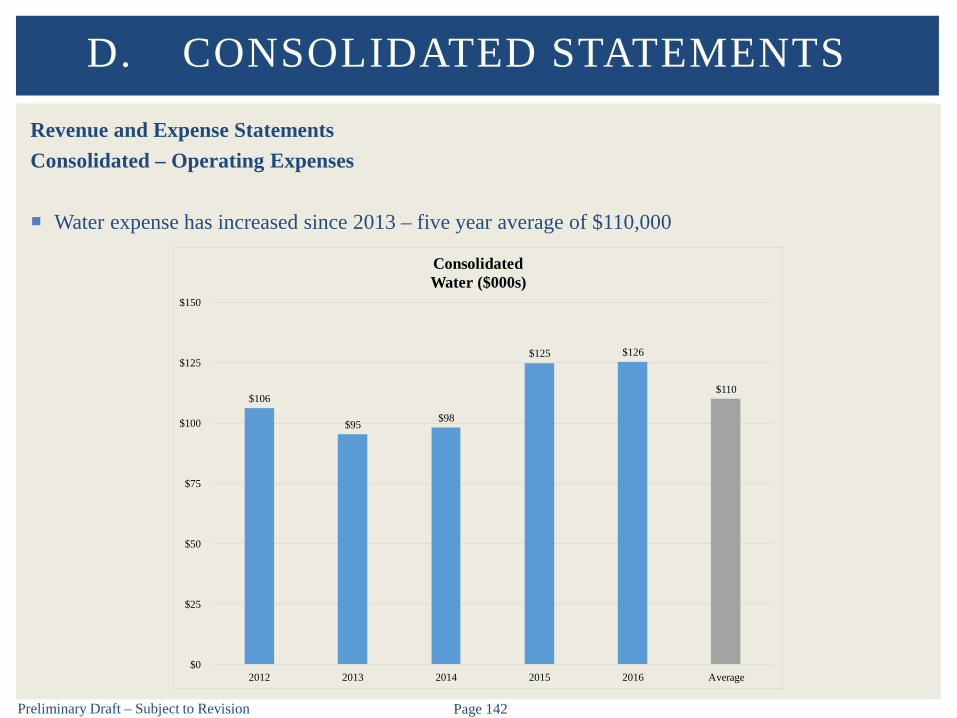
Preliminary Draft – Subject to Revision Page 142
Revenue and Expense StatementsConsolidated – Operating Expenses
Water expense has increased since 2013 – five year average of $110,000
D. CONSOLIDATED STATEMENTS
$106
$95 $98
$125 $126
$110
$0
$25
$50
$75
$100
$125
$150
2012 2013 2014 2015 2016 Average
ConsolidatedWater ($000s)

Preliminary Draft – Subject to Revision Page 143
Revenue and Expense StatementsConsolidated – Operating Expenses
Video productions-events expense has varied over time – five year average of $148,000
D. CONSOLIDATED STATEMENTS
$150
$134
$159
$140
$155 $148
$0
$40
$80
$120
$160
$200
2012 2013 2014 2015 2016 Average
ConsolidatedVideo Productions-Events ($000s)
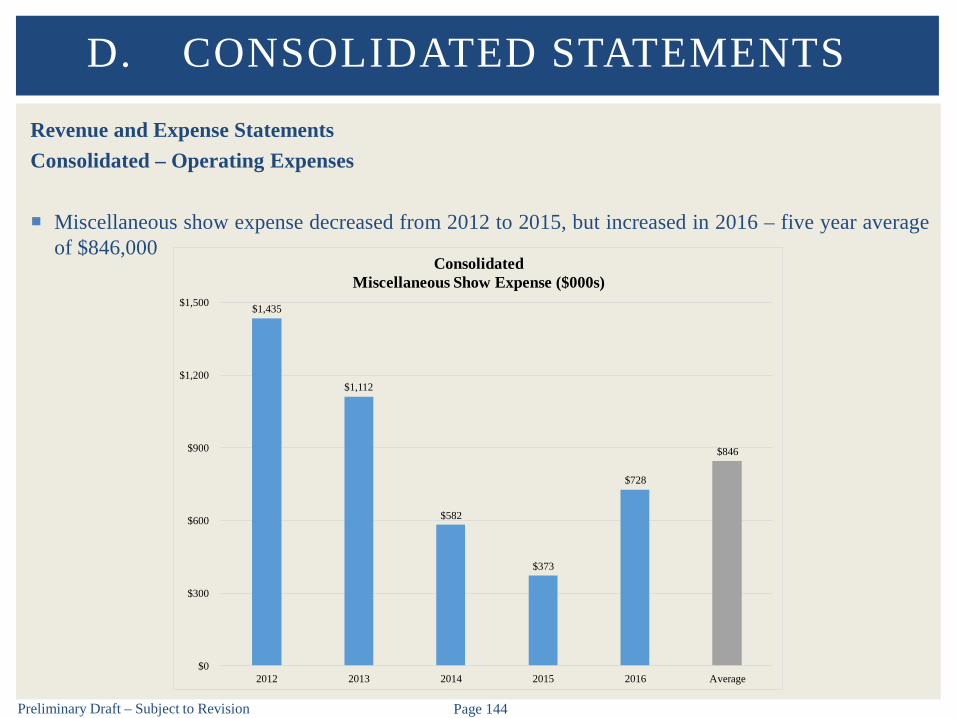
Preliminary Draft – Subject to Revision Page 144
Revenue and Expense StatementsConsolidated – Operating Expenses
Miscellaneous show expense decreased from 2012 to 2015, but increased in 2016 – five year averageof $846,000
D. CONSOLIDATED STATEMENTS
$1,435
$1,112
$582
$373
$728
$846
$0
$300
$600
$900
$1,200
$1,500
2012 2013 2014 2015 2016 Average
ConsolidatedMiscellaneous Show Expense ($000s)

Preliminary Draft – Subject to Revision Page 145
Revenue and Expense StatementsConsolidated – Operating Expenses
Maintenance-combined expense has decreased since 2014 – five year average of $1.1 million
D. CONSOLIDATED STATEMENTS
$1,169
$1,075
$1,164
$1,049 $1,026 $1,097
$0
$300
$600
$900
$1,200
$1,500
2012 2013 2014 2015 2016 Average
ConsolidatedMaintenance-Combined ($000s)
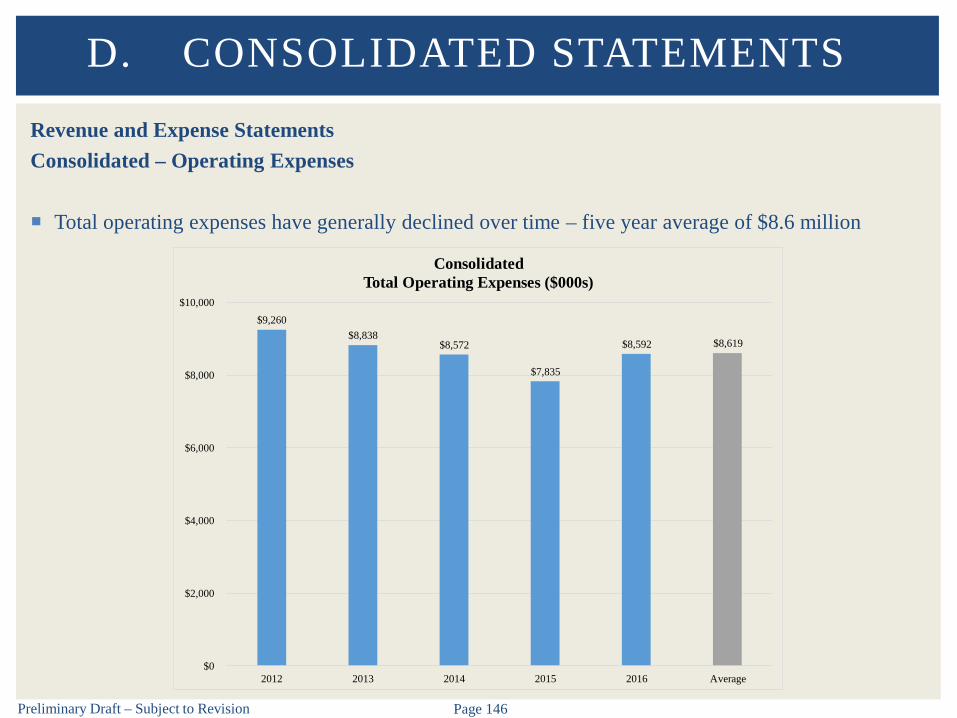
Preliminary Draft – Subject to Revision Page 146
Revenue and Expense StatementsConsolidated – Operating Expenses
Total operating expenses have generally declined over time – five year average of $8.6 million
D. CONSOLIDATED STATEMENTS
$9,260 $8,838
$8,572
$7,835
$8,592 $8,619
$0
$2,000
$4,000
$6,000
$8,000
$10,000
2012 2013 2014 2015 2016 Average
ConsolidatedTotal Operating Expenses ($000s)
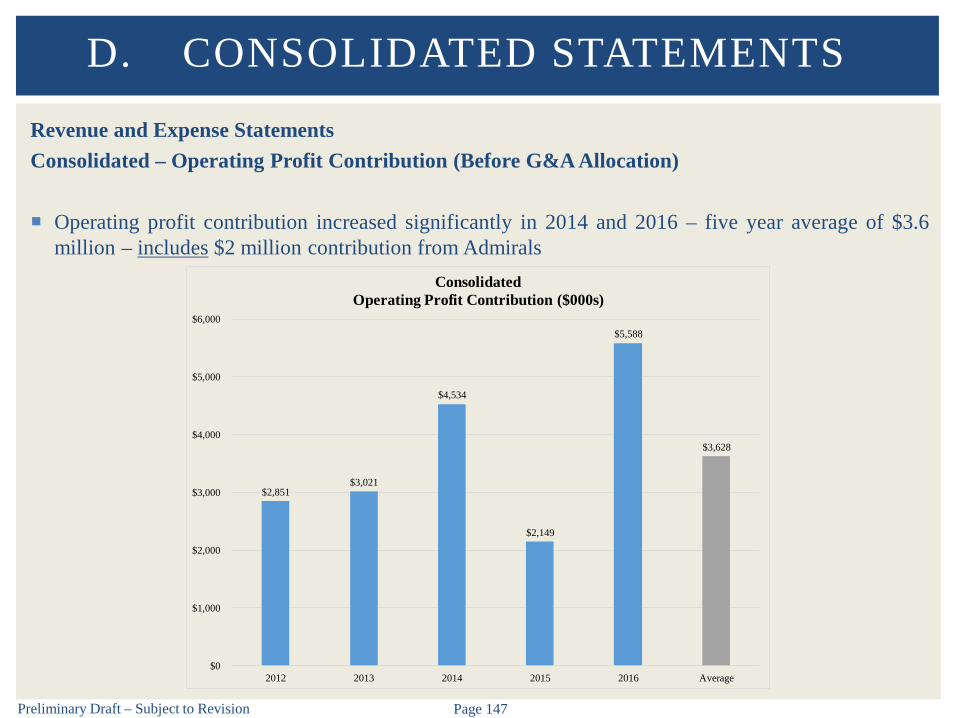
Preliminary Draft – Subject to Revision Page 147
Revenue and Expense StatementsConsolidated – Operating Profit Contribution (Before G&A Allocation)
Operating profit contribution increased significantly in 2014 and 2016 – five year average of $3.6million – includes $2 million contribution from Admirals
D. CONSOLIDATED STATEMENTS
$2,851 $3,021
$4,534
$2,149
$5,588
$3,628
$0
$1,000
$2,000
$3,000
$4,000
$5,000
$6,000
2012 2013 2014 2015 2016 Average
ConsolidatedOperating Profit Contribution ($000s)
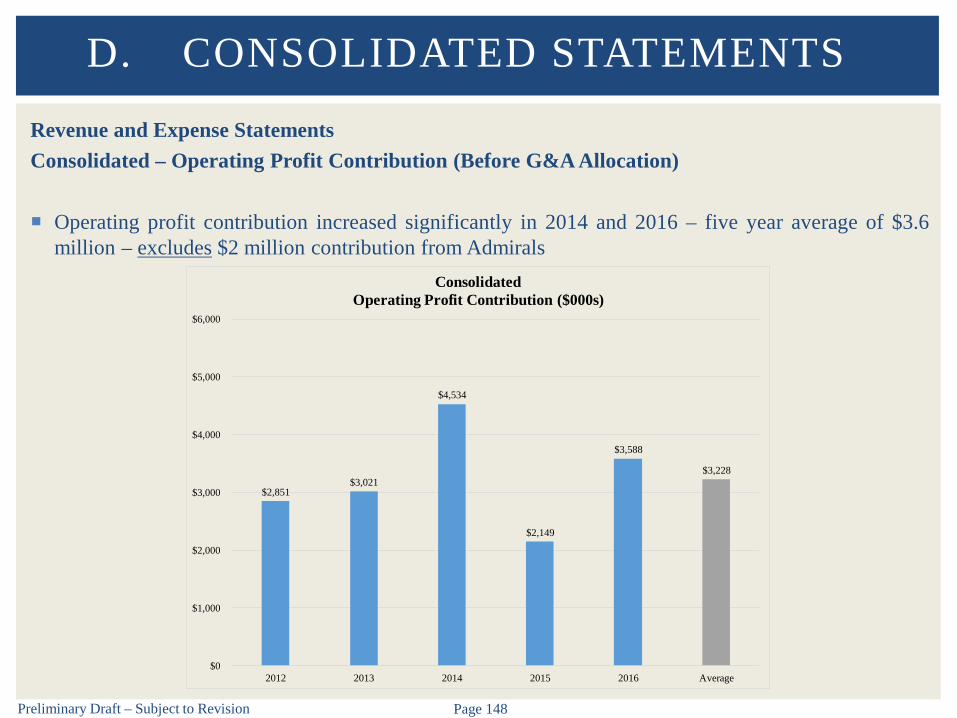
Preliminary Draft – Subject to Revision Page 148
Revenue and Expense StatementsConsolidated – Operating Profit Contribution (Before G&A Allocation)
Operating profit contribution increased significantly in 2014 and 2016 – five year average of $3.6million – excludes $2 million contribution from Admirals
D. CONSOLIDATED STATEMENTS
$2,851 $3,021
$4,534
$2,149
$3,588
$3,228
$0
$1,000
$2,000
$3,000
$4,000
$5,000
$6,000
2012 2013 2014 2015 2016 Average
ConsolidatedOperating Profit Contribution ($000s)
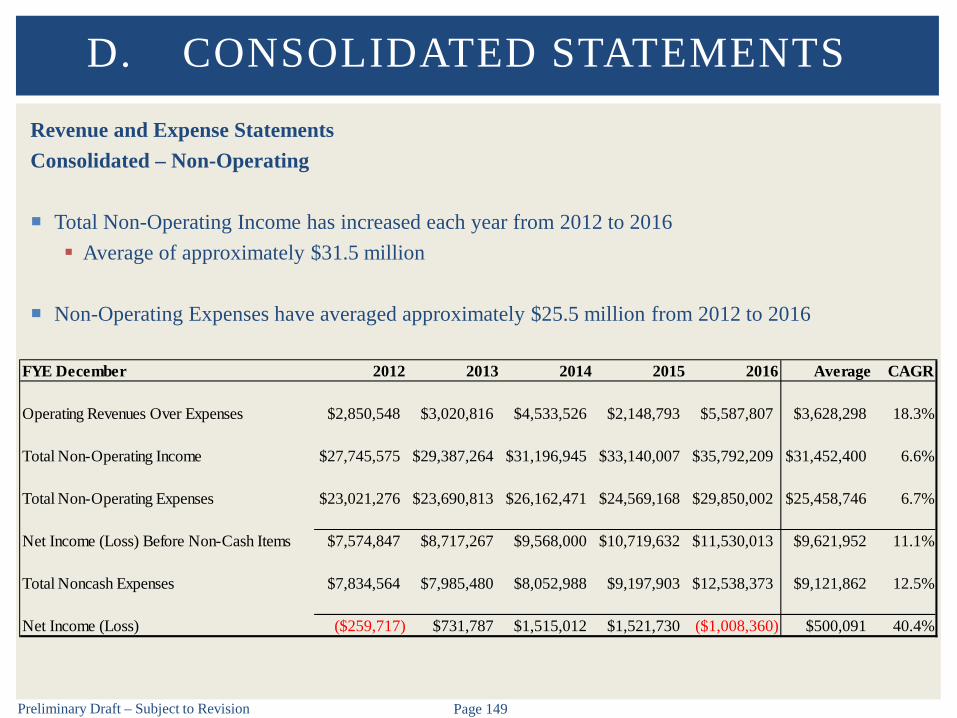
Preliminary Draft – Subject to Revision Page 149
Revenue and Expense StatementsConsolidated – Non-Operating
Total Non-Operating Income has increased each year from 2012 to 2016 Average of approximately $31.5 million
Non-Operating Expenses have averaged approximately $25.5 million from 2012 to 2016
D. CONSOLIDATED STATEMENTS
FYE December 2012 2013 2014 2015 2016 Average CAGR
Operating Revenues Over Expenses $2,850,548 $3,020,816 $4,533,526 $2,148,793 $5,587,807 $3,628,298 18.3%
Total Non-Operating Income $27,745,575 $29,387,264 $31,196,945 $33,140,007 $35,792,209 $31,452,400 6.6%
Total Non-Operating Expenses $23,021,276 $23,690,813 $26,162,471 $24,569,168 $29,850,002 $25,458,746 6.7%
Net Income (Loss) Before Non-Cash Items $7,574,847 $8,717,267 $9,568,000 $10,719,632 $11,530,013 $9,621,952 11.1%
Total Noncash Expenses $7,834,564 $7,985,480 $8,052,988 $9,197,903 $12,538,373 $9,121,862 12.5%
Net Income (Loss) ($259,717) $731,787 $1,515,012 $1,521,730 ($1,008,360) $500,091 40.4%

Preliminary Draft – Subject to Revision Page 150
Revenue and Expense StatementsConsolidated – Non-Operating
D. CONSOLIDATED STATEMENTSFYE December 2012 2013 2014 2015 2016 Average CAGROperating Revenues Over Expenses $2,850,548 $3,020,816 $4,533,526 $2,148,793 $5,587,807 $3,628,298 18.3%
Non-Operating IncomeCity Room Tax $10,482,184 $11,395,906 $12,344,695 $13,240,998 $13,758,711 $12,244,499 7.0%County Room Tax $4,908,284 $5,307,845 $5,643,580 $6,075,990 $6,382,660 $5,663,672 6.8%Food & Beverage Tax $9,405,832 $9,624,199 $10,004,053 $10,653,854 $10,884,597 $10,114,507 3.7%Car Rental Tax $2,414,379 $2,389,031 $2,595,397 $2,642,869 $2,697,401 $2,547,815 2.8%Tax Revenue Administration Fee ($693,872) ($732,283) ($779,987) ($831,650) ($859,919) ($779,542) 5.5%Interest Income $1,228,768 $1,402,565 $1,389,206 $1,357,946 $2,928,759 $1,661,449 24.3%Total Non-Operating Income $27,745,575 $29,387,264 $31,196,945 $33,140,007 $35,792,209 $31,452,400 6.6%
Non-Operating ExpensesAdministrative Wages $2,147,840 $2,180,285 $2,183,457 $2,148,987 $2,309,908 $2,194,095 1.8%FICA Taxes $152,455 $155,937 $160,566 $152,379 $164,921 $157,251 2.0%Unemployment Taxes $54,698 $66,612 $59,668 $34,008 $22,651 $47,527 -19.8%Health Insurance $686,384 $384,300 $570,327 $643,404 $505,307 $557,944 -7.4%Health Insurance-Employee Contribution ($52,831) ($55,675) ($66,463) ($72,892) ($63,763) ($62,325) 4.8%Life Insurance $17,195 $20,559 $12,107 $10,647 $11,478 $14,397 -9.6%Pension $344,879 $352,532 $379,112 $390,158 $375,143 $368,365 2.1%Advertising $112,079 $137,127 $166,378 $86,319 $125,041 $125,389 2.8%Promotional Items $31,264 $17,609 $48,347 $1,458 $1,937 $20,123 -50.1%Visit Milwaukee Management Fee $5,835,049 $6,038,419 $8,257,673 $7,039,365 $7,214,809 $6,877,063 5.4%Maintenance-Copier/Fax/Software $1,880 $2,086 $138 $0 $0 $821 -100.0%Office Supplies $7,616 $16,441 $15,143 $11,210 $18,488 $13,780 24.8%Legal Services $23,959 $47,176 $48,201 $58,238 $194,989 $74,513 68.9%Professional Services $107,068 $64,695 $98,619 $81,577 $102,739 $90,939 -1.0%Information Technology Expense $233,316 $255,851 $324,660 $299,783 $287,038 $280,129 5.3%Signage for Advertisers $760 $440 $0 $0 $0 $240 -100.0%Insurance $525,645 $549,087 $579,731 $615,530 $600,022 $574,003 3.4%Employee Activity Expense $8,052 $10,550 $7,886 $26,559 $20,655 $14,741 26.6%Interest Expense $40,060 $29,278 $31,262 $57,978 $45,193 $40,754 3.1%Bond Interest Expense $12,549,422 $13,226,445 $13,039,249 $12,729,423 $17,584,679 $13,825,844 8.8%Travel $12,293 $18,955 $21,806 $25,851 $15,394 $18,860 5.8%Business Meetings $10,673 $15,115 $29,064 $32,798 $29,467 $23,423 28.9%Postage $17,103 $14,191 $16,268 $8,698 $9,704 $13,193 -13.2%Recruiting $13,573 $11,023 $11,368 $7,462 $28,785 $14,442 20.7%Training Expense $7,237 $3,301 $3,051 $12,796 $5,221 $6,321 -7.8%Dues & Subscriptions $4,886 $4,638 $7,696 $38,004 $55,839 $22,213 83.9%Bad Debt Expense $24,000 $24,000 $24,000 $24,000 $24,000 $24,000 0.0%Miscellaneous Expense $104,722 $99,837 $133,158 $105,427 $160,360 $120,701 11.2%Total Non-Operating Expenses $23,021,276 $23,690,813 $26,162,471 $24,569,168 $29,850,002 $25,458,746 6.7%
Net Income (Loss) Before Non-Cash Items $7,574,847 $8,717,267 $9,568,000 $10,719,632 $11,530,013 $9,621,952 11.1%
Noncash ExpensesDepreciation Expense $7,689,554 $7,790,624 $7,886,232 $8,271,670 $8,633,875 $8,054,391 2.9%Amortization-Financing Costs $55,453 $105,299 $77,198 $836,676 $3,795,239 $973,973 187.6%Amortization Expense-Surety Bond $89,557 $89,557 $89,557 $89,557 $109,259 $93,498 5.1%Total Noncash Expenses $7,834,564 $7,985,480 $8,052,988 $9,197,903 $12,538,373 $9,121,862 12.5%
Net Income (Loss) ($259,717) $731,787 $1,515,012 $1,521,730 ($1,008,360) $500,091 40.4%Source: WCD.

Preliminary Draft – Subject to Revision Page 151
Revenue and Expense StatementsConsolidated – Non-Operating Income
Non-operating income has generally increased over time – five year average of $31.4 million
D. CONSOLIDATED STATEMENTS
$10,482 $11,396
$12,345 $13,241
$13,759
$4,908 $5,308 $5,644
$6,076 $6,383
$9,406 $9,624 $10,004 $10,654 $10,885
$2,414 $2,389 $2,595 $2,643
$2,697 $1,229 $1,403 $1,389 $1,358
$2,929
($694) ($732) ($780) ($832) ($860)
($3,000)
$0
$3,000
$6,000
$9,000
$12,000
$15,000
2012 2013 2014 2015 2016
ConsolidatedNon-Operating Income ($000s)
City Room Tax County Room Tax Food & Beverage TaxCar Rental Tax Interest Income Tax Revenue Administration Fee
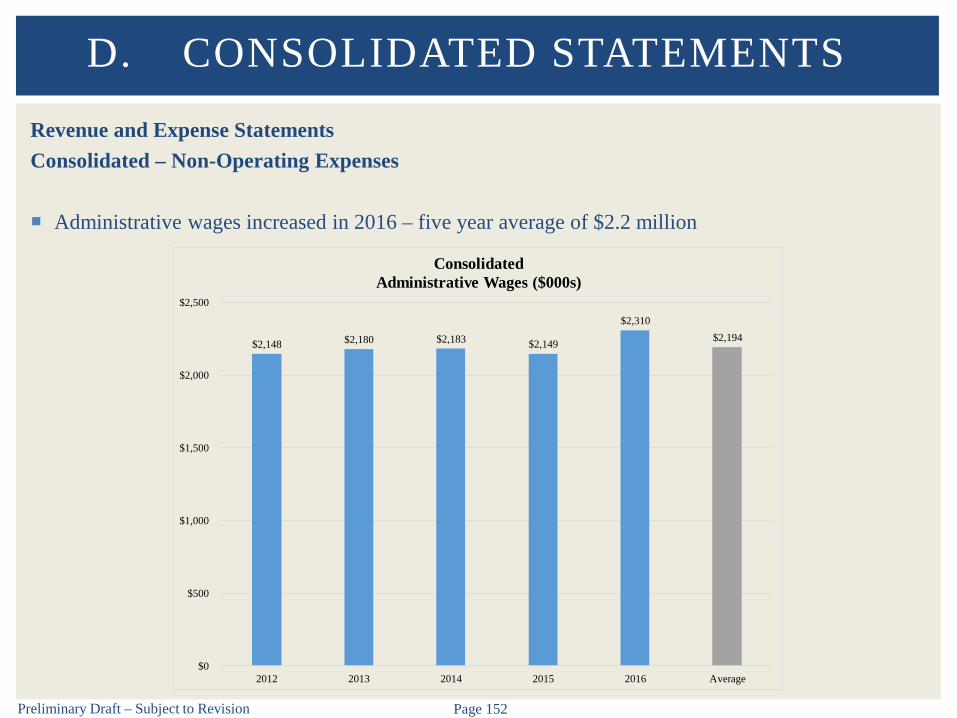
Preliminary Draft – Subject to Revision Page 152
Revenue and Expense StatementsConsolidated – Non-Operating Expenses
Administrative wages increased in 2016 – five year average of $2.2 million
D. CONSOLIDATED STATEMENTS
$2,148 $2,180 $2,183 $2,149
$2,310 $2,194
$0
$500
$1,000
$1,500
$2,000
$2,500
2012 2013 2014 2015 2016 Average
ConsolidatedAdministrative Wages ($000s)

Preliminary Draft – Subject to Revision Page 153
Revenue and Expense StatementsConsolidated – Non-Operating Expenses
FICA taxes have varied over time – five year average of $157,000
D. CONSOLIDATED STATEMENTS
$152 $156 $161
$152
$165 $157
$0
$40
$80
$120
$160
$200
2012 2013 2014 2015 2016 Average
ConsolidatedFICA Taxes ($000s)

Preliminary Draft – Subject to Revision Page 154
Revenue and Expense StatementsConsolidated – Non-Operating Expenses
Health insurance expense decreased significantly in 2013 – five year average of $558,000
D. CONSOLIDATED STATEMENTS
$686
$384
$570
$643
$505
$558
$0
$200
$400
$600
$800
2012 2013 2014 2015 2016 Average
ConsolidatedHealth Insurance ($000s)

Preliminary Draft – Subject to Revision Page 155
Revenue and Expense StatementsConsolidated – Non-Operating Expenses
Pension expense increased until 2015 then decreased in 2016 – five year average of $368,000
D. CONSOLIDATED STATEMENTS
$345 $353
$379 $390
$375 $368
$0
$100
$200
$300
$400
$500
2012 2013 2014 2015 2016 Average
ConsolidatedPension ($000s)

Preliminary Draft – Subject to Revision Page 156
Revenue and Expense StatementsConsolidated – Non-Operating Expenses
Advertising expense decreased significantly in 2015 – five year average of $125,000
D. CONSOLIDATED STATEMENTS
$112
$137
$166
$86
$125 $125
$0
$40
$80
$120
$160
$200
2012 2013 2014 2015 2016 Average
ConsolidatedAdvertising ($000s)
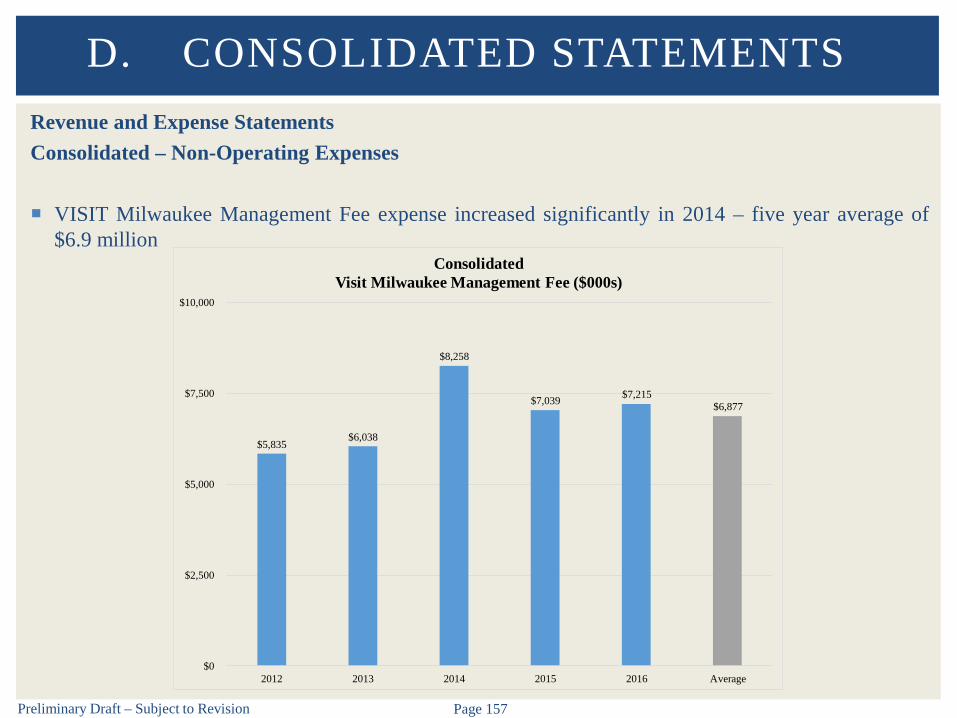
Preliminary Draft – Subject to Revision Page 157
Revenue and Expense StatementsConsolidated – Non-Operating Expenses
VISIT Milwaukee Management Fee expense increased significantly in 2014 – five year average of$6.9 million
D. CONSOLIDATED STATEMENTS
$5,835 $6,038
$8,258
$7,039 $7,215 $6,877
$0
$2,500
$5,000
$7,500
$10,000
2012 2013 2014 2015 2016 Average
ConsolidatedVisit Milwaukee Management Fee ($000s)

Preliminary Draft – Subject to Revision Page 158
Revenue and Expense StatementsConsolidated – Non-Operating Expenses
Information technology expense has varied over time – five year average of $280,000
D. CONSOLIDATED STATEMENTS
$233
$256
$325
$300 $287 $280
$0
$100
$200
$300
$400
2012 2013 2014 2015 2016 Average
ConsolidatedInformation Technology Expense ($000s)
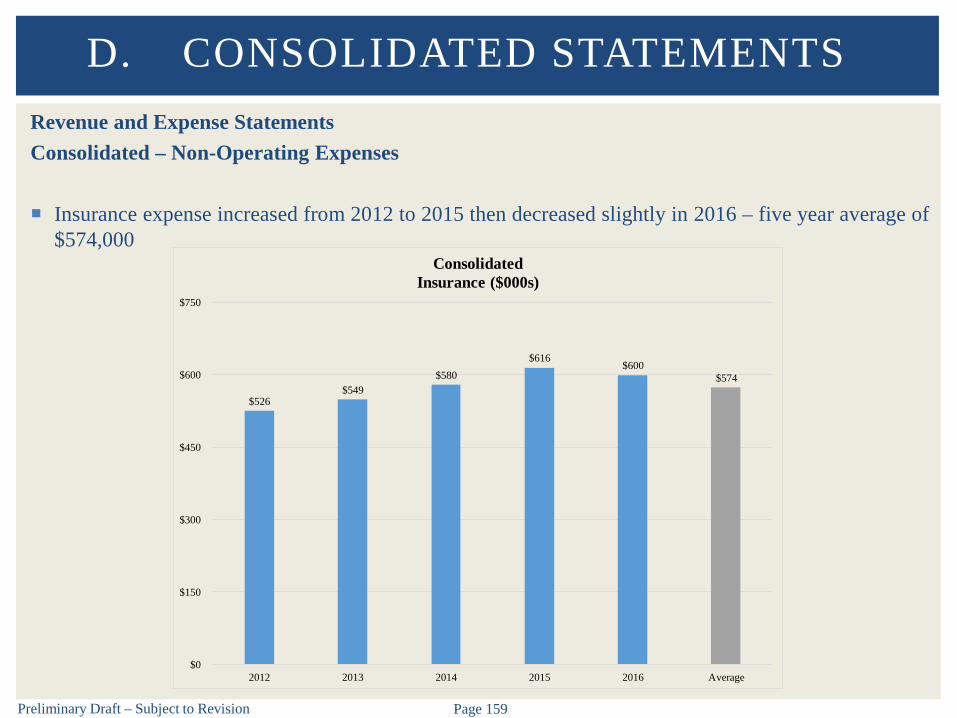
Preliminary Draft – Subject to Revision Page 159
Revenue and Expense StatementsConsolidated – Non-Operating Expenses
Insurance expense increased from 2012 to 2015 then decreased slightly in 2016 – five year average of$574,000
D. CONSOLIDATED STATEMENTS
$526 $549
$580 $616
$600 $574
$0
$150
$300
$450
$600
$750
2012 2013 2014 2015 2016 Average
ConsolidatedInsurance ($000s)

Preliminary Draft – Subject to Revision Page 160
Revenue and Expense StatementsConsolidated – Non-Operating Expenses
Bond interest expense increased significantly in 2016 due to debt incurred for new Bucks arena – fiveyear average of $13.8 million
D. CONSOLIDATED STATEMENTS
$12,549 $13,226 $13,039 $12,729
$17,585
$13,826
$0
$4,000
$8,000
$12,000
$16,000
$20,000
2012 2013 2014 2015 2016 Average
ConsolidatedBond Interest Expense ($000s)

Preliminary Draft – Subject to Revision Page 161
Revenue and Expense StatementsConsolidated – Non-Operating Expenses
Miscellaneous expense has varied over time – five year average of $121,000
D. CONSOLIDATED STATEMENTS
$105 $100
$133
$105
$160
$121
$0
$40
$80
$120
$160
$200
2012 2013 2014 2015 2016 Average
ConsolidatedMiscellaneous Expense ($000s)
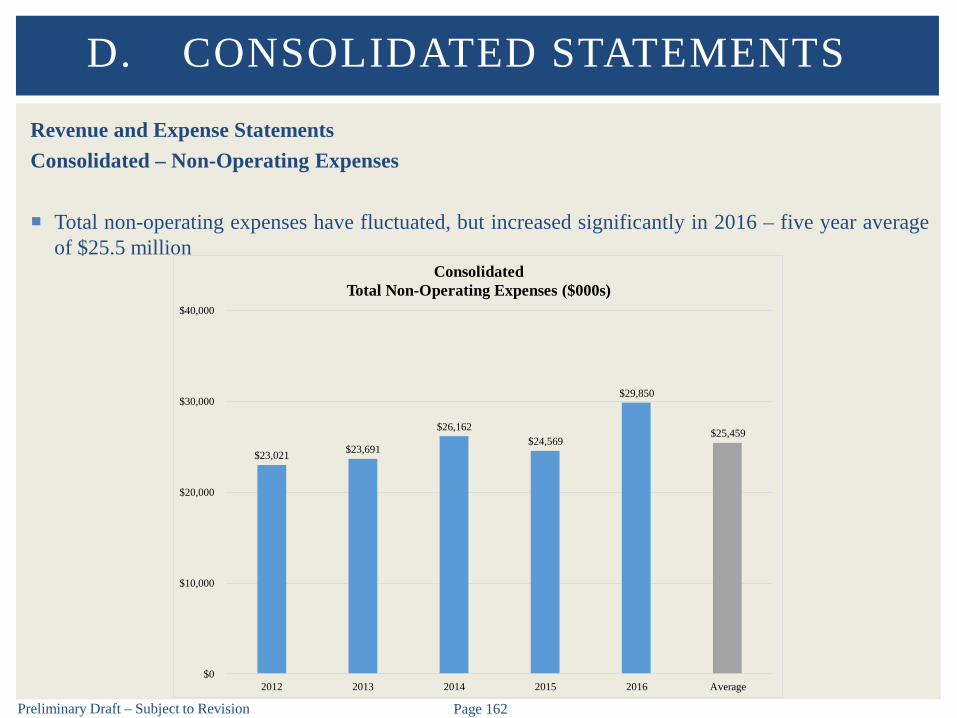
Preliminary Draft – Subject to Revision Page 162
Revenue and Expense StatementsConsolidated – Non-Operating Expenses
Total non-operating expenses have fluctuated, but increased significantly in 2016 – five year averageof $25.5 million
D. CONSOLIDATED STATEMENTS
$23,021 $23,691
$26,162 $24,569
$29,850
$25,459
$0
$10,000
$20,000
$30,000
$40,000
2012 2013 2014 2015 2016 Average
ConsolidatedTotal Non-Operating Expenses ($000s)

Preliminary Draft – Subject to Revision Page 163
Revenue and Expense StatementsConsolidated – Net Income (Loss) Before Non-Cash Expenses
Net income before non-cash items has increased every year – five year average of $9.6 million
D. CONSOLIDATED STATEMENTS
$7,575
$8,717
$9,568
$10,720
$11,530
$9,622
$0
$3,000
$6,000
$9,000
$12,000
$15,000
2012 2013 2014 2015 2016 Average
ConsolidatedNet Income (Loss) Before Non-Cash Items ($000s)

Preliminary Draft – Subject to Revision Page 164
Revenue and Expense StatementsConsolidated – Non-Cash Expenses
Total non-cash expenses increased significantly in 2016 – five year average of $9.1 million
D. CONSOLIDATED STATEMENTS
$7,835 $7,985 $8,053
$9,198
$12,538
$9,122
$0
$3,000
$6,000
$9,000
$12,000
$15,000
2012 2013 2014 2015 2016 Average
ConsolidatedTotal Noncash Expenses ($000s)
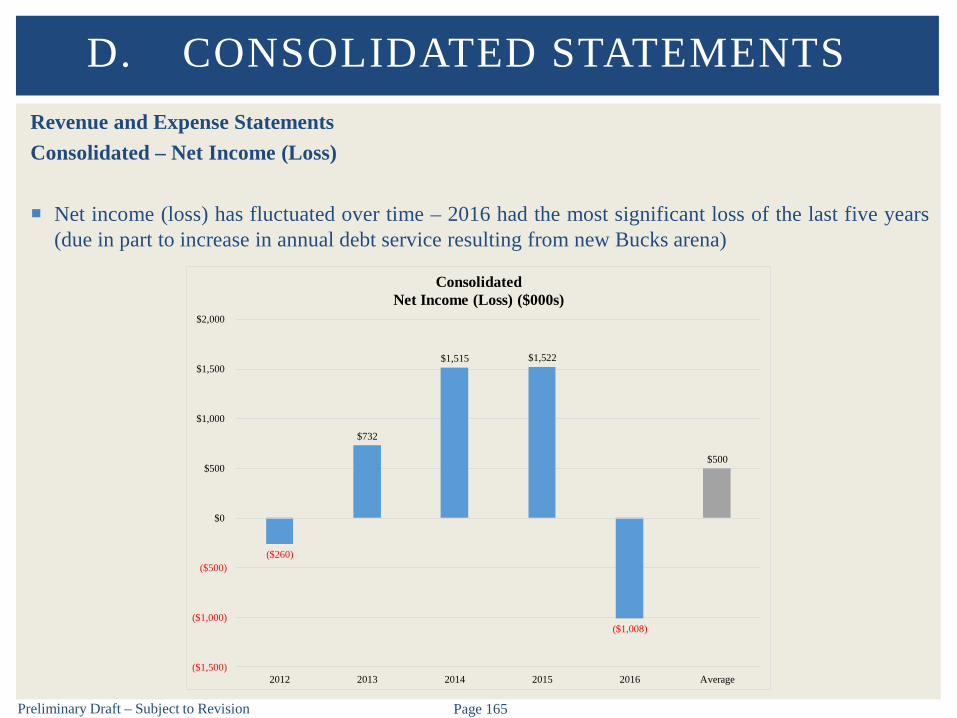
Preliminary Draft – Subject to Revision Page 165
Revenue and Expense StatementsConsolidated – Net Income (Loss)
Net income (loss) has fluctuated over time – 2016 had the most significant loss of the last five years(due in part to increase in annual debt service resulting from new Bucks arena)
D. CONSOLIDATED STATEMENTS
($260)
$732
$1,515 $1,522
($1,008)
$500
($1,500)
($1,000)
($500)
$0
$500
$1,000
$1,500
$2,000
2012 2013 2014 2015 2016 Average
ConsolidatedNet Income (Loss) ($000s)
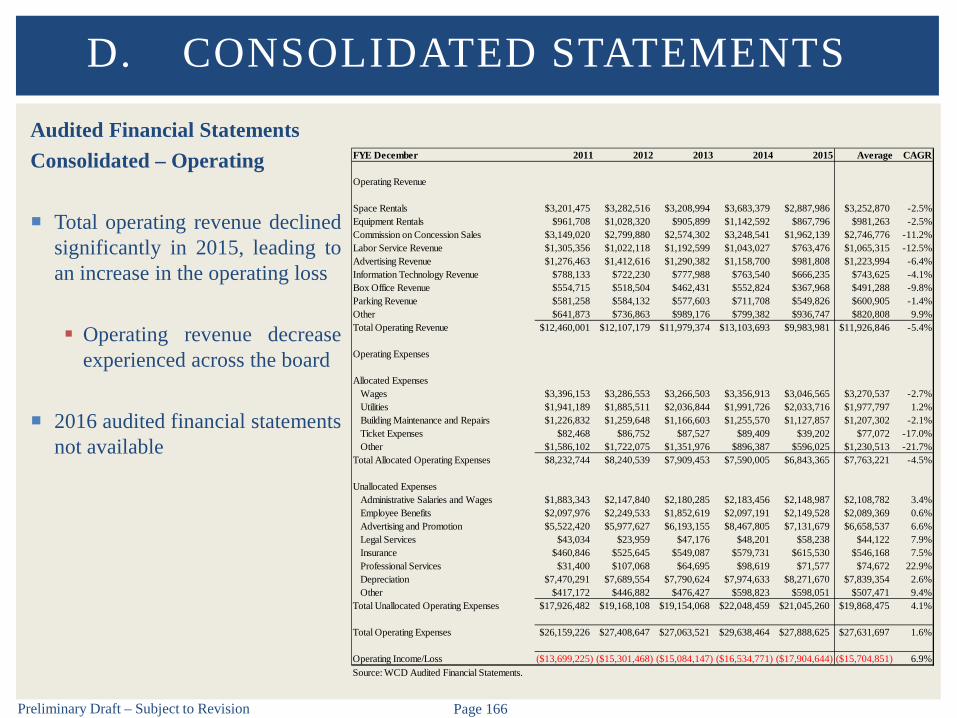
Preliminary Draft – Subject to Revision Page 166
Audited Financial StatementsConsolidated – Operating
Total operating revenue declinedsignificantly in 2015, leading toan increase in the operating loss
Operating revenue decreaseexperienced across the board
2016 audited financial statementsnot available
D. CONSOLIDATED STATEMENTS
FYE December 2011 2012 2013 2014 2015 Average CAGR
Operating Revenue
Space Rentals $3,201,475 $3,282,516 $3,208,994 $3,683,379 $2,887,986 $3,252,870 -2.5%Equipment Rentals $961,708 $1,028,320 $905,899 $1,142,592 $867,796 $981,263 -2.5%Commission on Concession Sales $3,149,020 $2,799,880 $2,574,302 $3,248,541 $1,962,139 $2,746,776 -11.2%Labor Service Revenue $1,305,356 $1,022,118 $1,192,599 $1,043,027 $763,476 $1,065,315 -12.5%Advertising Revenue $1,276,463 $1,412,616 $1,290,382 $1,158,700 $981,808 $1,223,994 -6.4%Information Technology Revenue $788,133 $722,230 $777,988 $763,540 $666,235 $743,625 -4.1%Box Office Revenue $554,715 $518,504 $462,431 $552,824 $367,968 $491,288 -9.8%Parking Revenue $581,258 $584,132 $577,603 $711,708 $549,826 $600,905 -1.4%Other $641,873 $736,863 $989,176 $799,382 $936,747 $820,808 9.9%Total Operating Revenue $12,460,001 $12,107,179 $11,979,374 $13,103,693 $9,983,981 $11,926,846 -5.4%
Operating Expenses
Allocated ExpensesWages $3,396,153 $3,286,553 $3,266,503 $3,356,913 $3,046,565 $3,270,537 -2.7%Utilities $1,941,189 $1,885,511 $2,036,844 $1,991,726 $2,033,716 $1,977,797 1.2%Building Maintenance and Repairs $1,226,832 $1,259,648 $1,166,603 $1,255,570 $1,127,857 $1,207,302 -2.1%Ticket Expenses $82,468 $86,752 $87,527 $89,409 $39,202 $77,072 -17.0%Other $1,586,102 $1,722,075 $1,351,976 $896,387 $596,025 $1,230,513 -21.7%
Total Allocated Operating Expenses $8,232,744 $8,240,539 $7,909,453 $7,590,005 $6,843,365 $7,763,221 -4.5%
Unallocated ExpensesAdministrative Salaries and Wages $1,883,343 $2,147,840 $2,180,285 $2,183,456 $2,148,987 $2,108,782 3.4%Employee Benefits $2,097,976 $2,249,533 $1,852,619 $2,097,191 $2,149,528 $2,089,369 0.6%Advertising and Promotion $5,522,420 $5,977,627 $6,193,155 $8,467,805 $7,131,679 $6,658,537 6.6%Legal Services $43,034 $23,959 $47,176 $48,201 $58,238 $44,122 7.9%Insurance $460,846 $525,645 $549,087 $579,731 $615,530 $546,168 7.5%Professional Services $31,400 $107,068 $64,695 $98,619 $71,577 $74,672 22.9%Depreciation $7,470,291 $7,689,554 $7,790,624 $7,974,633 $8,271,670 $7,839,354 2.6%Other $417,172 $446,882 $476,427 $598,823 $598,051 $507,471 9.4%
Total Unallocated Operating Expenses $17,926,482 $19,168,108 $19,154,068 $22,048,459 $21,045,260 $19,868,475 4.1%
Total Operating Expenses $26,159,226 $27,408,647 $27,063,521 $29,638,464 $27,888,625 $27,631,697 1.6%
Operating Income/Loss ($13,699,225) ($15,301,468) ($15,084,147) ($16,534,771) ($17,904,644) ($15,704,851) 6.9%Source: WCD Audited Financial Statements.

Preliminary Draft – Subject to Revision Page 167
Audited Financial StatementsConsolidated – Non-Operating
Total tax revenue has increased each year which has resulted in the change in net position toimprove each year since 2012
D. CONSOLIDATED STATEMENTS
FYE December 2011 2012 2013 2014 2015 Average CAGR
Operating Income/Loss ($13,699,225) ($15,301,468) ($15,084,147) ($16,534,771) ($17,904,644) ($15,704,851) 6.9%
Non-Operating Income (Expense)
Tax RevenueAdditional Room Tax Revenue $9,938,361 $10,482,184 $11,395,906 $12,344,694 $13,240,998 $11,480,429 7.4%Basic Room Tax Revenue $4,698,986 $4,908,284 $5,307,845 $5,643,579 $6,075,991 $5,326,937 6.6%Food and Beverage Tax Revenue $8,901,044 $9,405,832 $9,624,199 $10,004,052 $10,653,854 $9,717,796 4.6%Rental Car Tax Revenue $2,539,854 $2,414,379 $2,389,031 $2,595,397 $2,642,869 $2,516,306 1.0%
Total Tax Revenue $26,078,245 $27,210,679 $28,716,981 $30,587,722 $32,613,712 $29,041,468 5.8%
State of Wisconsin Administrative Fee ($664,995) ($693,872) ($732,283) ($779,987) ($831,650) ($740,557)Net Tax Revenue $25,413,250 $26,516,807 $27,984,698 $29,807,735 $31,782,062 $28,300,910 5.8%
Other Income $970,091 $971,498 $971,828 $960,820 $938,682 $962,584 -0.8%Bond Amortization and Interest Expense ($12,632,604) ($12,575,567) ($13,011,581) ($12,807,178) ($13,294,370) ($12,864,260) 1.3%Total Non-Operating Income (Expense) $13,750,737 $14,912,738 $15,944,945 $17,961,377 $19,426,374 $16,399,234 9.0%
Change in Net Position $51,512 ($388,730) $860,798 $1,426,606 $1,521,730 $694,383 133.1%Source: WCD Audited Financial Statements.

E. LOST BUSINESS REPORTS
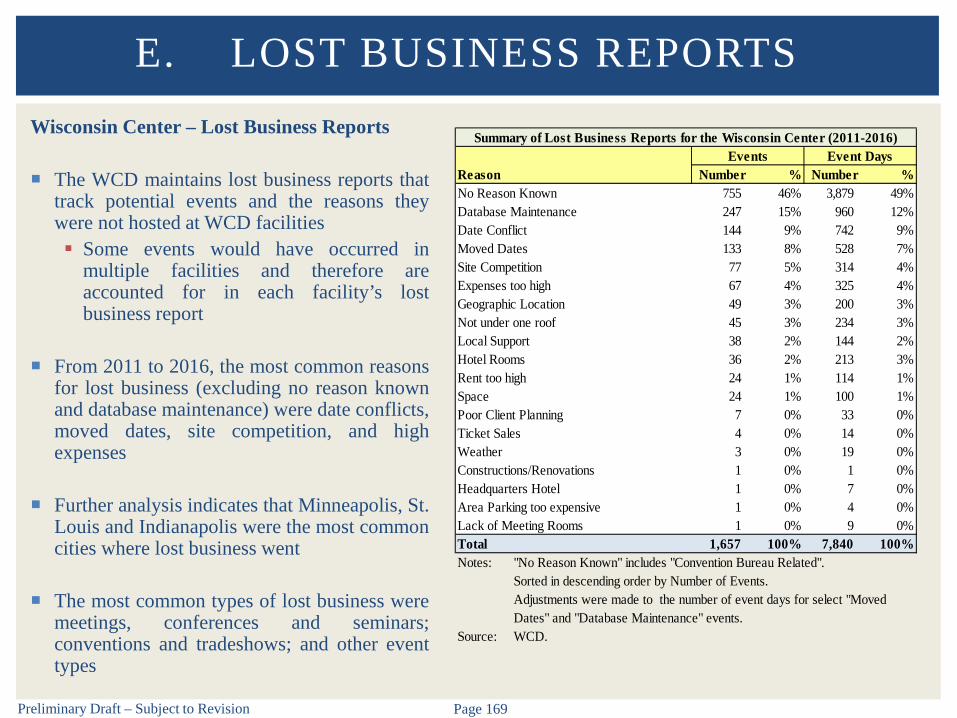
Preliminary Draft – Subject to Revision Page 169
Wisconsin Center – Lost Business Reports
The WCD maintains lost business reports thattrack potential events and the reasons theywere not hosted at WCD facilities Some events would have occurred in
multiple facilities and therefore areaccounted for in each facility’s lostbusiness report
From 2011 to 2016, the most common reasonsfor lost business (excluding no reason knownand database maintenance) were date conflicts,moved dates, site competition, and highexpenses
Further analysis indicates that Minneapolis, St.Louis and Indianapolis were the most commoncities where lost business went
The most common types of lost business weremeetings, conferences and seminars;conventions and tradeshows; and other eventtypes
E. LOST BUSINESS REPORTS
Reason Number % Number %No Reason Known 755 46% 3,879 49%Database Maintenance 247 15% 960 12%Date Conflict 144 9% 742 9%Moved Dates 133 8% 528 7%Site Competition 77 5% 314 4%Expenses too high 67 4% 325 4%Geographic Location 49 3% 200 3%Not under one roof 45 3% 234 3%Local Support 38 2% 144 2%Hotel Rooms 36 2% 213 3%Rent too high 24 1% 114 1%Space 24 1% 100 1%Poor Client Planning 7 0% 33 0%Ticket Sales 4 0% 14 0%Weather 3 0% 19 0%Constructions/Renovations 1 0% 1 0%Headquarters Hotel 1 0% 7 0%Area Parking too expensive 1 0% 4 0%Lack of Meeting Rooms 1 0% 9 0%Total 1,657 100% 7,840 100%Notes: "No Reason Known" includes "Convention Bureau Related".
Sorted in descending order by Number of Events.Adjustments were made to the number of event days for select "MovedDates" and "Database Maintenance" events.
Source: WCD.
Summary of Lost Business Reports for the Wisconsin Center (2011-2016)Events Event Days

Preliminary Draft – Subject to Revision Page 170
Wisconsin Center – Convention-Related LostRoom Nights
VISIT Milwaukee also tracks lost business
Approximately 101,700 potential room nightswere lost for 2016 due to the WCD not beingadequate for groups needs – reflects thehighest number of lost room nights in each ofthe three profiled years.
Date availability, hotel rates, and hotelproduct were other major reasons for lostconvention-related business
VISIT Milwaukee noted that there is notraditional rotation and, as such, Milwaukeeloses business to a variety of cities Minneapolis and Omaha were the most
common cities that Milwaukee lostconvention-related business to
E. LOST BUSINESS REPORTS
2016 Distribution of Convention-Related Lost Business-Related Lost BusinessConventionConventionConvention
44%
18%
12%
11%
10%
5%
WCD not adequate
WCD not available
Hotel rates
Hotel product
WCD cost
Meeting canceled
Reason 2016 2017 2018WCD not adequate 101,700 53,800 70,000WCD not available 42,100 31,300 29,100Hotel rates 28,300 18,900 19,800Hotel product 24,200 8,900 32,700WCD cost 24,100 28,700 3,800Meeting canceled 10,400 8,900 9,800Total 230,800 150,500 165,200Note: Sorted in descending order by room nights lost for 2016.
Source: VISIT Milwaukee.
Convention-Related Lost Business - Room Nights
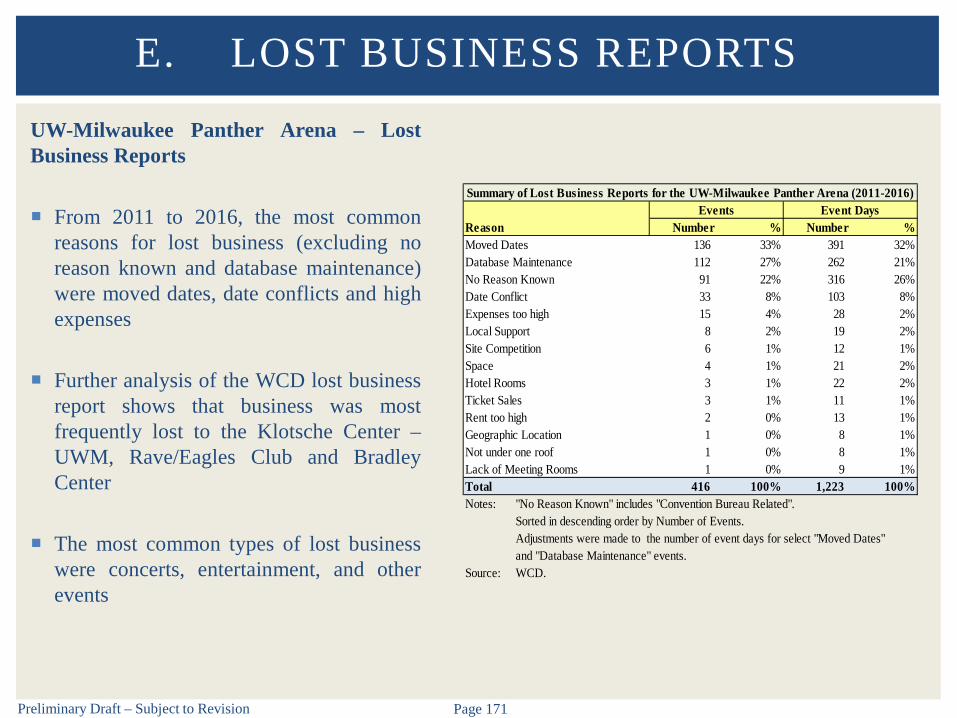
Preliminary Draft – Subject to Revision Page 171
UW-Milwaukee Panther Arena – LostBusiness Reports
From 2011 to 2016, the most commonreasons for lost business (excluding noreason known and database maintenance)were moved dates, date conflicts and highexpenses
Further analysis of the WCD lost businessreport shows that business was mostfrequently lost to the Klotsche Center –UWM, Rave/Eagles Club and BradleyCenter
The most common types of lost businesswere concerts, entertainment, and otherevents
E. LOST BUSINESS REPORTS
Reason Number % Number %Moved Dates 136 33% 391 32%Database Maintenance 112 27% 262 21%No Reason Known 91 22% 316 26%Date Conflict 33 8% 103 8%Expenses too high 15 4% 28 2%Local Support 8 2% 19 2%Site Competition 6 1% 12 1%Space 4 1% 21 2%Hotel Rooms 3 1% 22 2%Ticket Sales 3 1% 11 1%Rent too high 2 0% 13 1%Geographic Location 1 0% 8 1%Not under one roof 1 0% 8 1%Lack of Meeting Rooms 1 0% 9 1%Total 416 100% 1,223 100%Notes: "No Reason Known" includes "Convention Bureau Related".
Sorted in descending order by Number of Events.Adjustments were made to the number of event days for select "Moved Dates"and "Database Maintenance" events.
Source: WCD.
Events Event DaysSummary of Lost Business Reports for the UW-Milwaukee Panther Arena (2011-2016)
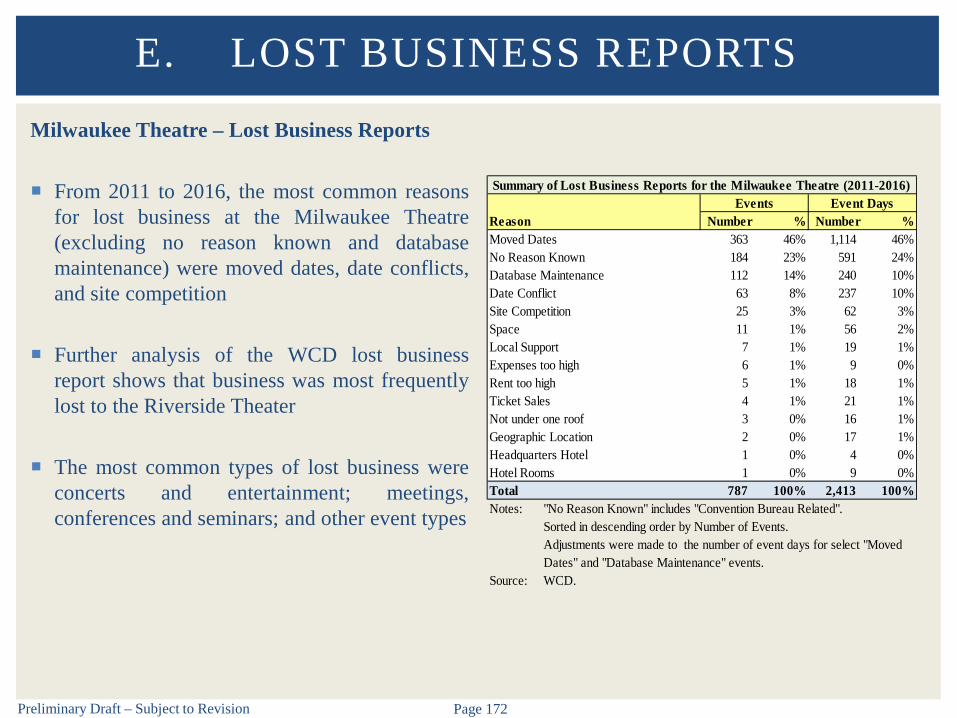
Preliminary Draft – Subject to Revision Page 172
Milwaukee Theatre – Lost Business Reports
From 2011 to 2016, the most common reasonsfor lost business at the Milwaukee Theatre(excluding no reason known and databasemaintenance) were moved dates, date conflicts,and site competition
Further analysis of the WCD lost businessreport shows that business was most frequentlylost to the Riverside Theater
The most common types of lost business wereconcerts and entertainment; meetings,conferences and seminars; and other event types
E. LOST BUSINESS REPORTS
Reason Number % Number %Moved Dates 363 46% 1,114 46%No Reason Known 184 23% 591 24%Database Maintenance 112 14% 240 10%Date Conflict 63 8% 237 10%Site Competition 25 3% 62 3%Space 11 1% 56 2%Local Support 7 1% 19 1%Expenses too high 6 1% 9 0%Rent too high 5 1% 18 1%Ticket Sales 4 1% 21 1%Not under one roof 3 0% 16 1%Geographic Location 2 0% 17 1%Headquarters Hotel 1 0% 4 0%Hotel Rooms 1 0% 9 0%Total 787 100% 2,413 100%Notes: "No Reason Known" includes "Convention Bureau Related".
Sorted in descending order by Number of Events.Adjustments were made to the number of event days for select "MovedDates" and "Database Maintenance" events.
Source: WCD.
Summary of Lost Business Reports for the Milwaukee Theatre (2011-2016)Events Event Days
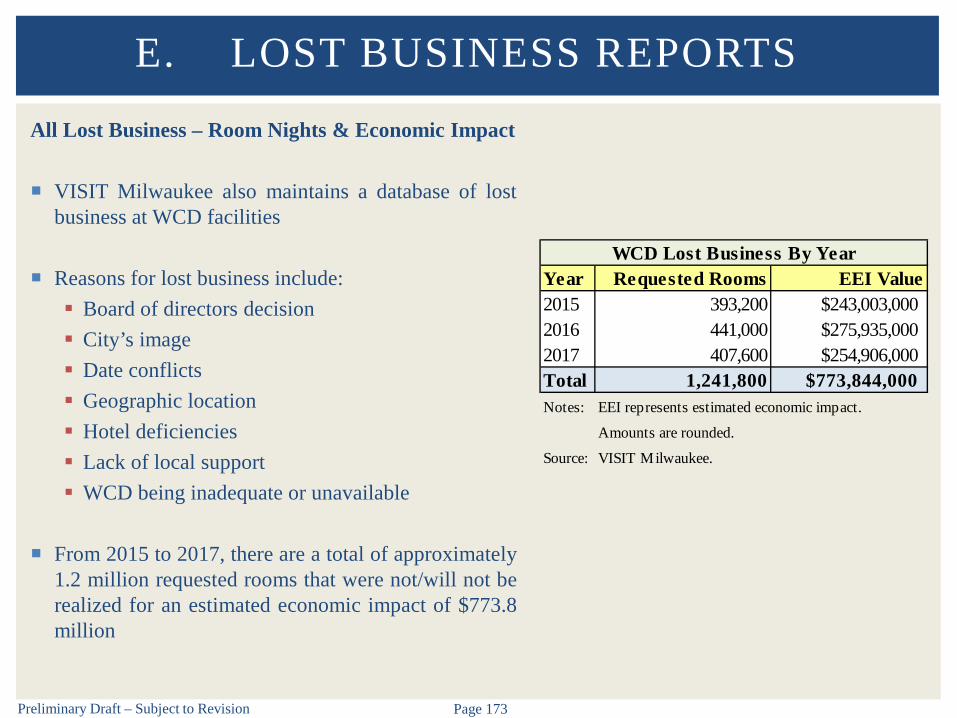
Preliminary Draft – Subject to Revision Page 173
All Lost Business – Room Nights & Economic Impact
VISIT Milwaukee also maintains a database of lostbusiness at WCD facilities
Reasons for lost business include: Board of directors decision City’s image Date conflicts Geographic location Hotel deficiencies Lack of local support WCD being inadequate or unavailable
From 2015 to 2017, there are a total of approximately1.2 million requested rooms that were not/will not berealized for an estimated economic impact of $773.8million
E. LOST BUSINESS REPORTS
Year Requested Rooms EEI Value2015 393,200 $243,003,0002016 441,000 $275,935,0002017 407,600 $254,906,000Total 1,241,800 $773,844,000Notes: EEI represents estimated economic impact.
Amounts are rounded.
Source: VISIT Milwaukee.
WCD Lost Business By Year
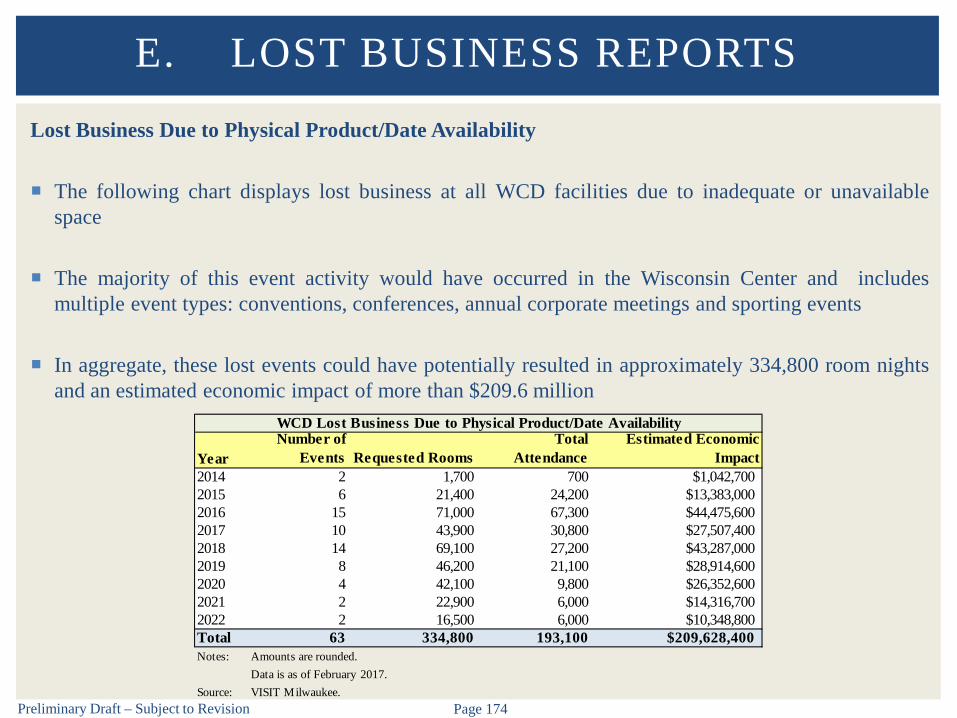
Preliminary Draft – Subject to Revision Page 174
Lost Business Due to Physical Product/Date Availability
The following chart displays lost business at all WCD facilities due to inadequate or unavailablespace
The majority of this event activity would have occurred in the Wisconsin Center and includesmultiple event types: conventions, conferences, annual corporate meetings and sporting events
In aggregate, these lost events could have potentially resulted in approximately 334,800 room nightsand an estimated economic impact of more than $209.6 million
E. LOST BUSINESS REPORTS
YearNumber of
Events Requested RoomsTotal
AttendanceEstimated Economic
Impact2014 2 1,700 700 $1,042,7002015 6 21,400 24,200 $13,383,0002016 15 71,000 67,300 $44,475,6002017 10 43,900 30,800 $27,507,4002018 14 69,100 27,200 $43,287,0002019 8 46,200 21,100 $28,914,6002020 4 42,100 9,800 $26,352,6002021 2 22,900 6,000 $14,316,7002022 2 16,500 6,000 $10,348,800Total 63 334,800 193,100 $209,628,400Notes: Amounts are rounded.
Data is as of February 2017.Source: VISIT Milwaukee.
WCD Lost Business Due to Physical Product/Date Availability
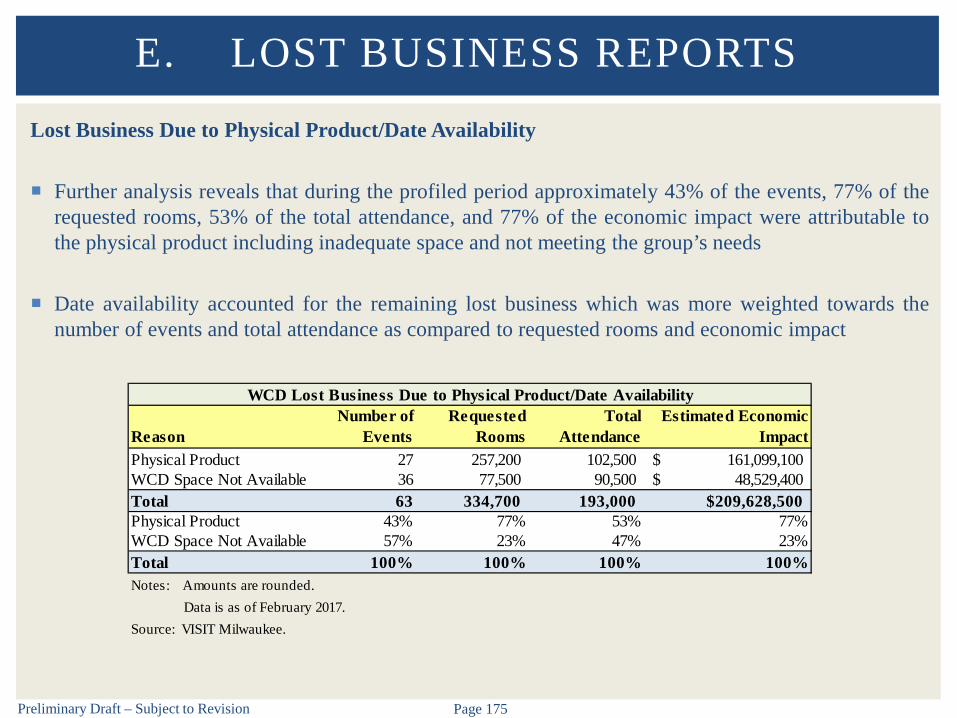
Preliminary Draft – Subject to Revision Page 175
Lost Business Due to Physical Product/Date Availability
Further analysis reveals that during the profiled period approximately 43% of the events, 77% of therequested rooms, 53% of the total attendance, and 77% of the economic impact were attributable tothe physical product including inadequate space and not meeting the group’s needs
Date availability accounted for the remaining lost business which was more weighted towards thenumber of events and total attendance as compared to requested rooms and economic impact
E. LOST BUSINESS REPORTS
ReasonNumber of
EventsRequested
RoomsTotal
AttendanceEstimated Economic
ImpactPhysical Product 27 257,200 102,500 161,099,100$ WCD Space Not Available 36 77,500 90,500 48,529,400$ Total 63 334,700 193,000 $209,628,500Physical Product 43% 77% 53% 77%WCD Space Not Available 57% 23% 47% 23%Total 100% 100% 100% 100%Notes: Amounts are rounded. Data is as of February 2017.Source: VISIT Milwaukee.
WCD Lost Business Due to Physical Product/Date Availability
F. KEY AGREEMENT SUMMARIES

Preliminary Draft – Subject to Revision Page 177
Overview
Staffing levels can vary greatly between complexes/facilities depending on management’sphilosophy/structure as to which services should be provided in house and which should be contractedthrough a third party. Key agreements/contracts were reviewed to develop an understanding ofcontractual relationships associated with WCD facilities. The slides that follow summarize thefollowing WCD third party agreements:
VISIT Milwaukee – marketing and booking services Levy Restaurants – food and beverage services Conference Technologies, Inc. – business and audio/visual services American Security – security services Ticketmaster – ticketing software UW-Milwaukee – partnership agreement Milwaukee Admirals – license agreement Milwaukee Wave – license agreement
The following are summaries of key terms, please refer to actual agreements for details.
F. KEY AGREEMENT SUMMARIES

Preliminary Draft – Subject to Revision Page 178
VISIT Milwaukee – Marketing and Booking Services
Term Agreement signed May 16, 2011 and extends through December 31, 2018
There is an automatic extension for a two-year period though December 31, 2020
Scope of Services
Book conventions, meetings and tradeshows at WCD facilities with priority on all dates more than18 months in the future
Prepare a long-range Strategic Marketing Plan that is revised annually
Prepare an annual tactical marketing plan
Send sales leads to WCD
Provide high-quality, customer-oriented convention and visitor services to Milwaukee hospitalityindustry users
Act as a coordinating entity for activities of the hospitality industry within the Metro MilwaukeeArea
F. KEY AGREEMENT SUMMARIES

Preliminary Draft – Subject to Revision Page 179
VISIT Milwaukee – Marketing and Booking Services (continued)
Compensation
VISIT Milwaukee will receive one half of one percent of Milwaukee County Hotel Tax
In addition, VISIT Milwaukee receives either a minimum or a calculated base, which is based on apercentage of City Hotel Tax Collections
Incentive Package that is based on room nights, room fees and food and beverage revenues relateto VISIT Milwaukee and “Team” Bookings
F. KEY AGREEMENT SUMMARIES
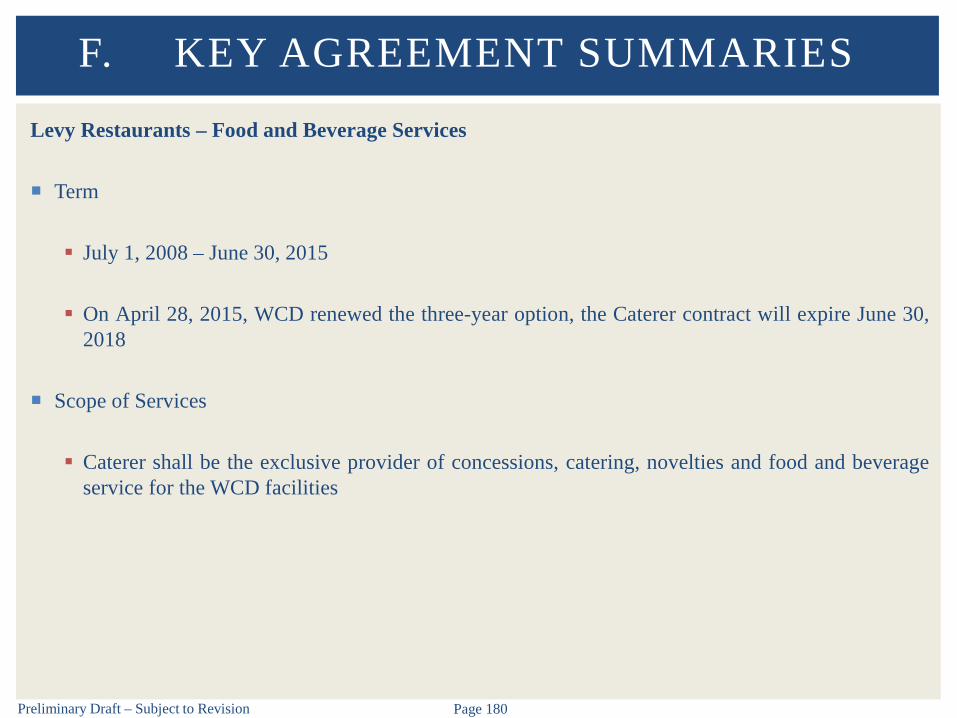
Preliminary Draft – Subject to Revision Page 180
Levy Restaurants – Food and Beverage Services
Term
July 1, 2008 – June 30, 2015
On April 28, 2015, WCD renewed the three-year option, the Caterer contract will expire June 30,2018
Scope of Services
Caterer shall be the exclusive provider of concessions, catering, novelties and food and beverageservice for the WCD facilities
F. KEY AGREEMENT SUMMARIES

Preliminary Draft – Subject to Revision Page 181
Levy Restaurants – Food and Beverage Services (continued)
Compensation
Fixed Fee – $165,000 per year
Incentive Fee – Amount equal two (2%) of Gross Revenues for the first, second and thirdaccounting years and an amount equal to three (3%) of Gross Revenues for the fourth throughseventh Accounting Years and any Option Years. Gross Revenues means all receipts derived byCaterer from the provision of Services except any sums paid out for any separately stated sales orexcise tax.
Food Service and Novelty Operations
Caterer will set aside one (1%) of Gross Revenues each month for marketing, advertising andpromotion of Caterer’s catering services – WCD approves expenditures
F. KEY AGREEMENT SUMMARIES
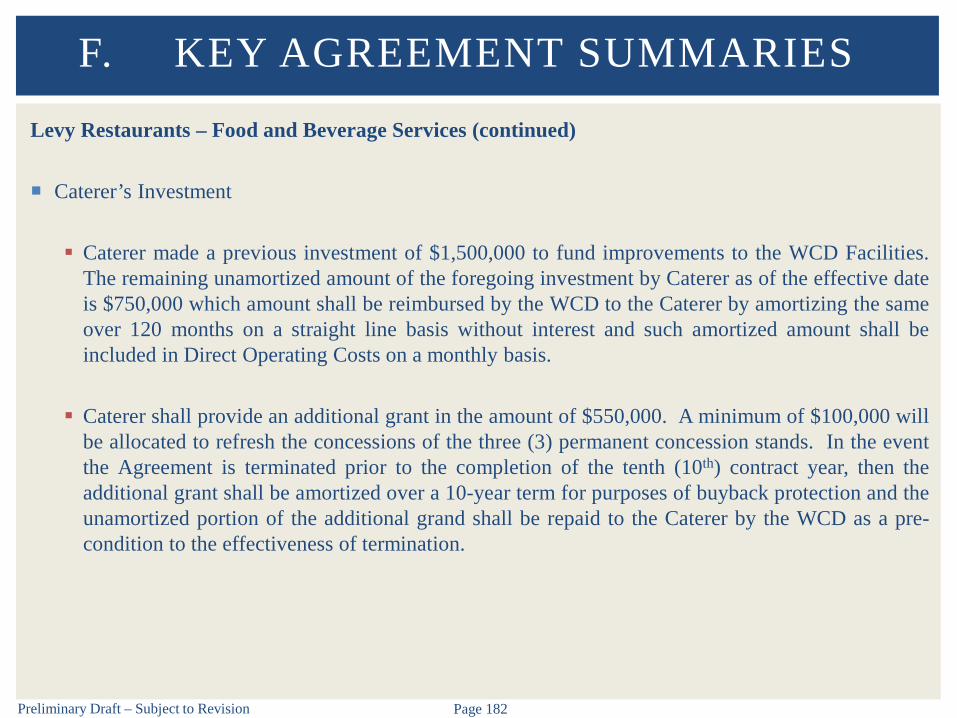
Preliminary Draft – Subject to Revision Page 182
Levy Restaurants – Food and Beverage Services (continued)
Caterer’s Investment
Caterer made a previous investment of $1,500,000 to fund improvements to the WCD Facilities.The remaining unamortized amount of the foregoing investment by Caterer as of the effective dateis $750,000 which amount shall be reimbursed by the WCD to the Caterer by amortizing the sameover 120 months on a straight line basis without interest and such amortized amount shall beincluded in Direct Operating Costs on a monthly basis.
Caterer shall provide an additional grant in the amount of $550,000. A minimum of $100,000 willbe allocated to refresh the concessions of the three (3) permanent concession stands. In the eventthe Agreement is terminated prior to the completion of the tenth (10th) contract year, then theadditional grant shall be amortized over a 10-year term for purposes of buyback protection and theunamortized portion of the additional grand shall be repaid to the Caterer by the WCD as a pre-condition to the effectiveness of termination.
F. KEY AGREEMENT SUMMARIES
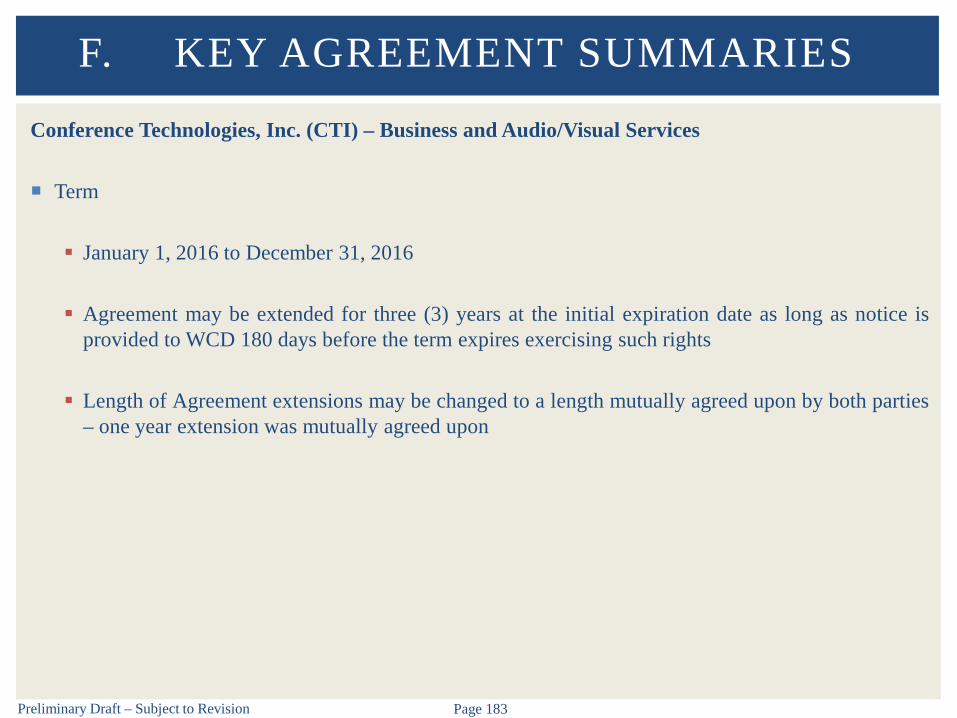
Preliminary Draft – Subject to Revision Page 183
Conference Technologies, Inc. (CTI) – Business and Audio/Visual Services
Term
January 1, 2016 to December 31, 2016
Agreement may be extended for three (3) years at the initial expiration date as long as notice isprovided to WCD 180 days before the term expires exercising such rights
Length of Agreement extensions may be changed to a length mutually agreed upon by both parties– one year extension was mutually agreed upon
F. KEY AGREEMENT SUMMARIES
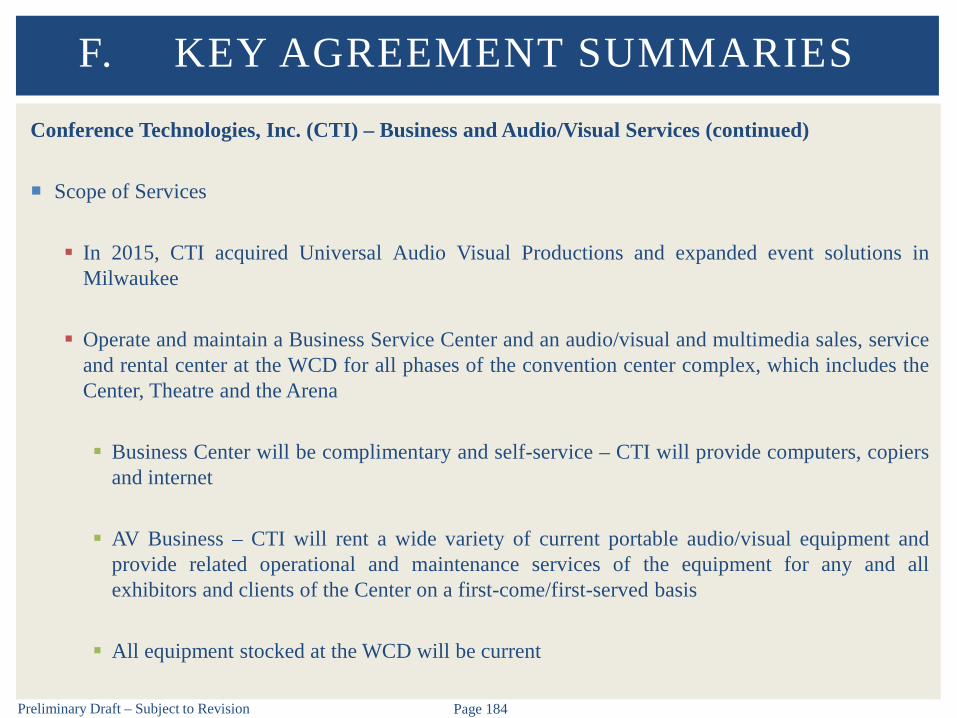
Preliminary Draft – Subject to Revision Page 184
Conference Technologies, Inc. (CTI) – Business and Audio/Visual Services (continued)
Scope of Services
In 2015, CTI acquired Universal Audio Visual Productions and expanded event solutions inMilwaukee
Operate and maintain a Business Service Center and an audio/visual and multimedia sales, serviceand rental center at the WCD for all phases of the convention center complex, which includes theCenter, Theatre and the Arena
Business Center will be complimentary and self-service – CTI will provide computers, copiersand internet
AV Business – CTI will rent a wide variety of current portable audio/visual equipment andprovide related operational and maintenance services of the equipment for any and allexhibitors and clients of the Center on a first-come/first-served basis
All equipment stocked at the WCD will be current
F. KEY AGREEMENT SUMMARIES
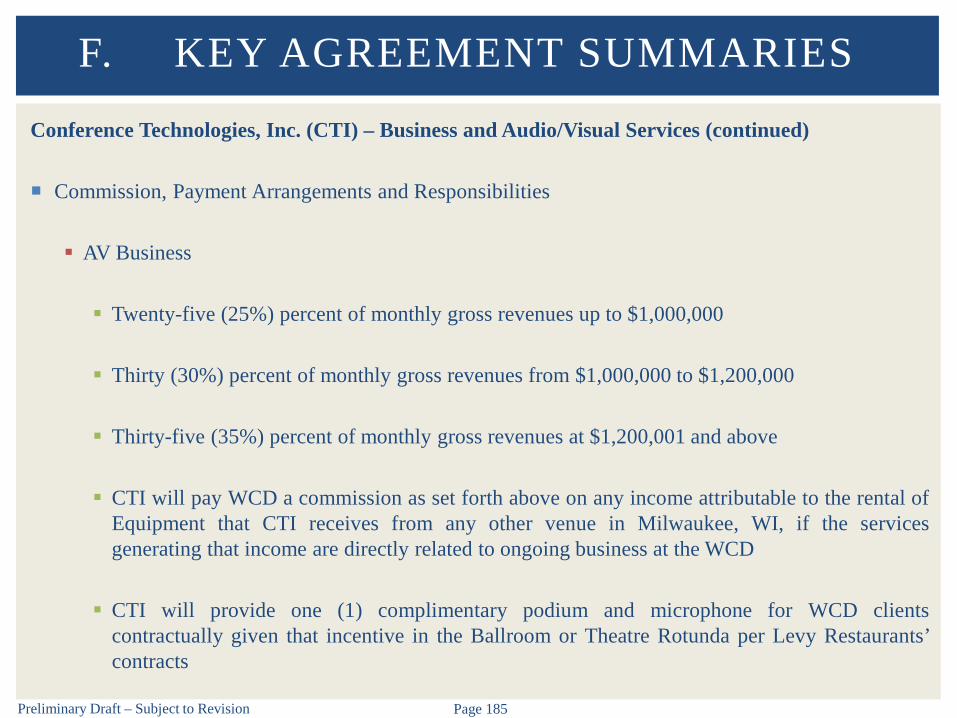
Preliminary Draft – Subject to Revision Page 185
Conference Technologies, Inc. (CTI) – Business and Audio/Visual Services (continued)
Commission, Payment Arrangements and Responsibilities
AV Business
Twenty-five (25%) percent of monthly gross revenues up to $1,000,000
Thirty (30%) percent of monthly gross revenues from $1,000,000 to $1,200,000
Thirty-five (35%) percent of monthly gross revenues at $1,200,001 and above
CTI will pay WCD a commission as set forth above on any income attributable to the rental ofEquipment that CTI receives from any other venue in Milwaukee, WI, if the servicesgenerating that income are directly related to ongoing business at the WCD
CTI will provide one (1) complimentary podium and microphone for WCD clientscontractually given that incentive in the Ballroom or Theatre Rotunda per Levy Restaurants’contracts
F. KEY AGREEMENT SUMMARIES
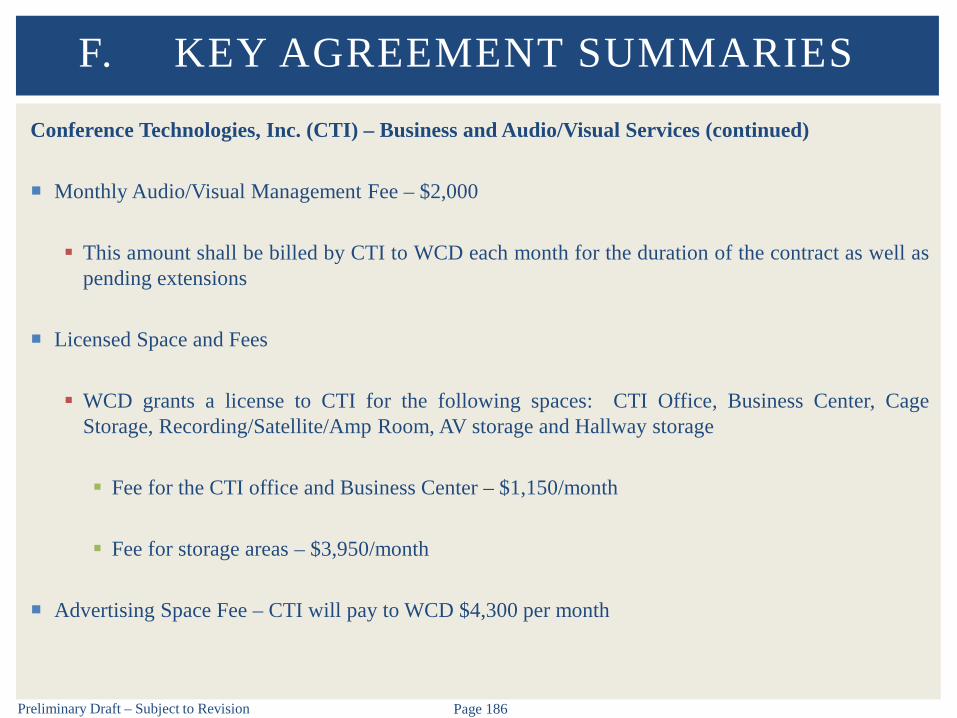
Preliminary Draft – Subject to Revision Page 186
Conference Technologies, Inc. (CTI) – Business and Audio/Visual Services (continued)
Monthly Audio/Visual Management Fee – $2,000
This amount shall be billed by CTI to WCD each month for the duration of the contract as well aspending extensions
Licensed Space and Fees
WCD grants a license to CTI for the following spaces: CTI Office, Business Center, CageStorage, Recording/Satellite/Amp Room, AV storage and Hallway storage
Fee for the CTI office and Business Center – $1,150/month
Fee for storage areas – $3,950/month
Advertising Space Fee – CTI will pay to WCD $4,300 per month
F. KEY AGREEMENT SUMMARIES

Preliminary Draft – Subject to Revision Page 187
American Security – Security Services
Term
January 1, 2015 – January 1, 2018
Contract provides for service furnished at the WCD Facilities
Schedule, shifts, number of Security Officers per shift
Two uniformed, unarmed security officers providing on-site security services 24 hours per day,seven days per week, for a total of 336 hours per week
Fees
Regular charge for Security Officers shall be $15.84 per hour, per officer
WCD agrees to pay American Security a sum equal to one and one-half times the regular rate forSecurity Officers for any Client requested service hours in excess of regularly schedule hours andfor service on the six major holidays
F. KEY AGREEMENT SUMMARIES

Preliminary Draft – Subject to Revision Page 188
Ticketmaster – Ticketing Software
Term
On June 30, 2015, Ticketmaster extended the term of the Licensed User Agreement, which wasscheduled to expire on December 31, 2015, until December 31, 2021
Ticketmaster is the Exclusive Ticket Seller for all Telephone, Internet and Outlets Sales
WCD retains the right to sell Tickets via the Facility Box Office
On July 1, 2015, Ticketmaster paid WCD $75,000 as a recoupable advance against portions of theConvenience Charges, Processing and Mail Fee
Ticketmaster will charge a Convenience Fee between $3.50 - $5.00 per ticket that is bought viaInternet, Telephone or Outlet
In the event Live Nation Entertainment presents two (2) or more Attractions at the Facility during anygiven Contract Year, the then-current Convenience Fee shall be subject to automatic increase. ForTickets to Sports and Family Attractions – an increase of $0.10 per ticket. For Tickets to Concerts,Theater and all other attractions – an increase of $0.25 per ticket.
F. KEY AGREEMENT SUMMARIES

Preliminary Draft – Subject to Revision Page 189
Ticketmaster – Ticketing Software (continued)
Convenience Charge and Processing Fee If the per Ticket Convenience Charges in any single transaction for Tickets to Sports and Family
Attractions exceeds the amount of $7.00 per Ticket, then WCD and Ticketmaster shall each retainfifty (50%) of any amount in excess. For Tickets to Concert, Theater and all other Attractionsexceed the amount of $10.00 per Ticket, then WCD and Ticketmaster shall each retain fifty (50%)of any amount in excess.
Charges and fee with respect to any attractions presented by Feld Entertainments at the Facilityshall be determined pursuant to a separate national agreement between Ticketmaster and FeldEntertainment.
Payment Processing Fees Payment Authorization and Processing Fee – 2.61% of the Face Value of all Tickets Mail Fee – $2.25 per order
TM Messenger Ticketmaster shall provide WCD with TM Messenger services in exchange for an annual
subscription fee, ranging from $3,500 – $49,000 based on volume of emails sent using TMMessenger.
F. KEY AGREEMENT SUMMARIES
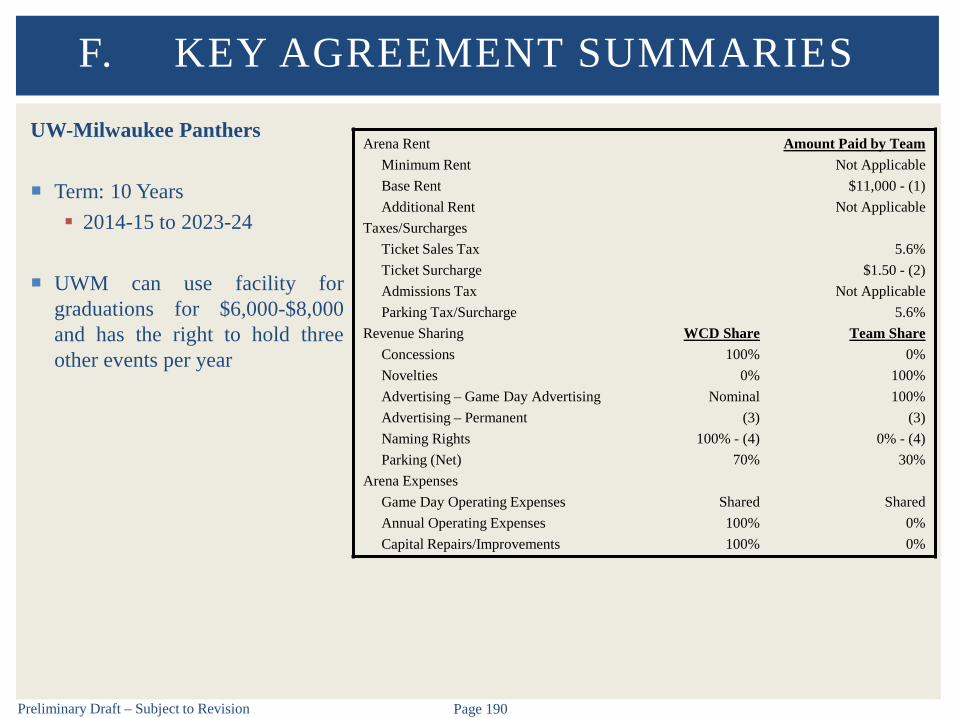
Preliminary Draft – Subject to Revision Page 190
UW-Milwaukee Panthers
Term: 10 Years 2014-15 to 2023-24
UWM can use facility forgraduations for $6,000-$8,000and has the right to hold threeother events per year
F. KEY AGREEMENT SUMMARIES
Arena RentMinimum RentBase RentAdditional Rent
Taxes/SurchargesTicket Sales TaxTicket SurchargeAdmissions TaxParking Tax/Surcharge
Revenue SharingConcessionsNoveltiesAdvertising – Game Day AdvertisingAdvertising – PermanentNaming RightsParking (Net)
Arena ExpensesGame Day Operating ExpensesAnnual Operating ExpensesCapital Repairs/Improvements
WCD Share100%
0%Nominal
(3)100% - (4)
70%
Shared100%100%
Amount Paid by TeamNot Applicable
$11,000 - (1)Not Applicable
5.6%$1.50 - (2)
Not Applicable5.6%
Team Share0%
100%100%
(3)0% - (4)
30%
Shared0%0%
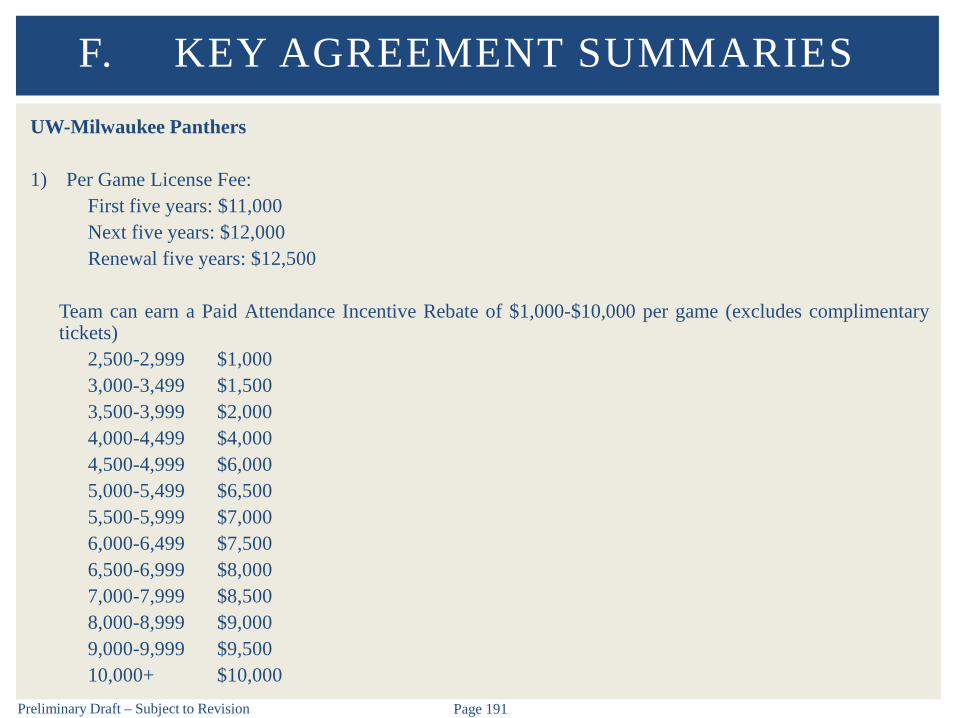
Preliminary Draft – Subject to Revision Page 191
UW-Milwaukee Panthers
1) Per Game License Fee:First five years: $11,000Next five years: $12,000Renewal five years: $12,500
Team can earn a Paid Attendance Incentive Rebate of $1,000-$10,000 per game (excludes complimentarytickets)
2,500-2,999 $1,0003,000-3,499 $1,5003,500-3,999 $2,0004,000-4,499 $4,0004,500-4,999 $6,0005,000-5,499 $6,5005,500-5,999 $7,0006,000-6,499 $7,5006,500-6,999 $8,0007,000-7,999 $8,5008,000-8,999 $9,0009,000-9,999 $9,50010,000+ $10,000
F. KEY AGREEMENT SUMMARIES

Preliminary Draft – Subject to Revision Page 192
UW-Milwaukee Panthers
2) Facility Fee increases from $1.50 to $2.00 after five seasons.
3) District receives 100% of Fixed Ad revenue sold by the District and 20% of that sold by UWM
4) Naming Rights Payment by UWM to WCD:Years 1-3: $300,000Years 4-7: $350,000Years 8-10: $375,000Renewal five years: $400,000
F. KEY AGREEMENT SUMMARIES

Preliminary Draft – Subject to Revision Page 193
Milwaukee Admirals
Term: 10 Years 2016-17 to 2025-26 One renewal term for five
years by mutual agreement
F. KEY AGREEMENT SUMMARIES
Arena RentMinimum RentBase RentAdditional Rent
Taxes/SurchargesTicket Sales TaxTicket SurchargeAdmissions TaxParking Tax/Surcharge
Revenue SharingConcessionsNoveltiesAdvertising – Game Day AdvertisingAdvertising – PermanentNaming RightsParking (Net)
Arena ExpensesGame Day Operating ExpensesAnnual Operating ExpensesCapital Repairs/Improvements
WCD Share(3)
25%0%
100%100%
70%
Shared100%100%
Amount Paid by TeamNot Applicable
$1,500/$2,500 - (1)Not Applicable
5.6%$2.00 - (2)
Not Applicable5.6%
Team Share(3)
75%100%
0%0%
30%
Shared0%0%
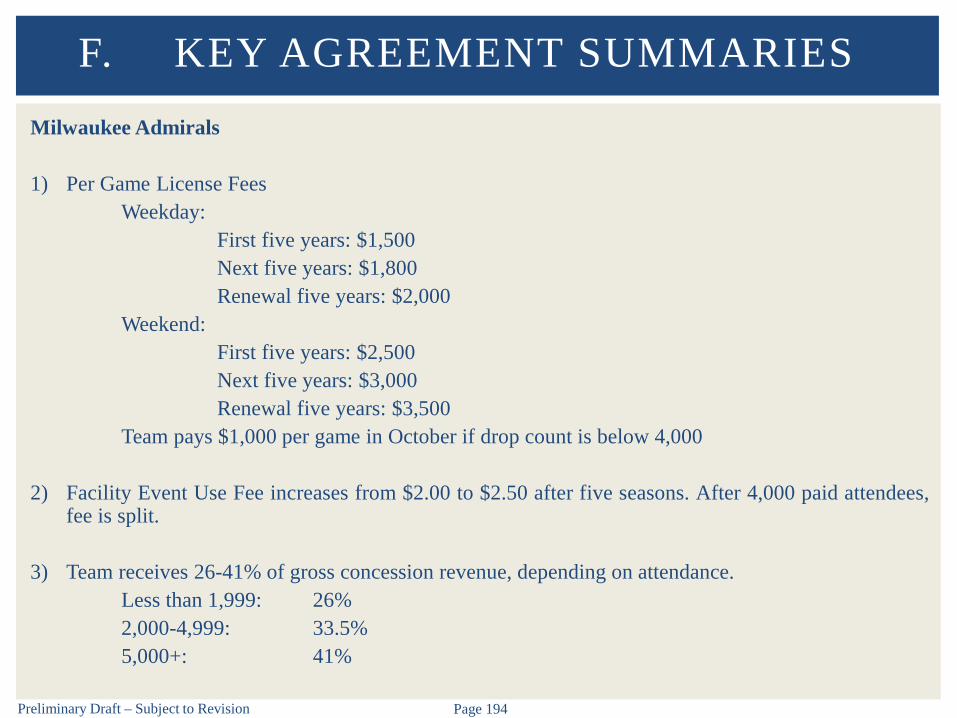
Preliminary Draft – Subject to Revision Page 194
Milwaukee Admirals
1) Per Game License FeesWeekday:
First five years: $1,500Next five years: $1,800Renewal five years: $2,000
Weekend:First five years: $2,500Next five years: $3,000Renewal five years: $3,500
Team pays $1,000 per game in October if drop count is below 4,000
2) Facility Event Use Fee increases from $2.00 to $2.50 after five seasons. After 4,000 paid attendees,fee is split.
3) Team receives 26-41% of gross concession revenue, depending on attendance.Less than 1,999: 26%2,000-4,999: 33.5%5,000+: 41%
F. KEY AGREEMENT SUMMARIES
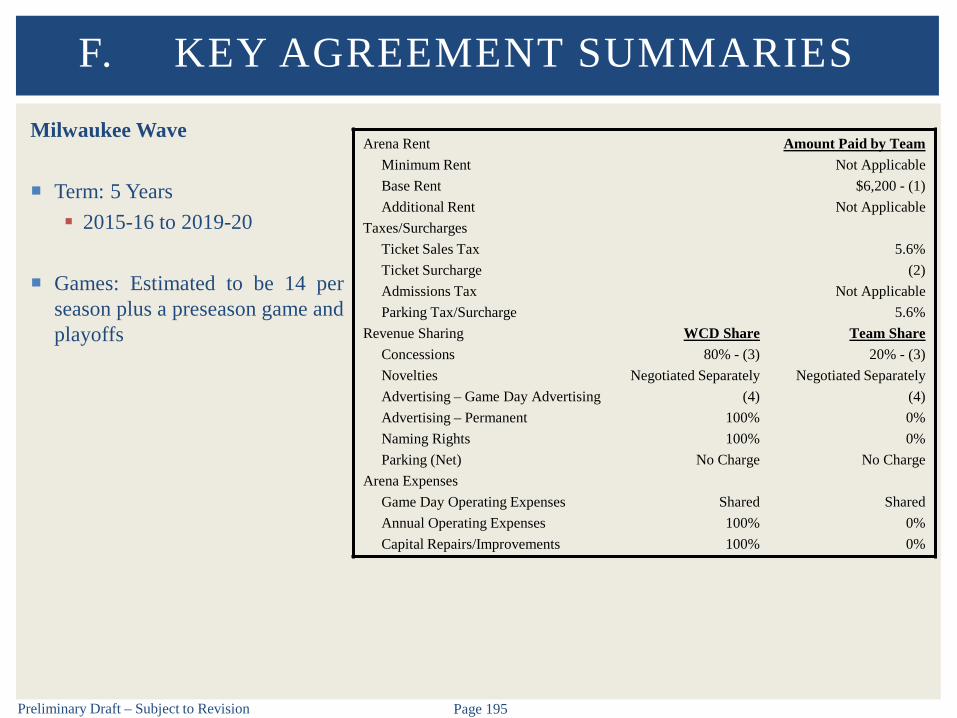
Preliminary Draft – Subject to Revision Page 195
Milwaukee Wave
Term: 5 Years 2015-16 to 2019-20
Games: Estimated to be 14 perseason plus a preseason game andplayoffs
F. KEY AGREEMENT SUMMARIES
Arena RentMinimum RentBase RentAdditional Rent
Taxes/SurchargesTicket Sales TaxTicket SurchargeAdmissions TaxParking Tax/Surcharge
Revenue SharingConcessionsNoveltiesAdvertising – Game Day AdvertisingAdvertising – PermanentNaming RightsParking (Net)
Arena ExpensesGame Day Operating ExpensesAnnual Operating ExpensesCapital Repairs/Improvements
WCD Share80% - (3)
Negotiated Separately(4)
100%100%
No Charge
Shared100%100%
Amount Paid by TeamNot Applicable
$6,200 - (1)Not Applicable
5.6%(2)
Not Applicable5.6%
Team Share20% - (3)
Negotiated Separately(4)0%0%
No Charge
Shared0%0%

Preliminary Draft – Subject to Revision Page 196
Milwaukee Wave
1) License Fee:2015-16: $6,200 Per Game2016-17: $6,400 Per Game2017-18: $6,600 Per Game2018-19: $6,800 Per Game2019-20: $7,000 Per Game
2) Facility Fee:First 1,500 paid tickets: $1.50Second 1,500 paid tickets: $1.00Additional tickets over 3,000: None
3) Team is rebated 20% of net F&B revenue after the first $3,000
4) Team receives 100% of advertising revenues from the turf and 50% of revenues from video,scoreboard, concourses, and others.
F. KEY AGREEMENT SUMMARIES

G. CAPITAL REPAIRS HISTORY
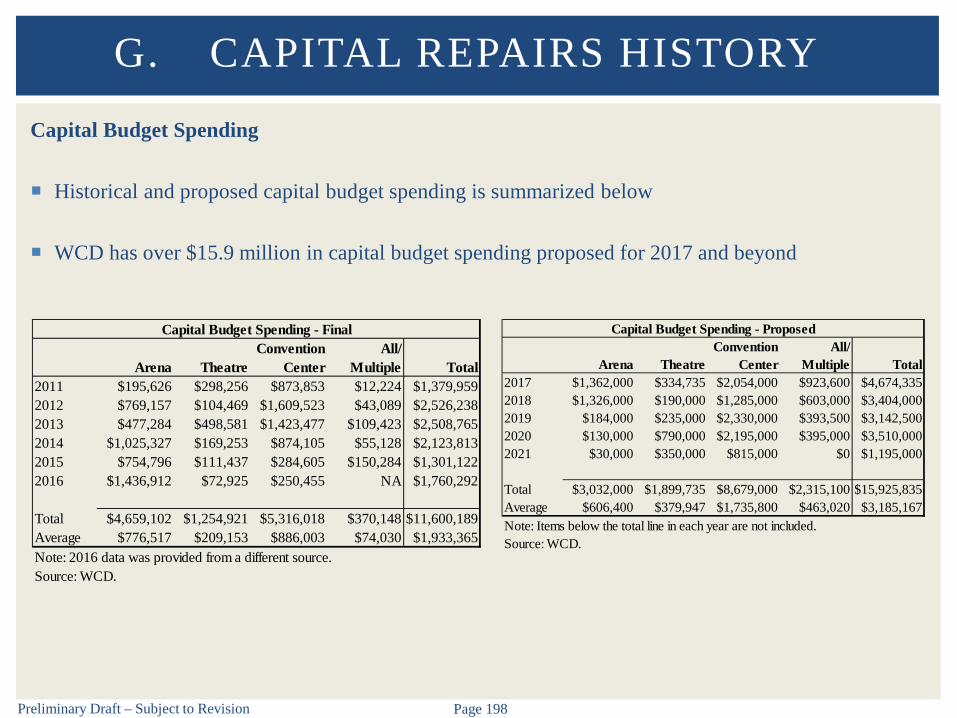
Preliminary Draft – Subject to Revision Page 198
Capital Budget Spending
Historical and proposed capital budget spending is summarized below
WCD has over $15.9 million in capital budget spending proposed for 2017 and beyond
G. CAPITAL REPAIRS HISTORY
Arena TheatreConvention
CenterAll/
Multiple Total2011 $195,626 $298,256 $873,853 $12,224 $1,379,9592012 $769,157 $104,469 $1,609,523 $43,089 $2,526,2382013 $477,284 $498,581 $1,423,477 $109,423 $2,508,7652014 $1,025,327 $169,253 $874,105 $55,128 $2,123,8132015 $754,796 $111,437 $284,605 $150,284 $1,301,1222016 $1,436,912 $72,925 $250,455 NA $1,760,292
Total $4,659,102 $1,254,921 $5,316,018 $370,148 $11,600,189Average $776,517 $209,153 $886,003 $74,030 $1,933,365Note: 2016 data was provided from a different source.Source: WCD.
Capital Budget Spending - Final
Arena TheatreConvention
CenterAll/
Multiple Total2017 $1,362,000 $334,735 $2,054,000 $923,600 $4,674,3352018 $1,326,000 $190,000 $1,285,000 $603,000 $3,404,0002019 $184,000 $235,000 $2,330,000 $393,500 $3,142,5002020 $130,000 $790,000 $2,195,000 $395,000 $3,510,0002021 $30,000 $350,000 $815,000 $0 $1,195,000
Total $3,032,000 $1,899,735 $8,679,000 $2,315,100 $15,925,835Average $606,400 $379,947 $1,735,800 $463,020 $3,185,167Note: Items below the total line in each year are not included.Source: WCD.
Capital Budget Spending - Proposed

H. SITE VISIT OBSERVATIONS
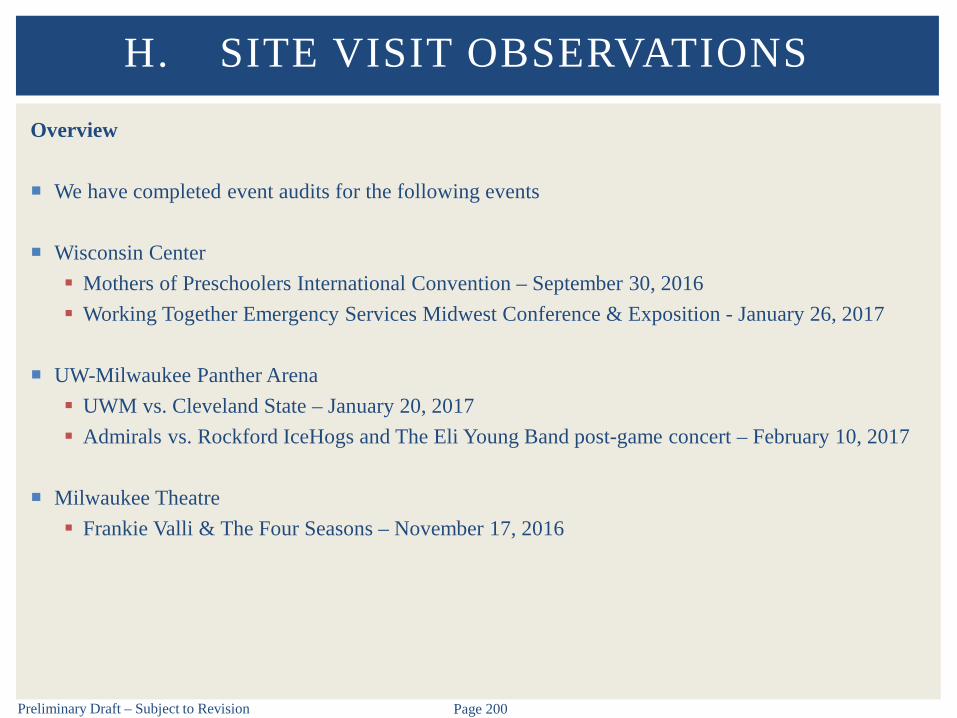
Preliminary Draft – Subject to Revision Page 200
Overview
We have completed event audits for the following events
Wisconsin Center Mothers of Preschoolers International Convention – September 30, 2016 Working Together Emergency Services Midwest Conference & Exposition - January 26, 2017
UW-Milwaukee Panther Arena UWM vs. Cleveland State – January 20, 2017 Admirals vs. Rockford IceHogs and The Eli Young Band post-game concert – February 10, 2017
Milwaukee Theatre Frankie Valli & The Four Seasons – November 17, 2016
H. SITE VISIT OBSERVATIONS

Preliminary Draft – Subject to Revision Page 201
Wisconsin Center
Facility were clean and well-maintained
Meeting rooms, ballroom, and exhibit halls were clean and well-maintained
WCD Event Manager on-site was engaged and had good communication with Event Representative
Set-up appeared to meet Event Representative’s needs
Loading dock well-managed with incoming vendor vehicles, equipment, and booth supplies
Ushering staff had an efficient manner – not overly friendly or welcoming to attendees
Staffing levels of ushers appeared to be consistent with the number of attendees
Café staff appeared to be efficient, but not welcoming or engaging with attendees
H. SITE VISIT OBSERVATIONS
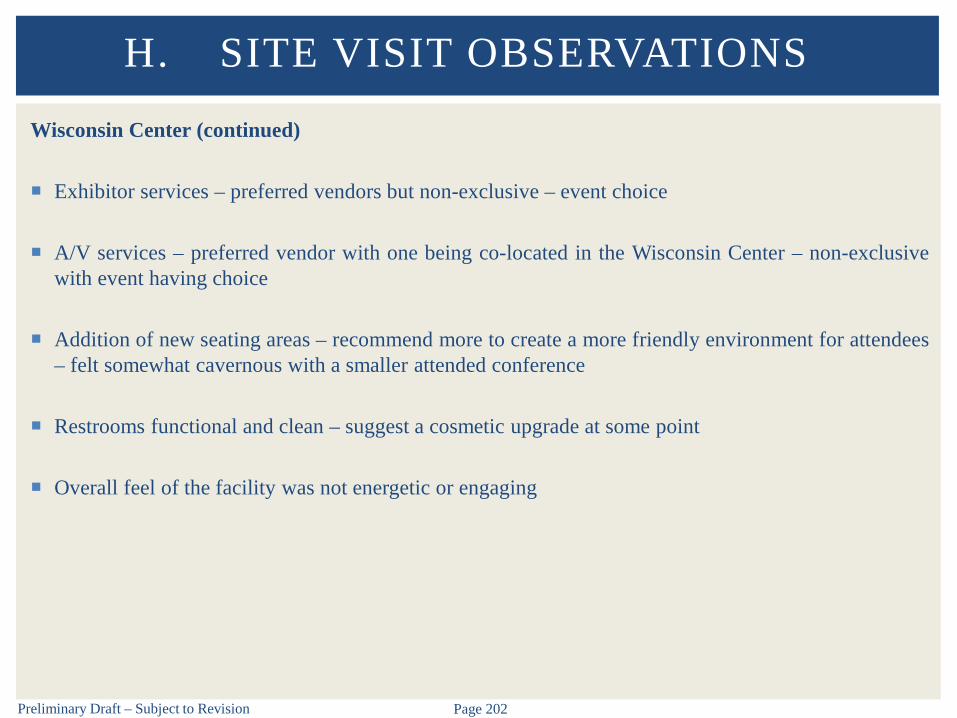
Preliminary Draft – Subject to Revision Page 202
Wisconsin Center (continued)
Exhibitor services – preferred vendors but non-exclusive – event choice
A/V services – preferred vendor with one being co-located in the Wisconsin Center – non-exclusivewith event having choice
Addition of new seating areas – recommend more to create a more friendly environment for attendees– felt somewhat cavernous with a smaller attended conference
Restrooms functional and clean – suggest a cosmetic upgrade at some point
Overall feel of the facility was not energetic or engaging
H. SITE VISIT OBSERVATIONS
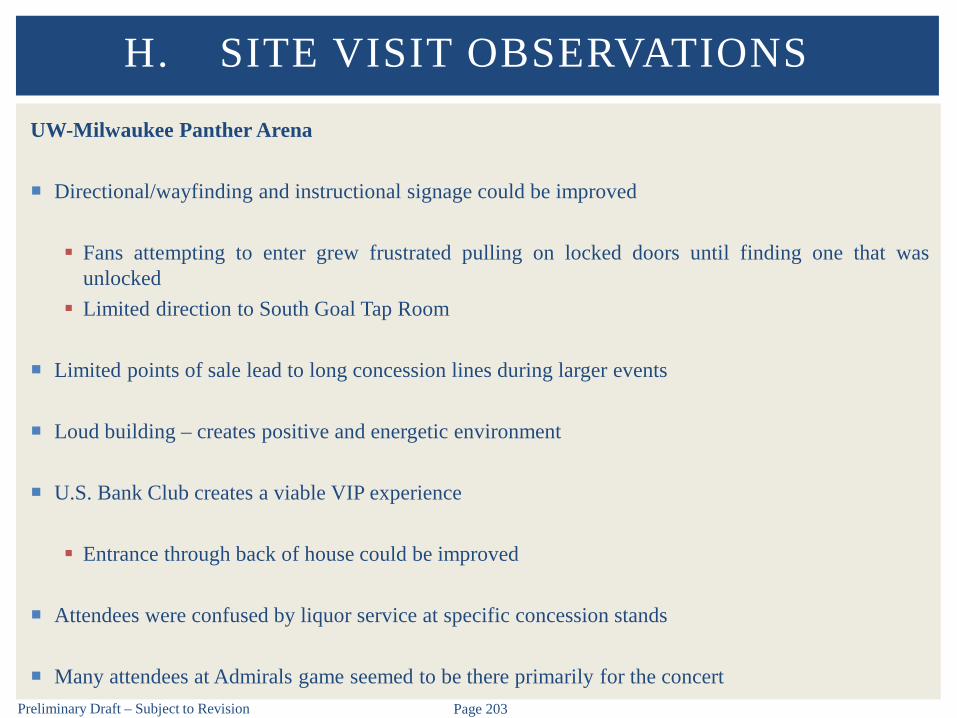
Preliminary Draft – Subject to Revision Page 203
UW-Milwaukee Panther Arena
Directional/wayfinding and instructional signage could be improved
Fans attempting to enter grew frustrated pulling on locked doors until finding one that wasunlocked
Limited direction to South Goal Tap Room
Limited points of sale lead to long concession lines during larger events
Loud building – creates positive and energetic environment
U.S. Bank Club creates a viable VIP experience
Entrance through back of house could be improved
Attendees were confused by liquor service at specific concession stands
Many attendees at Admirals game seemed to be there primarily for the concert
H. SITE VISIT OBSERVATIONS
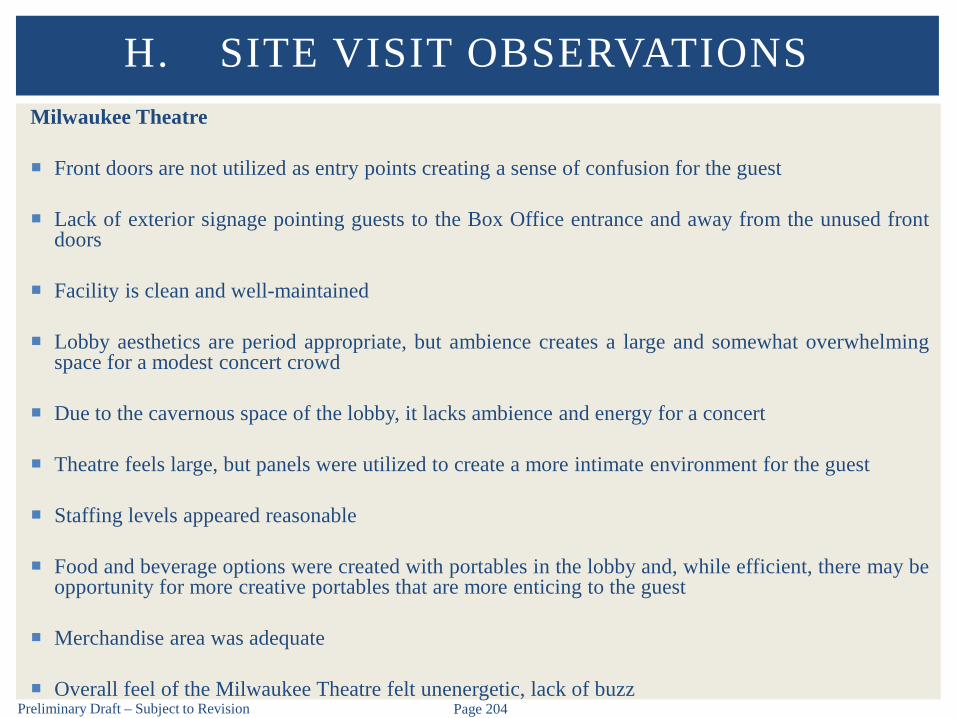
Preliminary Draft – Subject to Revision Page 204
Milwaukee Theatre
Front doors are not utilized as entry points creating a sense of confusion for the guest
Lack of exterior signage pointing guests to the Box Office entrance and away from the unused frontdoors
Facility is clean and well-maintained
Lobby aesthetics are period appropriate, but ambience creates a large and somewhat overwhelmingspace for a modest concert crowd
Due to the cavernous space of the lobby, it lacks ambience and energy for a concert
Theatre feels large, but panels were utilized to create a more intimate environment for the guest
Staffing levels appeared reasonable
Food and beverage options were created with portables in the lobby and, while efficient, there may beopportunity for more creative portables that are more enticing to the guest
Merchandise area was adequate
Overall feel of the Milwaukee Theatre felt unenergetic, lack of buzz
H. SITE VISIT OBSERVATIONS

III. MARKET OVERVIEW

Preliminary Draft – Subject to Revision Page 206
Overview
General market conditions are important to understand when evaluating the overall performance ofany public assembly facility
Factors such as demographics, the vibrancy of the area immediately surrounding a facility, and overalldestination appeal to both event organizers and attendees can all impact a facility’s overallcompetitiveness within the broader marketplace
We have completed an overview of the Milwaukee market that includes the following Overview of Milwaukee’s demographic characteristics Hotel and airport data Competitive facilities Demographic comparison of Milwaukee with similar sized markets Demographic comparison of Milwaukee with comparable complexes Comparable complex case studies Local sports teams Festivals/other events Downtown development General observations
III. MARKET OVERVIEW
A. DEMOGRAPHIC OVERVIEW
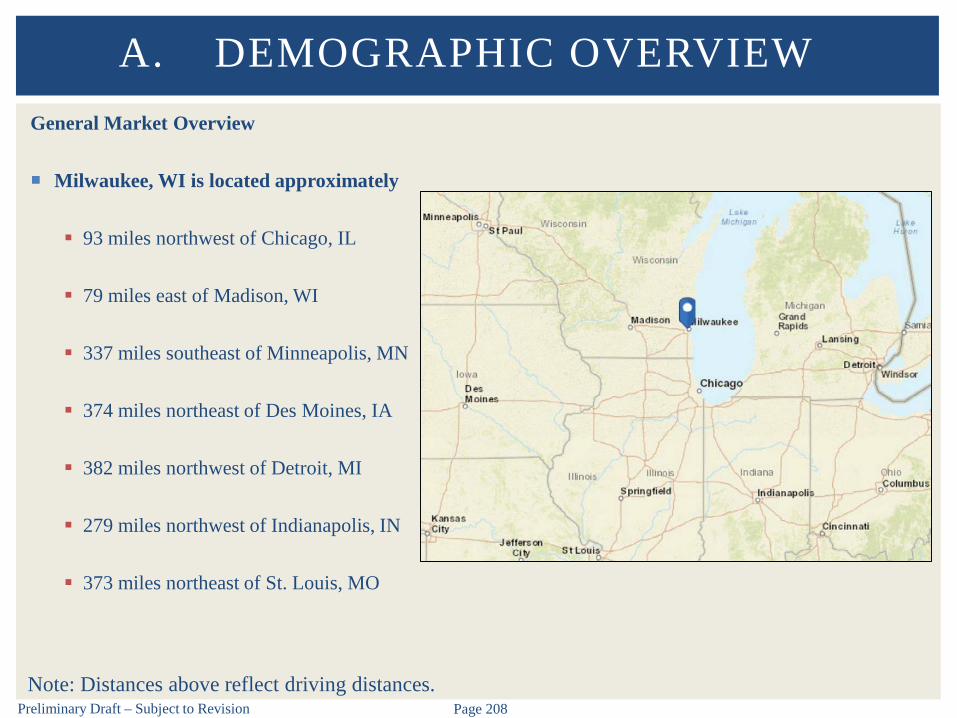
Preliminary Draft – Subject to Revision Page 208
General Market Overview
Milwaukee, WI is located approximately
93 miles northwest of Chicago, IL
79 miles east of Madison, WI
337 miles southeast of Minneapolis, MN
374 miles northeast of Des Moines, IA
382 miles northwest of Detroit, MI
279 miles northwest of Indianapolis, IN
373 miles northeast of St. Louis, MO
A. DEMOGRAPHIC OVERVIEW
Note: Distances above reflect driving distances.

Preliminary Draft – Subject to Revision Page 209
General Market Overview
City of Milwaukee Border
A. DEMOGRAPHIC OVERVIEW
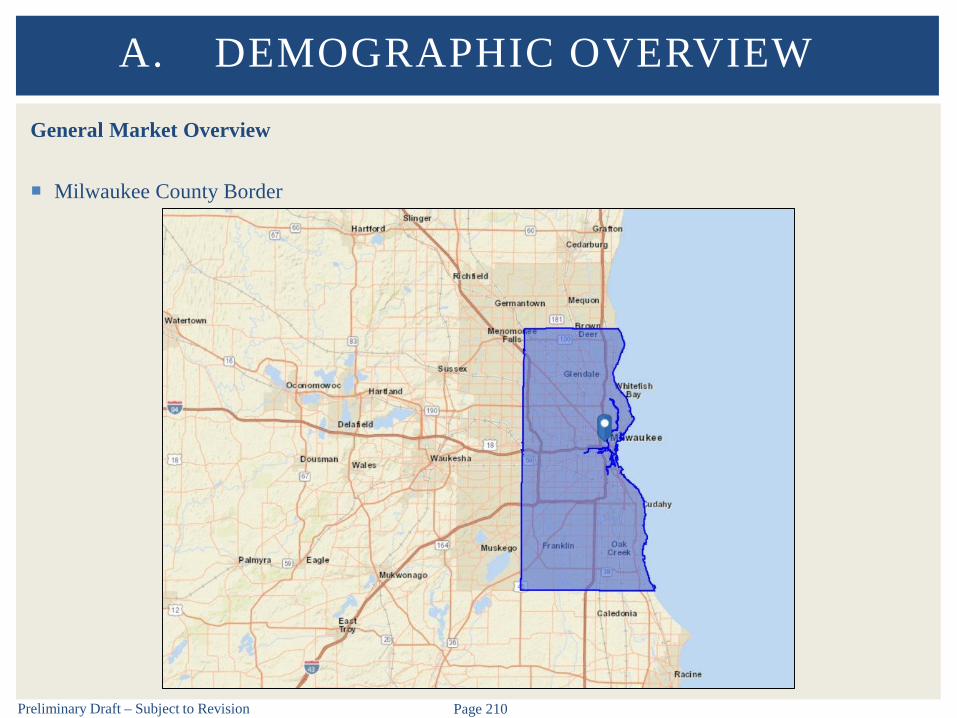
Preliminary Draft – Subject to Revision Page 210
General Market Overview
Milwaukee County Border
A. DEMOGRAPHIC OVERVIEW
Preliminary Draft – Subject to Revision Page 211
General Market Overview – Combined Statistical Areas
A core based statistical area (CBSA) is an area consisting of a conglomeration of counties. A CBSA isfurther defined as a metropolitan or micropolitan CBSA. A metropolitan CBSA consists of ageographic area with an urban core population of at least 50,000. A micropolitan CBSA consists of ageographic area with an urban core population of between 10,000 and 49,999.
Milwaukee’s data will be based on the Milwaukee-Waukesha-West Allis, WI CBSA
Our primary source for demographic information is Esri Esri is an international supplier of geographic information system (GIS) software, web GIS and
geodatabase management applications – utilizes U.S. Census Bureau data Esri has a team of demographers, statisticians, and economists who use a wide variety of public
and private data sources to develop a uniquely accurate and detailed picture of local population,economic, housing, and business characteristics
Ranked most accurate data in 2011 benchmarking study of five major demographic vendors
A. DEMOGRAPHIC OVERVIEW
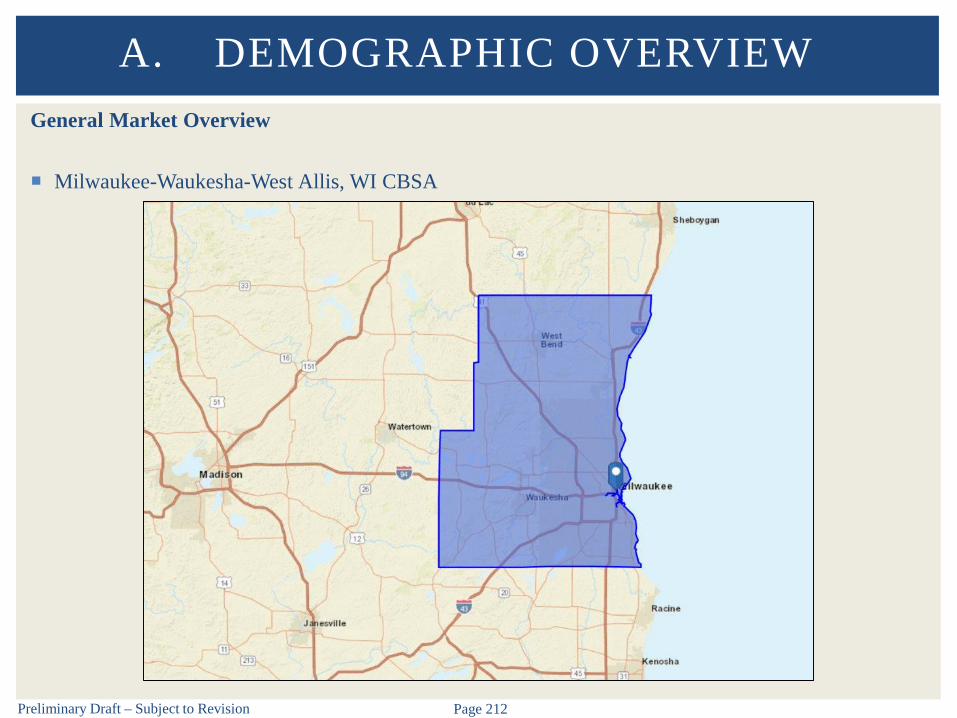
Preliminary Draft – Subject to Revision Page 212
General Market Overview
Milwaukee-Waukesha-West Allis, WI CBSA
A. DEMOGRAPHIC OVERVIEW

Preliminary Draft – Subject to Revision Page 213
General Market Overview
Milwaukee-Waukesha-West Allis, WI CBSA includes the following counties:
Waukesha
Ozaukee
Washington
Milwaukee
A. DEMOGRAPHIC OVERVIEW

Preliminary Draft – Subject to Revision Page 214
General Market Overview – Population
A. DEMOGRAPHIC OVERVIEW
City of Milwaukee Ring Drive TimeMilwaukee County CBSA 30 Miles 30 Minutes
Population2021 Projection 593,404 949,032 1,584,003 1,741,034 1,230,2872016 Estimate 592,535 946,673 1,569,070 1,724,891 1,222,9592010 Census 594,746 947,735 1,555,908 1,711,461 1,219,0102000 Census 596,827 940,164 1,500,741 1,652,443 1,198,348
Growth 2016-2021 0.1% 0.2% 1.0% 0.9% 0.6%Growth 2010-2016 -0.4% -0.1% 0.8% 0.8% 0.3%Growth 2000-2010 -0.3% 0.8% 3.7% 3.6% 1.7%Source: Esri 2016.
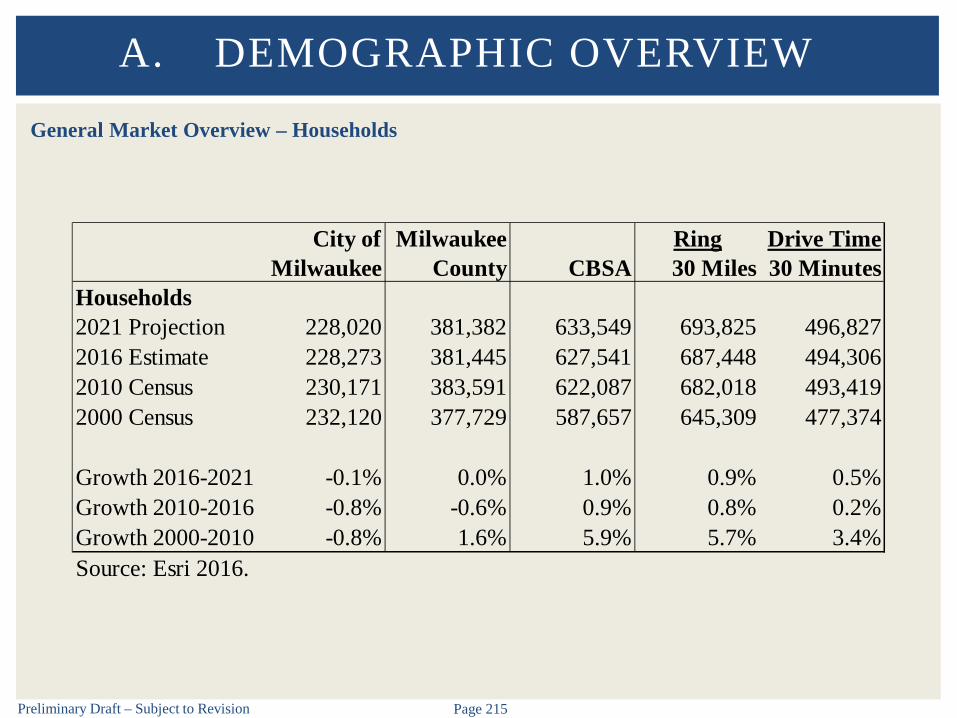
Preliminary Draft – Subject to Revision Page 215
General Market Overview – Households
A. DEMOGRAPHIC OVERVIEW
City of Milwaukee Ring Drive TimeMilwaukee County CBSA 30 Miles 30 Minutes
Households2021 Projection 228,020 381,382 633,549 693,825 496,8272016 Estimate 228,273 381,445 627,541 687,448 494,3062010 Census 230,171 383,591 622,087 682,018 493,4192000 Census 232,120 377,729 587,657 645,309 477,374
Growth 2016-2021 -0.1% 0.0% 1.0% 0.9% 0.5%Growth 2010-2016 -0.8% -0.6% 0.9% 0.8% 0.2%Growth 2000-2010 -0.8% 1.6% 5.9% 5.7% 3.4%Source: Esri 2016.
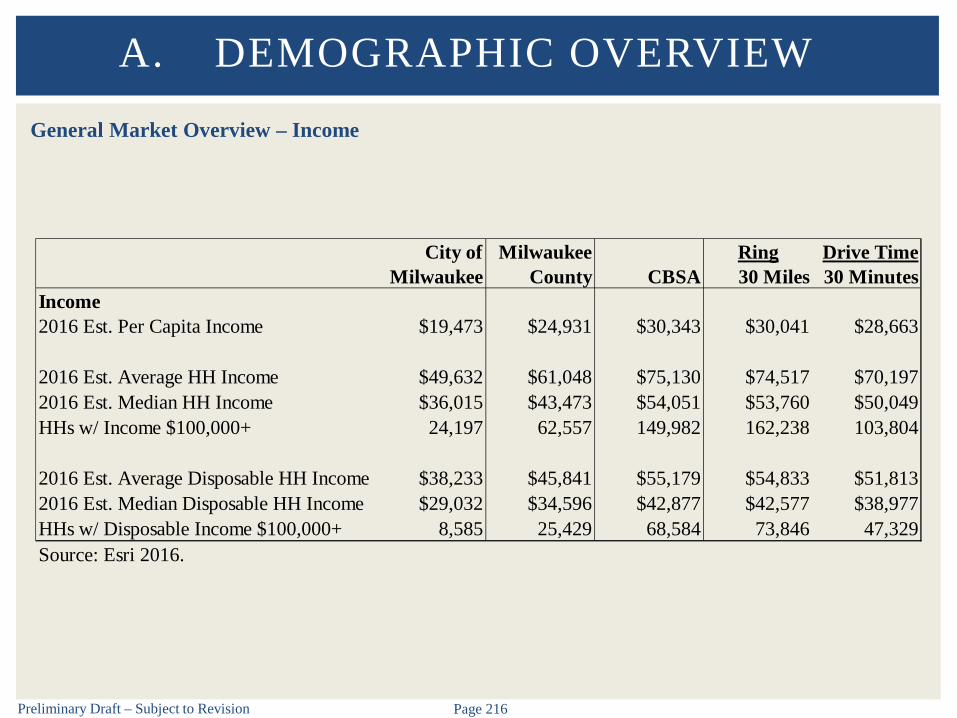
Preliminary Draft – Subject to Revision Page 216
General Market Overview – Income
A. DEMOGRAPHIC OVERVIEW
City of Milwaukee Ring Drive TimeMilwaukee County CBSA 30 Miles 30 Minutes
Income2016 Est. Per Capita Income $19,473 $24,931 $30,343 $30,041 $28,663
2016 Est. Average HH Income $49,632 $61,048 $75,130 $74,517 $70,1972016 Est. Median HH Income $36,015 $43,473 $54,051 $53,760 $50,049HHs w/ Income $100,000+ 24,197 62,557 149,982 162,238 103,804
2016 Est. Average Disposable HH Income $38,233 $45,841 $55,179 $54,833 $51,8132016 Est. Median Disposable HH Income $29,032 $34,596 $42,877 $42,577 $38,977HHs w/ Disposable Income $100,000+ 8,585 25,429 68,584 73,846 47,329Source: Esri 2016.
B. HOTEL AND AIRPORT DATA
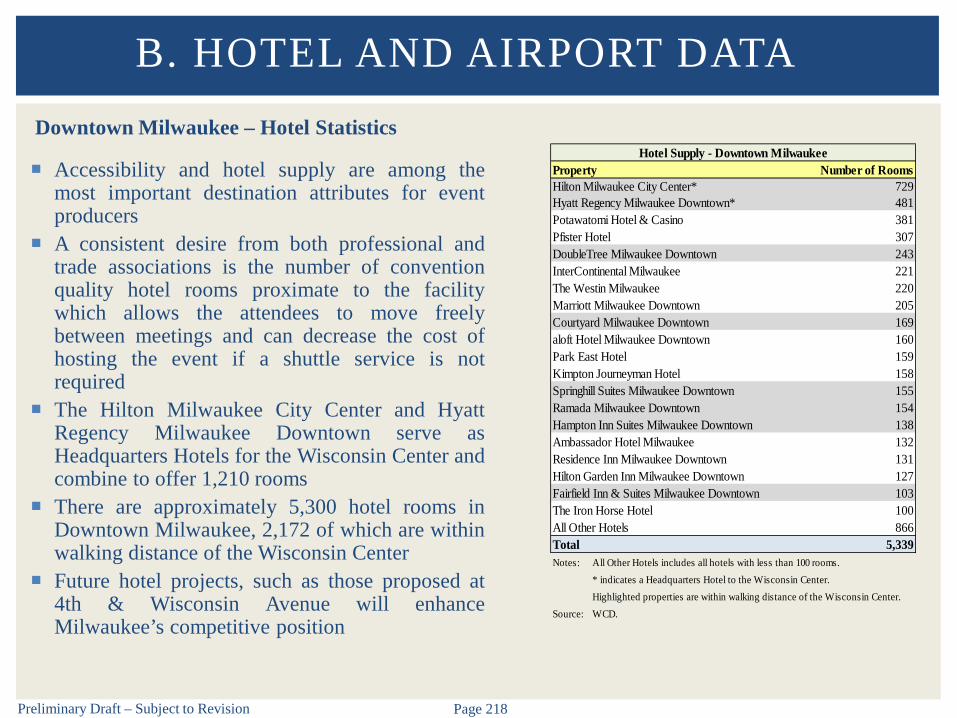
Preliminary Draft – Subject to Revision Page 218
Downtown Milwaukee – Hotel Statistics
Accessibility and hotel supply are among themost important destination attributes for eventproducers
A consistent desire from both professional andtrade associations is the number of conventionquality hotel rooms proximate to the facilitywhich allows the attendees to move freelybetween meetings and can decrease the cost ofhosting the event if a shuttle service is notrequired
The Hilton Milwaukee City Center and HyattRegency Milwaukee Downtown serve asHeadquarters Hotels for the Wisconsin Center andcombine to offer 1,210 rooms
There are approximately 5,300 hotel rooms inDowntown Milwaukee, 2,172 of which are withinwalking distance of the Wisconsin Center
Future hotel projects, such as those proposed at4th & Wisconsin Avenue will enhanceMilwaukee’s competitive position
B. HOTEL AND AIRPORT DATA
Property Number of RoomsHilton Milwaukee City Center* 729Hyatt Regency Milwaukee Downtown* 481Potawatomi Hotel & Casino 381Pfister Hotel 307DoubleTree Milwaukee Downtown 243InterContinental Milwaukee 221The Westin Milwaukee 220Marriott Milwaukee Downtown 205Courtyard Milwaukee Downtown 169aloft Hotel Milwaukee Downtown 160Park East Hotel 159Kimpton Journeyman Hotel 158Springhill Suites Milwaukee Downtown 155Ramada Milwaukee Downtown 154Hampton Inn Suites Milwaukee Downtown 138Ambassador Hotel Milwaukee 132Residence Inn Milwaukee Downtown 131Hilton Garden Inn Milwaukee Downtown 127Fairfield Inn & Suites Milwaukee Downtown 103The Iron Horse Hotel 100All Other Hotels 866Total 5,339Notes: All Other Hotels includes all hotels with less than 100 rooms.
* indicates a Headquarters Hotel to the Wisconsin Center.Highlighted properties are within walking distance of the Wisconsin Center.
Source: WCD.
Hotel Supply - Downtown Milwaukee

Preliminary Draft – Subject to Revision Page 219
Downtown Milwaukee – Hotel Statistics
The WCD facilities’ ability to attract events that generate overnight stays is impacted by theavailability and affordability of area hotels
The average daily rate (ADR) of hotel rooms in Downtown Milwaukee steadily increased from 2014to 2016
The occupancy rate at Downtown hotels was relatively consistent over the profiled four-year period,with the exception of 2014, when occupancy increased to 68.8%
B. HOTEL AND AIRPORT DATA
Downtown Milwaukee Hotel Occupancy & ADR (2013-2016)
$127 $127$133
$138$131
64.9%68.8%
65.2% 64.6% 65.9%
0%
25%
50%
75%
100%
2013 2014 2015 2016 Four-YearAverage
$0
$40
$80
$120
$160ADR Occupancy
Source: WCD.
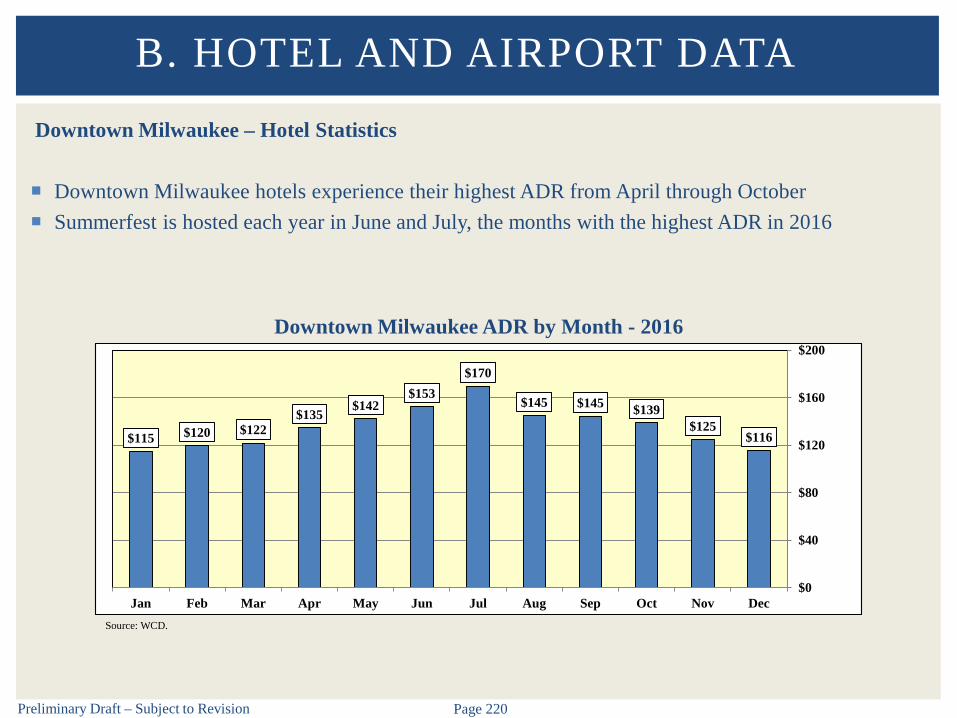
Preliminary Draft – Subject to Revision Page 220
Downtown Milwaukee – Hotel Statistics
Downtown Milwaukee hotels experience their highest ADR from April through October Summerfest is hosted each year in June and July, the months with the highest ADR in 2016
B. HOTEL AND AIRPORT DATA
$115 $120 $122$135
$142$153
$170
$145 $145 $139$125
$116
Jan Feb Mar Apr May Jun Jul Aug Sep Oct Nov Dec$0
$40
$80
$120
$160
$200Downtown Milwaukee ADR by Month - 2016
Source: WCD.
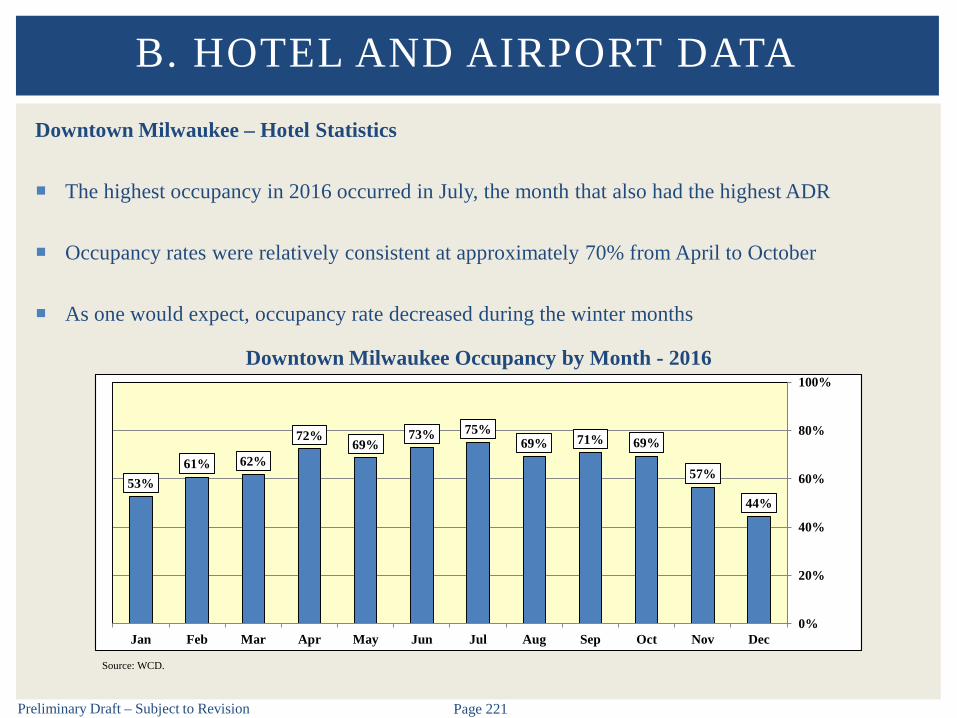
Preliminary Draft – Subject to Revision Page 221
Downtown Milwaukee – Hotel Statistics
The highest occupancy in 2016 occurred in July, the month that also had the highest ADR
Occupancy rates were relatively consistent at approximately 70% from April to October
As one would expect, occupancy rate decreased during the winter months
B. HOTEL AND AIRPORT DATA
53%61% 62%
72%69%
73% 75%69% 71% 69%
57%
44%
Jan Feb Mar Apr May Jun Jul Aug Sep Oct Nov Dec0%
20%
40%
60%
80%
100%
Source: WCD.
Downtown Milwaukee Occupancy by Month - 2016
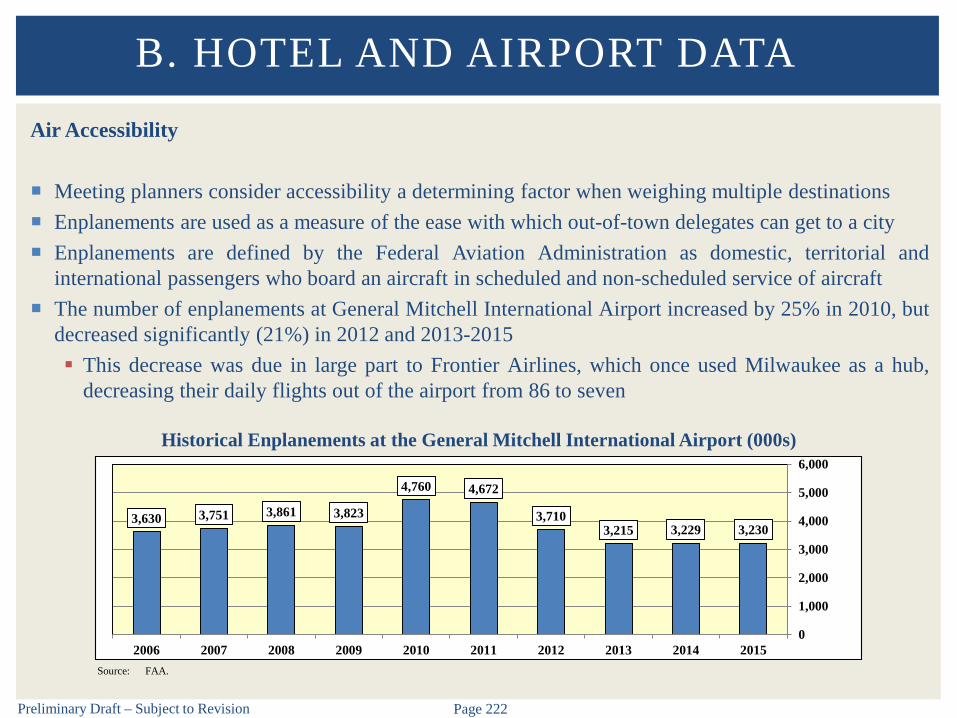
Preliminary Draft – Subject to Revision Page 222
Air Accessibility
Meeting planners consider accessibility a determining factor when weighing multiple destinations Enplanements are used as a measure of the ease with which out-of-town delegates can get to a city Enplanements are defined by the Federal Aviation Administration as domestic, territorial and
international passengers who board an aircraft in scheduled and non-scheduled service of aircraft The number of enplanements at General Mitchell International Airport increased by 25% in 2010, but
decreased significantly (21%) in 2012 and 2013-2015 This decrease was due in large part to Frontier Airlines, which once used Milwaukee as a hub,
decreasing their daily flights out of the airport from 86 to seven
B. HOTEL AND AIRPORT DATA
Historical Enplanements at the General Mitchell International Airport (000s)
3,630 3,751 3,861 3,823
4,760 4,672
3,7103,215 3,229 3,230
2006 2007 2008 2009 2010 2011 2012 2013 2014 20150
1,000
2,000
3,000
4,000
5,000
6,000
Source: FAA.

Preliminary Draft – Subject to Revision Page 223
Air Accessibility
Management is currently considering a renovation that would allow for the construction of a state-of-the-art international terminal that is more conveniently located than the current option and would helpto attract more international flights
According to Airport Management, the number of enplanements increased in 2016 as a direct result ofnew nonstop flights to major cities – Orlando, Dallas, Philadelphia, San Diego and Phoenix In 2017, new direct flights are expected to be added to Seattle, Portland and Guadalajara, Mexico
However, Milwaukee continues to face strong competition from Chicago O’Hare International andMidway International in Chicago, which combined accounted for more than 47 million passengerenplanements in 2015
B. HOTEL AND AIRPORT DATA
C. COMPETITIVE FACILITIES

Preliminary Draft – Subject to Revision Page 225
State Convention, Meeting & Expo Facilities
Other than the Wisconsin Center, eight facilities in the State offer a minimum of 50,000 SF of totalfunction space including the Exposition Center at Wisconsin State Fair Park and the Alliant EnergyCenter, each of which offer at least 100,000 SF of exhibit space
While many of these facilities do not directly compete with the Wisconsin Center for largeconventions, tradeshows and consumer shows, they do serve as alternative locations for Stateassociations as well as corporate and meeting business
Resort hotels with exhibit and/or meeting space traditionally can have an advantage over stand-alonemeeting facilities/convention centers because they control all major components of an event (e.g.,function space, lodging and food/beverage) under one roof. Since these facilities are the primarybeneficiary of all revenue streams, they can negotiate packages in any or all areas to attract business.
C. COMPETITIVE FACILITIES

Preliminary Draft – Subject to Revision Page 226
State Convention, Meeting & Expo Facilities
C. COMPETITIVE FACILITIES
Facility LocationExhibit Hall SF
Ballroom SF
Meeting Room SF
Total Function SF
Ratio of Ballroom/ Meeting SF to
Exhibit SF
Divisible Meeting
Rooms
Average SF/Meeting
RoomWisconsin Center Milwaukee 188,700 37,500 39,600 265,800 41% 28 1,400Exposition Center at Wisconsin State Fair Park West Allis 199,000 0 3,700 202,700 2% 6 600Chula Vista Resort Wisconsin Dells 90,000 19,900 19,000 128,900 43% 18 1,100Alliant Energy Center - Exhibition Hall Madison 100,000 0 20,300 120,300 20% 14 1,500KI Convention Center Green Bay 35,000 25,200 12,000 72,200 106% 13 900La Crosse Center La Crosse 56,700 6,700 6,300 69,700 23% 8 800Monona Terrace Community and Convention Center Madison 37,200 13,500 12,100 62,800 69% 17 700Kalahari Resorts Wisconsin Dells 0 37,800 23,600 61,400 n/a 19 1,200Central Wisconsin Convention & Expo Center Rothschild 25,600 24,200 3,300 53,100 107% 8 400Average (Excluding Wisconsin Center) 67,900 15,900 12,500 96,400 53% 13 900Median (Excluding Wisconsin Center) 46,950 16,700 12,050 70,950 43% 14 850Notes: Includes facilities with at least 50,000 SF of total function space.
Sorted in descending order by total function square feet.
Prefunction, concourse, lobby and theater/auditorium spaces are excluded from all centers.
Event space square footage is rounded to the nearest hundredth.
n/a denotes not applicable.
Sources: Individual facilities; secondary research.
Supply of Convention, Meeting & Expo Facilities in Wisconsin

Preliminary Draft – Subject to Revision Page 227
Exposition Center at Wisconsin State Fair ParkWest Allis
The Exposition Center offers more than 200,000SF of space including a 199,000 SF exhibit hallthat is divisible into three separate halls
The facility also features four meeting rooms andtwo board rooms
In addition to the Exposition Center, the StateFair Park features a Youth Center, variouspavilions, agricultural facilities, more than300,000 SF of parking and a 2,000-seatamphitheater
State Fair Park hosted more than one millionattendees each year since 2013, including theWisconsin State Fair which is held in August
C. COMPETITIVE FACILITIES

Preliminary Draft – Subject to Revision Page 228
Chula Vista ResortWisconsin Dells
Meeting facilities include more than 120,000 SF of meeting, ballroom and exhibit hall space includingthe 90,000 SF clear-span, Wisconsin Dells Center The new Wisconsin Dells Center offers 13,000 SF of pre-function space and 1,200 parking stalls
and primarily hosts sporting events, expos and special events
The resort features housing accommodations including rooms, suites, condominiums and villas
Amenities include various dining options, a spa, indoor water park, and other on-site attractions
Recent renovations include updated guest rooms and enhanced sound, A/V equipment, and Wi-Fi
C. COMPETITIVE FACILITIES

Preliminary Draft – Subject to Revision Page 229
Alliant Energy Center – Exhibition HallMadison
Alliant Energy Center offers the Veterans MemorialColiseum, Exhibition Hall, Willow Island outdoorspace, and agricultural components such as TheNew Holland Pavilions and The Arena
The Exhibition Hall features 100,000 SF ofunobstructed exhibit space that is divisible into fourhalls
The 14 meeting rooms offer more than 20,000 SF offlexible space
The complex hosts a wide variety of event activity,with the exhibition hall primarily hosting tradeshows, banquets, sporting events and meetings
Dane County is contemplating variousrenovations/improvements both the Exhibition Halland the Coliseum
C. COMPETITIVE FACILITIES
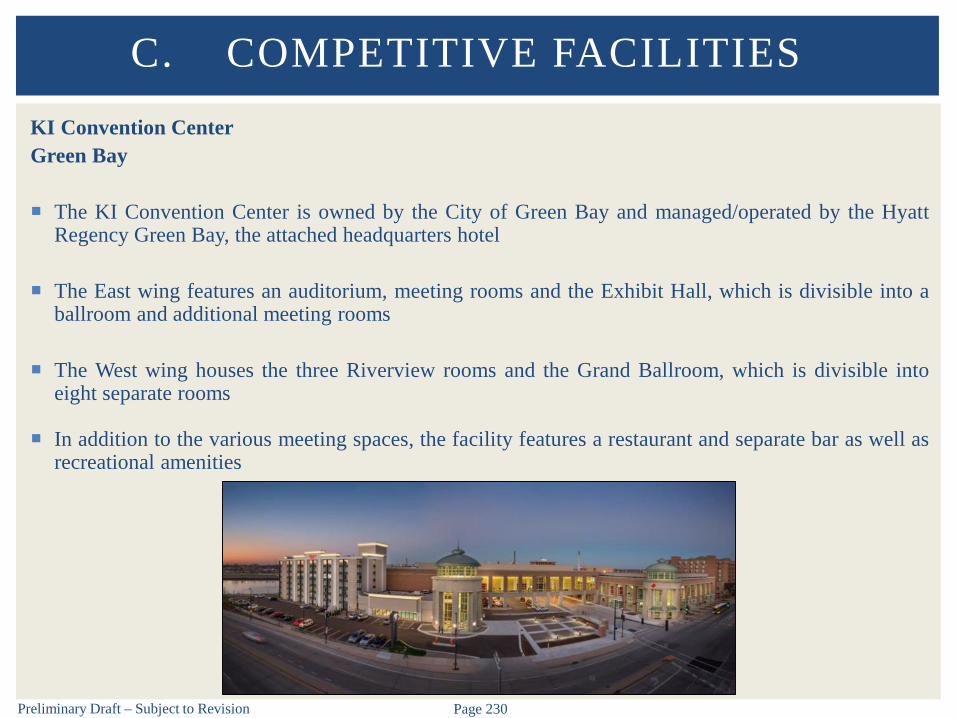
Preliminary Draft – Subject to Revision Page 230
KI Convention CenterGreen Bay
The KI Convention Center is owned by the City of Green Bay and managed/operated by the HyattRegency Green Bay, the attached headquarters hotel
The East wing features an auditorium, meeting rooms and the Exhibit Hall, which is divisible into aballroom and additional meeting rooms
The West wing houses the three Riverview rooms and the Grand Ballroom, which is divisible intoeight separate rooms
In addition to the various meeting spaces, the facility features a restaurant and separate bar as well asrecreational amenities
C. COMPETITIVE FACILITIES
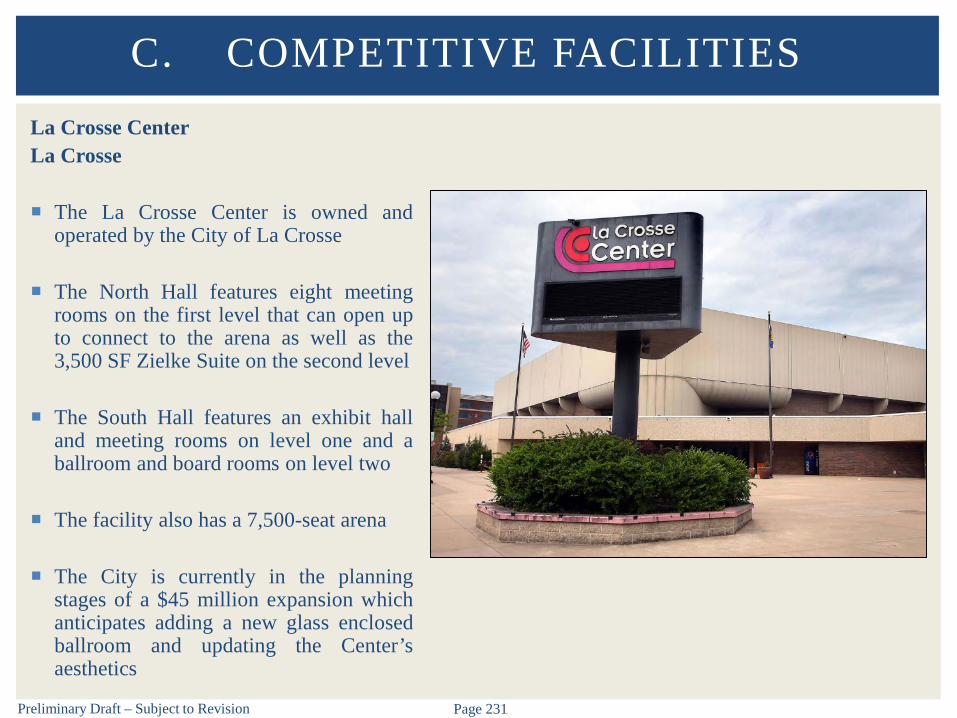
Preliminary Draft – Subject to Revision Page 231
La Crosse CenterLa Crosse
The La Crosse Center is owned andoperated by the City of La Crosse
The North Hall features eight meetingrooms on the first level that can open upto connect to the arena as well as the3,500 SF Zielke Suite on the second level
The South Hall features an exhibit halland meeting rooms on level one and aballroom and board rooms on level two
The facility also has a 7,500-seat arena
The City is currently in the planningstages of a $45 million expansion whichanticipates adding a new glass enclosedballroom and updating the Center’saesthetics
C. COMPETITIVE FACILITIES
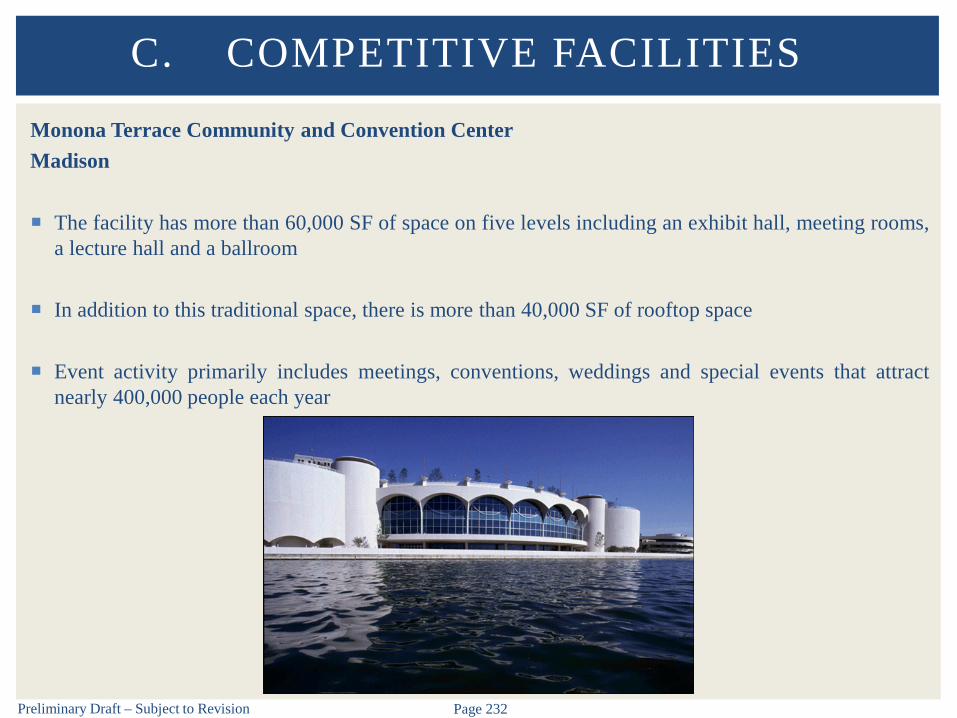
Preliminary Draft – Subject to Revision Page 232
Monona Terrace Community and Convention CenterMadison
The facility has more than 60,000 SF of space on five levels including an exhibit hall, meeting rooms,a lecture hall and a ballroom
In addition to this traditional space, there is more than 40,000 SF of rooftop space
Event activity primarily includes meetings, conventions, weddings and special events that attractnearly 400,000 people each year
C. COMPETITIVE FACILITIES

Preliminary Draft – Subject to Revision Page 233
Kalahari ResortsWisconsin Dells
The facility offers African inspired housing accommodations and meeting spaces as well as an indoor-outdoor water park
The meeting facilities do not feature any exhibit space but offer two large ballrooms, each of which isdivisible into eight spaces, and 19 carpeted meeting rooms
The resort offers a 154,000 SF lot that features 2,000 free parking spaces and can be used for outdoorevents
C. COMPETITIVE FACILITIES
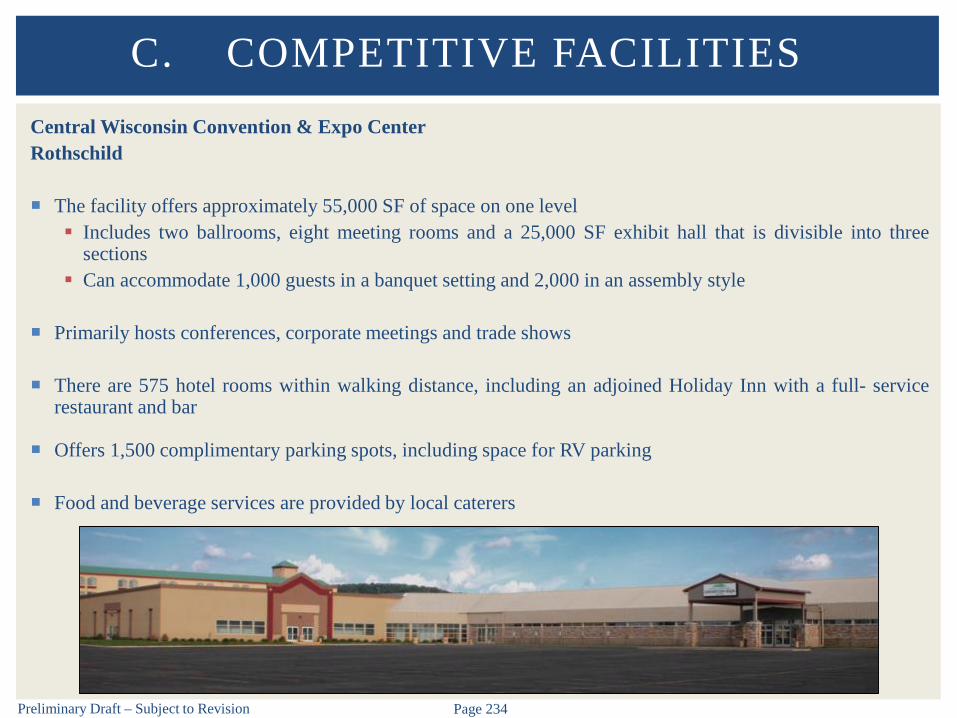
Preliminary Draft – Subject to Revision Page 234
Central Wisconsin Convention & Expo CenterRothschild
The facility offers approximately 55,000 SF of space on one level Includes two ballrooms, eight meeting rooms and a 25,000 SF exhibit hall that is divisible into three
sections Can accommodate 1,000 guests in a banquet setting and 2,000 in an assembly style
Primarily hosts conferences, corporate meetings and trade shows
There are 575 hotel rooms within walking distance, including an adjoined Holiday Inn with a full- servicerestaurant and bar
Offers 1,500 complimentary parking spots, including space for RV parking
Food and beverage services are provided by local caterers
C. COMPETITIVE FACILITIES
Preliminary Draft – Subject to Revision Page 235
Competitive Venues – Local
Existing and planned competitive inventory of arenas/stadiums and music/entertainment venues in theMilwaukee market will impact the operations of the WCD facilities
Patrons, advertising/sponsorships, ancillary revenues
There are a number of competitive arenas/stadiums in the Milwaukee market in addition to UW-Milwaukee Panther Arena
New Milwaukee Bucks Arena BMO Harris Bradley Center (to be demolished) Miller Park
C. COMPETITIVE FACILITIES
Preliminary Draft – Subject to Revision Page 236
Competitive Venues – Local
There are a number of competitive music/entertainment venues in the Milwaukee market in additionto the Milwaukee Theatre
Outdoor Venues Marcus Amphitheater American Family Insurance Amphitheater Alpine Valley Music Theatre (Regional)
Theaters/Indoor Venues Eagles Ballroom Modjeska Theater Pitman Theatre The Pabst Theater Group Marcus Center for the Performing Arts
C. COMPETITIVE FACILITIES

Preliminary Draft – Subject to Revision Page 237
Competitive Venues – Local
Wisconsin Entertainment and Sports Center Opening: 2018 Capacity: 17,500 Luxury Suites: TBD Club Seats: TBD Tenants: Milwaukee Bucks, Marquette University
BMO Harris Bradley Center Opened: 1988 Capacity: 18,717 Luxury Suites: 42 Club Seats: 500 Tenants: Milwaukee Bucks, Marquette University Expected to be demolished after 2018
C. COMPETITIVE FACILITIES
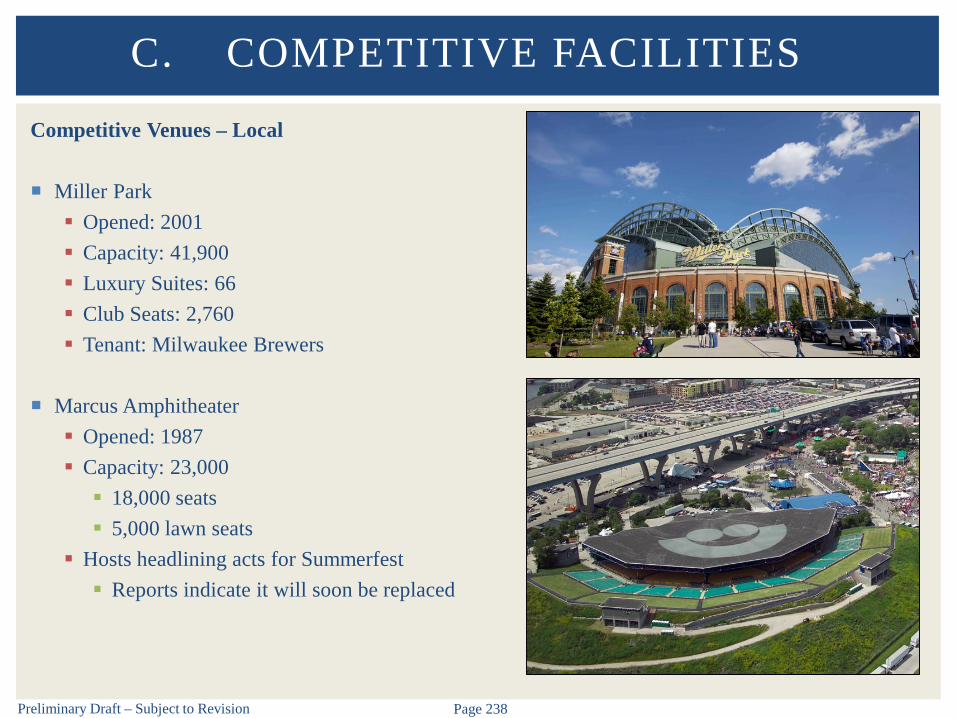
Preliminary Draft – Subject to Revision Page 238
Competitive Venues – Local
Miller Park Opened: 2001 Capacity: 41,900 Luxury Suites: 66 Club Seats: 2,760 Tenant: Milwaukee Brewers
Marcus Amphitheater Opened: 1987 Capacity: 23,000 18,000 seats 5,000 lawn seats
Hosts headlining acts for Summerfest Reports indicate it will soon be replaced
C. COMPETITIVE FACILITIES

Preliminary Draft – Subject to Revision Page 239
Competitive Venues – Local
American Family Insurance Amphitheater
Opening: 2019-2020 Capacity: 23,000 Cost: $30-$35 million Will be the new primary venue for
Summerfest
C. COMPETITIVE FACILITIES

Preliminary Draft – Subject to Revision Page 240
Local Supply of Theaters in Milwaukee
Milwaukee is a highly competitive market fortheaters as indicated by the local supply –Milwaukee Theatre is the largest of its competitiveset
Although similar in size, the Eagles Ballroom offersstanding room, is more club-like in nature and ispart of a larger complex with multiple performancerooms referred to as The Rave/Eagles Club
The Pabst Theater Group has three performancespaces ranging in capacity from 990 to 2,450 withan emphasis on concert activity
The Marcus Center for the Performing Arts has fourperformance areas with the smallest spaceaccommodating 400 and the largest 2,300. TheMarcus Center has six resident companies and ishome to the majority of the Broadway events in themarket in addition to concerts, familyprogramming, and special events.
C. COMPETITIVE FACILITIES
Facility CapacityMilwaukee Theatre 4,090 Eagles Ballroom 4,000 Modjeska Theater* 1,200 Pitman Theatre 930
500
Riverside Theater 2,450 Pabst Theater 1,340 Turner Hall Ballroom 990
Uihlein Hall 2,300 Todd Wehr Theater 500 Wilson Theater at Vogel Hall 470 Peck Pavilion 400 Note: * Facility is currently being reconstructed.
Sources: Indiv idual facilities; Pollstar; secondary research.
The Northern Lights Theater
Select Auditoriums, Theaters and Entertainment Venues in Milwaukee
The Pabst Theater Group
Marcus Center for the Performing Arts
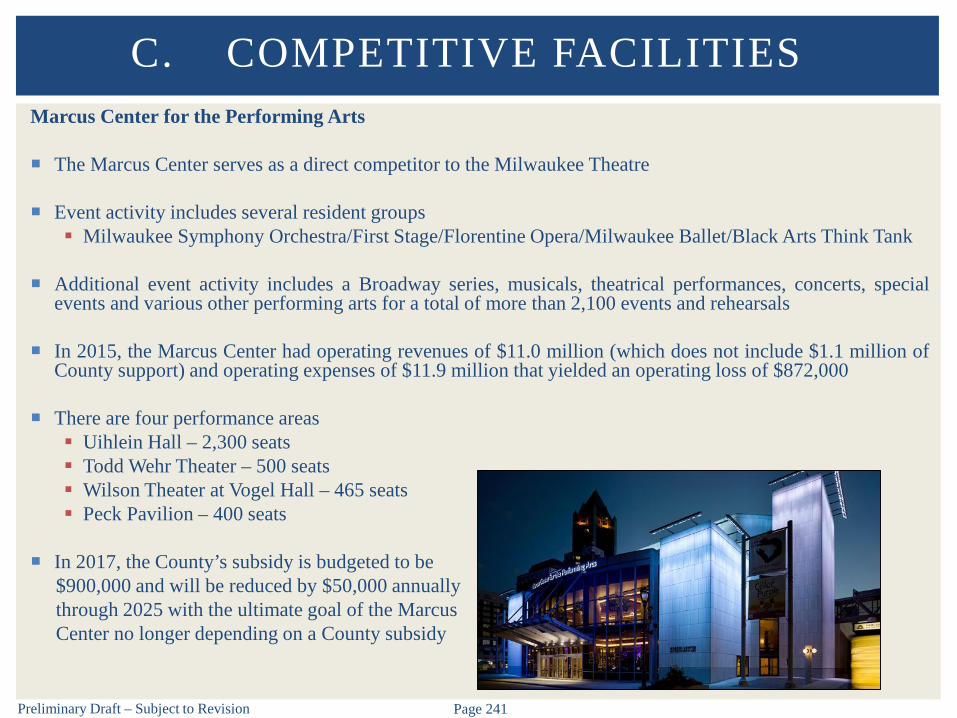
Preliminary Draft – Subject to Revision Page 241
Marcus Center for the Performing Arts
The Marcus Center serves as a direct competitor to the Milwaukee Theatre
Event activity includes several resident groups Milwaukee Symphony Orchestra/First Stage/Florentine Opera/Milwaukee Ballet/Black Arts Think Tank
Additional event activity includes a Broadway series, musicals, theatrical performances, concerts, specialevents and various other performing arts for a total of more than 2,100 events and rehearsals
In 2015, the Marcus Center had operating revenues of $11.0 million (which does not include $1.1 million ofCounty support) and operating expenses of $11.9 million that yielded an operating loss of $872,000
There are four performance areas Uihlein Hall – 2,300 seats Todd Wehr Theater – 500 seats Wilson Theater at Vogel Hall – 465 seats Peck Pavilion – 400 seats
In 2017, the County’s subsidy is budgeted to be$900,000 and will be reduced by $50,000 annuallythrough 2025 with the ultimate goal of the MarcusCenter no longer depending on a County subsidy
C. COMPETITIVE FACILITIES
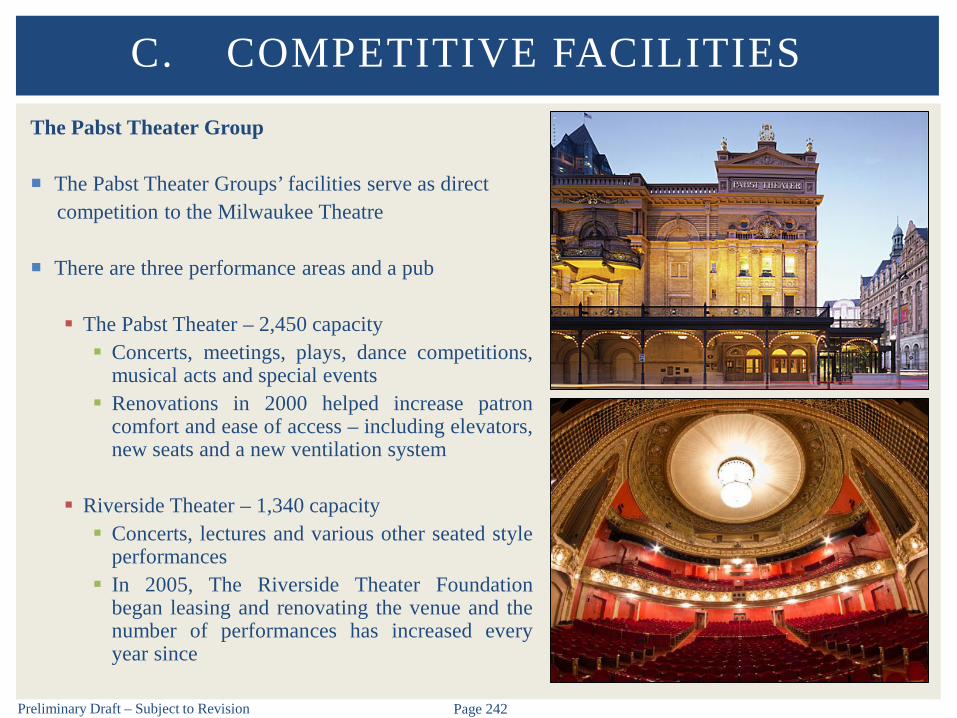
Preliminary Draft – Subject to Revision Page 242
The Pabst Theater Group
The Pabst Theater Groups’ facilities serve as directcompetition to the Milwaukee Theatre
There are three performance areas and a pub
The Pabst Theater – 2,450 capacity Concerts, meetings, plays, dance competitions,
musical acts and special events Renovations in 2000 helped increase patron
comfort and ease of access – including elevators,new seats and a new ventilation system
Riverside Theater – 1,340 capacity Concerts, lectures and various other seated style
performances In 2005, The Riverside Theater Foundation
began leasing and renovating the venue and thenumber of performances has increased everyyear since
C. COMPETITIVE FACILITIES
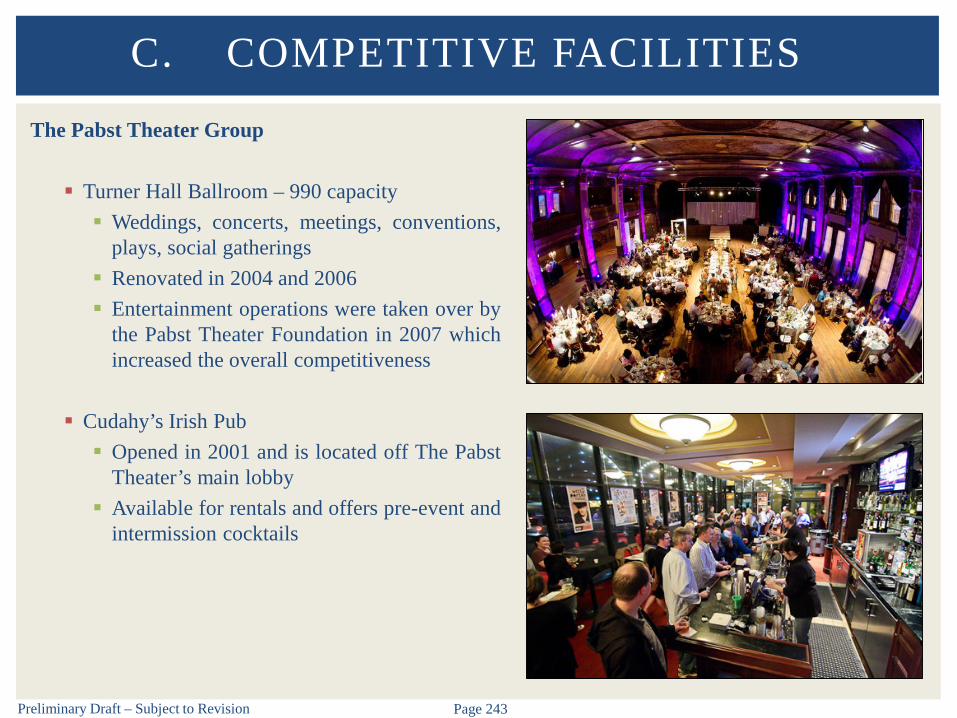
Preliminary Draft – Subject to Revision Page 243
The Pabst Theater Group
Turner Hall Ballroom – 990 capacity Weddings, concerts, meetings, conventions,
plays, social gatherings Renovated in 2004 and 2006 Entertainment operations were taken over by
the Pabst Theater Foundation in 2007 whichincreased the overall competitiveness
Cudahy’s Irish Pub Opened in 2001 and is located off The Pabst
Theater’s main lobby Available for rentals and offers pre-event and
intermission cocktails
C. COMPETITIVE FACILITIES

Preliminary Draft – Subject to Revision Page 244
The Rave/Eagles Club
Consists of 180,000 SF over seven levels and eightindependent clubs The clubs include bars, lounges, and performance
halls with capacities ranging from 400 to 4,000
Although offering multiple, diverse venues, the EaglesBallroom serves as the primary competitor to theMilwaukee Theatre
Eagles Ballroom
Offers a 25,000 SF dance floor with a standingcapacity of 4,000
Includes a balcony that circles the ballroom
The facility primarily hosts large, commercial concertacts Includes various genres such as Alternative, Hard
Rock, Dance/EDM, County, Pop and Hip Hop
C. COMPETITIVE FACILITIES
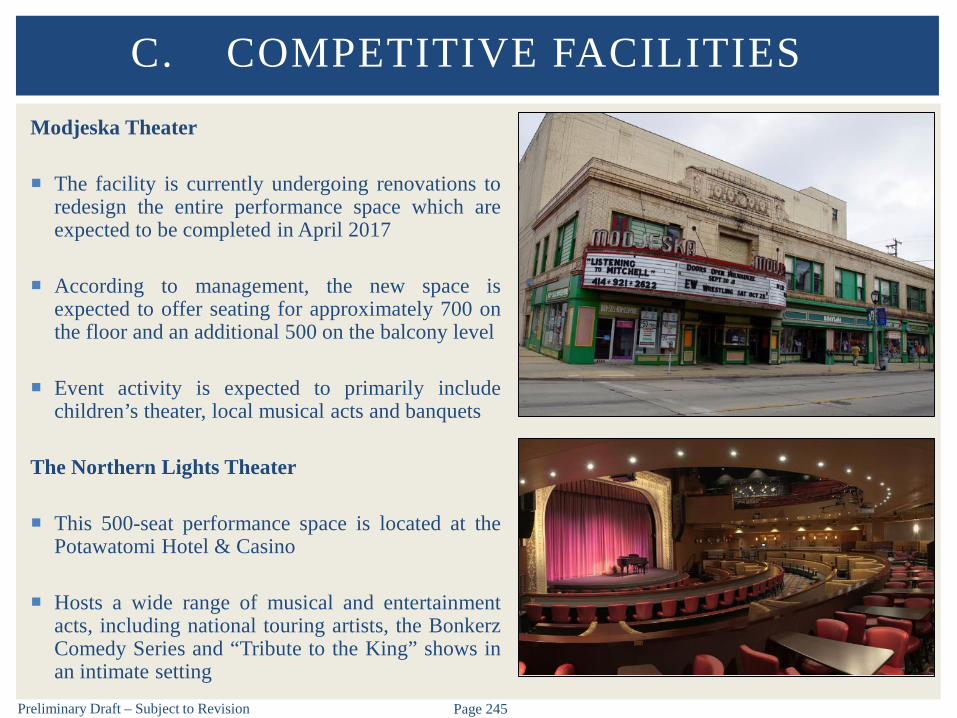
Preliminary Draft – Subject to Revision Page 245
Modjeska Theater
The facility is currently undergoing renovations toredesign the entire performance space which areexpected to be completed in April 2017
According to management, the new space isexpected to offer seating for approximately 700 onthe floor and an additional 500 on the balcony level
Event activity is expected to primarily includechildren’s theater, local musical acts and banquets
The Northern Lights Theater
This 500-seat performance space is located at thePotawatomi Hotel & Casino
Hosts a wide range of musical and entertainmentacts, including national touring artists, the BonkerzComedy Series and “Tribute to the King” shows inan intimate setting
C. COMPETITIVE FACILITIES

Preliminary Draft – Subject to Revision Page 246
Pitman Theatre
The 930-seat facility was built in 1953, and is located on the campus of Alverno College
Primarily serves the needs of the university and regularly hosts musical performances and dance
Hosted Alverno Presents, a performing arts series, for more than 50 years but these events haverecently moved and will continue through a partnership with the Pabst Theater Group
C. COMPETITIVE FACILITIES
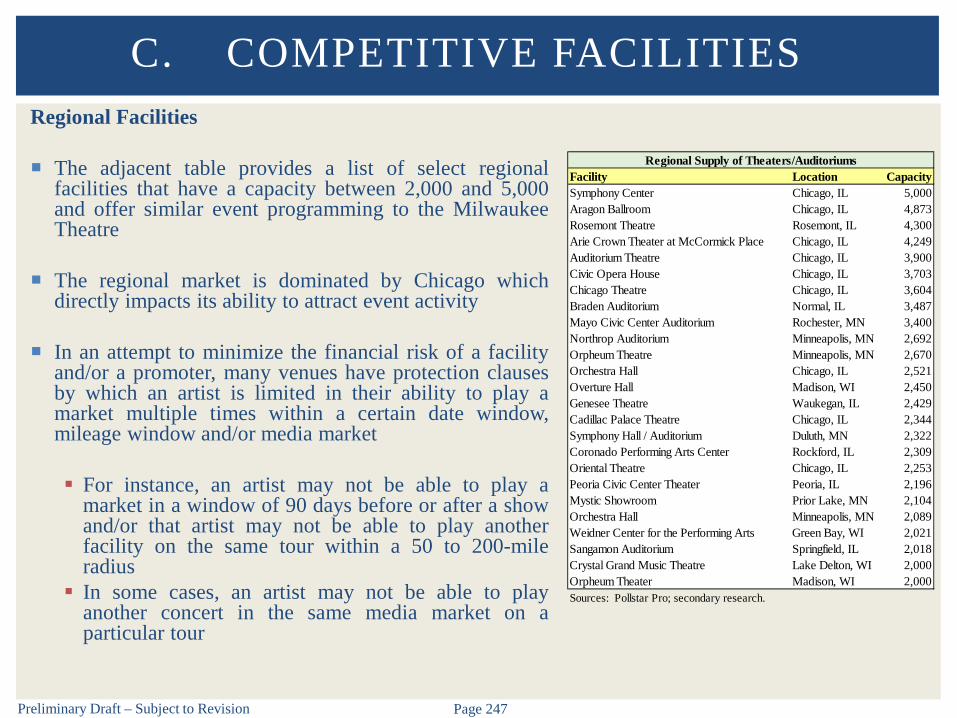
Preliminary Draft – Subject to Revision Page 247
Regional Facilities
The adjacent table provides a list of select regionalfacilities that have a capacity between 2,000 and 5,000and offer similar event programming to the MilwaukeeTheatre
The regional market is dominated by Chicago whichdirectly impacts its ability to attract event activity
In an attempt to minimize the financial risk of a facilityand/or a promoter, many venues have protection clausesby which an artist is limited in their ability to play amarket multiple times within a certain date window,mileage window and/or media market
For instance, an artist may not be able to play amarket in a window of 90 days before or after a showand/or that artist may not be able to play anotherfacility on the same tour within a 50 to 200-mileradius
In some cases, an artist may not be able to playanother concert in the same media market on aparticular tour
C. COMPETITIVE FACILITIES
Facility Location CapacitySymphony Center Chicago, IL 5,000Aragon Ballroom Chicago, IL 4,873Rosemont Theatre Rosemont, IL 4,300Arie Crown Theater at McCormick Place Chicago, IL 4,249Auditorium Theatre Chicago, IL 3,900Civic Opera House Chicago, IL 3,703Chicago Theatre Chicago, IL 3,604Braden Auditorium Normal, IL 3,487Mayo Civic Center Auditorium Rochester, MN 3,400Northrop Auditorium Minneapolis, MN 2,692Orpheum Theatre Minneapolis, MN 2,670Orchestra Hall Chicago, IL 2,521Overture Hall Madison, WI 2,450Genesee Theatre Waukegan, IL 2,429Cadillac Palace Theatre Chicago, IL 2,344Symphony Hall / Auditorium Duluth, MN 2,322Coronado Performing Arts Center Rockford, IL 2,309Oriental Theatre Chicago, IL 2,253Peoria Civic Center Theater Peoria, IL 2,196Mystic Showroom Prior Lake, MN 2,104Orchestra Hall Minneapolis, MN 2,089Weidner Center for the Performing Arts Green Bay, WI 2,021Sangamon Auditorium Springfield, IL 2,018Crystal Grand Music Theatre Lake Delton, WI 2,000Orpheum Theater Madison, WI 2,000Sources: Pollstar Pro; secondary research.
Regional Supply of Theaters/Auditoriums
D. DEMOGRAPHIC COMPARISON
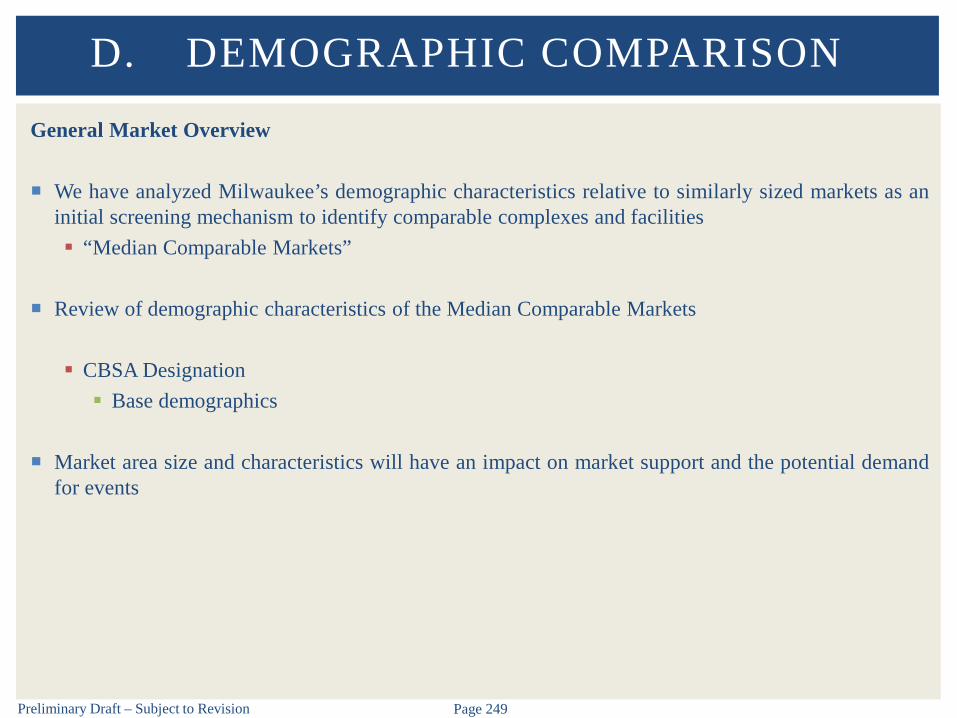
Preliminary Draft – Subject to Revision Page 249
General Market Overview
We have analyzed Milwaukee’s demographic characteristics relative to similarly sized markets as aninitial screening mechanism to identify comparable complexes and facilities “Median Comparable Markets”
Review of demographic characteristics of the Median Comparable Markets
CBSA Designation Base demographics
Market area size and characteristics will have an impact on market support and the potential demandfor events
D. DEMOGRAPHIC COMPARISON

Preliminary Draft – Subject to Revision Page 250
Median Comparable Market Demographic Overview
30 CBSAs comparable to Milwaukee in terms of population (15 CBSAs above and below Milwaukee) “Median Comparable Markets”
D. DEMOGRAPHIC COMPARISON
CBSA Market CBSA MarketPortland-Vancouver-Hillsboro, OR-WA Portland, OR Jacksonville, FL Jacksonville, FL Orlando-Kissimmee-Sanford, FL Orlando, FL Oklahoma City, OK Oklahoma City, OK Pittsburgh, PA Pittsburgh, PA Memphis, TN-MS-AR Memphis, TNSacramento--Roseville--Arden-Arcade, CA Sacramento, CA Louisville/Jefferson County, KY-IN Louisville, KYCincinnati, OH-KY-IN Cincinnati, OH Raleigh, NC Raleigh, NC Las Vegas-Henderson-Paradise, NV Las Vegas, NV Richmond, VA Richmond, VA Kansas City, MO-KS Kansas City, MO New Orleans-Metairie, LA New Orleans, LACleveland-Elyria, OH Cleveland, OH Hartford-West Hartford-East Hartford, CT Hartford, CTColumbus, OH Columbus, OH Salt Lake City, UT Salt Lake City, UT Austin-Round Rock, TX Austin, TX Birmingham-Hoover, AL Birmingham, ALIndianapolis-Carmel-Anderson, IN Indianapolis, IN Buffalo-Cheektowaga-Niagara Falls, NY Buffalo, NYSan Jose-Sunnyvale-Santa Clara, CA San Jose, CA Rochester, NY Rochester, NY Nashville-Davidson--Murfreesboro--Franklin, TN Nashville, TN Grand Rapids-Wyoming, MI Grand Rapids, MI Virginia Beach-Norfolk-Newport News, VA-NC Virginia Beach, VA Tucson, AZ Tucson, AZ Providence-Warwick, RI-MA Providence, RI Urban Honolulu, HI Honolulu, HI
Markets Above Milwaukee Markets Below Milwaukee
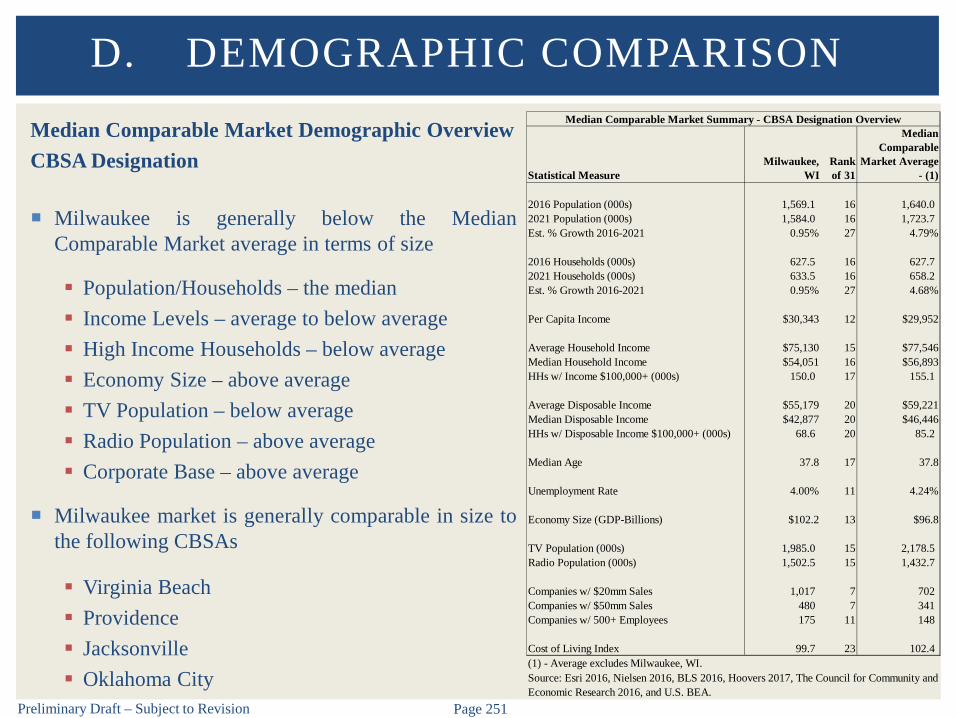
Preliminary Draft – Subject to Revision Page 251
Median Comparable Market Demographic OverviewCBSA Designation
Milwaukee is generally below the MedianComparable Market average in terms of size
Population/Households – the median Income Levels – average to below average High Income Households – below average Economy Size – above average TV Population – below average Radio Population – above average Corporate Base – above average
Milwaukee market is generally comparable in size tothe following CBSAs
Virginia Beach Providence Jacksonville Oklahoma City
D. DEMOGRAPHIC COMPARISON
Statistical MeasureMilwaukee,
WIRank of 31
Median Comparable
Market Average - (1)
2016 Population (000s) 1,569.1 16 1,640.0 2021 Population (000s) 1,584.0 16 1,723.7 Est. % Growth 2016-2021 0.95% 27 4.79%
2016 Households (000s) 627.5 16 627.7 2021 Households (000s) 633.5 16 658.2 Est. % Growth 2016-2021 0.95% 27 4.68%
Per Capita Income $30,343 12 $29,952
Average Household Income $75,130 15 $77,546Median Household Income $54,051 16 $56,893HHs w/ Income $100,000+ (000s) 150.0 17 155.1
Average Disposable Income $55,179 20 $59,221Median Disposable Income $42,877 20 $46,446HHs w/ Disposable Income $100,000+ (000s) 68.6 20 85.2
Median Age 37.8 17 37.8
Unemployment Rate 4.00% 11 4.24%
Economy Size (GDP-Billions) $102.2 13 $96.8
TV Population (000s) 1,985.0 15 2,178.5 Radio Population (000s) 1,502.5 15 1,432.7
Companies w/ $20mm Sales 1,017 7 702Companies w/ $50mm Sales 480 7 341Companies w/ 500+ Employees 175 11 148
Cost of Living Index 99.7 23 102.4
Median Comparable Market Summary - CBSA Designation Overview
(1) - Average excludes Milwaukee, WI.Source: Esri 2016, Nielsen 2016, BLS 2016, Hoovers 2017, The Council for Community and Economic Research 2016, and U.S. BEA.

Preliminary Draft – Subject to Revision Page 252
Median Comparable Market Demographic OverviewCBSA Designation
Milwaukee is slightly below the Median Comparable Market average in terms of key spendingcategories
D. DEMOGRAPHIC COMPARISON
Statistical MeasureMilwaukee,
WIRank of 31
Median Comparable
Market Average - (1)
Recreation Spending Total (Millions) $359.0 17 $368.0Recreation Spending Average $572.03 13 $588.17
Sports Admission Spending Total (Millions) $34.3 16 $34.5Sports Admission Spending Average $54.67 12 $54.99
Concert Admission Spending Total (Millions) $33.3 17 $33.5Concert Admission Spending Average $53.09 12 $53.51
Median Comparable Market Summary - CBSA Designation Overview
(1) - Average excludes Milwaukee, WI.Source: Esri 2016.

E. COMPARABLE COMPLEXES

Preliminary Draft – Subject to Revision Page 254
Overview
Our initial screening identified 16 “comparable” complexes (multiple facilities) for evaluation
We analyzed Milwaukee’s demographic characteristics relative to 16 comparable complex markets
Market area size and characteristics will have an impact on market support and the potential demandfor events at the comparable complexes
Review of demographic characteristics of the comparable complexes
CBSA Designation Base demographics
Geographic Ring Designation 30 mile ring base demographics
Drive Time Designation 30 minute drive time base demographics
E. COMPARABLE COMPLEXES

Preliminary Draft – Subject to Revision Page 255
Comparable Complexes
The 16 comparable complexes are illustrated below Some complexes contain theaters as well – see benchmarking analysis for more details
E. COMPARABLE COMPLEXES
CBSA Market Convention Center Arena OperatorAtlanta-Sandy Springs-Roswell, GA Duluth, GA Infinite Energy Forum Infinite Energy Arena AEGBakersfield, CA Bakersfield, CA Rabobank Theater and Convention Center Rabobank Arena AEGBaton Rouge, LA Baton Rouge, LA Baton Rouge River Center Baton Rouge River Center Arena SMGBirmingham-Hoover, AL Birmingham, AL Birmingham-Jefferson Convention Complex Legacy Arena Spectra/BJCC AuthorityCharlotte-Concord-Gastonia, NC-SC Charlotte, NC Charlotte Convention Center Bojangles' Coliseum Charlotte RVADallas-Fort Worth-Arlington, TX Fort Worth, TX Fort Worth Convention Center Fort Worth Convention Center Arena City of Fort WorthDes Moines-West Des Moines, IA Des Moines, IA Hy-Vee Hall Wells Fargo Arena SpectraFort Wayne, IN Fort Wayne, IN Allen County War Memorial Exposition Center Allen County War Memorial Coliseum Allen CountyGrand Rapids-Wyoming, MI Grand Rapids, MI DeVos Place Convention Center Van Andel Arena SMGGreensboro-High Point, NC Greensboro, NC Greensboro Coliseum Complex Special Events Center Greensboro Coliseum City of GreensboroGulfport-Biloxi-Pascagoula, MS Biloxi, MS Mississippi Coast Convention Center Mississippi Coast Coliseum Mississippi Coast CCKansas City, MO-KS Kansas City, MO Bartle Exhibit Hall Municipal Auditorium Kansas City CEFMadison, WI Madison, WI Alliant Energy Center Exhibition Hall Veterans Memorial Coliseum Dane CountyOmaha-Council Bluffs, NE-IA Omaha, NE CenturyLink Center Omaha Convention Center CenturyLink Center Omaha Arena MECASpokane-Spokane Valley, WA Spokane, WA Spokane Convention Center Spokane Veterans Memorial Arena Spokane PFDTucson, AZ Tucson, AZ Tucson Convention Center Tucson Arena SMG
WCD Comparable Complexes
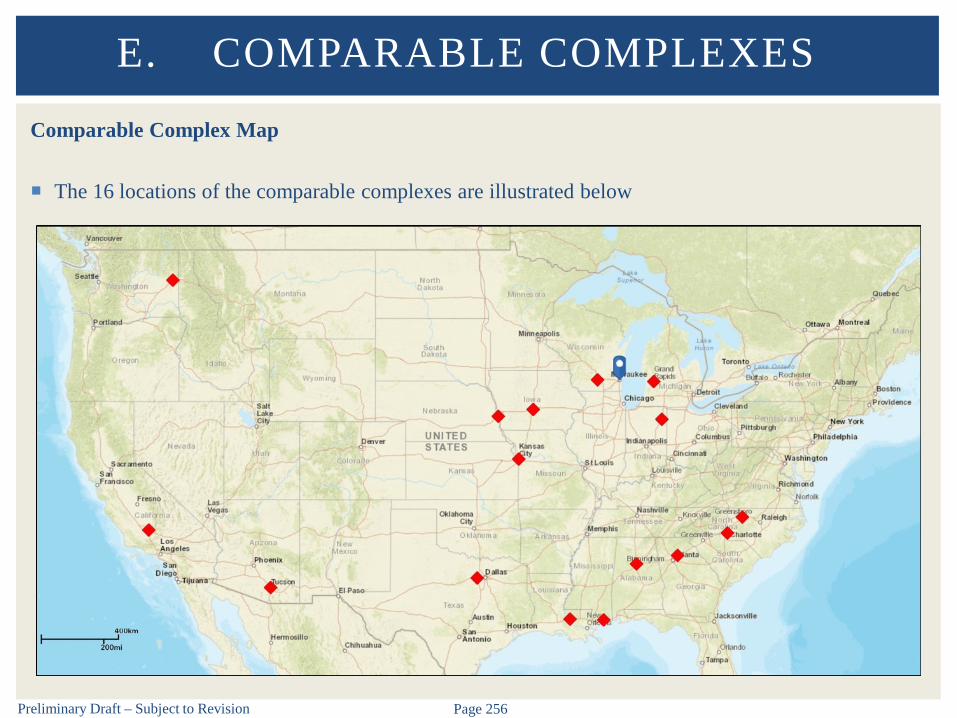
Preliminary Draft – Subject to Revision Page 256
Comparable Complex Map
The 16 locations of the comparable complexes are illustrated below
E. COMPARABLE COMPLEXES

Preliminary Draft – Subject to Revision Page 257
Comparable Complex Demographic OverviewCBSA Designation
Milwaukee is generally near to below theComparable Complex average in terms of size
Population/Households – average to belowaverage Last (17th) in terms of growth
Household Income Levels – above average Disposable Income Levels – below average High Income Households – below average Economy Size – above average TV Population – above average Radio Population – above average Corporate Base – above average
E. COMPARABLE COMPLEXES
Statistical MeasureMilwaukee,
WIRank of 17
Comparable Facility Average
- (1)
2016 Population (000s) 1,569.1 5 1,660.0 2021 Population (000s) 1,584.0 5 1,769.7 Est. % Growth 2016-2021 0.95% 17 5.21%
2016 Households (000s) 627.5 5 617.1 2021 Households (000s) 633.5 5 655.7 Est. % Growth 2016-2021 0.95% 17 5.10%
Per Capita Income $30,343 5 $28,046
Average Household Income $75,130 8 $72,721Median Household Income $54,051 7 $53,406HHs w/ Income $100,000+ (000s) 150.0 5 152.8
Average Disposable Income $55,179 9 $56,193Median Disposable Income $42,877 8 $44,383HHs w/ Disposable Income $100,000+ (000s) 68.6 5 84.5
Median Age 37.8 13 36.5
Unemployment Rate 4.00% 7 4.60%
Economy Size (GDP-Billions) $102.2 5 $99.4
TV Population (000s) 1,985.0 5 1,839.7 Radio Population (000s) 1,502.5 5 1,447.5
Companies w/ $20mm Sales 1,017 5 783Companies w/ $50mm Sales 480 5 408Companies w/ 500+ Employees 175 5 147
Cost of Living Index 99.7 12 94.7
Comparable Facility Summary - CBSA Designation Overview
(1) - Average excludes Milwaukee, WI.Source: Esri 2016, Nielsen 2016, BLS 2016, Hoovers 2017, The Council for Community and Economic Research 2016, and U.S. BEA.

Preliminary Draft – Subject to Revision Page 258
Comparable Complex Demographic OverviewCBSA Designation
Milwaukee is above the Comparable Complex average in terms of key spending categories
E. COMPARABLE COMPLEXES
Statistical MeasureMilwaukee,
WIRank of 17
Comparable Facility Average
- (1)
Recreation Spending Total (Millions) $359.0 5 $358.3Recreation Spending Average $572.03 6 $534.47
Sports Admission Spending Total (Millions) $34.3 5 $33.2Sports Admission Spending Average $54.67 6 $50.33
Concert Admission Spending Total (Millions) $33.3 5 $31.9Concert Admission Spending Average $53.09 5 $48.16
Comparable Facility Summary - CBSA Designation Overview
(1) - Average excludes Milwaukee, WI.Source: Esri 2016.

Preliminary Draft – Subject to Revision Page 259
Comparable Complex Demographic Overview
Market demographics also evaluated based on geographic ring designation (30 mile)
E. COMPARABLE COMPLEXES
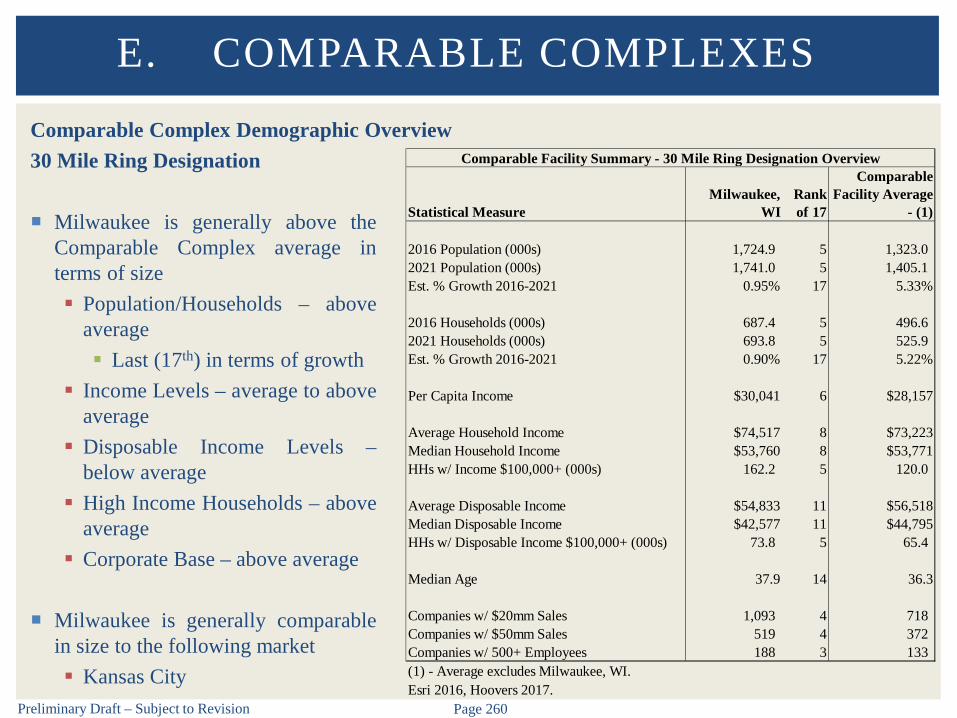
Preliminary Draft – Subject to Revision Page 260
30 Mile Ring Designation
Milwaukee is generally above theComparable Complex average interms of size Population/Households – above
average Last (17th) in terms of growth
Income Levels – average to aboveaverage
Disposable Income Levels –below average
High Income Households – aboveaverage
Corporate Base – above average
Milwaukee is generally comparablein size to the following market Kansas City
E. COMPARABLE COMPLEXES
Statistical MeasureMilwaukee,
WIRank of 17
Comparable Facility Average
- (1)
2016 Population (000s) 1,724.9 5 1,323.0 2021 Population (000s) 1,741.0 5 1,405.1 Est. % Growth 2016-2021 0.95% 17 5.33%
2016 Households (000s) 687.4 5 496.6 2021 Households (000s) 693.8 5 525.9 Est. % Growth 2016-2021 0.90% 17 5.22%
Per Capita Income $30,041 6 $28,157
Average Household Income $74,517 8 $73,223Median Household Income $53,760 8 $53,771HHs w/ Income $100,000+ (000s) 162.2 5 120.0
Average Disposable Income $54,833 11 $56,518Median Disposable Income $42,577 11 $44,795HHs w/ Disposable Income $100,000+ (000s) 73.8 5 65.4
Median Age 37.9 14 36.3
Companies w/ $20mm Sales 1,093 4 718Companies w/ $50mm Sales 519 4 372Companies w/ 500+ Employees 188 3 133
Comparable Facility Summary - 30 Mile Ring Designation Overview
(1) - Average excludes Milwaukee, WI.Esri 2016, Hoovers 2017.
Comparable Complex Demographic Overview

Preliminary Draft – Subject to Revision Page 261
Comparable Complex Demographic Overview
Market demographics also evaluated based on drive time designation (30 minute)
E. COMPARABLE COMPLEXES

Preliminary Draft – Subject to Revision Page 262
30 Minute Drive Time Designation
Milwaukee is generally above theComparable Complex average interms of size Population/Households – above
average Last (17th) in terms of growth
Income Levels – average tobelow average
High Income Households –above average
Milwaukee is generally comparablein size to the following markets Charlotte Kansas City
E. COMPARABLE COMPLEXES
Statistical MeasureMilwaukee,
WIRank of 17
Comparable Facility Average
- (1)
2016 Population (000s) 1,223.0 4 861.3 2021 Population (000s) 1,230.3 5 913.2 Est. % Growth 2016-2021 0.60% 17 5.48%
2016 Households (000s) 494.3 4 326.4 2021 Households (000s) 496.8 4 344.9 Est. % Growth 2016-2021 0.50% 17 5.34%
Per Capita Income $28,663 8 $28,521
Average Household Income $70,197 11 $73,668Median Household Income $50,049 13 $53,738HHs w/ Income $100,000+ (000s) 103.8 5 77.8
Average Disposable Income $51,813 13 $56,723Median Disposable Income $38,977 15 $44,526HHs w/ Disposable Income $100,000+ (000s) 47.3 5 42.1
Median Age 36.6 10 35.6
Comparable Facility Summary - 30 Minute Drive Time Designation Overview
(1) - Average excludes Milwaukee, WI.Source: Esri 2016.
Comparable Complex Demographic Overview
F. COMPARABLE COMPLEX CASE
STUDIES
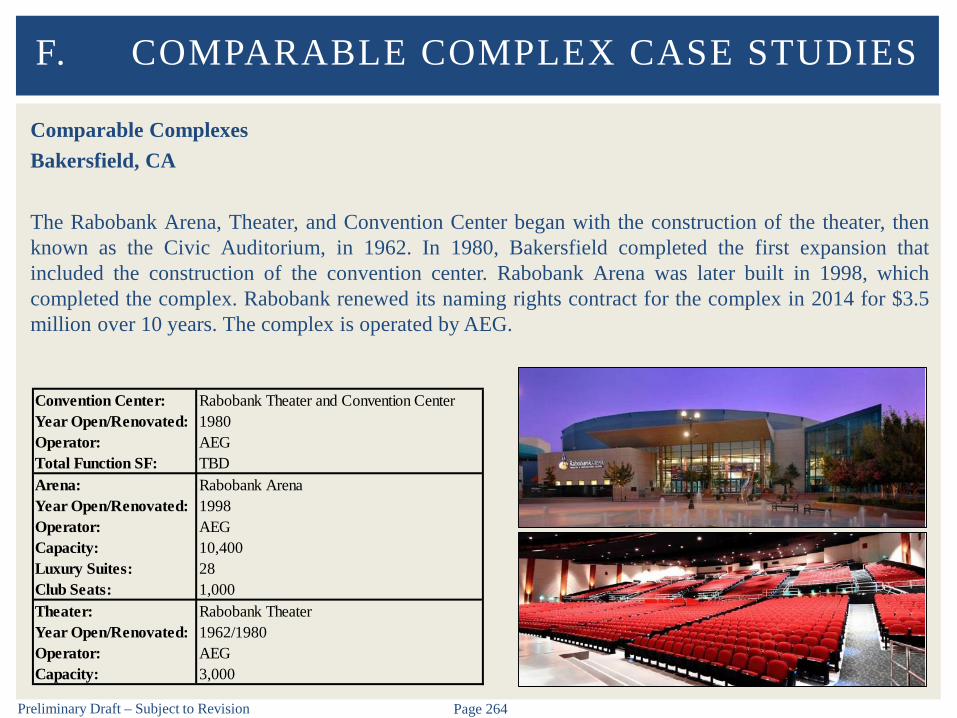
Preliminary Draft – Subject to Revision Page 264
Comparable ComplexesBakersfield, CA
The Rabobank Arena, Theater, and Convention Center began with the construction of the theater, thenknown as the Civic Auditorium, in 1962. In 1980, Bakersfield completed the first expansion thatincluded the construction of the convention center. Rabobank Arena was later built in 1998, whichcompleted the complex. Rabobank renewed its naming rights contract for the complex in 2014 for $3.5million over 10 years. The complex is operated by AEG.
F. COMPARABLE COMPLEX CASE STUDIES
Convention Center: Rabobank Theater and Convention CenterYear Open/Renovated: 1980Operator: AEGTotal Function SF: TBDArena: Rabobank ArenaYear Open/Renovated: 1998Operator: AEGCapacity: 10,400Luxury Suites: 28Club Seats: 1,000Theater: Rabobank TheaterYear Open/Renovated: 1962/1980Operator: AEGCapacity: 3,000

Preliminary Draft – Subject to Revision Page 265
Comparable ComplexesBaton Rouge, LA
Opening in 1977, the Raising Cane’s River Center complex is operated by SMG and includes an arena,ballroom, exhibition center, theatre, and library. A new exhibition hall was built in 2005, adding 70,000square feet of additional space. The complex recently agreed to a 10-year $3.87 million naming rightsdeal with Raising Cane’s. The deal is set to expire in 2026.
F. COMPARABLE COMPLEX CASE STUDIES
Convention Center: Raising Cane's River CenterYear Open/Renovated: 1977/2005Operator: SMGTotal Function SF: 146,900Arena: Raising Cane's River Center ArenaYear Open/Renovated: 1977Operator: SMGCapacity: 12,000Luxury Suites: 0Club Seats: 0Theater: Raising Cane's River Center Theatre for the Perf. ArtsYear Open/Renovated: 1979Operator: SMGCapacity: 1,900

Preliminary Draft – Subject to Revision Page 266
Comparable ComplexesCharlotte, NC
Charlotte Convention Center opened in 1995 and includes an exhibit hall, a ballroom, and meetingrooms. The NASCAR Hall of Fame was opened in 2010 and is connected to the Charlotte ConventionCenter. Bojangles’ Coliseum was opened in 1955 and was renovated in 2016. The oldest component ofthe complex, Oven’s Auditorium, was built in 1955. The four buildings are operated by the CharlotteRegional Visitors Authority despite the arena and auditorium being located several miles away from theconvention center.
F. COMPARABLE COMPLEX CASE STUDIES
Convention Center: Charlotte Convention CenterYear Open/Renovated: 1995Operator: Charlotte RVATotal Function SF: 372,200Arena: Bojangles' ColiseumYear Open/Renovated: 1955/2016Operator: Charlotte RVACapacity: 8,600Luxury Suites: 0Club Seats: 0Theater: Oven's AuditoriumYear Open/Renovated: 1955Operator: Charlotte RVACapacity: 2,460
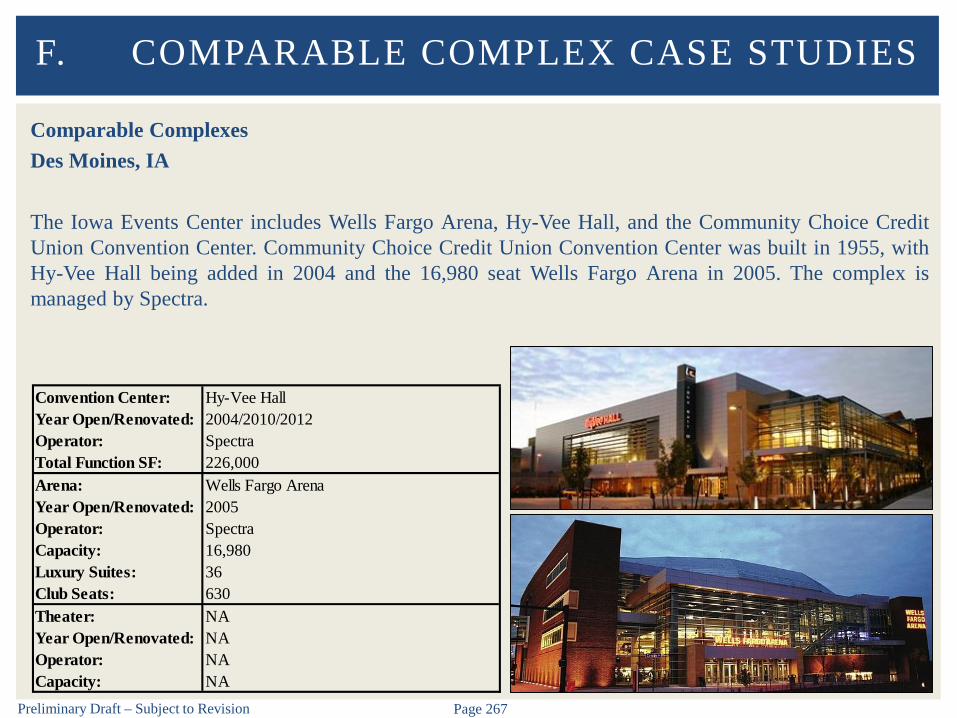
Preliminary Draft – Subject to Revision Page 267
Comparable ComplexesDes Moines, IA
The Iowa Events Center includes Wells Fargo Arena, Hy-Vee Hall, and the Community Choice CreditUnion Convention Center. Community Choice Credit Union Convention Center was built in 1955, withHy-Vee Hall being added in 2004 and the 16,980 seat Wells Fargo Arena in 2005. The complex ismanaged by Spectra.
F. COMPARABLE COMPLEX CASE STUDIES
Convention Center: Hy-Vee HallYear Open/Renovated: 2004/2010/2012Operator: SpectraTotal Function SF: 226,000Arena: Wells Fargo ArenaYear Open/Renovated: 2005Operator: SpectraCapacity: 16,980Luxury Suites: 36Club Seats: 630Theater: NAYear Open/Renovated: NAOperator: NACapacity: NA
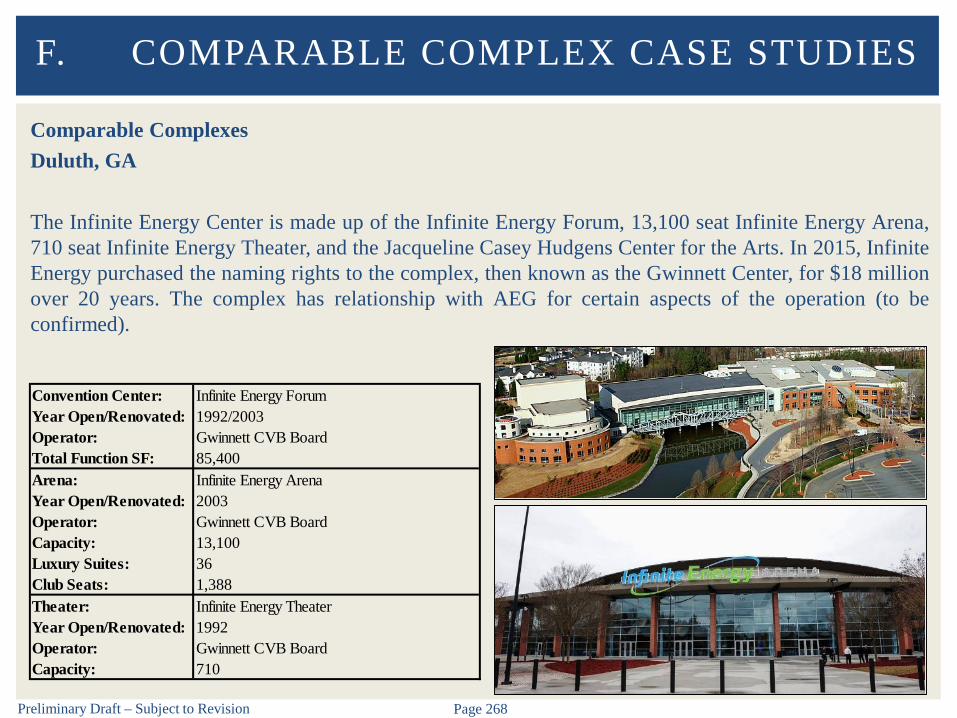
Preliminary Draft – Subject to Revision Page 268
Comparable ComplexesDuluth, GA
The Infinite Energy Center is made up of the Infinite Energy Forum, 13,100 seat Infinite Energy Arena,710 seat Infinite Energy Theater, and the Jacqueline Casey Hudgens Center for the Arts. In 2015, InfiniteEnergy purchased the naming rights to the complex, then known as the Gwinnett Center, for $18 millionover 20 years. The complex has relationship with AEG for certain aspects of the operation (to beconfirmed).
F. COMPARABLE COMPLEX CASE STUDIES
Convention Center: Infinite Energy ForumYear Open/Renovated: 1992/2003Operator: Gwinnett CVB BoardTotal Function SF: 85,400Arena: Infinite Energy ArenaYear Open/Renovated: 2003Operator: Gwinnett CVB BoardCapacity: 13,100Luxury Suites: 36Club Seats: 1,388Theater: Infinite Energy TheaterYear Open/Renovated: 1992Operator: Gwinnett CVB BoardCapacity: 710

Preliminary Draft – Subject to Revision Page 269
Comparable ComplexesFort Worth, TX
Fort Worth Convention Center opened in 1968 and has undergone multiple expansions. The conventioncenter includes an arena that has hosted several different sports tenants throughout its history. The Cityof Fort Worth operates the convention center and the Will Rogers Memorial Center, which includesexhibit space and the Will Rogers Auditorium. The Will Rogers Memorial Center is locatedapproximately two miles from the convention center.
F. COMPARABLE COMPLEX CASE STUDIES
Convention Center: Fort Worth Convention CenterYear Open/Renovated: 1968/1983/2003Operator: City of Fort WorthTotal Function SF: 340,200Arena: Fort Worth Convention Center ArenaYear Open/Renovated: 1968Operator: City of Fort WorthCapacity: 13,500Luxury Suites: 0Club Seats: 0Theater: Will Rogers AuditoriumYear Open/Renovated: 1936/TBDOperator: City of Fort WorthCapacity: 2,860
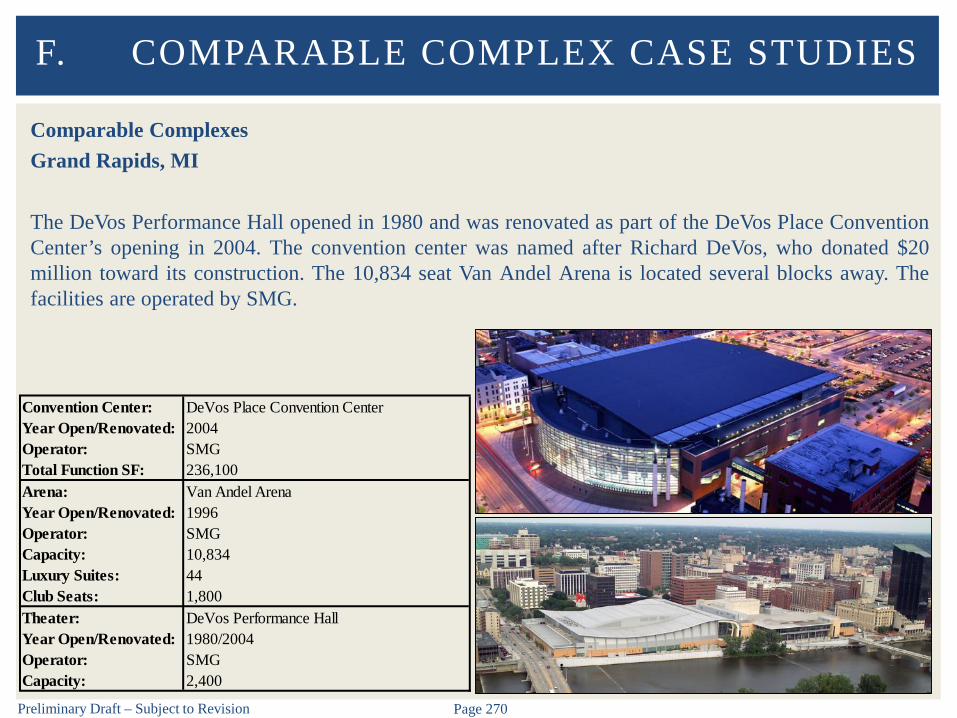
Preliminary Draft – Subject to Revision Page 270
Comparable ComplexesGrand Rapids, MI
The DeVos Performance Hall opened in 1980 and was renovated as part of the DeVos Place ConventionCenter’s opening in 2004. The convention center was named after Richard DeVos, who donated $20million toward its construction. The 10,834 seat Van Andel Arena is located several blocks away. Thefacilities are operated by SMG.
F. COMPARABLE COMPLEX CASE STUDIES
Convention Center: DeVos Place Convention CenterYear Open/Renovated: 2004Operator: SMGTotal Function SF: 236,100Arena: Van Andel ArenaYear Open/Renovated: 1996Operator: SMGCapacity: 10,834Luxury Suites: 44Club Seats: 1,800Theater: DeVos Performance HallYear Open/Renovated: 1980/2004Operator: SMGCapacity: 2,400
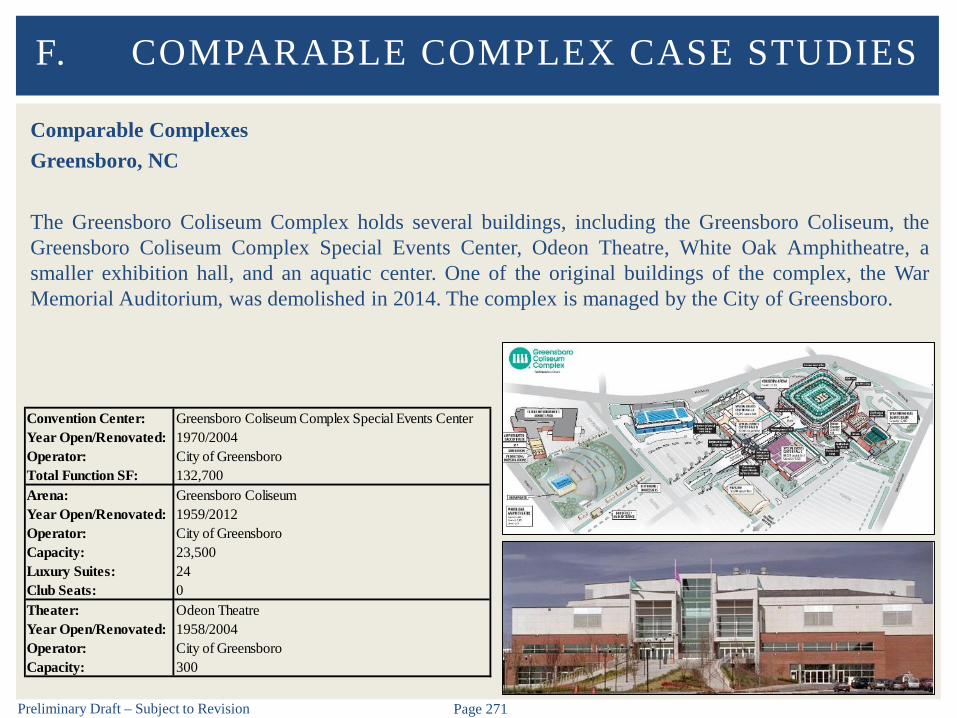
Preliminary Draft – Subject to Revision Page 271
Comparable ComplexesGreensboro, NC
The Greensboro Coliseum Complex holds several buildings, including the Greensboro Coliseum, theGreensboro Coliseum Complex Special Events Center, Odeon Theatre, White Oak Amphitheatre, asmaller exhibition hall, and an aquatic center. One of the original buildings of the complex, the WarMemorial Auditorium, was demolished in 2014. The complex is managed by the City of Greensboro.
F. COMPARABLE COMPLEX CASE STUDIES
Convention Center: Greensboro Coliseum Complex Special Events CenterYear Open/Renovated: 1970/2004Operator: City of GreensboroTotal Function SF: 132,700Arena: Greensboro ColiseumYear Open/Renovated: 1959/2012Operator: City of GreensboroCapacity: 23,500Luxury Suites: 24Club Seats: 0Theater: Odeon TheatreYear Open/Renovated: 1958/2004Operator: City of GreensboroCapacity: 300
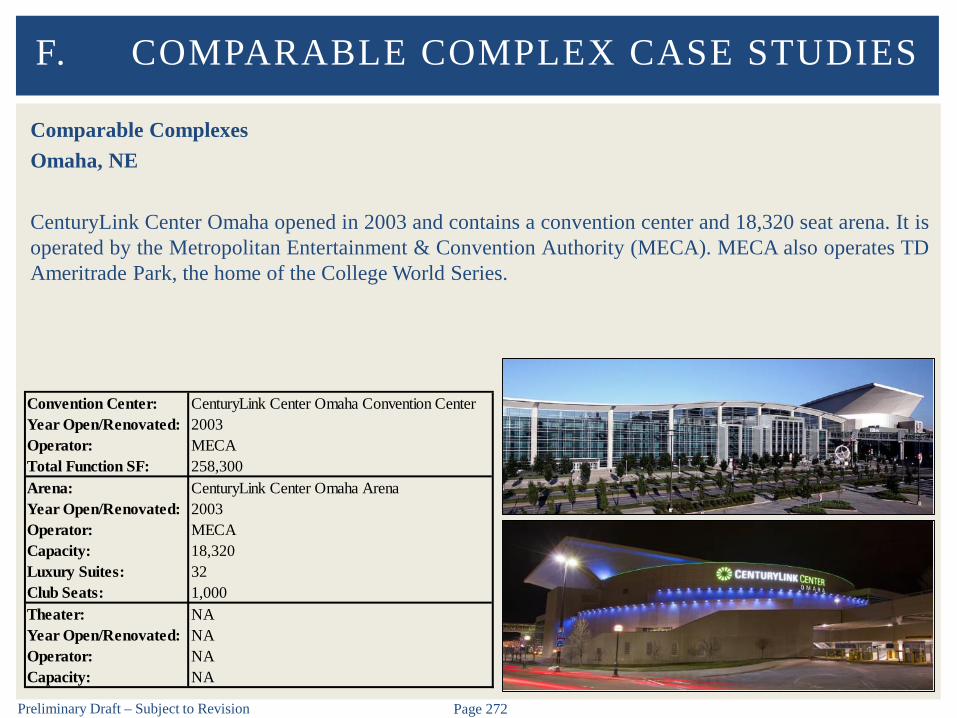
Preliminary Draft – Subject to Revision Page 272
Comparable ComplexesOmaha, NE
CenturyLink Center Omaha opened in 2003 and contains a convention center and 18,320 seat arena. It isoperated by the Metropolitan Entertainment & Convention Authority (MECA). MECA also operates TDAmeritrade Park, the home of the College World Series.
F. COMPARABLE COMPLEX CASE STUDIES
Convention Center: CenturyLink Center Omaha Convention CenterYear Open/Renovated: 2003Operator: MECATotal Function SF: 258,300Arena: CenturyLink Center Omaha ArenaYear Open/Renovated: 2003Operator: MECACapacity: 18,320Luxury Suites: 32Club Seats: 1,000Theater: NAYear Open/Renovated: NAOperator: NACapacity: NA
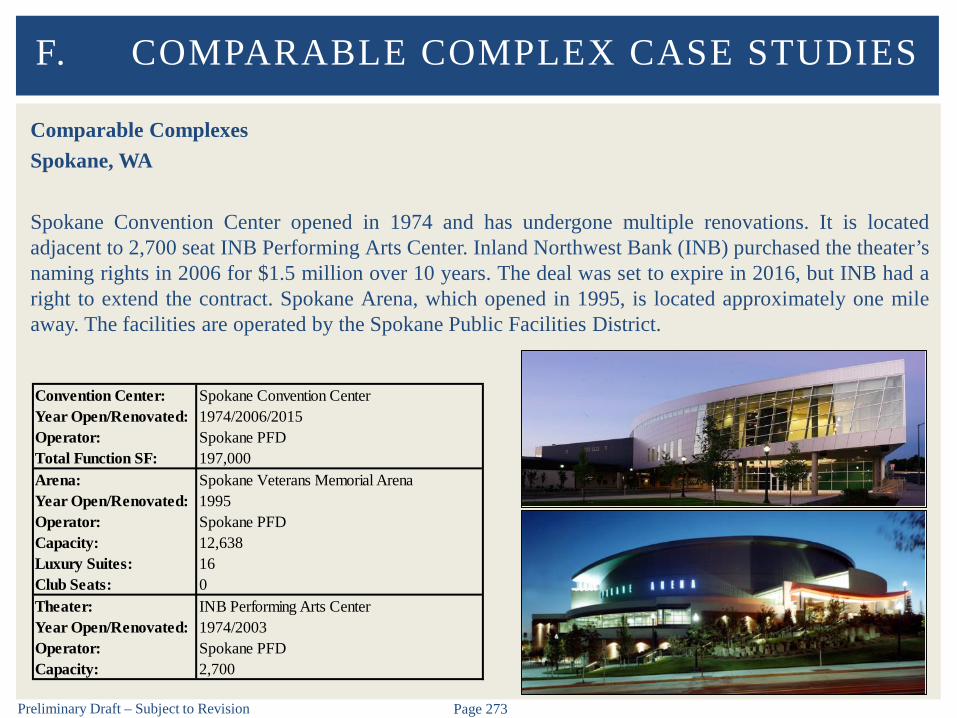
Preliminary Draft – Subject to Revision Page 273
Comparable ComplexesSpokane, WA
Spokane Convention Center opened in 1974 and has undergone multiple renovations. It is locatedadjacent to 2,700 seat INB Performing Arts Center. Inland Northwest Bank (INB) purchased the theater’snaming rights in 2006 for $1.5 million over 10 years. The deal was set to expire in 2016, but INB had aright to extend the contract. Spokane Arena, which opened in 1995, is located approximately one mileaway. The facilities are operated by the Spokane Public Facilities District.
F. COMPARABLE COMPLEX CASE STUDIES
Convention Center: Spokane Convention CenterYear Open/Renovated: 1974/2006/2015Operator: Spokane PFDTotal Function SF: 197,000Arena: Spokane Veterans Memorial ArenaYear Open/Renovated: 1995Operator: Spokane PFDCapacity: 12,638Luxury Suites: 16Club Seats: 0Theater: INB Performing Arts CenterYear Open/Renovated: 1974/2003Operator: Spokane PFDCapacity: 2,700

Preliminary Draft – Subject to Revision Page 274
Comparable ComplexesTucson, AZ
Tucson Convention Center opened in 1971 and is located adjacent to the 2,290 seat Tucson Music Hall.The convention center contains the Tucson Arena, which was renovated in 2015. The facilities areoperated by SMG.
F. COMPARABLE COMPLEX CASE STUDIES
Convention Center: Tucson Convention CenterYear Open/Renovated: 1971Operator: SMGTotal Function SF: 144,700Arena: Tucson ArenaYear Open/Renovated: 1971/2015Operator: SMGCapacity: 7,440Luxury Suites: 0Club Seats: 0Theater: Tucson Music HallYear Open/Renovated: 1971Operator: SMGCapacity: 2,290

G. LOCAL SPORTS TEAMS
Preliminary Draft – Subject to Revision Page 276
Local Professional and Collegiate Sports
Milwaukee currently has two major professional sports teams Milwaukee Bucks (NBA) Milwaukee Brewers (MLB)
Milwaukee is currently home to two minor league professional sports teams Milwaukee Wave (MASL) Milwaukee Admirals (AHL)
The following major collegiate sports teams are in the market Marquette University Golden Eagles (Big East) University of Wisconsin – Milwaukee Panthers (Horizon League)
We considered but did not include University of Wisconsin-Madison Badgers (Big 10) and Green BayPackers (NFL)
G. LOCAL SPORTS TEAMS
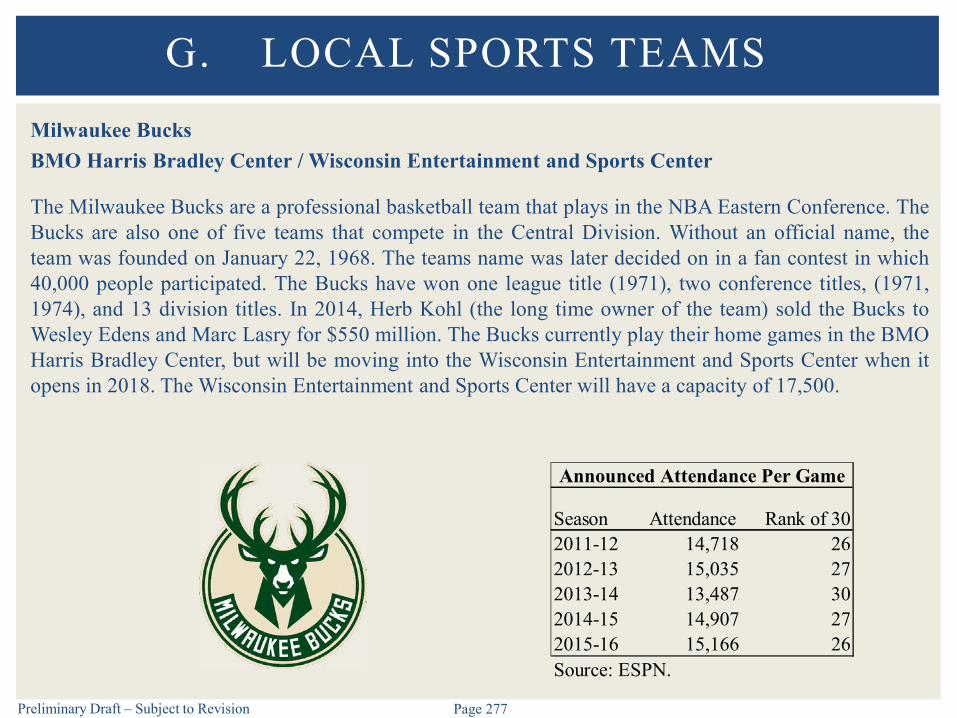
Preliminary Draft – Subject to Revision Page 277
Milwaukee Bucks
BMO Harris Bradley Center / Wisconsin Entertainment and Sports Center
The Milwaukee Bucks are a professional basketball team that plays in the NBA Eastern Conference. TheBucks are also one of five teams that compete in the Central Division. Without an official name, theteam was founded on January 22, 1968. The teams name was later decided on in a fan contest in which40,000 people participated. The Bucks have won one league title (1971), two conference titles, (1971,1974), and 13 division titles. In 2014, Herb Kohl (the long time owner of the team) sold the Bucks toWesley Edens and Marc Lasry for $550 million. The Bucks currently play their home games in the BMOHarris Bradley Center, but will be moving into the Wisconsin Entertainment and Sports Center when itopens in 2018. The Wisconsin Entertainment and Sports Center will have a capacity of 17,500.
G. LOCAL SPORTS TEAMS
Season Attendance Rank of 302011-12 14,718 262012-13 15,035 272013-14 13,487 302014-15 14,907 272015-16 15,166 26Source: ESPN.
Announced Attendance Per Game
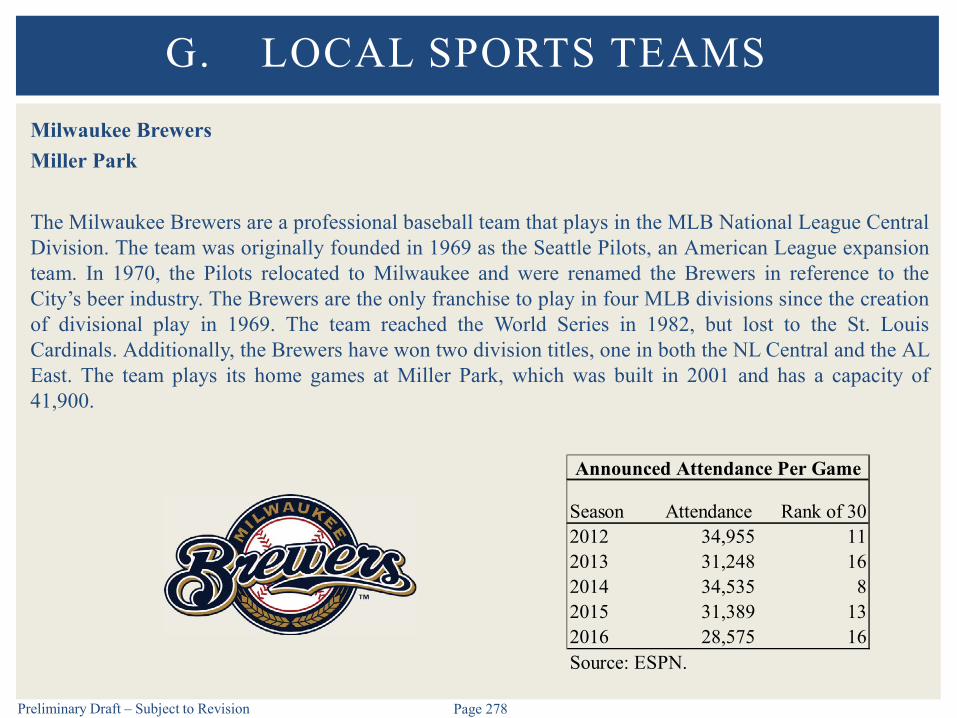
Preliminary Draft – Subject to Revision Page 278
Milwaukee Brewers
Miller Park
The Milwaukee Brewers are a professional baseball team that plays in the MLB National League CentralDivision. The team was originally founded in 1969 as the Seattle Pilots, an American League expansionteam. In 1970, the Pilots relocated to Milwaukee and were renamed the Brewers in reference to theCity’s beer industry. The Brewers are the only franchise to play in four MLB divisions since the creationof divisional play in 1969. The team reached the World Series in 1982, but lost to the St. LouisCardinals. Additionally, the Brewers have won two division titles, one in both the NL Central and the ALEast. The team plays its home games at Miller Park, which was built in 2001 and has a capacity of41,900.
G. LOCAL SPORTS TEAMS
Season Attendance Rank of 302012 34,955 112013 31,248 162014 34,535 82015 31,389 132016 28,575 16Source: ESPN.
Announced Attendance Per Game
Preliminary Draft – Subject to Revision Page 279
Milwaukee Wave
UW-Milwaukee Panther Arena
The Milwaukee Wave is a professional soccer team that plays in the Major Arena Soccer League(MASL). Founded in 1984, the Wave is currently the longest continuously operating professional soccerteam in the U.S. In its two seasons in the MASL, the Wave has lost twice in the Central Division Final(2014-15, 2015-16). The Wave plays its home games at UW-Milwaukee Panther Arena, which has asoccer capacity of 9,600.
G. LOCAL SPORTS TEAMS

Preliminary Draft – Subject to Revision Page 280
Milwaukee Admirals
UW-Milwaukee Panther Arena
The Milwaukee Admirals are a professional hockey team in the American Hockey League (AHL). TheAdmirals compete in the Western Conference Central Division. Before entering the AHL at thebeginning of the 2001-02 season, the team played in the International Hockey League (IHL) from 1977until 2001, when the IHL ceased operations. Since joining the AHL, the Admirals have won one CalderCup in 2003-04, along with two conference championships in 2003-04 and 2005-06. AS of 2016-17, theteam plays its home games at UW-Milwaukee Panther Arena, which was built in 1950 (most recentlyrenovated in 2016) and has a hockey capacity of 9,652. The team previously played at the BradleyCenter.
G. LOCAL SPORTS TEAMS
Season Attendance Rank of 302011-12 6,226 102012-13 5,624 142013-14 5,844 112014-15 5,809 112015-16 6,169 11Source: HockeyDB.
Announced Attendance Per Game
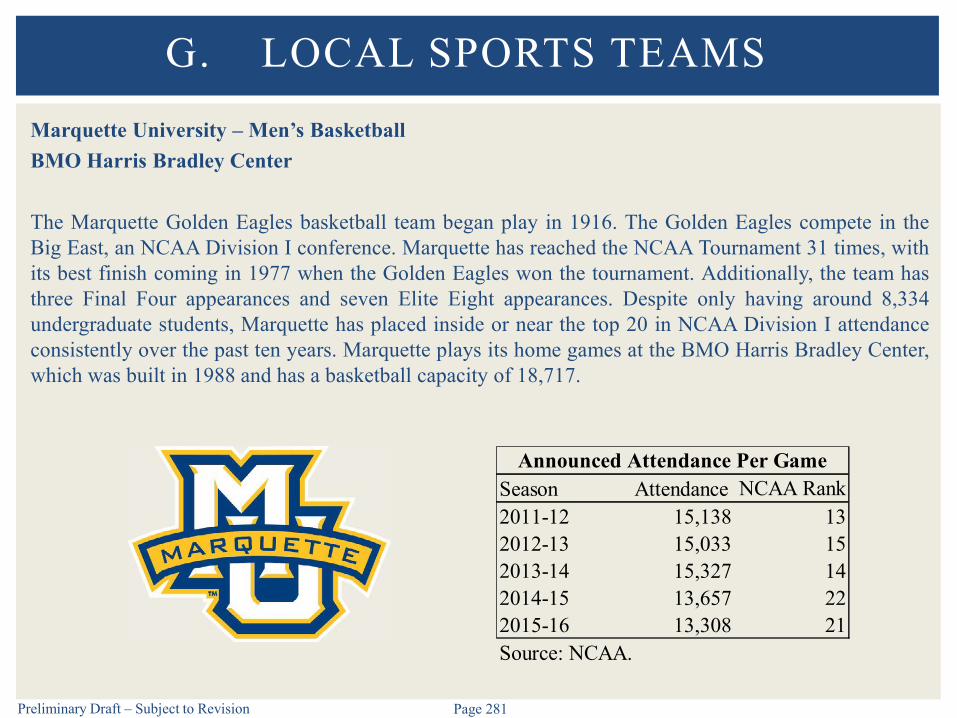
Preliminary Draft – Subject to Revision Page 281
Marquette University – Men’s Basketball
BMO Harris Bradley Center
The Marquette Golden Eagles basketball team began play in 1916. The Golden Eagles compete in theBig East, an NCAA Division I conference. Marquette has reached the NCAA Tournament 31 times, withits best finish coming in 1977 when the Golden Eagles won the tournament. Additionally, the team hasthree Final Four appearances and seven Elite Eight appearances. Despite only having around 8,334undergraduate students, Marquette has placed inside or near the top 20 in NCAA Division I attendanceconsistently over the past ten years. Marquette plays its home games at the BMO Harris Bradley Center,which was built in 1988 and has a basketball capacity of 18,717.
G. LOCAL SPORTS TEAMS
Season Attendance NCAA Rank2011-12 15,138 132012-13 15,033 152013-14 15,327 142014-15 13,657 222015-16 13,308 21Source: NCAA.
Announced Attendance Per Game
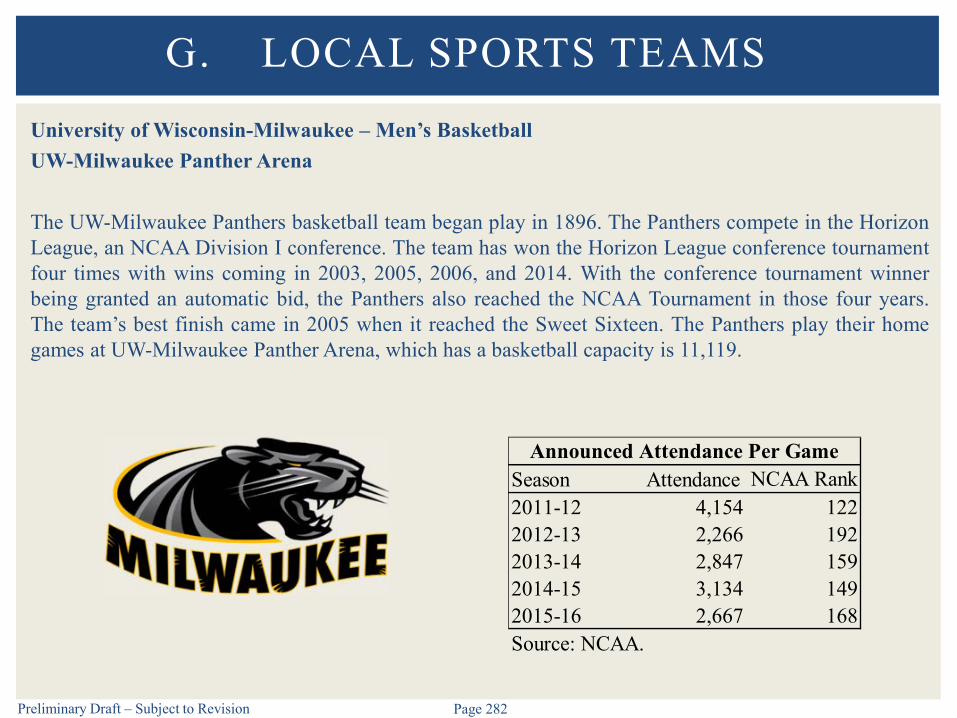
Preliminary Draft – Subject to Revision Page 282
University of Wisconsin-Milwaukee – Men’s Basketball
UW-Milwaukee Panther Arena
The UW-Milwaukee Panthers basketball team began play in 1896. The Panthers compete in the HorizonLeague, an NCAA Division I conference. The team has won the Horizon League conference tournamentfour times with wins coming in 2003, 2005, 2006, and 2014. With the conference tournament winnerbeing granted an automatic bid, the Panthers also reached the NCAA Tournament in those four years.The team’s best finish came in 2005 when it reached the Sweet Sixteen. The Panthers play their homegames at UW-Milwaukee Panther Arena, which has a basketball capacity is 11,119.
G. LOCAL SPORTS TEAMS
Season Attendance NCAA Rank2011-12 4,154 1222012-13 2,266 1922013-14 2,847 1592014-15 3,134 1492015-16 2,667 168Source: NCAA.
Announced Attendance Per Game

H. FESTIVALS/OTHER EVENTS
Preliminary Draft – Subject to Revision Page 284
Festivals/Other Events
One of the biggest changes to the concert industry recently has been the increasing number of largemulti-day festivals
According to Pollstar’s 2016 Global Festival Events Calendar there were approximately 1,900confirmed events in 2016 that spanned 74 countries around the world
Many festivals are willing to pay large sums of money to attract the best headliners and this haschanged the landscape of booking tours
Some artists book a few festivals and then fill-in the remaining dates for their tour In general, there is some concern regarding the potential oversaturation of the festival market
In addition to the supply of regional facilities, there are several large festivals in the Milwaukeeregion that further impact the ability and/or interest of artists to play at UW-Milwaukee Panther Arenaand Milwaukee Theatre including, but not limited to, the following:
Summerfest – Milwaukee Eaux Claires Music & Art Festival – Eau Claire Pitchfork Music Festival – Chicago Chicago Blues Festival – Chicago Lollapalooza – Chicago Country LakeShake Festival – Chicago
H. FESTIVALS/OTHER EVENTS
Preliminary Draft – Subject to Revision Page 285
Festivals/Other Events
Secondary sources report that American Family Insurance and Milwaukee World Festival Inc. haveagreed to a 10-year partnership that includes title sponsorship of Summerfest and the construction ofa new 23,000-seat amphitheater at Henry Maier Festival Park
Construction is tentatively slated for 2019-2020
H. FESTIVALS/OTHER EVENTS

I. DOWNTOWN DEVELOPMENT
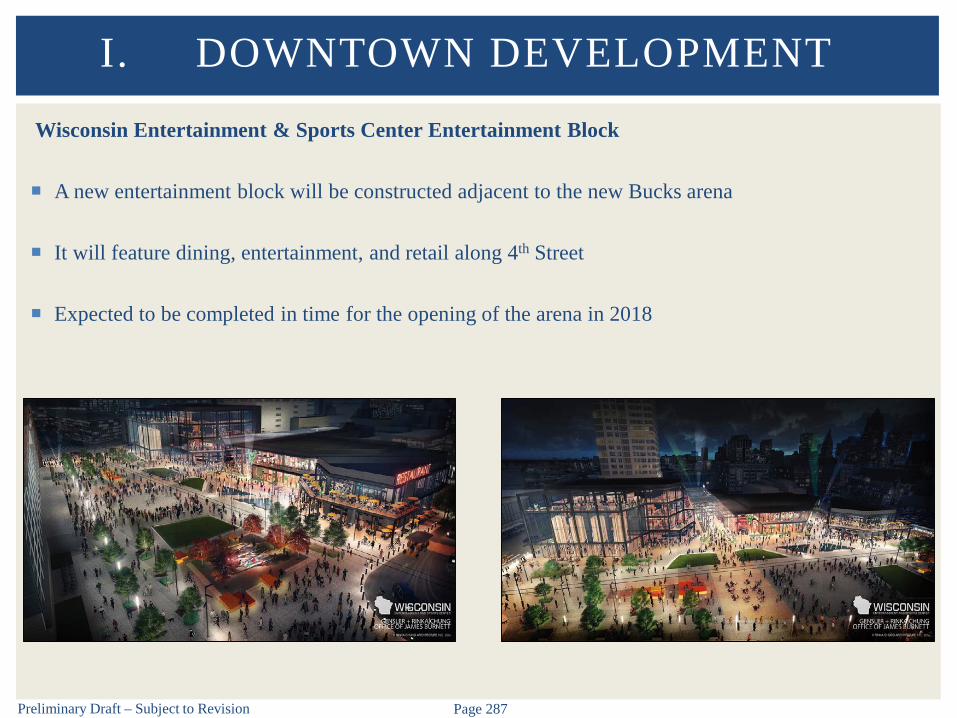
Preliminary Draft – Subject to Revision Page 287
Wisconsin Entertainment & Sports Center Entertainment Block
A new entertainment block will be constructed adjacent to the new Bucks arena
It will feature dining, entertainment, and retail along 4th Street
Expected to be completed in time for the opening of the arena in 2018
I. DOWNTOWN DEVELOPMENT
Preliminary Draft – Subject to Revision Page 288
4th and Wisconsin Avenue Development
The Redevelopment Authority of the City of Milwaukee issued a RFP in the Fall of 2016 for a transit-oriented development opportunity for a two-acre parcel at 4th and Wisconsin Avenue
Directly across from the Wisconsin Center
The site is located on both the proposed Milwaukee Streetcar route and the Bus Rapid Transit line
A portion of the site is reserved by the City to locate a Pavilion structure to service transit users
Submittals were received from Jackson Street Holdings LLC and from Marcus Corporation
Both projects sought to expand the supply of hotel rooms to support an expansion of the conventioncenter
I. DOWNTOWN DEVELOPMENT
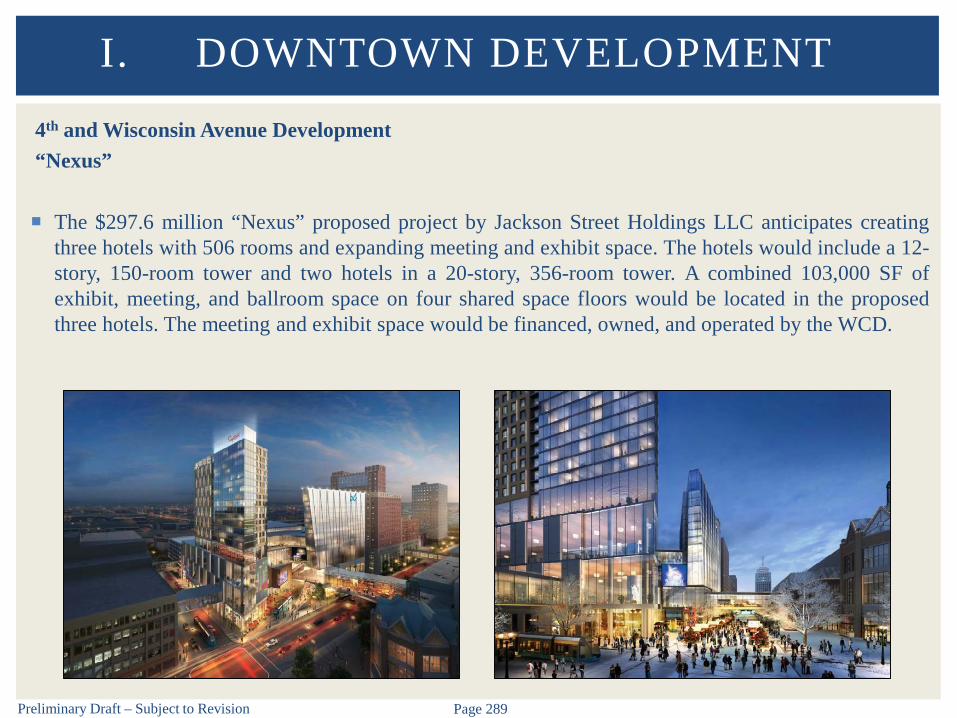
Preliminary Draft – Subject to Revision Page 289
4th and Wisconsin Avenue Development“Nexus”
The $297.6 million “Nexus” proposed project by Jackson Street Holdings LLC anticipates creatingthree hotels with 506 rooms and expanding meeting and exhibit space. The hotels would include a 12-story, 150-room tower and two hotels in a 20-story, 356-room tower. A combined 103,000 SF ofexhibit, meeting, and ballroom space on four shared space floors would be located in the proposedthree hotels. The meeting and exhibit space would be financed, owned, and operated by the WCD.
I. DOWNTOWN DEVELOPMENT
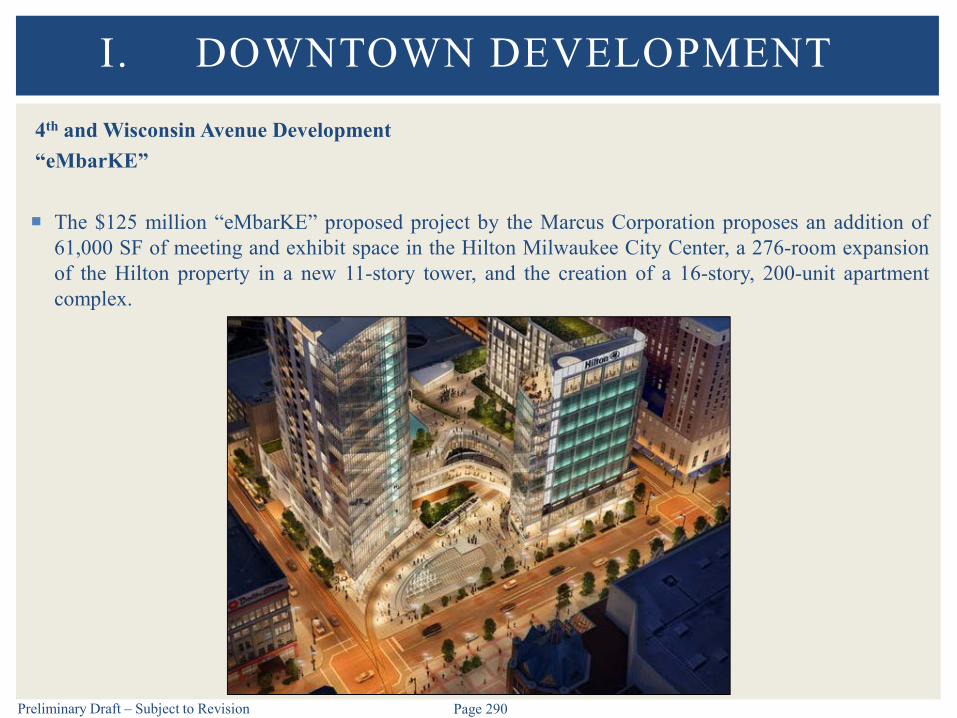
Preliminary Draft – Subject to Revision Page 290
4th and Wisconsin Avenue Development
“eMbarKE”
The $125 million “eMbarKE” proposed project by the Marcus Corporation proposes an addition of61,000 SF of meeting and exhibit space in the Hilton Milwaukee City Center, a 276-room expansionof the Hilton property in a new 11-story tower, and the creation of a 16-story, 200-unit apartmentcomplex.
I. DOWNTOWN DEVELOPMENT
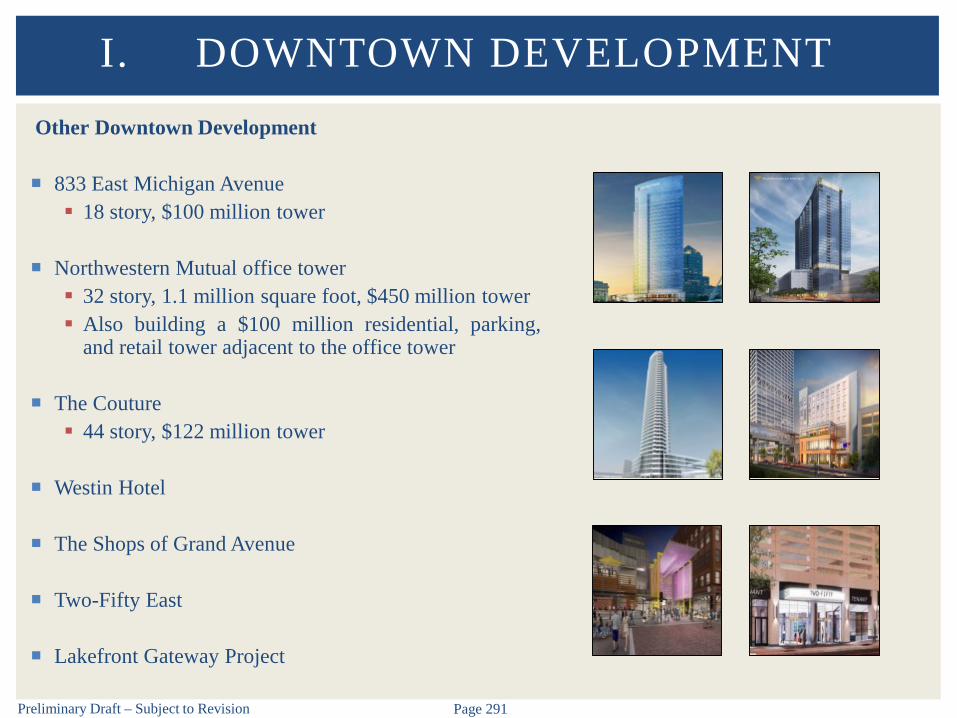
Preliminary Draft – Subject to Revision Page 291
Other Downtown Development
833 East Michigan Avenue 18 story, $100 million tower
Northwestern Mutual office tower 32 story, 1.1 million square foot, $450 million tower Also building a $100 million residential, parking,
and retail tower adjacent to the office tower
The Couture 44 story, $122 million tower
Westin Hotel
The Shops of Grand Avenue
Two-Fifty East
Lakefront Gateway Project
I. DOWNTOWN DEVELOPMENT

J. GENERAL OBSERVATIONS

Preliminary Draft – Subject to Revision Page 293
General Observations
Milwaukee is generally considered a mid-sized to small market area
Milwaukee’s income levels and spending are generally near to slightly below the average for similarlysized markets Slightly above average relative to comparable complex markets
Milwaukee has a strong corporate base relative to similarly sized markets
Milwaukee is an attractive but highly competitive market from a sports and entertainment perspective Milwaukee is the home of two major league sports teams, two minor league teams, and two major
college sports teams In terms of perception, Milwaukee is considered a good concert market, but not a “must play” for
artists Milwaukee is well positioned for routing of shows – easily routes with Chicago Significant amount of theater-style competition in Milwaukee market Presence of several large music festivals in the region impacts the WCD facilities’ ability to draw
artists – potential restrictions based on proximity
J. GENERAL OBSERVATIONS
Preliminary Draft – Subject to Revision Page 294
General Observations
Milwaukee’s busiest hotel and tourism months are June and July Summerfest occurs during these months
Air accessibility to Milwaukee has decreased in recent years, but is expected to improve
There is a great deal of development occurring in downtown Milwaukee – potential positive impacton WCD facilities with increased activity in the area and improved destination appeal New Bucks arena 4th and Wisconsin Several other developments underway
Wisconsin Center is the largest meeting & expo facility in Wisconsin in terms of total function squarefeet In-state facilities compete for events such as State associations and corporate meetings
J. GENERAL OBSERVATIONS

IV. BENCHMARKING ANALYSIS

Preliminary Draft – Subject to Revision Page 296
Overview
The previous sections provided an overview of current operations at WCD facilities, as well as thecompetitive landscape, which served as the basis for our limited benchmarking analysis. This sectionprofiles attributes of competitive and comparable facilities for benchmarking purposes.
For purposes of this analysis, facilities used in the benchmarking analysis were chosen based severalfactors including, but not limited to: geographic location; market attributes; building program; type ofevent activity hosted; destination attributes offered; owner/management structure; as well as inputfrom WCD management, VISIT Milwaukee and event promoters/producers/planners.
Benchmarking is a key element to short and long-term strategic planning. While providing significantdata, benchmarks still only serve as a guide. Other attributes such as specific facility/market factorsand industry trends are also considered when developing our conclusions and recommendations.
IV. BENCHMARKING ANALYSIS
Preliminary Draft – Subject to Revision Page 297
Overview (continued)
Benchmarking operations at WCD facilities to other similar venues can be beneficial in terms ofidentifying various strengths, weaknesses, opportunities, and threats. The challenge to benchmarkingis ensuring comparisons are accurate. Operating data was obtained and analyzed from the profiled setsbased on data from facility management, industry resources, published reports and our internaldatabase. The data shown in the report is based on available information for each of the profiledfacilities. Individual facilities are not identified in the benchmarking analysis because someinformation was provided confidentially.
The project team analyzed four peer sets including operations of the complex as a whole and each ofthe three individual facilities:
WCD Complex Wisconsin Center UW-Milwaukee Panther Arena Milwaukee Theatre
WCD does not currently allocate all revenues and expenses to each individual venue – we haveevaluated alternative allocation methods for benchmarking purposes and elected to use the eventbased allocation method
IV. BENCHMARKING ANALYSIS

Preliminary Draft – Subject to Revision Page 298
Revenue and Expense StatementUnallocated Revenue and Expenses
Illustrated below is the calculation of 2016 Unallocated Operating Revenue and Expenses in thestatements provided by WCD
$2.9 million in Operating Revenue and $2.8 million in Operating Expense were unallocated $2.0 million of the Operating Revenue was a one-time contribution from the Milwaukee Admirals
IV. BENCHMARKING ANALYSIS
Calculation of Unallocated Operating Revenues and ExpensesFYE December 2016
Wisconsin Center
UWM Panther
ArenaMilwaukee
Theatre Total
WCD Consolidated
Statement
Unallocated Operating
Revenues and Expenses
Total Operating Income $7,280,946 $2,181,797 $1,830,979 $11,293,722 $14,180,184 $2,886,462
Total Operating Expenses $4,235,510 $1,021,043 $542,448 $5,799,001 $8,592,377 $2,793,376
Operating Revenues Over Expenses $3,045,436 $1,160,753 $1,288,532 $5,494,721 $5,587,807 $93,086
Allocated by WCD Calculation of Unallocated
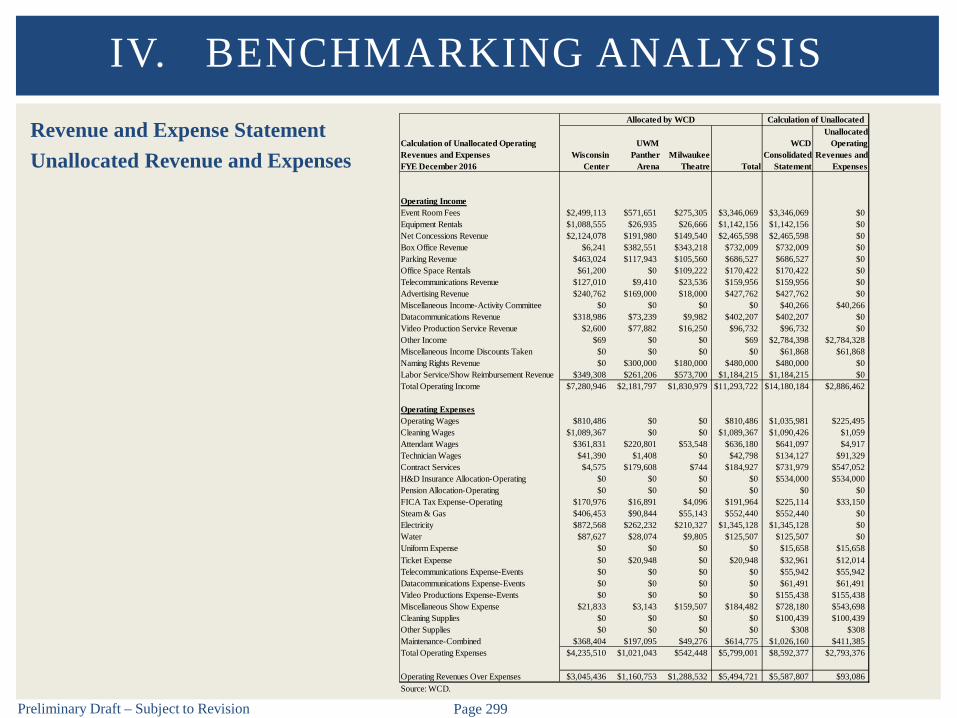
Preliminary Draft – Subject to Revision Page 299
Revenue and Expense StatementUnallocated Revenue and Expenses
IV. BENCHMARKING ANALYSIS
Calculation of Unallocated Operating Revenues and ExpensesFYE December 2016
Wisconsin Center
UWM Panther
ArenaMilwaukee
Theatre Total
WCD Consolidated
Statement
Unallocated Operating
Revenues and Expenses
Operating IncomeEvent Room Fees $2,499,113 $571,651 $275,305 $3,346,069 $3,346,069 $0Equipment Rentals $1,088,555 $26,935 $26,666 $1,142,156 $1,142,156 $0Net Concessions Revenue $2,124,078 $191,980 $149,540 $2,465,598 $2,465,598 $0Box Office Revenue $6,241 $382,551 $343,218 $732,009 $732,009 $0Parking Revenue $463,024 $117,943 $105,560 $686,527 $686,527 $0Office Space Rentals $61,200 $0 $109,222 $170,422 $170,422 $0Telecommunications Revenue $127,010 $9,410 $23,536 $159,956 $159,956 $0Advertising Revenue $240,762 $169,000 $18,000 $427,762 $427,762 $0Miscellaneous Income-Activity Committee $0 $0 $0 $0 $40,266 $40,266Datacommunications Revenue $318,986 $73,239 $9,982 $402,207 $402,207 $0Video Production Service Revenue $2,600 $77,882 $16,250 $96,732 $96,732 $0Other Income $69 $0 $0 $69 $2,784,398 $2,784,328Miscellaneous Income Discounts Taken $0 $0 $0 $0 $61,868 $61,868Naming Rights Revenue $0 $300,000 $180,000 $480,000 $480,000 $0Labor Service/Show Reimbursement Revenue $349,308 $261,206 $573,700 $1,184,215 $1,184,215 $0Total Operating Income $7,280,946 $2,181,797 $1,830,979 $11,293,722 $14,180,184 $2,886,462
Operating ExpensesOperating Wages $810,486 $0 $0 $810,486 $1,035,981 $225,495Cleaning Wages $1,089,367 $0 $0 $1,089,367 $1,090,426 $1,059Attendant Wages $361,831 $220,801 $53,548 $636,180 $641,097 $4,917Technician Wages $41,390 $1,408 $0 $42,798 $134,127 $91,329Contract Services $4,575 $179,608 $744 $184,927 $731,979 $547,052H&D Insurance Allocation-Operating $0 $0 $0 $0 $534,000 $534,000Pension Allocation-Operating $0 $0 $0 $0 $0 $0FICA Tax Expense-Operating $170,976 $16,891 $4,096 $191,964 $225,114 $33,150Steam & Gas $406,453 $90,844 $55,143 $552,440 $552,440 $0Electricity $872,568 $262,232 $210,327 $1,345,128 $1,345,128 $0Water $87,627 $28,074 $9,805 $125,507 $125,507 $0Uniform Expense $0 $0 $0 $0 $15,658 $15,658Ticket Expense $0 $20,948 $0 $20,948 $32,961 $12,014Telecommunications Expense-Events $0 $0 $0 $0 $55,942 $55,942Datacommunications Expense-Events $0 $0 $0 $0 $61,491 $61,491Video Productions Expense-Events $0 $0 $0 $0 $155,438 $155,438Miscellaneous Show Expense $21,833 $3,143 $159,507 $184,482 $728,180 $543,698Cleaning Supplies $0 $0 $0 $0 $100,439 $100,439Other Supplies $0 $0 $0 $0 $308 $308Maintenance-Combined $368,404 $197,095 $49,276 $614,775 $1,026,160 $411,385Total Operating Expenses $4,235,510 $1,021,043 $542,448 $5,799,001 $8,592,377 $2,793,376
Operating Revenues Over Expenses $3,045,436 $1,160,753 $1,288,532 $5,494,721 $5,587,807 $93,086Source: WCD.
Allocated by WCD Calculation of Unallocated
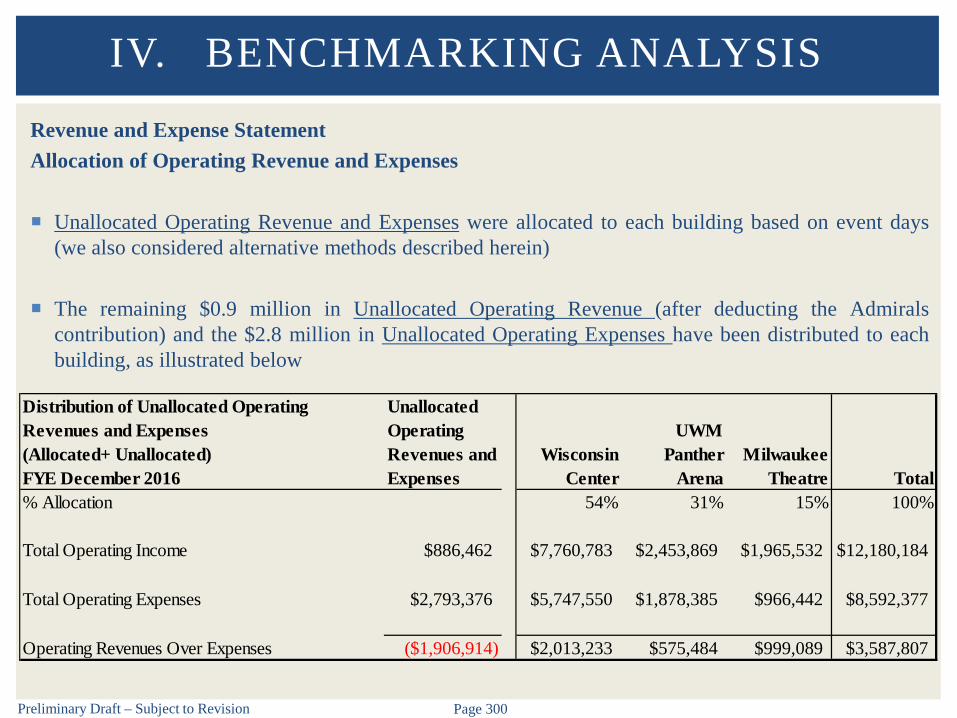
Preliminary Draft – Subject to Revision Page 300
Revenue and Expense StatementAllocation of Operating Revenue and Expenses
Unallocated Operating Revenue and Expenses were allocated to each building based on event days(we also considered alternative methods described herein)
The remaining $0.9 million in Unallocated Operating Revenue (after deducting the Admiralscontribution) and the $2.8 million in Unallocated Operating Expenses have been distributed to eachbuilding, as illustrated below
IV. BENCHMARKING ANALYSIS
Distribution of Unallocated Operating Revenues and Expenses (Allocated+ Unallocated)FYE December 2016
Unallocated Operating Revenues and Expenses
Wisconsin Center
UWM Panther
ArenaMilwaukee
Theatre Total% Allocation 54% 31% 15% 100%
Total Operating Income $886,462 $7,760,783 $2,453,869 $1,965,532 $12,180,184
Total Operating Expenses $2,793,376 $5,747,550 $1,878,385 $966,442 $8,592,377
Operating Revenues Over Expenses ($1,906,914) $2,013,233 $575,484 $999,089 $3,587,807

Preliminary Draft – Subject to Revision Page 301
Revenue and Expense StatementAllocation of Operating Revenue and Expenses
IV. BENCHMARKING ANALYSISDistribution of Unallocated Operating Revenues and Expenses (Allocated+ Unallocated)FYE December 2016
Unallocated Operating Revenues and Expenses
Wisconsin Center
UWM Panther
ArenaMilwaukee
Theatre Total% Allocation 54% 31% 15% 100%
Operating IncomeEvent Room Fees $0 $2,499,113 $571,651 $275,305 $3,346,069Equipment Rentals $0 $1,088,555 $26,935 $26,666 $1,142,156Net Concessions Revenue $0 $2,124,078 $191,980 $149,540 $2,465,598Box Office Revenue $0 $6,241 $382,551 $343,218 $732,009Parking Revenue $0 $463,024 $117,943 $105,560 $686,527Office Space Rentals $0 $61,200 $0 $109,222 $170,422Telecommunications Revenue $0 $127,010 $9,410 $23,536 $159,956Advertising Revenue $0 $240,762 $169,000 $18,000 $427,762Miscellaneous Income-Activity Committee $40,266 $21,796 $12,358 $6,112 $40,266Datacommunications Revenue $0 $318,986 $73,239 $9,982 $402,207Video Production Service Revenue $0 $2,600 $77,882 $16,250 $96,732Other Income (Admirals Contribution Excluded) $784,328 $424,622 $240,726 $119,050 $784,398Miscellaneous Income Discounts Taken $61,868 $33,489 $18,988 $9,391 $61,868Naming Rights Revenue $0 $0 $300,000 $180,000 $480,000Labor Service/Show Reimbursement Revenue $0 $349,308 $261,206 $573,700 $1,184,215Total Operating Income $886,462 $7,760,783 $2,453,869 $1,965,532 $12,180,184
Operating ExpensesOperating Wages $225,495 $932,545 $69,209 $34,227 $1,035,981Cleaning Wages $1,059 $1,089,940 $325 $161 $1,090,426Attendant Wages $4,917 $364,493 $222,310 $54,295 $641,097Technician Wages $91,329 $90,826 $29,439 $13,862 $134,127Contract Services $547,052 $300,691 $347,509 $83,779 $731,979H&D Insurance Allocation-Operating $534,000 $289,051 $163,895 $81,054 $534,000Pension Allocation-Operating $0 $0 $0 $0 $0FICA Tax Expense-Operating $33,150 $188,920 $27,066 $9,128 $225,114Steam & Gas $0 $406,453 $90,844 $55,143 $552,440Electricity $0 $872,568 $262,232 $210,327 $1,345,128Water $0 $87,627 $28,074 $9,805 $125,507Uniform Expense $15,658 $8,476 $4,806 $2,377 $15,658Ticket Expense $12,014 $6,503 $24,635 $1,823 $32,961Telecommunications Expense-Events $55,942 $30,281 $17,170 $8,491 $55,942Datacommunications Expense-Events $61,491 $33,285 $18,873 $9,333 $61,491Video Productions Expense-Events $155,438 $84,138 $47,707 $23,593 $155,438Miscellaneous Show Expense $543,698 $316,134 $170,014 $242,032 $728,180Cleaning Supplies $100,439 $54,367 $30,827 $15,245 $100,439Other Supplies $308 $167 $95 $47 $308Maintenance-Combined $411,385 $591,084 $323,357 $111,719 $1,026,160Total Operating Expenses $2,793,376 $5,747,550 $1,878,385 $966,442 $8,592,377
Operating Revenues Over Expenses ($1,906,914) $2,013,233 $575,484 $999,089 $3,587,807Note: Allocations have been made based on event days for 2016. Events taking place in multiple facilites were split evenly.Source: WCD.

Preliminary Draft – Subject to Revision Page 302
Revenue and Expense StatementAllocation of Non-Operating Expenses
Non-Operating Expenses have been allocated to each facility according to event days Over $5 million in total was allocated
VISIT Milwaukee Management Fee and Bond Interest Expense were excluded – not applicable forbenchmarking of facility operations
Non-Operating Income such as Taxes and Noncash Expenses such as Depreciation and Amortizationhave been excluded
IV. BENCHMARKING ANALYSIS
Allocation of Non-Operating ExpensesFYE December 2016
Consolidated Statement
Wisconsin Center
UWM Panther Arena
Milwaukee Theatre
Allocation % 100% 54% 31% 15%
Total Non-Operating Expenses $5,050,514 $2,733,816 $1,550,102 $766,596Note: Allocations have been made based on event days for 2016. Events taking place in multiple facilites were split evenly.

Preliminary Draft – Subject to Revision Page 303
Revenue and Expense StatementAllocation of Non-Operating Expenses
IV. BENCHMARKING ANALYSIS
Allocation of Non-Operating ExpensesFYE December 2016
Consolidated Statement
Wisconsin Center
UWM Panther Arena
Milwaukee Theatre
Allocation % 100% 54% 31% 15%
Non-Operating ExpensesAdministrative Wages $2,309,908 $1,250,341 $708,956 $350,611FICA Taxes $164,921 $89,271 $50,618 $25,033Unemployment Taxes $22,651 $12,261 $6,952 $3,438Health Insurance $505,307 $273,520 $155,089 $76,698Health Insurance-Employee Contribution ($63,763) ($34,515) ($19,570) ($9,678)Life Insurance $11,478 $6,213 $3,523 $1,742Pension $375,143 $203,063 $115,139 $56,941Advertising $125,041 $67,684 $38,377 $18,979Promotional Items $1,937 $1,048 $594 $294Visit Milwaukee Management Fee Excluded NA NA NAMaintenance-Copier/Fax/Software $0 $0 $0 $0Office Supplies $18,488 $10,007 $5,674 $2,806Legal Services $194,989 $105,546 $59,846 $29,597Professional Services $102,739 $55,612 $31,533 $15,594Information Technology Expense $287,038 $155,372 $88,097 $43,568Signage for Advertisers $0 $0 $0 $0Insurance $600,022 $324,789 $184,159 $91,075Employee Activity Expense $20,655 $11,181 $6,340 $3,135Interest Expense $45,193 $24,463 $13,871 $6,860Bond Interest Expense Excluded NA NA NATravel $15,394 $8,333 $4,725 $2,337Business Meetings $29,467 $15,950 $9,044 $4,473Postage $9,704 $5,253 $2,978 $1,473Recruiting $28,785 $15,581 $8,835 $4,369Training Expense $5,221 $2,826 $1,602 $792Dues & Subscriptions $55,839 $30,225 $17,138 $8,475Bad Debt Expense $24,000 $12,991 $7,366 $3,643Miscellaneous Expense $160,360 $86,802 $49,218 $24,340
Total Non-Operating Expenses $5,050,514 $2,733,816 $1,550,102 $766,596Note: Allocations have been made based on event days for 2016. Events taking place in multiple facilites were split evenly.Source: WCD.
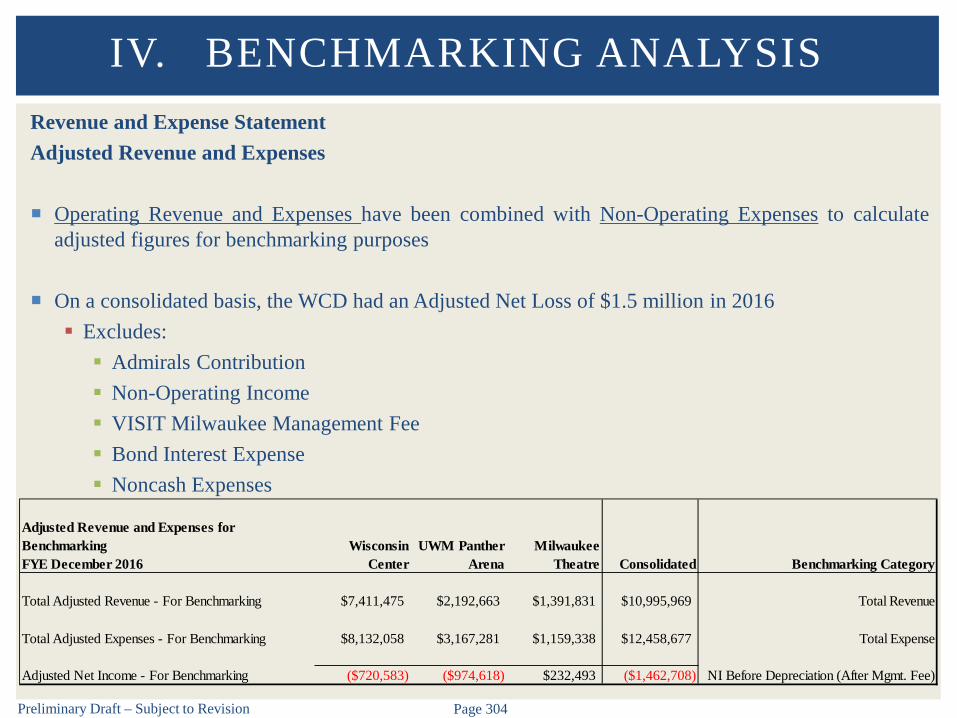
Preliminary Draft – Subject to Revision Page 304
Revenue and Expense StatementAdjusted Revenue and Expenses
Operating Revenue and Expenses have been combined with Non-Operating Expenses to calculateadjusted figures for benchmarking purposes
On a consolidated basis, the WCD had an Adjusted Net Loss of $1.5 million in 2016 Excludes: Admirals Contribution Non-Operating Income VISIT Milwaukee Management Fee Bond Interest Expense Noncash Expenses
IV. BENCHMARKING ANALYSIS
Adjusted Revenue and Expenses for BenchmarkingFYE December 2016
Wisconsin Center
UWM Panther Arena
Milwaukee Theatre Consolidated Benchmarking Category
Total Adjusted Revenue - For Benchmarking $7,411,475 $2,192,663 $1,391,831 $10,995,969 Total Revenue
Total Adjusted Expenses - For Benchmarking $8,132,058 $3,167,281 $1,159,338 $12,458,677 Total Expense
Adjusted Net Income - For Benchmarking ($720,583) ($974,618) $232,493 ($1,462,708) NI Before Depreciation (After Mgmt. Fee)
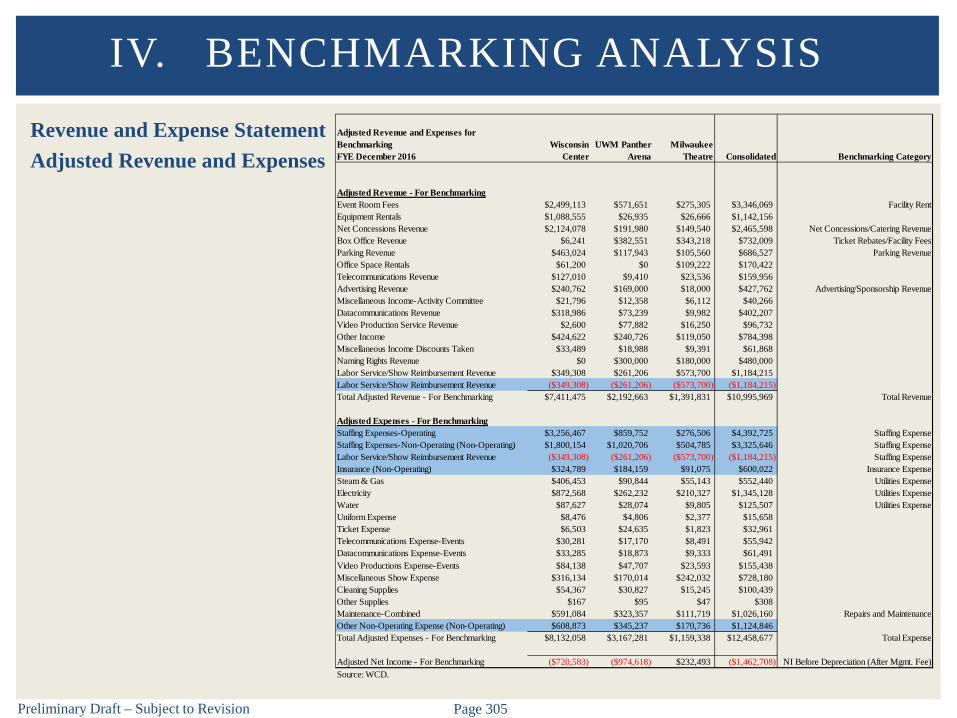
Preliminary Draft – Subject to Revision Page 305
Revenue and Expense StatementAdjusted Revenue and Expenses
IV. BENCHMARKING ANALYSISAdjusted Revenue and Expenses for BenchmarkingFYE December 2016
Wisconsin Center
UWM Panther Arena
Milwaukee Theatre Consolidated Benchmarking Category
Adjusted Revenue - For BenchmarkingEvent Room Fees $2,499,113 $571,651 $275,305 $3,346,069 Facility RentEquipment Rentals $1,088,555 $26,935 $26,666 $1,142,156Net Concessions Revenue $2,124,078 $191,980 $149,540 $2,465,598 Net Concessions/Catering RevenueBox Office Revenue $6,241 $382,551 $343,218 $732,009 Ticket Rebates/Facility FeesParking Revenue $463,024 $117,943 $105,560 $686,527 Parking RevenueOffice Space Rentals $61,200 $0 $109,222 $170,422Telecommunications Revenue $127,010 $9,410 $23,536 $159,956Advertising Revenue $240,762 $169,000 $18,000 $427,762 Advertising/Sponsorship RevenueMiscellaneous Income-Activity Committee $21,796 $12,358 $6,112 $40,266Datacommunications Revenue $318,986 $73,239 $9,982 $402,207Video Production Service Revenue $2,600 $77,882 $16,250 $96,732Other Income $424,622 $240,726 $119,050 $784,398Miscellaneous Income Discounts Taken $33,489 $18,988 $9,391 $61,868Naming Rights Revenue $0 $300,000 $180,000 $480,000Labor Service/Show Reimbursement Revenue $349,308 $261,206 $573,700 $1,184,215Labor Service/Show Reimbursement Revenue ($349,308) ($261,206) ($573,700) ($1,184,215)Total Adjusted Revenue - For Benchmarking $7,411,475 $2,192,663 $1,391,831 $10,995,969 Total Revenue
Adjusted Expenses - For BenchmarkingStaffing Expenses-Operating $3,256,467 $859,752 $276,506 $4,392,725 Staffing ExpenseStaffing Expenses-Non-Operating (Non-Operating) $1,800,154 $1,020,706 $504,785 $3,325,646 Staffing ExpenseLabor Service/Show Reimbursement Revenue ($349,308) ($261,206) ($573,700) ($1,184,215) Staffing ExpenseInsurance (Non-Operating) $324,789 $184,159 $91,075 $600,022 Insurance ExpenseSteam & Gas $406,453 $90,844 $55,143 $552,440 Utilities ExpenseElectricity $872,568 $262,232 $210,327 $1,345,128 Utilities ExpenseWater $87,627 $28,074 $9,805 $125,507 Utilities ExpenseUniform Expense $8,476 $4,806 $2,377 $15,658Ticket Expense $6,503 $24,635 $1,823 $32,961Telecommunications Expense-Events $30,281 $17,170 $8,491 $55,942Datacommunications Expense-Events $33,285 $18,873 $9,333 $61,491Video Productions Expense-Events $84,138 $47,707 $23,593 $155,438Miscellaneous Show Expense $316,134 $170,014 $242,032 $728,180Cleaning Supplies $54,367 $30,827 $15,245 $100,439Other Supplies $167 $95 $47 $308Maintenance-Combined $591,084 $323,357 $111,719 $1,026,160 Repairs and MaintenanceOther Non-Operating Expense (Non-Operating) $608,873 $345,237 $170,736 $1,124,846Total Adjusted Expenses - For Benchmarking $8,132,058 $3,167,281 $1,159,338 $12,458,677 Total Expense
Adjusted Net Income - For Benchmarking ($720,583) ($974,618) $232,493 ($1,462,708) NI Before Depreciation (After Mgmt. Fee)Source: WCD.

Preliminary Draft – Subject to Revision Page 306
Revenue and Expense StatementAdjusted Revenue and ExpensesReconciliation to WCD Financials
Below is a summary of adjustments made to WCD financials for benchmarking purposes
IV. BENCHMARKING ANALYSIS
FYE December 2012 2013 2014 2015 2016 Average CAGR
Total Operating Income $12,110,256 $11,858,625 $13,105,398 $9,983,980 $14,180,184 $12,247,689 4.0%Total Operating Expenses $9,259,708 $8,837,809 $8,571,872 $7,835,187 $8,592,377 $8,619,391 -1.9%Operating Revenues Over Expenses $2,850,548 $3,020,816 $4,533,526 $2,148,793 $5,587,807 $3,628,298 18.3%
Total Non-Operating Income $27,745,575 $29,387,264 $31,196,945 $33,140,007 $35,792,209 $31,452,400 6.6%Total Non-Operating Expenses $23,021,276 $23,690,813 $26,162,471 $24,569,168 $29,850,002 $25,458,746 6.7%Net Income (Loss) Before Non-Cash Items $7,574,847 $8,717,267 $9,568,000 $10,719,632 $11,530,013 $9,621,952 11.1%
Total Noncash Expenses $7,834,564 $7,985,480 $8,052,988 $9,197,903 $12,538,373 $9,121,862 12.5%Net Income (Loss) ($259,717) $731,787 $1,515,012 $1,521,730 ($1,008,360) $500,091 40.4%
AdjustmentsMilwaukee Admirals Contribution $0 $0 $0 $0 ($2,000,000) ($400,000) NATotal Non-Operating Income ($27,745,575) ($29,387,264) ($31,196,945) ($33,140,007) ($35,792,209) ($31,452,400) 6.6%Visit Milwaukee Management Fee $5,835,049 $6,038,419 $8,257,673 $7,039,365 $7,214,809 $6,877,063 5.4%Bond Interest Expense $12,549,422 $13,226,445 $13,039,249 $12,729,423 $17,584,679 $13,825,844 8.8%Total Noncash Expenses $7,834,564 $7,985,480 $8,052,988 $9,197,903 $12,538,373 $9,121,862 12.5%
Adjusted Net Income (Loss) ($1,786,256) ($1,405,133) ($332,023) ($2,651,587) ($1,462,708) ($1,527,541) -4.9%Source: WCD.
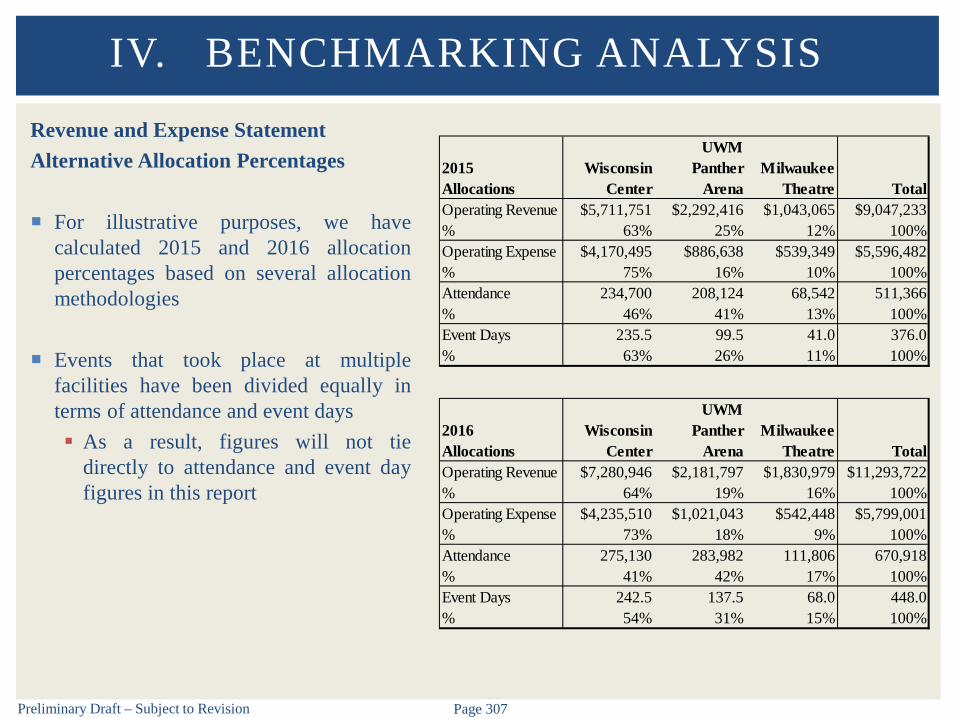
Preliminary Draft – Subject to Revision Page 307
Revenue and Expense StatementAlternative Allocation Percentages
For illustrative purposes, we havecalculated 2015 and 2016 allocationpercentages based on several allocationmethodologies
Events that took place at multiplefacilities have been divided equally interms of attendance and event days As a result, figures will not tie
directly to attendance and event dayfigures in this report
IV. BENCHMARKING ANALYSIS
2016Allocations
Wisconsin Center
UWM Panther
ArenaMilwaukee
Theatre TotalOperating Revenue $7,280,946 $2,181,797 $1,830,979 $11,293,722% 64% 19% 16% 100%Operating Expense $4,235,510 $1,021,043 $542,448 $5,799,001% 73% 18% 9% 100%Attendance 275,130 283,982 111,806 670,918% 41% 42% 17% 100%Event Days 242.5 137.5 68.0 448.0% 54% 31% 15% 100%
2015Allocations
Wisconsin Center
UWM Panther
ArenaMilwaukee
Theatre TotalOperating Revenue $5,711,751 $2,292,416 $1,043,065 $9,047,233% 63% 25% 12% 100%Operating Expense $4,170,495 $886,638 $539,349 $5,596,482% 75% 16% 10% 100%Attendance 234,700 208,124 68,542 511,366% 46% 41% 13% 100%Event Days 235.5 99.5 41.0 376.0% 63% 26% 11% 100%
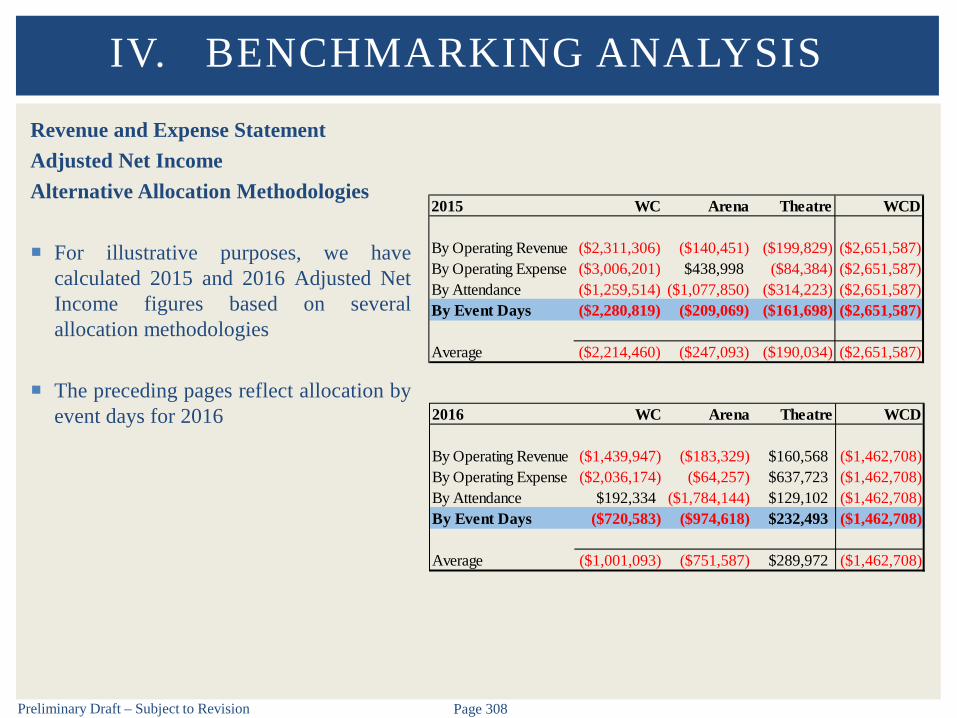
Preliminary Draft – Subject to Revision Page 308
Revenue and Expense StatementAdjusted Net IncomeAlternative Allocation Methodologies
For illustrative purposes, we havecalculated 2015 and 2016 Adjusted NetIncome figures based on severalallocation methodologies
The preceding pages reflect allocation byevent days for 2016
IV. BENCHMARKING ANALYSIS
2016 WC Arena Theatre WCD
By Operating Revenue ($1,439,947) ($183,329) $160,568 ($1,462,708)By Operating Expense ($2,036,174) ($64,257) $637,723 ($1,462,708)By Attendance $192,334 ($1,784,144) $129,102 ($1,462,708)By Event Days ($720,583) ($974,618) $232,493 ($1,462,708)
Average ($1,001,093) ($751,587) $289,972 ($1,462,708)
2015 WC Arena Theatre WCD
By Operating Revenue ($2,311,306) ($140,451) ($199,829) ($2,651,587)By Operating Expense ($3,006,201) $438,998 ($84,384) ($2,651,587)By Attendance ($1,259,514) ($1,077,850) ($314,223) ($2,651,587)By Event Days ($2,280,819) ($209,069) ($161,698) ($2,651,587)
Average ($2,214,460) ($247,093) ($190,034) ($2,651,587)

A. WCD BENCHMARKING
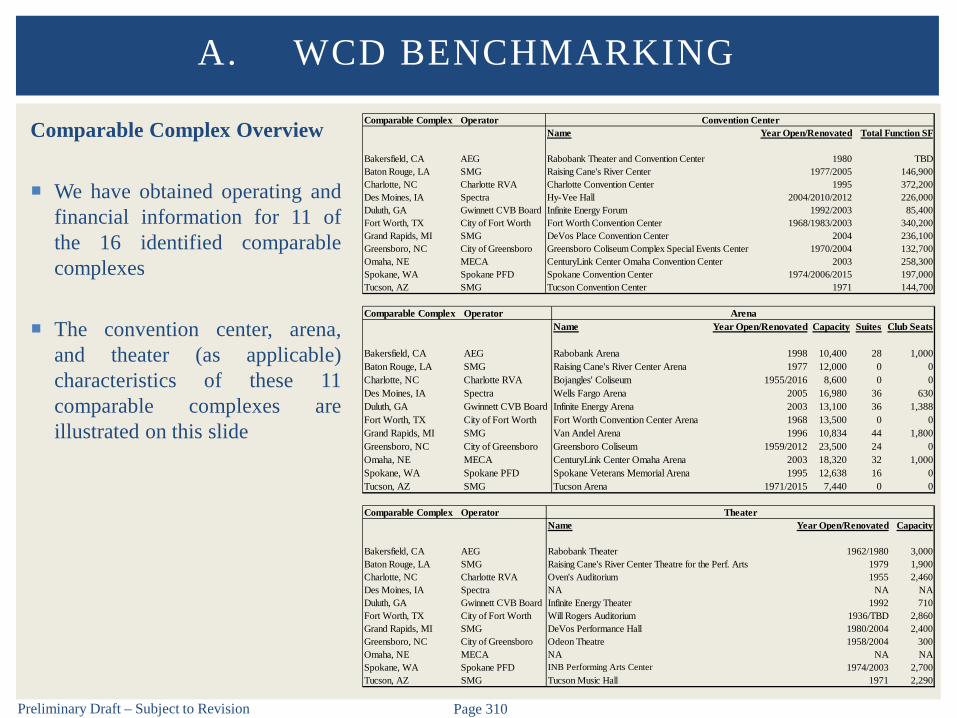
Preliminary Draft – Subject to Revision Page 310
Comparable Complex Overview
We have obtained operating andfinancial information for 11 ofthe 16 identified comparablecomplexes
The convention center, arena,and theater (as applicable)characteristics of these 11comparable complexes areillustrated on this slide
A. WCD BENCHMARKINGComparable Complex Operator
Name Year Open/Renovated Total Function SF
Bakersfield, CA AEG Rabobank Theater and Convention Center 1980 TBDBaton Rouge, LA SMG Raising Cane's River Center 1977/2005 146,900Charlotte, NC Charlotte RVA Charlotte Convention Center 1995 372,200Des Moines, IA Spectra Hy-Vee Hall 2004/2010/2012 226,000Duluth, GA Gwinnett CVB Board Infinite Energy Forum 1992/2003 85,400Fort Worth, TX City of Fort Worth Fort Worth Convention Center 1968/1983/2003 340,200Grand Rapids, MI SMG DeVos Place Convention Center 2004 236,100Greensboro, NC City of Greensboro Greensboro Coliseum Complex Special Events Center 1970/2004 132,700Omaha, NE MECA CenturyLink Center Omaha Convention Center 2003 258,300Spokane, WA Spokane PFD Spokane Convention Center 1974/2006/2015 197,000Tucson, AZ SMG Tucson Convention Center 1971 144,700
Convention Center
Comparable Complex OperatorName Year Open/Renovated Capacity Suites Club Seats
Bakersfield, CA AEG Rabobank Arena 1998 10,400 28 1,000Baton Rouge, LA SMG Raising Cane's River Center Arena 1977 12,000 0 0Charlotte, NC Charlotte RVA Bojangles' Coliseum 1955/2016 8,600 0 0Des Moines, IA Spectra Wells Fargo Arena 2005 16,980 36 630Duluth, GA Gwinnett CVB Board Infinite Energy Arena 2003 13,100 36 1,388Fort Worth, TX City of Fort Worth Fort Worth Convention Center Arena 1968 13,500 0 0Grand Rapids, MI SMG Van Andel Arena 1996 10,834 44 1,800Greensboro, NC City of Greensboro Greensboro Coliseum 1959/2012 23,500 24 0Omaha, NE MECA CenturyLink Center Omaha Arena 2003 18,320 32 1,000Spokane, WA Spokane PFD Spokane Veterans Memorial Arena 1995 12,638 16 0Tucson, AZ SMG Tucson Arena 1971/2015 7,440 0 0
Arena
Comparable Complex OperatorName Year Open/Renovated Capacity
Bakersfield, CA AEG Rabobank Theater 1962/1980 3,000Baton Rouge, LA SMG Raising Cane's River Center Theatre for the Perf. Arts 1979 1,900Charlotte, NC Charlotte RVA Oven's Auditorium 1955 2,460Des Moines, IA Spectra NA NA NADuluth, GA Gwinnett CVB Board Infinite Energy Theater 1992 710Fort Worth, TX City of Fort Worth Will Rogers Auditorium 1936/TBD 2,860Grand Rapids, MI SMG DeVos Performance Hall 1980/2004 2,400Greensboro, NC City of Greensboro Odeon Theatre 1958/2004 300Omaha, NE MECA NA NA NASpokane, WA Spokane PFD INB Performing Arts Center 1974/2003 2,700Tucson, AZ SMG Tucson Music Hall 1971 2,290
Theater

Preliminary Draft – Subject to Revision Page 311
Event Mix
Number of events per comparable complex vary significantly due to a variety of factors. Number ofevents ranged from a low of 351 to a high of 1,054 with an average number of events ofapproximately 650. WCD is 31% below the comparable complex average.
A. WCD BENCHMARKING
351 353
547582
697 718 720
831
1,054
650
448
0
200
400
600
800
1,000
1,200
Comp. 1 Comp. 2 Comp. 3 Comp. 4 Comp. 5 Comp. 6 Comp. 7 Comp. 8 Comp. 9 Average WCD
Number of Events

Preliminary Draft – Subject to Revision Page 312
Attendance
Attendance at the comparables vary significantly due to a variety of factors including: tenant mix;market competition; age; amenities; accounting/reporting policies etc.
Total attendance ranged from a low of 403,000 to a high of 1.3 million. Average attendance wasapproximately 952,000. WCD is 30% below the comparable complex average.
A. WCD BENCHMARKING
403
503
732 763
1,035
1,2111,275 1,278
1,366
952
671
0
400
800
1,200
1,600
Comp. 1 Comp. 2 Comp. 3 Comp. 4 Comp. 5 Comp. 6 Comp. 7 Comp. 8 Comp. 9 Average WCD
Attendance(000s)
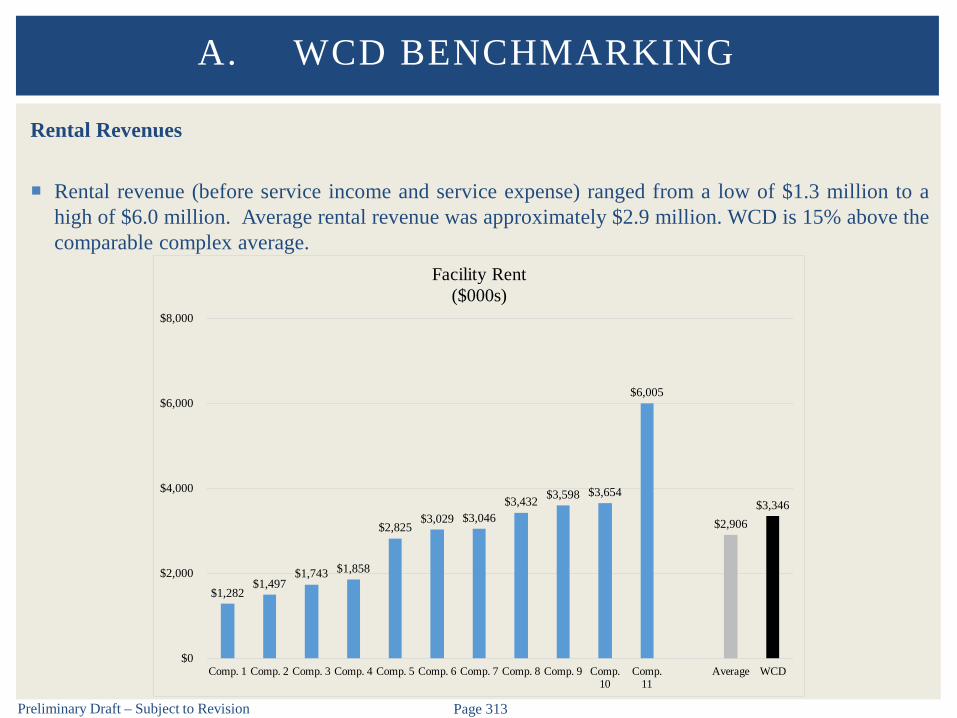
Preliminary Draft – Subject to Revision Page 313
Rental Revenues
Rental revenue (before service income and service expense) ranged from a low of $1.3 million to ahigh of $6.0 million. Average rental revenue was approximately $2.9 million. WCD is 15% above thecomparable complex average.
A. WCD BENCHMARKING
$1,282 $1,497
$1,743 $1,858
$2,825 $3,029 $3,046
$3,432 $3,598 $3,654
$6,005
$2,906 $3,346
$0
$2,000
$4,000
$6,000
$8,000
Comp. 1 Comp. 2 Comp. 3 Comp. 4 Comp. 5 Comp. 6 Comp. 7 Comp. 8 Comp. 9 Comp.10
Comp.11
Average WCD
Facility Rent($000s)
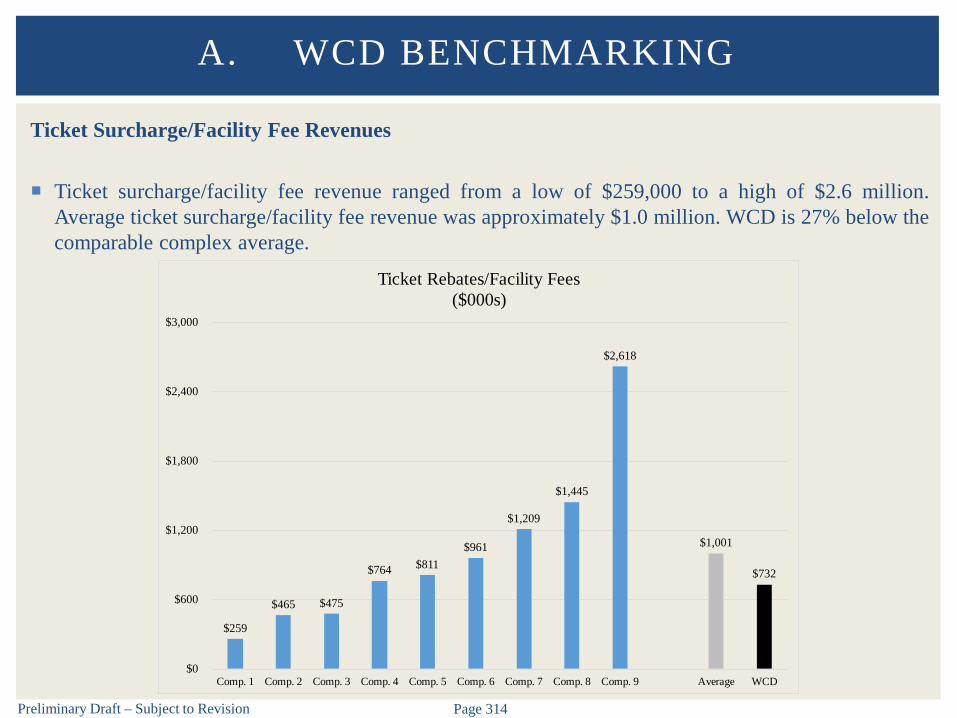
Preliminary Draft – Subject to Revision Page 314
Ticket Surcharge/Facility Fee Revenues
Ticket surcharge/facility fee revenue ranged from a low of $259,000 to a high of $2.6 million.Average ticket surcharge/facility fee revenue was approximately $1.0 million. WCD is 27% below thecomparable complex average.
A. WCD BENCHMARKING
$259
$465 $475
$764 $811 $961
$1,209
$1,445
$2,618
$1,001
$732
$0
$600
$1,200
$1,800
$2,400
$3,000
Comp. 1 Comp. 2 Comp. 3 Comp. 4 Comp. 5 Comp. 6 Comp. 7 Comp. 8 Comp. 9 Average WCD
Ticket Rebates/Facility Fees($000s)

Preliminary Draft – Subject to Revision Page 315
Advertising Revenues
Annual advertising revenues for comparable complexes ranged from approximately $167,000 toapproximately $1.7 million. Average annual advertising revenue was approximately $774,000. WCDis 45% below the comparable complex average.
A. WCD BENCHMARKING
$167 $202
$404
$667 $669
$866 $869
$1,420
$1,701
$774
$428
$0
$300
$600
$900
$1,200
$1,500
$1,800
Comp. 1 Comp. 2 Comp. 3 Comp. 4 Comp. 5 Comp. 6 Comp. 7 Comp. 8 Comp. 9 Average WCD
Advertising/Sponsorship Revenue($000s)
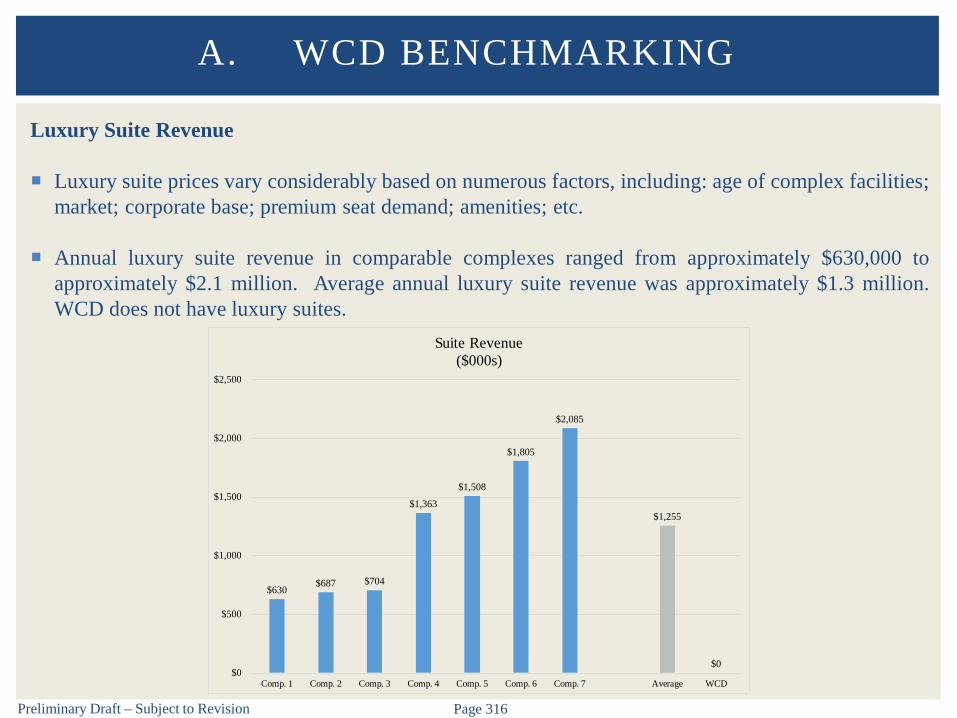
Preliminary Draft – Subject to Revision Page 316
Luxury Suite Revenue
Luxury suite prices vary considerably based on numerous factors, including: age of complex facilities;market; corporate base; premium seat demand; amenities; etc.
Annual luxury suite revenue in comparable complexes ranged from approximately $630,000 toapproximately $2.1 million. Average annual luxury suite revenue was approximately $1.3 million.WCD does not have luxury suites.
A. WCD BENCHMARKING
$630 $687 $704
$1,363
$1,508
$1,805
$2,085
$1,255
$0 $0
$500
$1,000
$1,500
$2,000
$2,500
Comp. 1 Comp. 2 Comp. 3 Comp. 4 Comp. 5 Comp. 6 Comp. 7 Average WCD
Suite Revenue($000s)
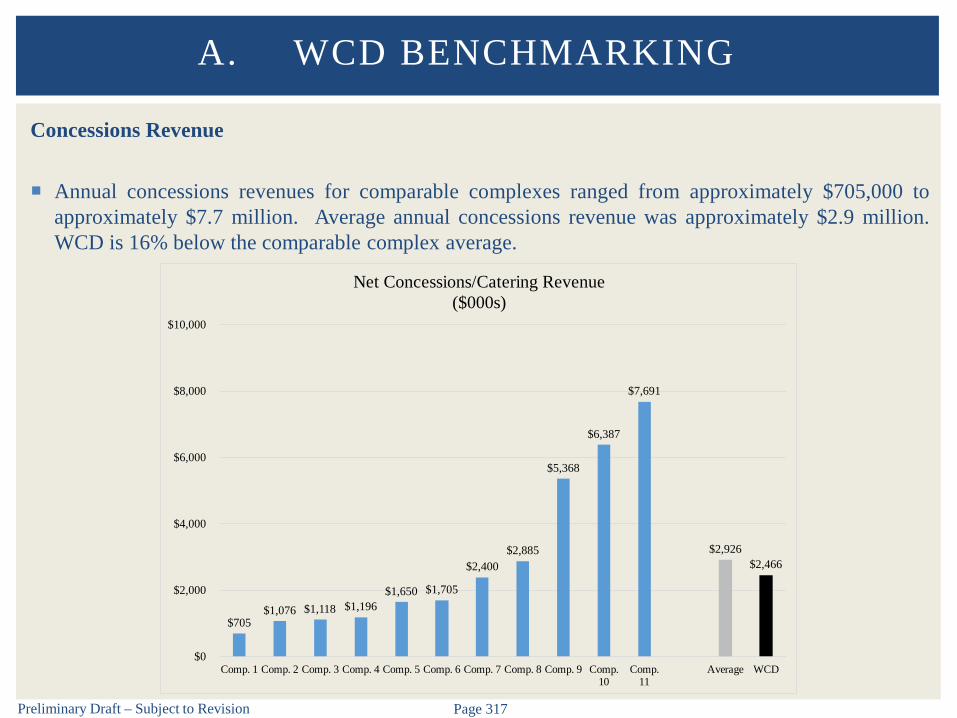
Preliminary Draft – Subject to Revision Page 317
Concessions Revenue
Annual concessions revenues for comparable complexes ranged from approximately $705,000 toapproximately $7.7 million. Average annual concessions revenue was approximately $2.9 million.WCD is 16% below the comparable complex average.
A. WCD BENCHMARKING
$705 $1,076 $1,118 $1,196
$1,650 $1,705
$2,400 $2,885
$5,368
$6,387
$7,691
$2,926 $2,466
$0
$2,000
$4,000
$6,000
$8,000
$10,000
Comp. 1 Comp. 2 Comp. 3 Comp. 4 Comp. 5 Comp. 6 Comp. 7 Comp. 8 Comp. 9 Comp.10
Comp.11
Average WCD
Net Concessions/Catering Revenue($000s)

Preliminary Draft – Subject to Revision Page 318
Novelties Revenue
Novelties revenues are typically retained by tenant or act Complex occasionally receives nominal share of novelties revenues
Annual novelties revenues for comparable complexes ranged from approximately $15,000 toapproximately $260,000. Average annual novelties revenue (when received) was approximately$118,000. WCD’s novelties revenue is included in concessions.
A. WCD BENCHMARKING
$15
$39 $49 $52
$94 $99 $102
$148
$185
$253 $260
$118
$0 $0
$50
$100
$150
$200
$250
$300
Comp. 1 Comp. 2 Comp. 3 Comp. 4 Comp. 5 Comp. 6 Comp. 7 Comp. 8 Comp. 9 Comp.10
Comp.11
Average WCD
Net Novelty Revenue($000s)

Preliminary Draft – Subject to Revision Page 319
Parking Revenue
Complex location impacts the number of required parking spaces – downtown facilities typicallyrequire fewer controlled parking spaces
Parking revenue in comparable complexes ranged from a loss of approximately $15,000 toapproximately $1.5 million. Average parking revenue was approximately $978,000. WCD is 30%below the comparable complex average.
A. WCD BENCHMARKING
($15)
$204
$814
$1,180 $1,249
$1,407 $1,460
$1,527
$978
$687
($400)
$0
$400
$800
$1,200
$1,600
Comp. 1 Comp. 2 Comp. 3 Comp. 4 Comp. 5 Comp. 6 Comp. 7 Comp. 8 Average WCD
Parking Revenue($000s)

Preliminary Draft – Subject to Revision Page 320
Total Operating Revenue
Total operating revenue in comparable complexes ranged from approximately $3.8 million toapproximately $23.7 million. Average total operating revenue was $10.7 million. WCD is 3% abovethe comparable complex average.
A. WCD BENCHMARKING
$3,737 $3,978
$5,677 $7,130 $7,421
$8,971
$11,455
$14,311 $14,965
$16,647
$23,666
$10,723 $10,996
$0
$5,000
$10,000
$15,000
$20,000
$25,000
Comp. 1 Comp. 2 Comp. 3 Comp. 4 Comp. 5 Comp. 6 Comp. 7 Comp. 8 Comp. 9 Comp.10
Comp.11
Average WCD
Total Revenue($000s)

Preliminary Draft – Subject to Revision Page 321
Staffing Expense
Staffing expenses vary considerably due to several factors, including: local wage levels; eventmix/schedules; accounting policies/procedures; overhead allocations; contract labor policies; andreimbursement polices for game/event related staffing expenses
Staffing expense in comparable complexes ranged from approximately $1.1 million to approximately$9.0 million. Average staffing expense was approximately $4.6 million. WCD is 41% above thecomparable complex average.
A. WCD BENCHMARKING
$1,139
$2,049 $2,635
$3,973 $4,205 $4,788 $4,905
$5,776 $5,827
$6,554
$9,094
$4,632
$6,534
$0
$2,000
$4,000
$6,000
$8,000
$10,000
Comp. 1 Comp. 2 Comp. 3 Comp. 4 Comp. 5 Comp. 6 Comp. 7 Comp. 8 Comp. 9 Comp.10
Comp.11
Average WCD
Staffing Expense(Including Contract Services/Labor)
($000s)

Preliminary Draft – Subject to Revision Page 322
Utilities Expense
Utilities expense vary considerably due to several factors, including: event mix/schedules and localclimate, etc.
Utilities expense in comparable complexes ranged from approximately $958,000 to approximately$2.3 million. Average utilities expense was approximately $1.4 million. WCD is 42% above thecomparable complex average.
A. WCD BENCHMARKING
$958 $976
$1,203 $1,207 $1,253 $1,316 $1,347
$1,576
$2,110
$2,271
$1,422
$2,023
$0
$500
$1,000
$1,500
$2,000
$2,500
Comp. 1 Comp. 2 Comp. 3 Comp. 4 Comp. 5 Comp. 6 Comp. 7 Comp. 8 Comp. 9 Comp. 10 Average WCD
Utilities Expense($000s)

Preliminary Draft – Subject to Revision Page 323
Repairs and Maintenance Expense
Repairs and maintenance expense vary due to a number of factors, including: age and condition offacility; accounting policies/procedures; etc.
Repairs and maintenance expense in comparable complexes ranged from approximately $22,000 toapproximately $1.6 million. Average repairs and maintenance expense was approximately $601,000.WCD is 71% above the comparable complex average.
A. WCD BENCHMARKING
$22
$161
$294
$419 $463 $468
$600
$937 $1,022
$1,621
$601
$1,026
$0
$300
$600
$900
$1,200
$1,500
$1,800
Comp. 1 Comp. 2 Comp. 3 Comp. 4 Comp. 5 Comp. 6 Comp. 7 Comp. 8 Comp. 9 Comp. 10 Average WCD
Repairs and Maintenance($000s)

Preliminary Draft – Subject to Revision Page 324
Insurance Expense
Insurance typically reflects an important expense for operations Tenants may share in insurance expenses or facility covered by municipality umbrella policy
Insurance expense in comparable complexes ranged from approximately $14,000 to approximately$451,000. Average insurance expense was approximately $200,000. WCD is 188% above thecomparable complex average.
A. WCD BENCHMARKING
$14
$105 $114 $114
$194 $201
$263 $278
$345
$451
$208
$600
$0
$200
$400
$600
$800
Comp. 1 Comp. 2 Comp. 3 Comp. 4 Comp. 5 Comp. 6 Comp. 7 Comp. 8 Comp. 9 Comp. 10 Average WCD
Insurance Expense($000s)
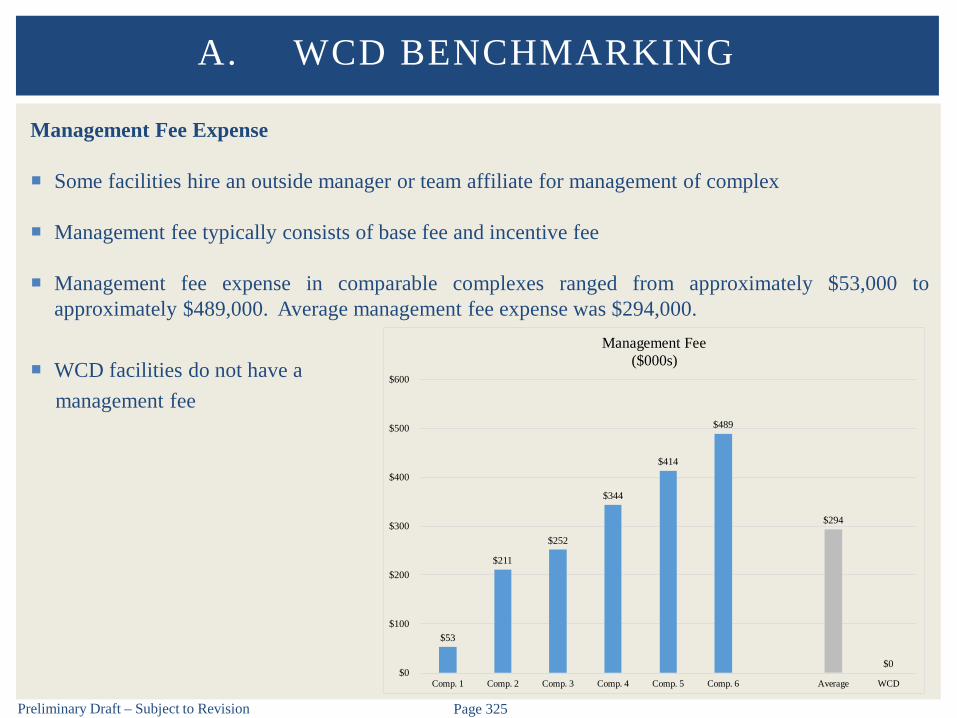
Preliminary Draft – Subject to Revision Page 325
Management Fee Expense
Some facilities hire an outside manager or team affiliate for management of complex
Management fee typically consists of base fee and incentive fee
Management fee expense in comparable complexes ranged from approximately $53,000 toapproximately $489,000. Average management fee expense was $294,000.
WCD facilities do not have amanagement fee
A. WCD BENCHMARKING
$53
$211
$252
$344
$414
$489
$294
$0 $0
$100
$200
$300
$400
$500
$600
Comp. 1 Comp. 2 Comp. 3 Comp. 4 Comp. 5 Comp. 6 Average WCD
Management Fee($000s)

Preliminary Draft – Subject to Revision Page 326
Total Operating Expenses
Total operating expenses in comparable complexes ranged from approximately $4.2 million toapproximately $18.9 million. Average total operating expenses were approximately $10.6 million.WCD is 18% above the comparable complex average.
A. WCD BENCHMARKING
$4,222
$6,250 $6,956
$8,300 $8,843
$9,733
$11,743 $11,789
$13,882
$15,839
$18,868
$10,584
$12,459
$0
$4,000
$8,000
$12,000
$16,000
$20,000
Comp. 1 Comp. 2 Comp. 3 Comp. 4 Comp. 5 Comp. 6 Comp. 7 Comp. 8 Comp. 9 Comp.10
Comp.11
Average WCD
Total Expense($000s)
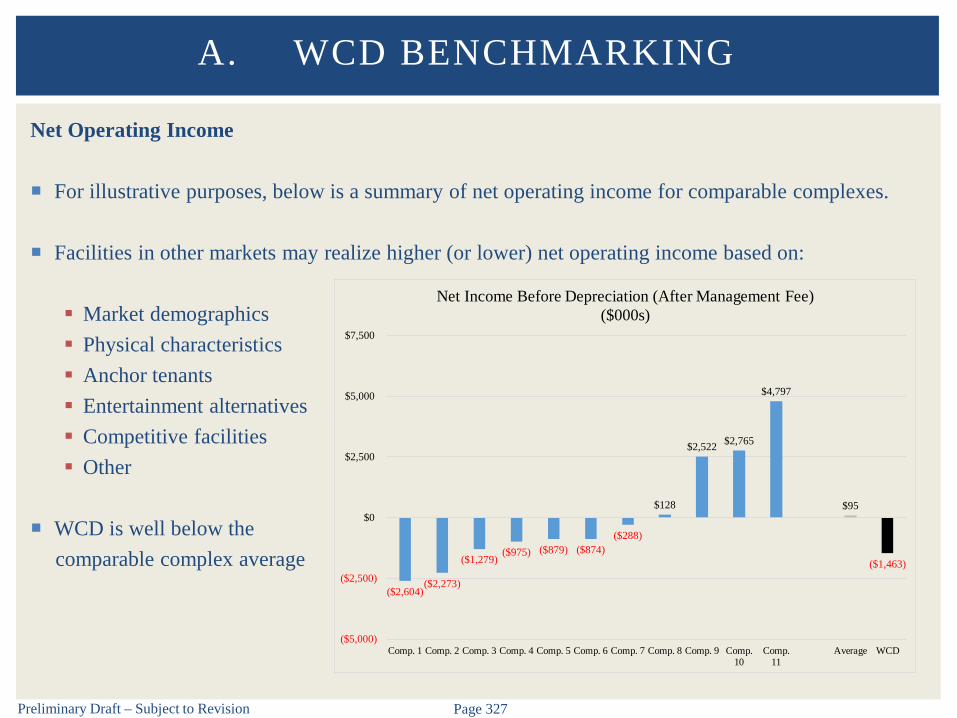
Preliminary Draft – Subject to Revision Page 327
Net Operating Income
For illustrative purposes, below is a summary of net operating income for comparable complexes.
Facilities in other markets may realize higher (or lower) net operating income based on:
Market demographics Physical characteristics Anchor tenants Entertainment alternatives Competitive facilities Other
WCD is well below thecomparable complex average
A. WCD BENCHMARKING
($2,604)($2,273)
($1,279)($975) ($879) ($874)
($288)
$128
$2,522 $2,765
$4,797
$95
($1,463)
($5,000)
($2,500)
$0
$2,500
$5,000
$7,500
Comp. 1 Comp. 2 Comp. 3 Comp. 4 Comp. 5 Comp. 6 Comp. 7 Comp. 8 Comp. 9 Comp.10
Comp.11
Average WCD
Net Income Before Depreciation (After Management Fee)($000s)

B. WISCONSIN CENTER
BENCHMARKING
Preliminary Draft – Subject to Revision Page 329
Overview
Although the profiled convention centers used in this analysis include both competitive facilities such as those inCincinnati, Columbus, Grand Rapids, Indianapolis, Kansas City, Louisville, Minneapolis, Nashville, Omaha, and St.Louis as well as comparable facilities, differences exist between each facility and its surrounding amenities relativeto the Wisconsin as well as comparable facilities, differences exist between each facility and its surroundingamenities relative to the Wisconsin Center and its market attributes. For instance, some profiled convention centersoffer significantly more hotels within walking distance to their venue as compared to the Wisconsin Center. Inaddition, the quality and proximity of hotel rooms can directly impact a facility’s marketability to certain events thatattract out-of-town attendees. While there is no perfect comparable facility, valuable lessons can still be learnedrelative to evaluating Wisconsin Center operations.
Profiled convention centers include: America’s Center CenturyLink Convention Center Charlotte Convention Center David L. Lawrence Convention Center DeVos Place Convention Center Duke Energy Convention Center Greater Columbus Convention Center
This section profiles each facility’s owner/operator, building program, operating attributes (e.g., utilization,occupancy, staffing levels, operating revenues, operating expenses, operating income, etc.) along with selectdestination attributes.
B. WISCONSIN CENTER BENCHMARKING
Huntington Convention Center of Cleveland Indiana Convention Center Kansas City Convention Center Kentucky International Convention Center Minneapolis Convention Center Music City Center Oregon Convention Center
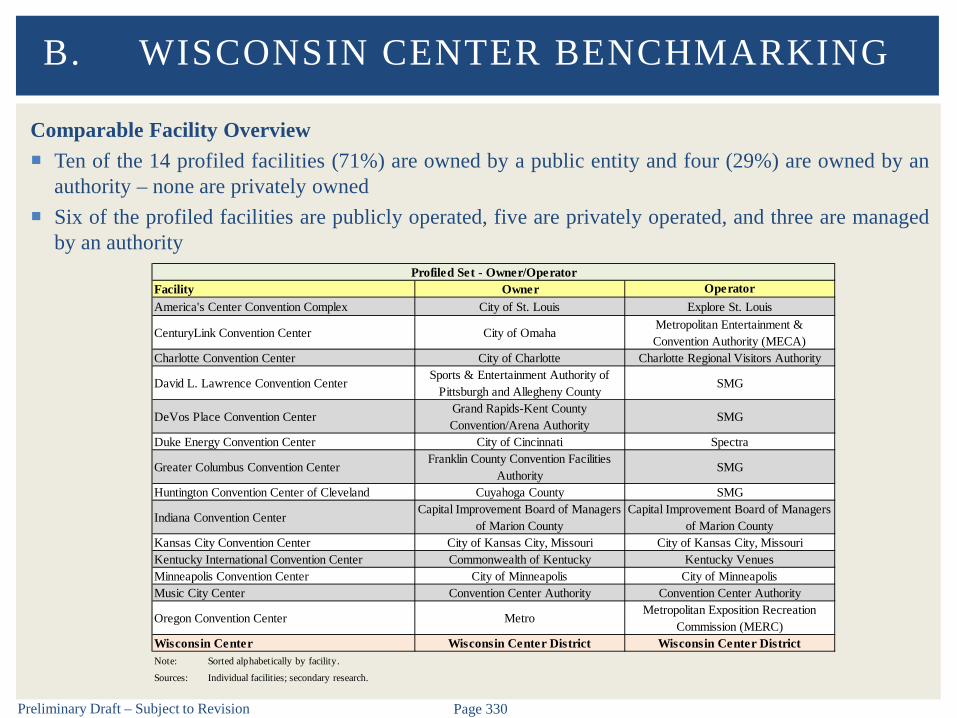
Preliminary Draft – Subject to Revision Page 330
Comparable Facility Overview Ten of the 14 profiled facilities (71%) are owned by a public entity and four (29%) are owned by an
authority – none are privately owned Six of the profiled facilities are publicly operated, five are privately operated, and three are managed
by an authority
B. WISCONSIN CENTER BENCHMARKING
Facility Owner OperatorAmerica's Center Convention Complex City of St. Louis Explore St. Louis
CenturyLink Convention Center City of OmahaMetropolitan Entertainment & Convention Authority (MECA)
Charlotte Convention Center City of Charlotte Charlotte Regional Visitors Authority
David L. Lawrence Convention CenterSports & Entertainment Authority of
Pittsburgh and Allegheny CountySMG
DeVos Place Convention CenterGrand Rapids-Kent County Convention/Arena Authority
SMG
Duke Energy Convention Center City of Cincinnati Spectra
Greater Columbus Convention CenterFranklin County Convention Facilities
AuthoritySMG
Huntington Convention Center of Cleveland Cuyahoga County SMG
Indiana Convention CenterCapital Improvement Board of Managers
of Marion CountyCapital Improvement Board of Managers
of Marion CountyKansas City Convention Center City of Kansas City, Missouri City of Kansas City, MissouriKentucky International Convention Center Commonwealth of Kentucky Kentucky VenuesMinneapolis Convention Center City of Minneapolis City of MinneapolisMusic City Center Convention Center Authority Convention Center Authority
Oregon Convention Center MetroMetropolitan Exposition Recreation
Commission (MERC)Wisconsin Center Wisconsin Center District Wisconsin Center DistrictNote: Sorted alphabetically by facility.
Sources: Individual facilities; secondary research.
Profiled Set - Owner/Operator
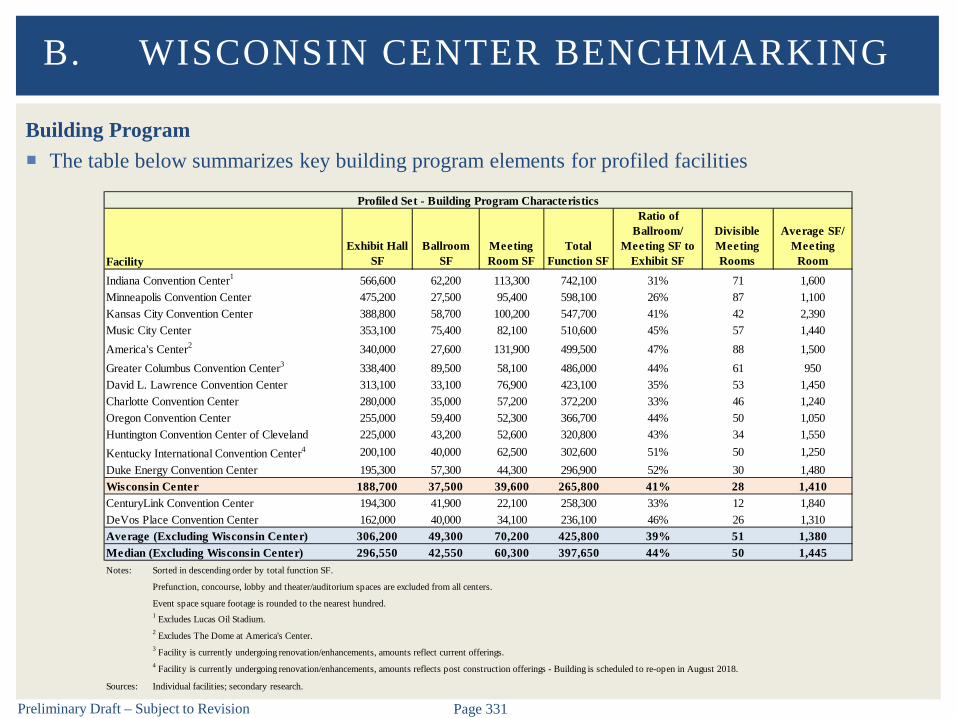
Preliminary Draft – Subject to Revision Page 331
Building Program The table below summarizes key building program elements for profiled facilities
B. WISCONSIN CENTER BENCHMARKING
FacilityExhibit Hall
SFBallroom
SFMeeting Room SF
Total Function SF
Ratio of Ballroom/
Meeting SF to Exhibit SF
Divisible Meeting Rooms
Average SF/ Meeting
Room
Indiana Convention Center1 566,600 62,200 113,300 742,100 31% 71 1,600Minneapolis Convention Center 475,200 27,500 95,400 598,100 26% 87 1,100Kansas City Convention Center 388,800 58,700 100,200 547,700 41% 42 2,390Music City Center 353,100 75,400 82,100 510,600 45% 57 1,440America's Center2 340,000 27,600 131,900 499,500 47% 88 1,500Greater Columbus Convention Center3 338,400 89,500 58,100 486,000 44% 61 950David L. Lawrence Convention Center 313,100 33,100 76,900 423,100 35% 53 1,450Charlotte Convention Center 280,000 35,000 57,200 372,200 33% 46 1,240Oregon Convention Center 255,000 59,400 52,300 366,700 44% 50 1,050Huntington Convention Center of Cleveland 225,000 43,200 52,600 320,800 43% 34 1,550Kentucky International Convention Center4 200,100 40,000 62,500 302,600 51% 50 1,250Duke Energy Convention Center 195,300 57,300 44,300 296,900 52% 30 1,480Wisconsin Center 188,700 37,500 39,600 265,800 41% 28 1,410CenturyLink Convention Center 194,300 41,900 22,100 258,300 33% 12 1,840DeVos Place Convention Center 162,000 40,000 34,100 236,100 46% 26 1,310Average (Excluding Wisconsin Center) 306,200 49,300 70,200 425,800 39% 51 1,380Median (Excluding Wisconsin Center) 296,550 42,550 60,300 397,650 44% 50 1,445Notes: Sorted in descending order by total function SF.
Prefunction, concourse, lobby and theater/auditorium spaces are excluded from all centers.
Event space square footage is rounded to the nearest hundred.1 Excludes Lucas Oil Stadium.2 Excludes The Dome at America's Center.3 Facility is currently undergoing renovation/enhancements, amounts reflect current offerings.4 Facility is currently undergoing renovation/enhancements, amounts reflects post construction offerings - Building is scheduled to re-open in August 2018.
Sources: Individual facilities; secondary research.
Profiled Set - Building Program Characteristics
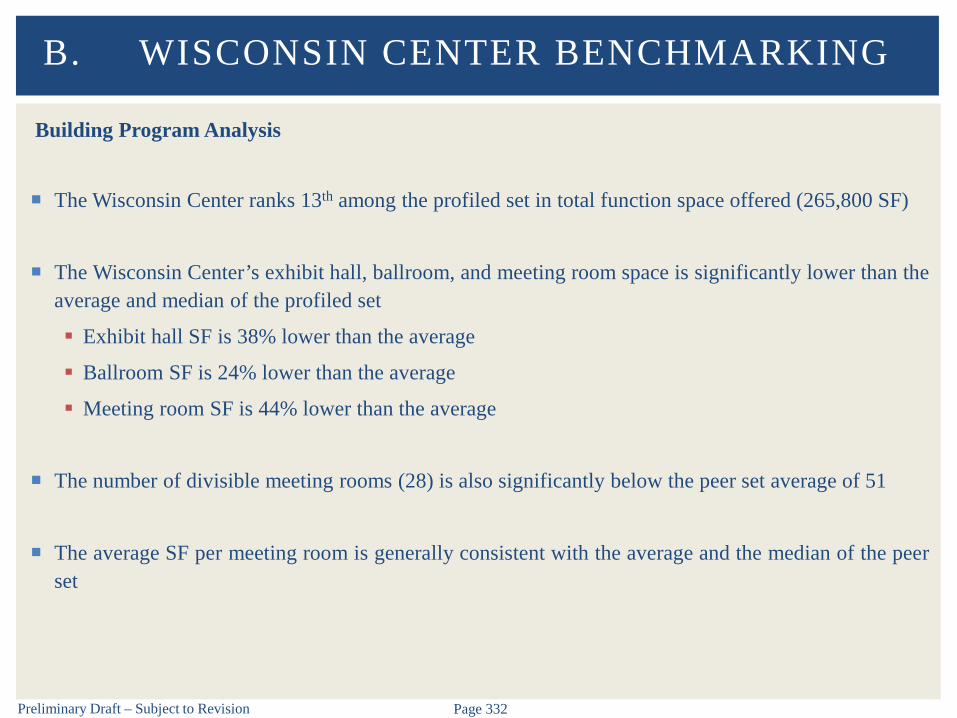
Preliminary Draft – Subject to Revision Page 332
Building Program Analysis
The Wisconsin Center ranks 13th among the profiled set in total function space offered (265,800 SF)
The Wisconsin Center’s exhibit hall, ballroom, and meeting room space is significantly lower than theaverage and median of the profiled set
Exhibit hall SF is 38% lower than the average
Ballroom SF is 24% lower than the average
Meeting room SF is 44% lower than the average
The number of divisible meeting rooms (28) is also significantly below the peer set average of 51
The average SF per meeting room is generally consistent with the average and the median of the peerset
B. WISCONSIN CENTER BENCHMARKING

Preliminary Draft – Subject to Revision Page 333
Building Program Analysis (continued)
The Wisconsin Center’s ratio of ballroom/meeting SF to exhibit hall SF (41%) is generally consistentwith the average and the median of the peer set
Convention centers in the U.S. continue to expand and renovate their facilities and campuses,including several projects among the profiled set
The Greater Columbus Convention Center is investing $125 million to add additional exhibit andmeeting room space, new atrium, outdoor event plaza, and a 800-space structured parking garage
The Kentucky International Convention Center is in the midst of a $180 millionexpansion/enhancements including exhibit and ballroom space and kitchen and meeting roomupgrades
B. WISCONSIN CENTER BENCHMARKING
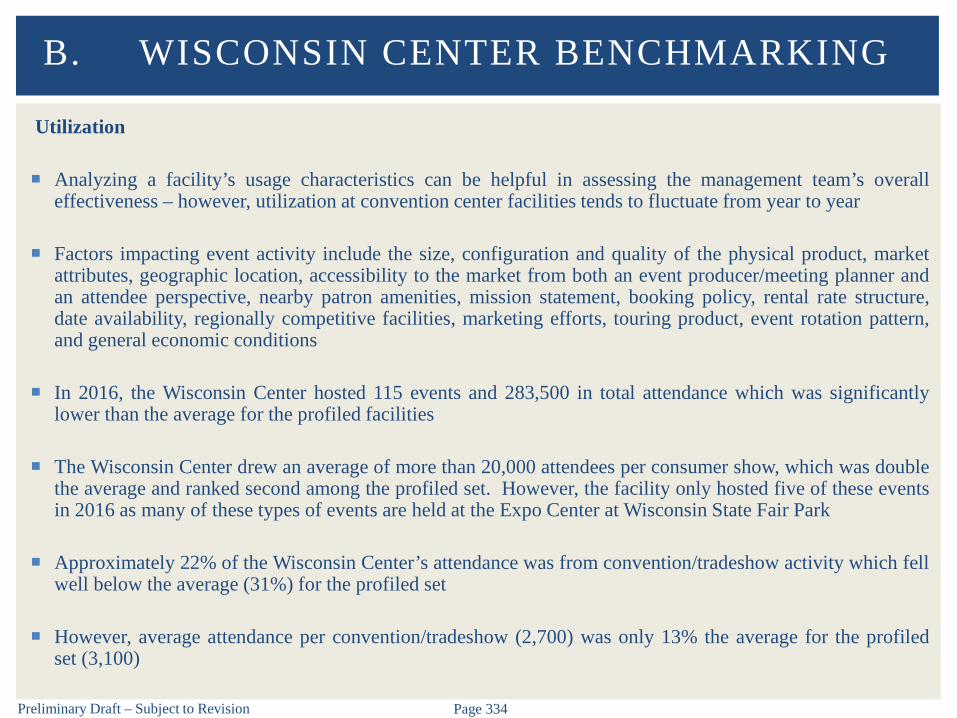
Preliminary Draft – Subject to Revision Page 334
Utilization
Analyzing a facility’s usage characteristics can be helpful in assessing the management team’s overalleffectiveness – however, utilization at convention center facilities tends to fluctuate from year to year
Factors impacting event activity include the size, configuration and quality of the physical product, marketattributes, geographic location, accessibility to the market from both an event producer/meeting planner andan attendee perspective, nearby patron amenities, mission statement, booking policy, rental rate structure,date availability, regionally competitive facilities, marketing efforts, touring product, event rotation pattern,and general economic conditions
In 2016, the Wisconsin Center hosted 115 events and 283,500 in total attendance which was significantlylower than the average for the profiled facilities
The Wisconsin Center drew an average of more than 20,000 attendees per consumer show, which was doublethe average and ranked second among the profiled set. However, the facility only hosted five of these eventsin 2016 as many of these types of events are held at the Expo Center at Wisconsin State Fair Park
Approximately 22% of the Wisconsin Center’s attendance was from convention/tradeshow activity which fellwell below the average (31%) for the profiled set
However, average attendance per convention/tradeshow (2,700) was only 13% the average for the profiledset (3,100)
B. WISCONSIN CENTER BENCHMARKING
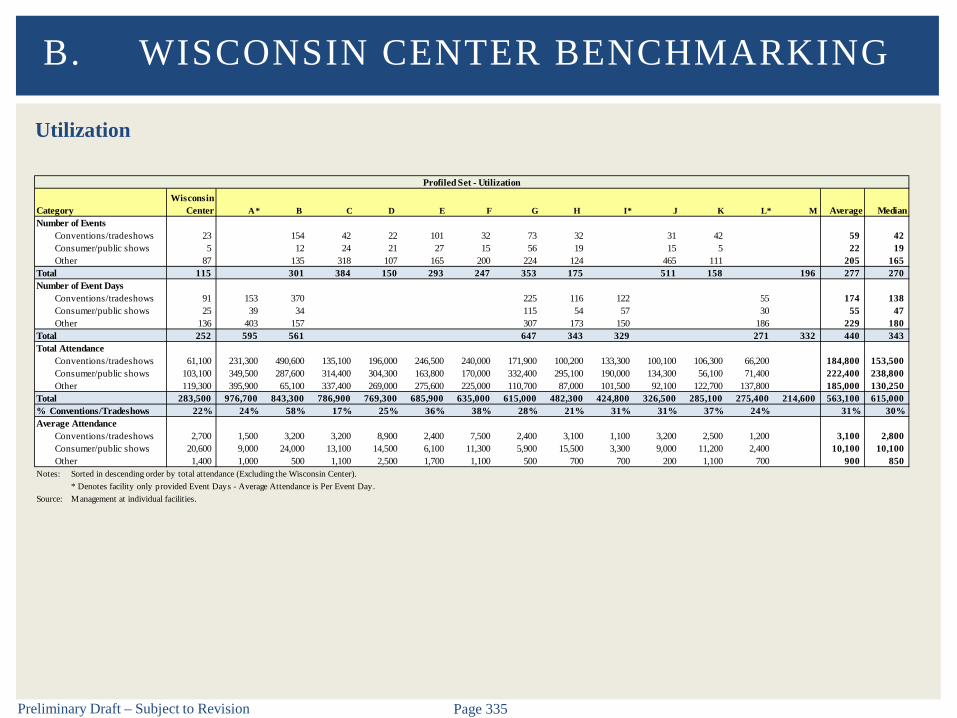
Preliminary Draft – Subject to Revision Page 335
Utilization
B. WISCONSIN CENTER BENCHMARKING
CategoryWisconsin
Center A* B C D E F G H I* J K L* M Average Median Number of Events
Conventions/tradeshows 23 154 42 22 101 32 73 32 31 42 59 42 Consumer/public shows 5 12 24 21 27 15 56 19 15 5 22 19 Other 87 135 318 107 165 200 224 124 465 111 205 165
Total 115 301 384 150 293 247 353 175 511 158 196 277 270 Number of Event Days
Conventions/tradeshows 91 153 370 225 116 122 55 174 138 Consumer/public shows 25 39 34 115 54 57 30 55 47 Other 136 403 157 307 173 150 186 229 180
Total 252 595 561 647 343 329 271 332 440 343 Total Attendance
Conventions/tradeshows 61,100 231,300 490,600 135,100 196,000 246,500 240,000 171,900 100,200 133,300 100,100 106,300 66,200 184,800 153,500 Consumer/public shows 103,100 349,500 287,600 314,400 304,300 163,800 170,000 332,400 295,100 190,000 134,300 56,100 71,400 222,400 238,800 Other 119,300 395,900 65,100 337,400 269,000 275,600 225,000 110,700 87,000 101,500 92,100 122,700 137,800 185,000 130,250
Total 283,500 976,700 843,300 786,900 769,300 685,900 635,000 615,000 482,300 424,800 326,500 285,100 275,400 214,600 563,100 615,000 % Conventions/Tradeshows 22% 24% 58% 17% 25% 36% 38% 28% 21% 31% 31% 37% 24% 31% 30%Average Attendance
Conventions/tradeshows 2,700 1,500 3,200 3,200 8,900 2,400 7,500 2,400 3,100 1,100 3,200 2,500 1,200 3,100 2,800 Consumer/public shows 20,600 9,000 24,000 13,100 14,500 6,100 11,300 5,900 15,500 3,300 9,000 11,200 2,400 10,100 10,100 Other 1,400 1,000 500 1,100 2,500 1,700 1,100 500 700 700 200 1,100 700 900 850
Notes: Sorted in descending order by total attendance (Excluding the Wisconsin Center).* Denotes facility only provided Event Days - Average Attendance is Per Event Day.
Source: Management at individual facilities.
Profiled Set - Utilization
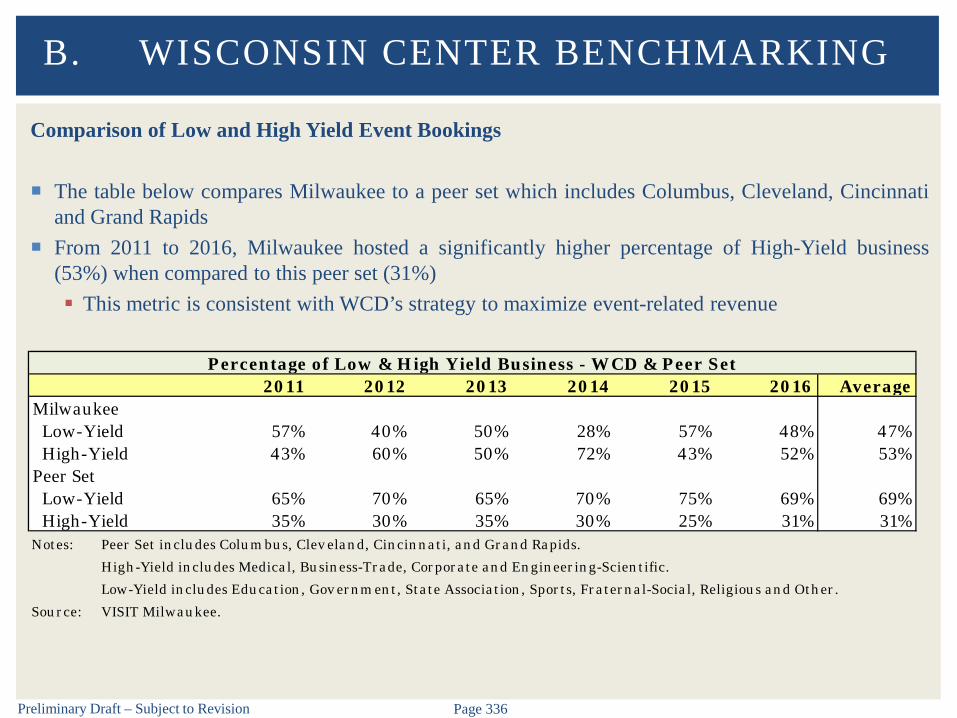
Preliminary Draft – Subject to Revision Page 336
Comparison of Low and High Yield Event Bookings
The table below compares Milwaukee to a peer set which includes Columbus, Cleveland, Cincinnatiand Grand Rapids
From 2011 to 2016, Milwaukee hosted a significantly higher percentage of High-Yield business(53%) when compared to this peer set (31%) This metric is consistent with WCD’s strategy to maximize event-related revenue
B. WISCONSIN CENTER BENCHMARKING
2011 2012 2013 2014 2015 2016 AverageMilwaukee Low-Yield 57% 40% 50% 28% 57% 48% 47% High-Yield 43% 60% 50% 72% 43% 52% 53%Peer Set Low-Yield 65% 70% 65% 70% 75% 69% 69% High-Yield 35% 30% 35% 30% 25% 31% 31%Notes: Peer Set includes Columbus, Clev eland, Cincinnati, and Grand Rapids.
High-Yield includes Medical, Business-Trade, Corporate and Engineering-Scientific.
Low-Yield includes Education, Gov ernment, State Association, Sports, Fraternal-Social, Religious and Other.
Source: VISIT Milwaukee.
Percentage of Low & High Yield Business - WCD & Peer Set
Preliminary Draft – Subject to Revision Page 337
Occupancy
Convention center square footage occupancy is one measure of a facility’s usage and can helpdetermine if a facility is reaching its maximum capacity A convention center’s practical maximum exhibit hall occupancy rate is generally considered to
be approximately 70% based on industry standards Occupancy levels above 60% generally indicate that a facility is beginning to approach full
capacity Occupancy levels less than 50% typically indicate that the facility has available dates to attract
additional business
These industry guidelines reflect that occupancy levels at convention centers are impacted by thetotal number of days that a facility can realistically be sold and/or occupied For instance, events often require move-in/move-out days which can hinder a facility’s ability to
immediately accommodate another incoming event Occupancy is further impacted by the number of days that are required for building maintenance
and upkeep as the facility cannot be sold during this time
B. WISCONSIN CENTER BENCHMARKING

Preliminary Draft – Subject to Revision Page 338
Occupancy
Despite the Wisconsin Center’s 10 point increase in exhibit hall occupancy from 29% in 2015 to39% in in 2016, it ranked last among the profiled set and was 28% below the average for theprofiled set of 54%
B. WISCONSIN CENTER BENCHMARKING
FacilityExhibit Hall Occupancy
A 65%B 59%C 58%D 54%E 48%Wisconsin Center - 2016 39%F 39%Average (Excluding Wisconsin Center) 54%Median (Excluding Wisconsin Center) 56%Note: Sorted in descending order by Exhibit Hall Occupancy.
Source: Individual Facilities.
Profiled Set - Occupancy

Preliminary Draft – Subject to Revision Page 339
Staffing Levels
Salaries and wages typically represent a significantexpense and vary among convention centers basedon permanent full-time staffing plans and otherfactors such as:
Management’s philosophy of maintaining event-related personnel as full-time or part-time staff
Whether the facility is stand-alone or part of acomplex
The extent of contract services are used vs.providing services in-house
The Wisconsin Center currently has 68 full-timeemployees which manage/oversee all of thefacilities
This figure is 35% below the average for theprofiled set
It is difficult to provide a direct comparison ofstaffing levels among facilities for the reasonsnoted above
B. WISCONSIN CENTER BENCHMARKING
Facility Full-Time EmployeesA 166B* 152C 127D* 115E 95F 75Wisconsin Center** 68G 59H 45Average (Excluding Wisconsin Center) 104Median (Excluding Wisconsin Center) 105Notes: Sorted in descending order by Full-Time Employees.
* Staffing levels represent Full-Time Equivalents.
** Staffing levels represent the entire WCD.
Source: Individual Facilities.
Profiled Set - Staffing Levels

Preliminary Draft – Subject to Revision Page 340
Financial Performance
Comparing financial performance at competitive/comparable facilities can offer a general frame ofreference from which to benchmark financial operations of the Wisconsin Center
Most stand-alone convention centers realize an operating deficit
It is important to recognize that facilities vary in their methods of financial reporting and, as such, notall categories or line items are uniformly reported Consequently, for purposes of this analysis, adjustments have been made to the financial
information as reported by the facilities in the profiled set to make the data as consistent aspossible for comparative purposes
For instance, operating revenues do not include any public funding or tax revenue such ashotel/motel collections for any of the profiled facilities
Similarly, facility operating expenses exclude depreciation expense, debt service, large assetpurchases, any expenses related to capital improvements and any effect of taxes
As previously mentioned, tax revenues collected by the WCD are solely dedicated to retiring bonddebt for the original construction of the Wisconsin Center and to the new Bucks Arena This financial model relies on operating revenues streams and, thus, places importance on
maximizing rent, exhibitor services, food and beverage, and parking Cost allocations among facilities is also a consideration
B. WISCONSIN CENTER BENCHMARKING
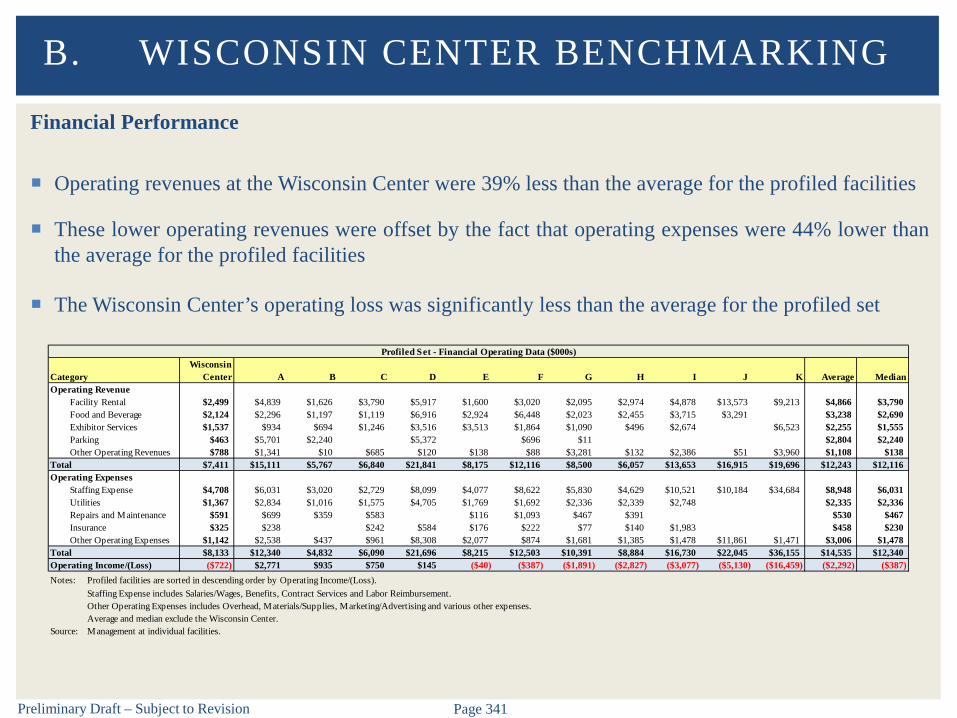
Preliminary Draft – Subject to Revision Page 341
Financial Performance
Operating revenues at the Wisconsin Center were 39% less than the average for the profiled facilities
These lower operating revenues were offset by the fact that operating expenses were 44% lower thanthe average for the profiled facilities
The Wisconsin Center’s operating loss was significantly less than the average for the profiled set
B. WISCONSIN CENTER BENCHMARKING
CategoryWisconsin
Center A B C D E F G H I J K Average Median Operating Revenue
Facility Rental $2,499 $4,839 $1,626 $3,790 $5,917 $1,600 $3,020 $2,095 $2,974 $4,878 $13,573 $9,213 $4,866 $3,790Food and Beverage $2,124 $2,296 $1,197 $1,119 $6,916 $2,924 $6,448 $2,023 $2,455 $3,715 $3,291 $3,238 $2,690Exhibitor Services $1,537 $934 $694 $1,246 $3,516 $3,513 $1,864 $1,090 $496 $2,674 $6,523 $2,255 $1,555Parking $463 $5,701 $2,240 $5,372 $696 $11 $2,804 $2,240Other Operating Revenues $788 $1,341 $10 $685 $120 $138 $88 $3,281 $132 $2,386 $51 $3,960 $1,108 $138
Total $7,411 $15,111 $5,767 $6,840 $21,841 $8,175 $12,116 $8,500 $6,057 $13,653 $16,915 $19,696 $12,243 $12,116Operating Expenses
Staffing Expense $4,708 $6,031 $3,020 $2,729 $8,099 $4,077 $8,622 $5,830 $4,629 $10,521 $10,184 $34,684 $8,948 $6,031Utilities $1,367 $2,834 $1,016 $1,575 $4,705 $1,769 $1,692 $2,336 $2,339 $2,748 $2,335 $2,336Repairs and Maintenance $591 $699 $359 $583 $116 $1,093 $467 $391 $530 $467Insurance $325 $238 $242 $584 $176 $222 $77 $140 $1,983 $458 $230Other Operating Expenses $1,142 $2,538 $437 $961 $8,308 $2,077 $874 $1,681 $1,385 $1,478 $11,861 $1,471 $3,006 $1,478
Total $8,133 $12,340 $4,832 $6,090 $21,696 $8,215 $12,503 $10,391 $8,884 $16,730 $22,045 $36,155 $14,535 $12,340Operating Income/(Loss) ($722) $2,771 $935 $750 $145 ($40) ($387) ($1,891) ($2,827) ($3,077) ($5,130) ($16,459) ($2,292) ($387)Notes: Profiled facilities are sorted in descending order by Operating Income/(Loss).
Staffing Expense includes Salaries/Wages, Benefits, Contract Services and Labor Reimbursement.Other Operating Expenses includes Overhead, Materials/Supplies, Marketing/Advertising and various other expenses.Average and median exclude the Wisconsin Center.
Source: Management at individual facilities.
Profiled Set - Financial Operating Data ($000s)

Preliminary Draft – Subject to Revision Page 342
Financial Performance
Operating revenues at the Wisconsin Center were 39% less than the average for the profiled facilities– offset by the fact that operating expenses were 44% lower than the average for the profiled facilities
The Wisconsin Center’s operating loss was significantly less than the average for the profiled set
B. WISCONSIN CENTER BENCHMARKING
($16,459)
($5,130)
($3,077)($2,827)($1,891)
($387) ($40)
$145 $750 $935
$2,771
($2,292)
($722)
($20,000)
($15,000)
($10,000)
($5,000)
$0
$5,000
A B C D E F G H I J K Average Wisc.Center
Operating Income (Loss)($000s)
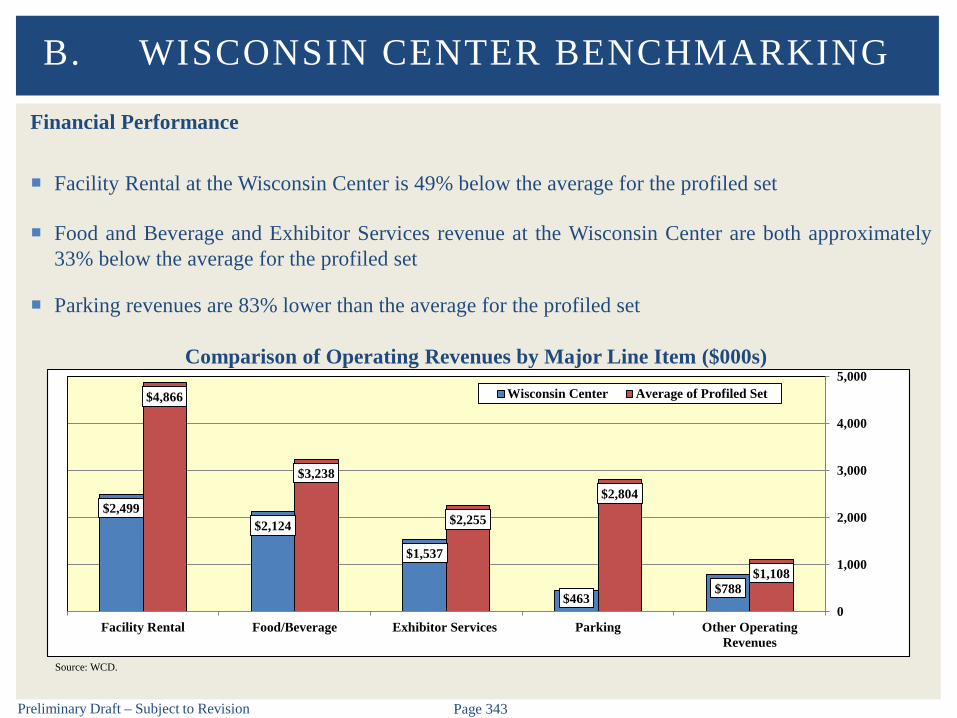
Preliminary Draft – Subject to Revision Page 343
Financial Performance
Facility Rental at the Wisconsin Center is 49% below the average for the profiled set
Food and Beverage and Exhibitor Services revenue at the Wisconsin Center are both approximately33% below the average for the profiled set
Parking revenues are 83% lower than the average for the profiled set
B. WISCONSIN CENTER BENCHMARKING
$2,499$2,124
$1,537
$463$788
$4,866
$3,238
$2,255
$2,804
$1,108
Facility Rental Food/Beverage Exhibitor Services Parking Other OperatingRevenues
0
1,000
2,000
3,000
4,000
5,000Wisconsin Center Average of Profiled Set
Comparison of Operating Revenues by Major Line Item ($000s)
Source: WCD.
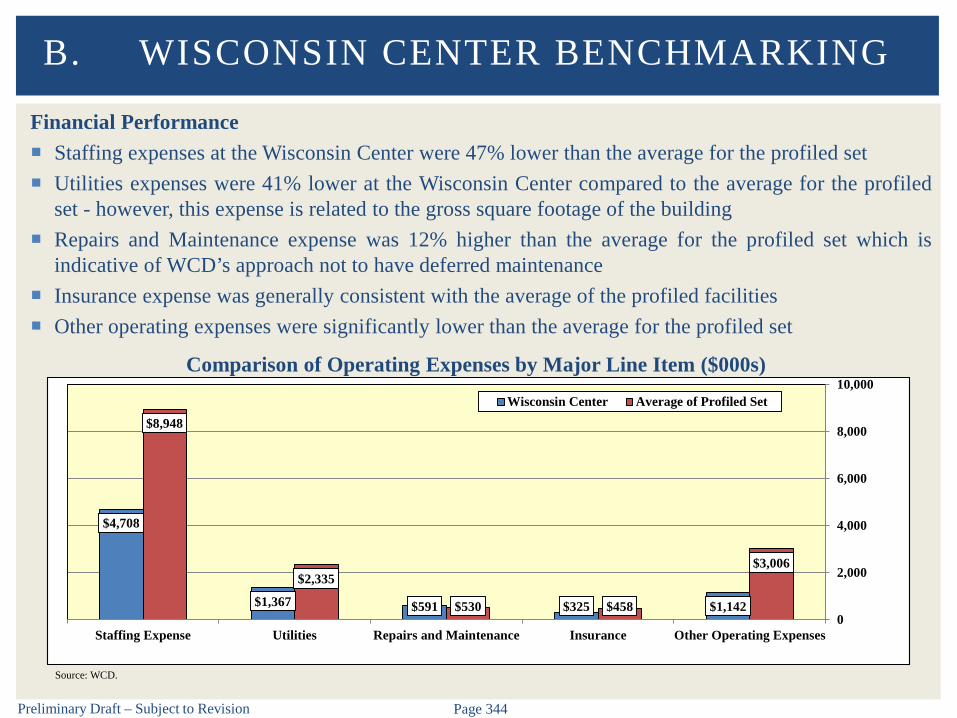
Preliminary Draft – Subject to Revision Page 344
Financial Performance Staffing expenses at the Wisconsin Center were 47% lower than the average for the profiled set Utilities expenses were 41% lower at the Wisconsin Center compared to the average for the profiled
set - however, this expense is related to the gross square footage of the building Repairs and Maintenance expense was 12% higher than the average for the profiled set which is
indicative of WCD’s approach not to have deferred maintenance Insurance expense was generally consistent with the average of the profiled facilities Other operating expenses were significantly lower than the average for the profiled set
B. WISCONSIN CENTER BENCHMARKING
$4,708
$1,367 $591 $325 $1,142
$8,948
$2,335
$530 $458
$3,006
Staffing Expense Utilities Repairs and Maintenance Insurance Other Operating Expenses0
2,000
4,000
6,000
8,000
10,000Wisconsin Center Average of Profiled Set
Comparison of Operating Expenses by Major Line Item ($000s)
Source: WCD.

Preliminary Draft – Subject to Revision Page 345
Financial Performance
Irrespective of the total operating revenues, the Wisconsin Center’s distribution is similar to theaverage of the profiled set for facility rental and food/beverage line items
The Wisconsin Center realized a higher percentage of total revenue from exhibitor services and alower percentage from parking revenue relative of the profiled facilities
B. WISCONSIN CENTER BENCHMARKING
Distribution of Operating Revenues by Major Line Item
Source: WCD.
34%
29%
21%
6%
11%
39%
26%
17%
10% 9%
Facility Rental Food/Beverage Exhibitor Services Parking Other0%
10%
20%
30%
40%Wisconsin Center Average of Profiled Set

Preliminary Draft – Subject to Revision Page 346
Financial Performance
The Wisconsin Center’s distribution of operating expenses is similar to the average for the profiledset, with a higher percentage of expenses spent on repairs/maintenance
The higher percentage spent on repairs/maintenance is indicative of the WCD’s commitment to useoperating income to cover repairs and maintenance as opposed to carrying deferred maintenance
B. WISCONSIN CENTER BENCHMARKING
Distribution of Operating Expenses by Major Line Item
Source: WCD.
58%
17%
7% 4%
14%
57%
17%
4% 3%
20%
Staffing Expense Utilities Repairs and Maintenance Insurance Other Operating Expenses0%
10%
20%
30%
40%
50%
60%Wisconsin Center Average of Profiled Set

Preliminary Draft – Subject to Revision Page 347
Financial Performance
Ratios help mitigate differences among facilities for comparative purposes The Wisconsin Center’s ratio of operating revenues per exhibit space SF ($39) was 9% lower than the
average of profiled facilities ($43) Similarly, its ratio of operating expenses per exhibit space SF ($43) was 10% less than the average for
the profiled facilities ($48) In 2016, the Wisconsin Center’s operating loss per exhibit space SF was $4, which ranked 7th among
the profiled facilities Profiled facilities averaged a net operating loss of $6 per exhibit space SF
B. WISCONSIN CENTER BENCHMARKING
WC - 2016 Low Average Median High Operating Revenue
Facility Rental $13 $8 $17 $14 $53Food and Beverage $11 $6 $12 $10 $23Exhibitor Services $8 $2 $8 $7 $18Parking $2 $0 $9 $11 $17Other $4 $0 $4 $1 $15
Total $39 $19 $43 $42 $66Operating Expenses
Staffing Expense $25 $15 $28 $23 $73Utilities $7 $5 $9 $8 $13Repairs and Maintenance $3 $1 $2 $2 $4Insurance $2 $0 $2 $1 $6Other Operating Expenses $6 $2 $11 $6 $47
Total $43 $24 $48 $45 $86Operating Income (Loss) ($4) ($35) ($6) ($1) $8
Profiled Set - Comparison of Financial Ratios Per Exhibit Space SF
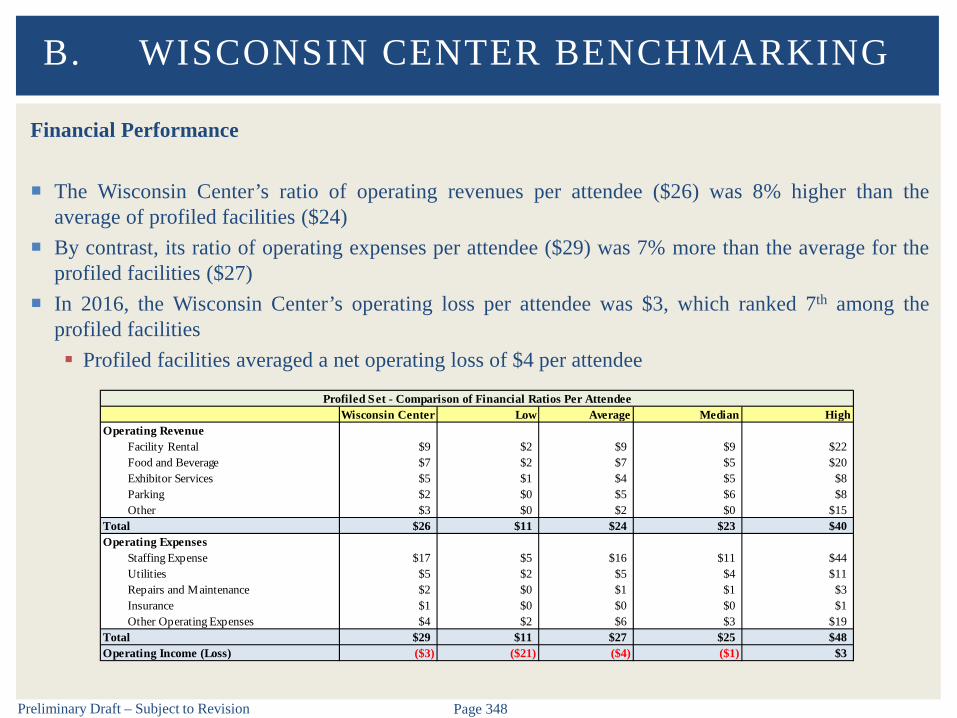
Preliminary Draft – Subject to Revision Page 348
Financial Performance
The Wisconsin Center’s ratio of operating revenues per attendee ($26) was 8% higher than theaverage of profiled facilities ($24)
By contrast, its ratio of operating expenses per attendee ($29) was 7% more than the average for theprofiled facilities ($27)
In 2016, the Wisconsin Center’s operating loss per attendee was $3, which ranked 7th among theprofiled facilities Profiled facilities averaged a net operating loss of $4 per attendee
B. WISCONSIN CENTER BENCHMARKING
Wisconsin Center Low Average Median High Operating Revenue
Facility Rental $9 $2 $9 $9 $22Food and Beverage $7 $2 $7 $5 $20Exhibitor Services $5 $1 $4 $5 $8Parking $2 $0 $5 $6 $8Other $3 $0 $2 $0 $15
Total $26 $11 $24 $23 $40Operating Expenses
Staffing Expense $17 $5 $16 $11 $44Utilities $5 $2 $5 $4 $11Repairs and Maintenance $2 $0 $1 $1 $3Insurance $1 $0 $0 $0 $1Other Operating Expenses $4 $2 $6 $3 $19
Total $29 $11 $27 $25 $48Operating Income (Loss) ($3) ($21) ($4) ($1) $3
Profiled Set - Comparison of Financial Ratios Per Attendee

Preliminary Draft – Subject to Revision Page 349
Destination Attributes
As the exhibition/meeting industry has undergone a supply boom and a demand slump in recentyears, and, as such, planners are increasingly booking venues with better overall destinationpackages (e.g., accessibility, proximate hotel rooms, nearby entertainment/restaurants, safe/securesurroundings, etc.) to support their events
In addition, the resulting buyer’s market has planners considering the overall price of hosting theirevent in a particular city including facility, lodging, food and transportation costs
The following factors are used by meeting planners to gauge the relative competitiveness ofdestinations under consideration to host their events:
Travel Costs for Lodging, Meals, and Rental Cars Hotel Supply Proximate to the Convention Center Total Tax on Hotel Rooms Air Accessibility
B. WISCONSIN CENTER BENCHMARKING
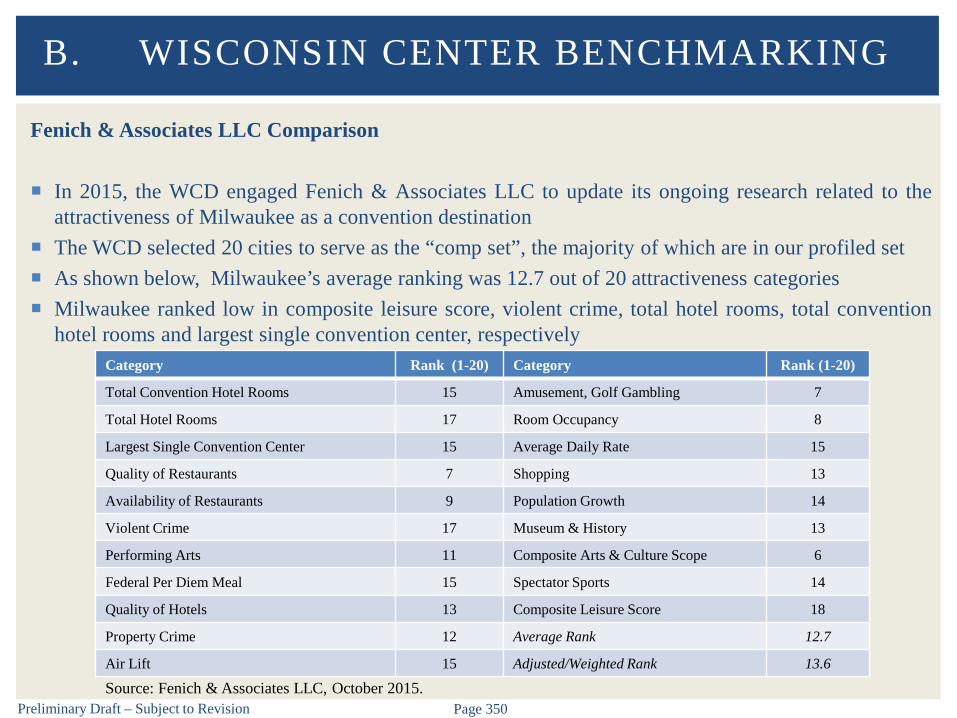
Preliminary Draft – Subject to Revision Page 350
Fenich & Associates LLC Comparison
In 2015, the WCD engaged Fenich & Associates LLC to update its ongoing research related to theattractiveness of Milwaukee as a convention destination
The WCD selected 20 cities to serve as the “comp set”, the majority of which are in our profiled set As shown below, Milwaukee’s average ranking was 12.7 out of 20 attractiveness categories Milwaukee ranked low in composite leisure score, violent crime, total hotel rooms, total convention
hotel rooms and largest single convention center, respectively
B. WISCONSIN CENTER BENCHMARKING
Category Rank (1-20) Category Rank (1-20)
Total Convention Hotel Rooms 15 Amusement, Golf Gambling 7
Total Hotel Rooms 17 Room Occupancy 8
Largest Single Convention Center 15 Average Daily Rate 15
Quality of Restaurants 7 Shopping 13
Availability of Restaurants 9 Population Growth 14
Violent Crime 17 Museum & History 13
Performing Arts 11 Composite Arts & Culture Scope 6
Federal Per Diem Meal 15 Spectator Sports 14
Quality of Hotels 13 Composite Leisure Score 18
Property Crime 12 Average Rank 12.7
Air Lift 15 Adjusted/Weighted Rank 13.6
Source: Fenich & Associates LLC, October 2015.
Preliminary Draft – Subject to Revision Page 351
Per Diem Spending
Business Travel News publishes an annual corporate travel index ranking 100 U.S. cities in terms ofvarious travel-related costs, including lodging, car rental and food
Costs external to the convention center are important to meeting planners when assessing the overallcost of destinations
Milwaukee’s total per diem spending ($311) ranks 9th among the profiled destinations and is lowerthan the average ($322)
Total per diem spending amounts are higher in both Minneapolis and St. Louis, two of Milwaukee’sbiggest competitors, providing a competitive advantage to Milwaukee
As a point of reference, Milwaukee’s per diem spending for hotels ($161) ranks 13th among theprofiled destinations and is lower then the average ($176) which may serve as a competitiveadvantage to some groups
B. WISCONSIN CENTER BENCHMARKING

Preliminary Draft – Subject to Revision Page 352
Per Diem Spending
B. WISCONSIN CENTER BENCHMARKING
Source: Business Travel News 2016 Corporate Travel Index.
$296
$298
$303
$303
$306
$307
$311
$312
$314
$316
$319
$322
$329
$330
$345
$364
$373
$200 $250 $300 $350 $400
Omaha, NEIndianapolis, IN
Kansas City, MOLouisville, KY
Grand Rapids, MIColumbus, OHMilwaukee, WICincinnati, OH
Median (Excluding Milwaukee)Cleveland, OHSt. Louis, MO
Average (Excluding Milwaukee)Charlotte, NC
Pittsburgh, PANashville, TNPortland, OR
Minneapolis, MN
Profiled Set - Total Per Diem Spending
Preliminary Draft – Subject to Revision Page 353
Hotel Supply
The hotel industry is expected to experience 1.7% growth in the number of properties annually from2017 to 2021
The supply of new rooms coming on line is projected to provide some rate relief for show organizerschallenged with budget constraints
New projects currently in the works as reported by Smith Travel Research include upscale andupper mid-scale hotels often utilized by show organizers and convention attendees
These projects are also being linked with convention facilities, following the trend toward campus-style facilities that include destination amenities with an area easily accessible from theconvention centers
Some of the projects will be attached to the convention centers themselves, while others will bewithin a short walk
B. WISCONSIN CENTER BENCHMARKING
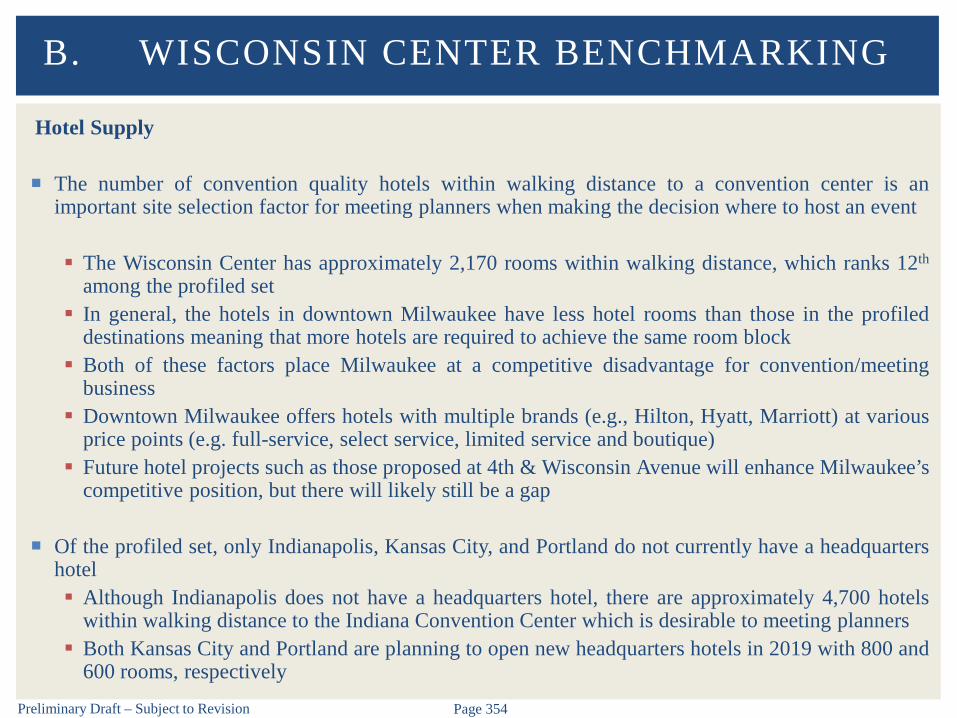
Preliminary Draft – Subject to Revision Page 354
Hotel Supply
The number of convention quality hotels within walking distance to a convention center is animportant site selection factor for meeting planners when making the decision where to host an event
The Wisconsin Center has approximately 2,170 rooms within walking distance, which ranks 12th
among the profiled set In general, the hotels in downtown Milwaukee have less hotel rooms than those in the profiled
destinations meaning that more hotels are required to achieve the same room block Both of these factors place Milwaukee at a competitive disadvantage for convention/meeting
business Downtown Milwaukee offers hotels with multiple brands (e.g., Hilton, Hyatt, Marriott) at various
price points (e.g. full-service, select service, limited service and boutique) Future hotel projects such as those proposed at 4th & Wisconsin Avenue will enhance Milwaukee’s
competitive position, but there will likely still be a gap
Of the profiled set, only Indianapolis, Kansas City, and Portland do not currently have a headquartershotel Although Indianapolis does not have a headquarters hotel, there are approximately 4,700 hotels
within walking distance to the Indiana Convention Center which is desirable to meeting planners Both Kansas City and Portland are planning to open new headquarters hotels in 2019 with 800 and
600 rooms, respectively
B. WISCONSIN CENTER BENCHMARKING
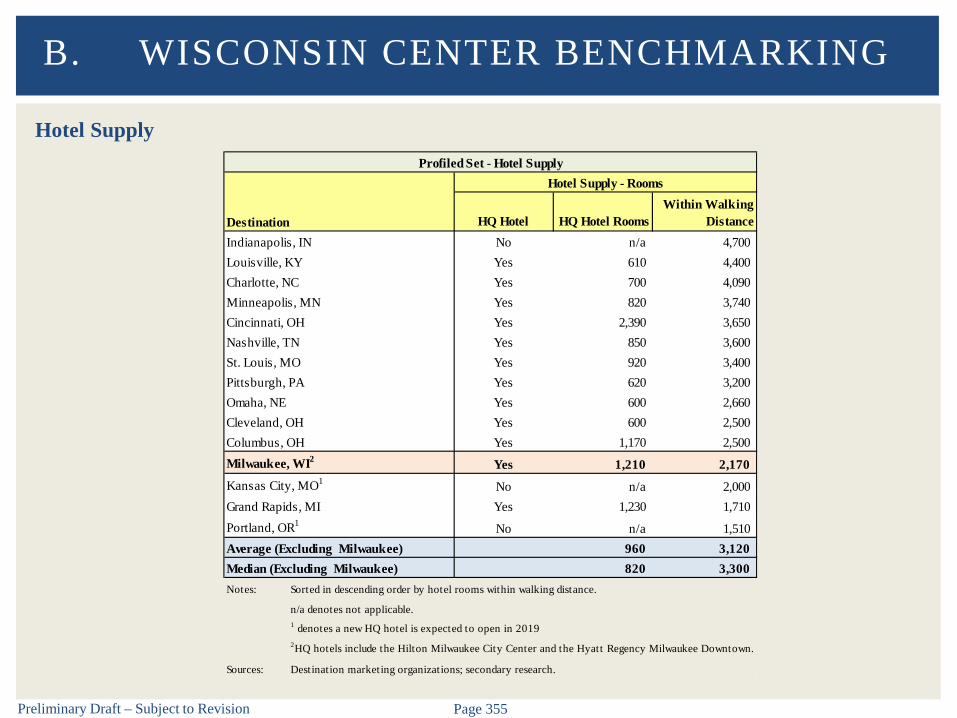
Preliminary Draft – Subject to Revision Page 355
Hotel Supply
B. WISCONSIN CENTER BENCHMARKING
Destination HQ Hotel HQ Hotel Rooms Within Walking
Distance Indianapolis, IN No n/a 4,700 Louisville, KY Yes 610 4,400 Charlotte, NC Yes 700 4,090 Minneapolis, MN Yes 820 3,740 Cincinnati, OH Yes 2,390 3,650 Nashville, TN Yes 850 3,600 St. Louis, MO Yes 920 3,400 Pittsburgh, PA Yes 620 3,200 Omaha, NE Yes 600 2,660 Cleveland, OH Yes 600 2,500 Columbus, OH Yes 1,170 2,500 Milwaukee, WI2 Yes 1,210 2,170 Kansas City, MO1 No n/a 2,000 Grand Rapids, MI Yes 1,230 1,710 Portland, OR1 No n/a 1,510 Average (Excluding Milwaukee) 960 3,120 Median (Excluding Milwaukee) 820 3,300 Notes: Sorted in descending order by hotel rooms within walking distance.
n/a denotes not applicable.1 denotes a new HQ hotel is expected to open in 20192HQ hotels include the Hilton Milwaukee City Center and the Hyatt Regency Milwaukee Downtown.
Sources: Destination marketing organizations; secondary research.
Profiled Set - Hotel SupplyHotel Supply - Rooms

Preliminary Draft – Subject to Revision Page 356
Hotel Cost – Total Tax on Hotel Rooms
Meeting planners rank affordability of the destination high when choosing facilities to host theirevents
The total tax rate on hotels in Milwaukee is 15.10% which ranks lower than both the average(15.43%) and median (15.89%) for the profiled set making Milwaukee competitive from a meetingplanner perspective
B. WISCONSIN CENTER BENCHMARKING
Notes: Total lodging tax rates include State, County, City and Special Districts Taxes.**hotel rooms at hotels with more than 50 rooms in the City may be assessed an additional 2% tax.***hotel rooms in special districts may be assessed an additional 1% Community Improvement Tax and/or a 1% Transpiration Development Tax.^hotel rooms will be assessed an additional $2.50 excise tax per room night.^^hotel rooms will be assessed an additional $1.73 Kansas City Development Fee per room night.
Sources: Individual DMOs; secondary research.
11.00%
13.30%
13.40%
14.00%
15.10%
15.25%
15.25%
15.43%
15.85%
15.89%
15.93%
16.07%
16.50%
17.00%
17.50%
17.50%
17.50%
0% 5% 10% 15% 20%
Grand Rapids, MIPortland, OR**
Minneapolis, MNPittsburgh, PA
Milwaukee, WICharlotte, NC
Nashville, TN^Average (Excluding Milwaukee)
Kansas City, MO^^Median (Excluding Milwaukee)
St. Louis, MO***Louisville, KYCleveland, OH
Indianapolis, INColumbus, OHCincinnati, OH
Omaha, NE
Profiled Set - Total Tax on Hotel Rooms

Preliminary Draft – Subject to Revision Page 357
Air Accessibility
Milwaukee ranks 11th in terms of the number of enplanements and has less direct flights than most ofthe profiled facilities which can be a disadvantage for many meeting planners and attendees
B. WISCONSIN CENTER BENCHMARKING
1,281
1,640
2,046
3,037
3,230
3,313
3,890
3,891
3,904
3,917
5,135
5,709
6,239
6,285
8,340
17,634
21,913
0 5,000 10,000 15,000 20,000 25,000
Grand Rapids, MI
Louisville, KY
Omaha, NE
Cincinnati, OH
Milwaukee, WI
Columbus, OH
Indianapolis, IN
Pittsburgh, PA
Median (Excluding Milwaukee)
Cleveland, OH
Kansas City, MO
Nashville, TN
St. Louis, MO
Average (Excluding Milwaukee)
Portland, OR
Minneapolis, MN
Charlotte, NC
Note: Figures represent passenger enplanements for the most proximate major airport.Source: Federal Aviation Administration.
Profiled Set - Passenger Enplanements in 2015 (000s)
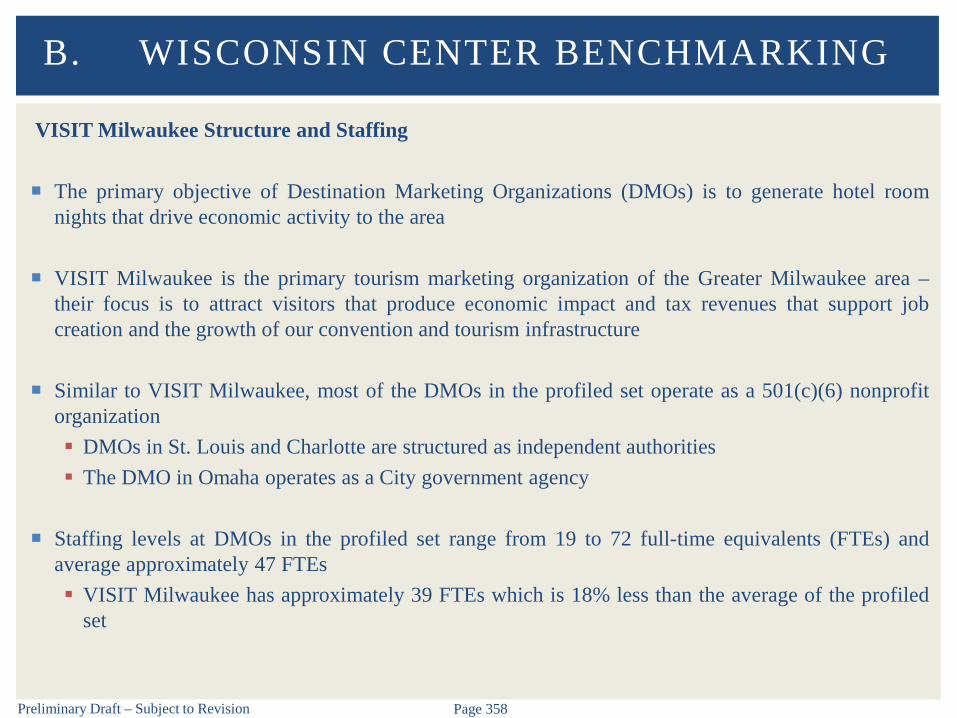
Preliminary Draft – Subject to Revision Page 358
VISIT Milwaukee Structure and Staffing
The primary objective of Destination Marketing Organizations (DMOs) is to generate hotel roomnights that drive economic activity to the area
VISIT Milwaukee is the primary tourism marketing organization of the Greater Milwaukee area –their focus is to attract visitors that produce economic impact and tax revenues that support jobcreation and the growth of our convention and tourism infrastructure
Similar to VISIT Milwaukee, most of the DMOs in the profiled set operate as a 501(c)(6) nonprofitorganization DMOs in St. Louis and Charlotte are structured as independent authorities The DMO in Omaha operates as a City government agency
Staffing levels at DMOs in the profiled set range from 19 to 72 full-time equivalents (FTEs) andaverage approximately 47 FTEs VISIT Milwaukee has approximately 39 FTEs which is 18% less than the average of the profiled
set
B. WISCONSIN CENTER BENCHMARKING

Preliminary Draft – Subject to Revision Page 359
VISIT Milwaukee Budget
DMO budgets are based on a variety factorsincluding roles and responsibilities For instance, the DMO in St. Louis also
operates it convention center
VISIT Milwaukee’s budget is approximately$8.2 million which is consistent with those inCincinnati and Grand Rapids, but less than theaverage of the profiled set
Regardless of the organizational structure orbudget size, the majority of DMO funding isderived from public sources and primarily fromhotel room tax VISIT Milwaukee received approximately
85% of its funding through public sourceswhich is consistent with the median (83%)of the profiled set
B. WISCONSIN CENTER BENCHMARKING
Location FY 2015 BudgetSt. Louis, MO* $39.9 Nashville, TN $28.1 Portland, OR $18.5 Louisville, KY $16.0 Charlotte, NC $14.8 Columbus, OH $14.8 Indianapolis, IN $13.6 Minneapolis, MN $11.8 Pittsburgh, PA $11.0 Kansas City, MO $10.5 Cincinnati, OH $8.4 Milwaukee, WI $8.2 Grand Rapids, MI $7.9 Omaha, NE $5.3 Cleveland, OH n/sAverage (Excluding Milwaukee) $15.4 Median (Excluding Milwaukee) $13.6 Average (Excluding Milwaukee & St. Louis) $13.4 Median (Excluding Milwaukee & St. Louis) $12.7 Notes: Sorted in descending order by FY 201 5 Budget.
n/s denotes data not supplied.
* Budget includes conv ention center operations.
Sources: DMAI; secondary research.
Profiled Set - DMO Total Funding ($000s)
C. UWM PANTHER ARENA
BENCHMARKING
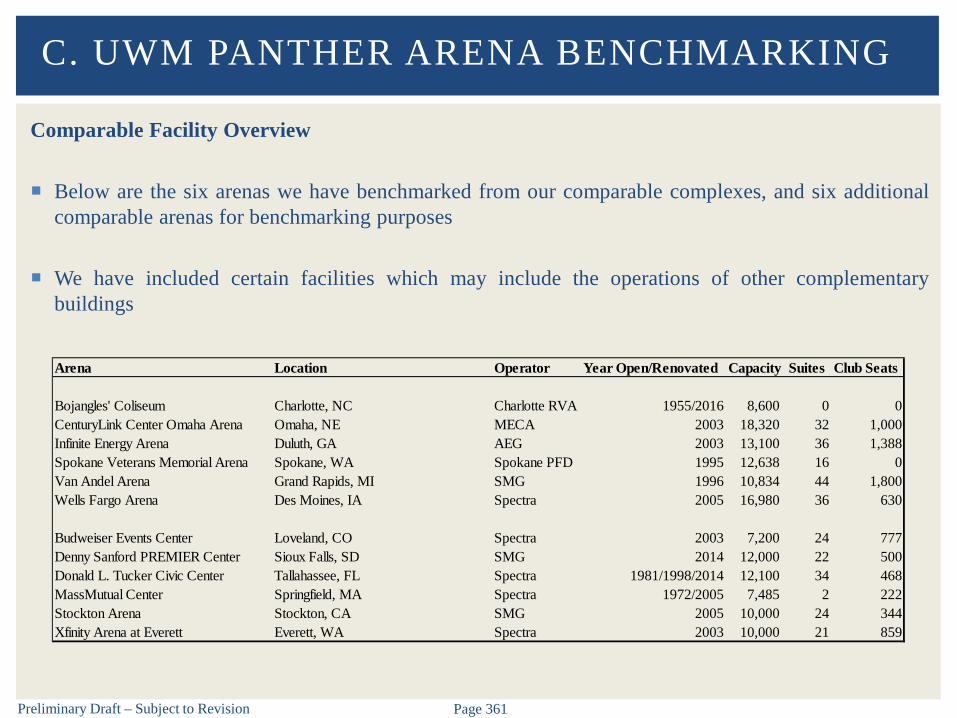
Preliminary Draft – Subject to Revision Page 361
Comparable Facility Overview
Below are the six arenas we have benchmarked from our comparable complexes, and six additionalcomparable arenas for benchmarking purposes
We have included certain facilities which may include the operations of other complementarybuildings
C. UWM PANTHER ARENA BENCHMARKING
Arena Location Operator Year Open/Renovated Capacity Suites Club Seats
Bojangles' Coliseum Charlotte, NC Charlotte RVA 1955/2016 8,600 0 0CenturyLink Center Omaha Arena Omaha, NE MECA 2003 18,320 32 1,000Infinite Energy Arena Duluth, GA AEG 2003 13,100 36 1,388Spokane Veterans Memorial Arena Spokane, WA Spokane PFD 1995 12,638 16 0Van Andel Arena Grand Rapids, MI SMG 1996 10,834 44 1,800Wells Fargo Arena Des Moines, IA Spectra 2005 16,980 36 630
Budweiser Events Center Loveland, CO Spectra 2003 7,200 24 777Denny Sanford PREMIER Center Sioux Falls, SD SMG 2014 12,000 22 500Donald L. Tucker Civic Center Tallahassee, FL Spectra 1981/1998/2014 12,100 34 468MassMutual Center Springfield, MA Spectra 1972/2005 7,485 2 222Stockton Arena Stockton, CA SMG 2005 10,000 24 344Xfinity Arena at Everett Everett, WA Spectra 2003 10,000 21 859

Preliminary Draft – Subject to Revision Page 362
Event Mix
Number of events per comparable vary significantly due to a variety of factors including: tenant mix;market competition; age; amenities; etc.
Number of events ranged from a low of 78 to a high of 310 with an average number of events ofapproximately 160. UW-Milwaukee Panther Arena is 14% below the comparable arena average. 2016includes 12 Admirals games (normal year would include approximately 26 additional games)
C. UWM PANTHER ARENA BENCHMARKING
78 82100
115125
145 154 160
186
302 310
160138
0
100
200
300
400
Arena 1 Arena 2 Arena 3 Arena 4 Arena 5 Arena 6 Arena 7 Arena 8 Arena 9 Arena 10 Arena 11 Average UWMPantherArena
Number of Events
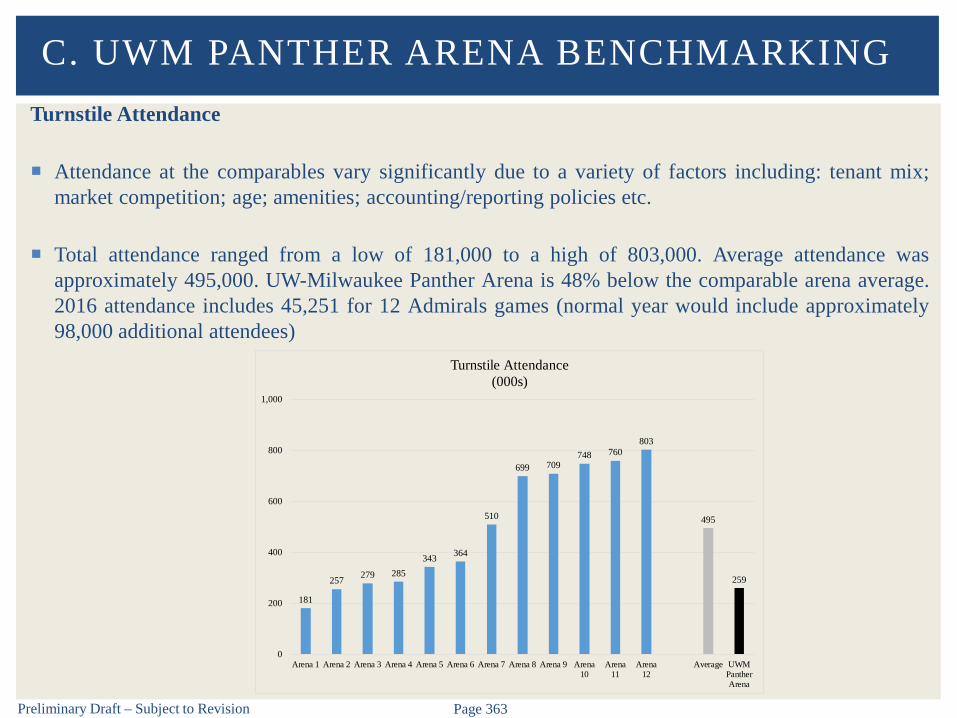
Preliminary Draft – Subject to Revision Page 363
Turnstile Attendance
Attendance at the comparables vary significantly due to a variety of factors including: tenant mix;market competition; age; amenities; accounting/reporting policies etc.
Total attendance ranged from a low of 181,000 to a high of 803,000. Average attendance wasapproximately 495,000. UW-Milwaukee Panther Arena is 48% below the comparable arena average.2016 attendance includes 45,251 for 12 Admirals games (normal year would include approximately98,000 additional attendees)
C. UWM PANTHER ARENA BENCHMARKING
181
257 279 285343 364
510
699 709748 760
803
495
259
0
200
400
600
800
1,000
Arena 1 Arena 2 Arena 3 Arena 4 Arena 5 Arena 6 Arena 7 Arena 8 Arena 9 Arena10
Arena11
Arena12
Average UWMPantherArena
Turnstile Attendance(000s)
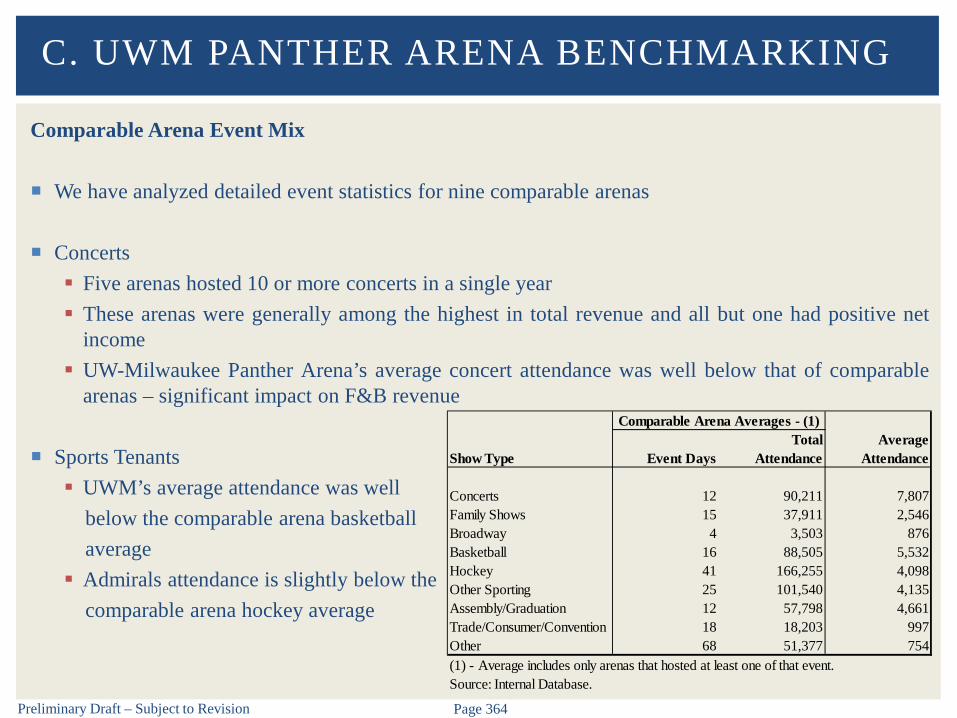
Preliminary Draft – Subject to Revision Page 364
Comparable Arena Event Mix
We have analyzed detailed event statistics for nine comparable arenas
Concerts Five arenas hosted 10 or more concerts in a single year These arenas were generally among the highest in total revenue and all but one had positive net
income UW-Milwaukee Panther Arena’s average concert attendance was well below that of comparable
arenas – significant impact on F&B revenue
Sports Tenants UWM’s average attendance was well
below the comparable arena basketballaverage
Admirals attendance is slightly below thecomparable arena hockey average
C. UWM PANTHER ARENA BENCHMARKING
Show Type Event DaysTotal
AttendanceAverage
Attendance
Concerts 12 90,211 7,807Family Shows 15 37,911 2,546Broadway 4 3,503 876Basketball 16 88,505 5,532Hockey 41 166,255 4,098Other Sporting 25 101,540 4,135Assembly/Graduation 12 57,798 4,661Trade/Consumer/Convention 18 18,203 997Other 68 51,377 754(1) - Average includes only arenas that hosted at least one of that event.Source: Internal Database.
Comparable Arena Averages - (1)

Preliminary Draft – Subject to Revision Page 365
Rental Revenues
Rental revenues are generally determined by a percentage of ticket sales, flat use fees (annual or one-time), or other methods
Rental rates among comparables may vary significantly depending on a number of factors including:methodology of calculations; age and design of facility; and team/event performance
The rental rate varies dramatically from promoter to promoter and show to show
C. UWM PANTHER ARENA BENCHMARKING

Preliminary Draft – Subject to Revision Page 366
Rental Revenues
Rental revenue (before service income and service expense) ranged from a low of $279,000 to a highof $2.2 million. Average rental revenue was approximately $1.0 million. UW-Milwaukee PantherArena is 45% below the comparable arena average.
C. UWM PANTHER ARENA BENCHMARKING
$279 $415
$649 $658 $681 $818
$919
$1,097 $1,231
$1,307
$2,097 $2,216
$1,030
$572
$0
$500
$1,000
$1,500
$2,000
$2,500
Arena 1 Arena 2 Arena 3 Arena 4 Arena 5 Arena 6 Arena 7 Arena 8 Arena 9 Arena10
Arena11
Arena12
Average UWMPantherArena
Facility Rent($000s)
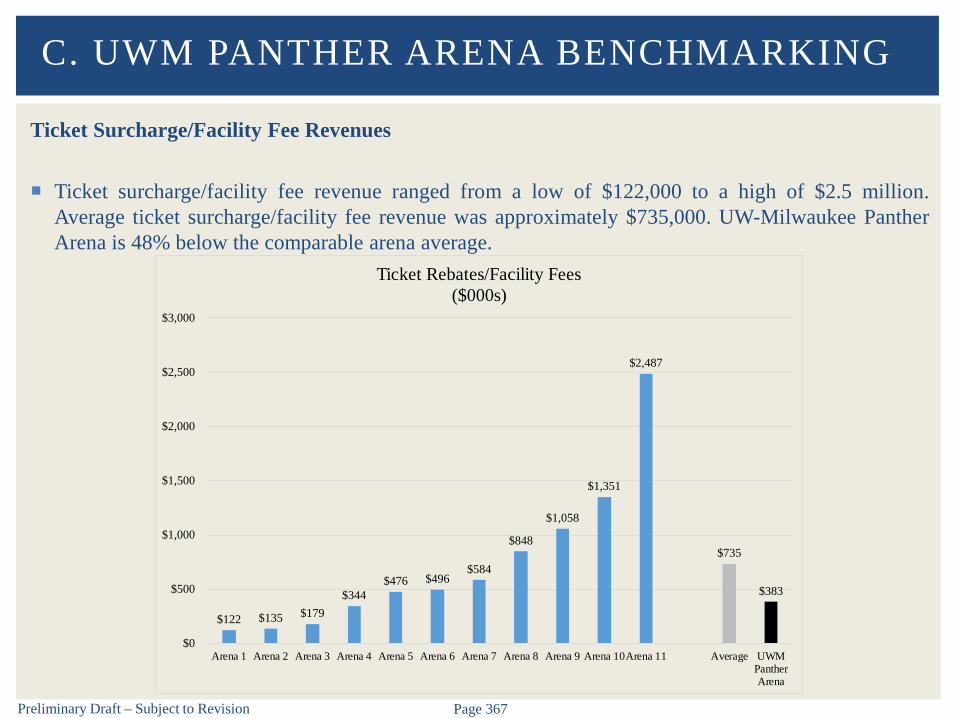
Preliminary Draft – Subject to Revision Page 367
Ticket Surcharge/Facility Fee Revenues
Ticket surcharge/facility fee revenue ranged from a low of $122,000 to a high of $2.5 million.Average ticket surcharge/facility fee revenue was approximately $735,000. UW-Milwaukee PantherArena is 48% below the comparable arena average.
C. UWM PANTHER ARENA BENCHMARKING
$122 $135 $179 $344
$476 $496 $584
$848
$1,058
$1,351
$2,487
$735
$383
$0
$500
$1,000
$1,500
$2,000
$2,500
$3,000
Arena 1 Arena 2 Arena 3 Arena 4 Arena 5 Arena 6 Arena 7 Arena 8 Arena 9 Arena 10Arena 11 Average UWMPantherArena
Ticket Rebates/Facility Fees($000s)
Preliminary Draft – Subject to Revision Page 368
Advertising Revenues
Advertising revenues are generally derived from the following sources:
Display Advertising: signage throughout the concourses, concession stands, and other commonareas in the building
Scoreboard Advertising: fixed signage, electronic advertising on the scoreboard, and videomessage boards
Basketball Advertising: advertising on the basketball standards, basketball floor, ball carts,scorers’ table and players benches
Dasher Board Advertising: signage on the hockey dasher board
It is important to note that direct comparison of advertising revenue is difficult
Trade and barter arrangements Revenue sharing Gross advertising vs. net advertising Overall sponsorship revenues
C. UWM PANTHER ARENA BENCHMARKING
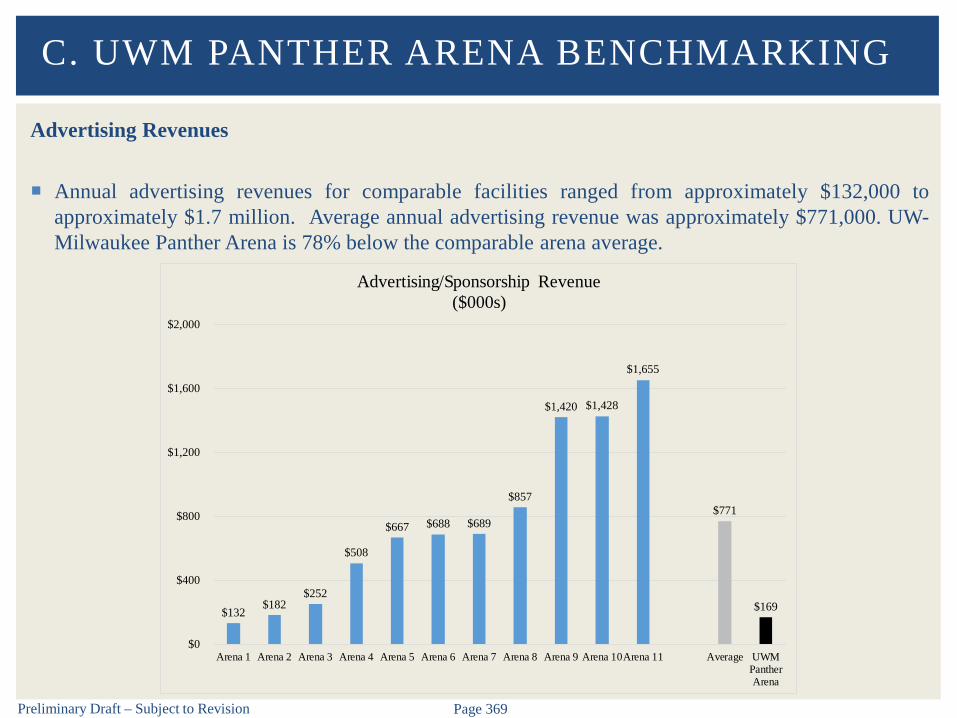
Preliminary Draft – Subject to Revision Page 369
Advertising Revenues
Annual advertising revenues for comparable facilities ranged from approximately $132,000 toapproximately $1.7 million. Average annual advertising revenue was approximately $771,000. UW-Milwaukee Panther Arena is 78% below the comparable arena average.
C. UWM PANTHER ARENA BENCHMARKING
$132 $182
$252
$508
$667 $688 $689
$857
$1,420 $1,428
$1,655
$771
$169
$0
$400
$800
$1,200
$1,600
$2,000
Arena 1 Arena 2 Arena 3 Arena 4 Arena 5 Arena 6 Arena 7 Arena 8 Arena 9 Arena 10Arena 11 Average UWMPantherArena
Advertising/Sponsorship Revenue($000s)

Preliminary Draft – Subject to Revision Page 370
Naming Rights Revenues
Value of naming rights transaction can often be misunderstood and misrepresented Reported in generic terms
Variety of factors to consider in valuing and comparing naming rights deals from purchaser and sellerperspectives Regional/national/international media exposure Market size and demographic profile Number and profile of major tenants Number and type of facility events Facility attendance Facility location/visibility Location of naming rights signage Deal structure and other amenities
Value of naming rights to purchaser is a function of following factors Number of impressions/exposures Brand exclusivity Public relations/community image Sponsorship/cross promotion opportunities Tax deductible expense (as applicable) Other
C. UWM PANTHER ARENA BENCHMARKING

Preliminary Draft – Subject to Revision Page 371
Naming Rights Revenues (continued)
Naming rights deals for minor league and collegiatearenas are illustrated to the right
It is important to note that naming rights revenuesmay be included as part of arena financing plan
Facilities included in benchmarking are highlighted
UW-Milwaukee Panther Arena’s naming rights dealis for $3.425 million over 10 years Average of $342,500
C. UWM PANTHER ARENA BENCHMARKING
Arena CityTotal Value
(Millions) Years Annual Value ExpirationKFC Yum! Center Louisville, KY $13.50 10 $1,350,000 2020CenturyLink Center Omaha Omaha, NE $14.00 15 $933,333 2018SNHU Arena - (1) Manchester, NH $7.60 10 $760,000 2026Budweiser Gardens London, ON $6.20 10 $620,000 2022Indiana Farmers Coliseum Indianapolis, IN $6.00 10 $600,000 2024Sears Centre Arena Hoffman Estates, IL $1.80 3 $600,000 2019Wells Fargo Arena Des Moines, IA $11.50 20 $575,000 2025CenturyLink Center Bossier City, LA $5.50 11 $500,000 2018Giant Center - (2) Hershey, PA $5.00 10 $500,000 2022DCU Center Worcester, MA $4.80 10 $480,000 2025Pinnacle Bank Arena Lincoln, NE $11.25 25 $450,000 2036Bon Secours Wellness Arena Greenville, SC $4.50 10 $450,000 2023Dunkin' Donuts Center Providence, RI $4.25 10 $425,000 2021iWireless Center Moline, IL. $4.25 10 $425,000 2017Ford Center Evansville, IN $4.20 10 $420,000 2021U.S. Cellular Center Cedar Rapids, IA $3.80 10 $380,000 2023Xfinity Arena at Everett Everett, WA $3.70 10 $370,000 2017Alerus Center Grand Forks, ND $7.20 20 $360,000 2020Intrust Bank Arena Wichita, KS $8.75 25 $350,000 2034Germain Arena Estero, FL $7.00 20 $350,000 2018Rabobank Arena Bakersfield, CA $3.50 10 $350,000 2025SaskTel Centre Saskatoon, SK $3.50 10 $350,000 2024Webster Bank Arena at Harbor Yard Bridgeport, CT $3.50 10 $350,000 2021Huntington Center Toledo, OH $2.10 6 $350,000 2017MassMutual Center Springfield, MA $5.00 15 $333,333 2020ShoWare Center Kent, WA $3.18 10 $318,000 2019FirstOntario Centre Hamilton, ON $3.13 10 $313,000 2024Santander Arena Reading, Pa. $9.00 30 $300,000 2030Verizon Arena North Little Rock, AR $6.00 20 $300,000 2019Erie Insurance Arena Erie, PA $3.00 10 $300,000 2022Sun National Bank Center - (3) Trenton, NJ $2.10 7 $300,000 2016BMO Harris Bank Center Rockford, IL $1.50 5 $300,000 2021WesBanco Arena Wheeling, WV $2.50 10 $250,000 2023Tribute Communities Centre Oshawa, ON $2.50 10 $250,000 2026Royal Farms Arena Baltimore, MD $1.25 5 $250,000 2019Mohegan Sun Arena at Casey Plaza Wilkes-Barre, PA $2.38 10 $238,000 2020Times Union Center Albany, NY $1.18 5 $236,000 2020Toyota Center Kennewick, WA $1.13 5 $226,000 2020Covelli Centre Youngstown, OH $1.05 5 $210,000 2021Cross Insurance Center Bangor, ME $3.00 15 $200,000 2028The Sanford Center Bemidji, MN $2.00 10 $200,000 2020Blue Cross Arena at the War Memorial Rochester, NY $2.93 15 $195,333 2028WFCU Centre Windsor, ON $1.64 10 $164,000 2018Essar Centre Sault Ste. Marie, ON $1.52 10 $152,000 2018Big Sandy Superstore Arena Huntington, WV $0.75 5 $150,000 2018Bojangles' Coliseum Charlotte, NC $1.25 10 $125,000 2019Verizon Wireless Center Mankato, MN $2.20 20 $110,000 2018CN Centre Prince George, BC $1.30 15 $86,667 DNDBudweiser Events Center Loveland, CO $1.50 20 $75,000 2023Credit Union iPlex Swift Current, SK $0.60 10 $60,000 DNDProgressive Auto Sales Arena Sarnia, ON $0.43 10 $42,500 2026(1) - Assumption for value is based on previous deal with Verizon Wireless.(2) - Giant Food Stores renewed its sponsorship of the Giant Center at unavailable terms for 10 years in 2012.(3) - Deal was set to expire in 2016, no information has been disclosed on an extension.Source: Resource Guide Live.
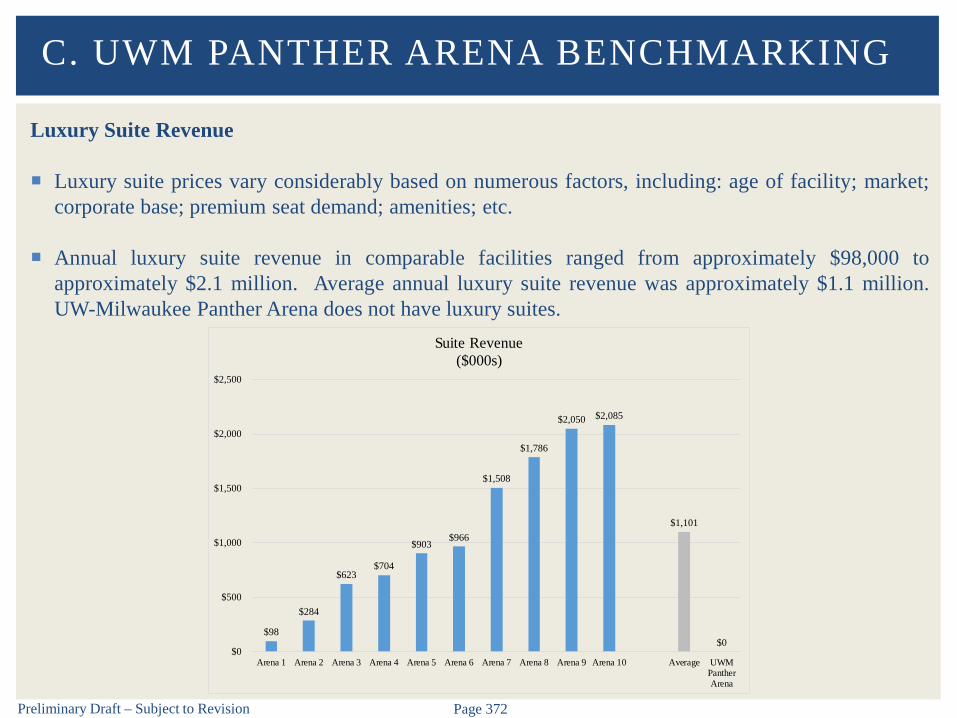
Preliminary Draft – Subject to Revision Page 372
Luxury Suite Revenue
Luxury suite prices vary considerably based on numerous factors, including: age of facility; market;corporate base; premium seat demand; amenities; etc.
Annual luxury suite revenue in comparable facilities ranged from approximately $98,000 toapproximately $2.1 million. Average annual luxury suite revenue was approximately $1.1 million.UW-Milwaukee Panther Arena does not have luxury suites.
C. UWM PANTHER ARENA BENCHMARKING
$98
$284
$623 $704
$903 $966
$1,508
$1,786
$2,050 $2,085
$1,101
$0 $0
$500
$1,000
$1,500
$2,000
$2,500
Arena 1 Arena 2 Arena 3 Arena 4 Arena 5 Arena 6 Arena 7 Arena 8 Arena 9 Arena 10 Average UWMPantherArena
Suite Revenue($000s)

Preliminary Draft – Subject to Revision Page 373
Concessions Revenue
Concessions typically provide significantrevenue
Concession spending is typically higher atnewer facilities than older facilities due toincreased number of points-of-sale andimproved locations
UW-Milwaukee Panther Arena debutednew concessions in 2016 and will soonopen a Saz’s (barbecue)
We have summarized the per capitaconcessions information provided byWCD
The Milwaukee Admirals had a per cap of$7.79 in 2016
C. UWM PANTHER ARENA BENCHMARKING
$0.00
$2.00
$4.00
$6.00
$8.00
$10.00
$12.00
$14.00
$16.00
$18.00
2011 2012 2013 2014 2015 2016
Concessions Per Capita Revenue
UWM Panther Men's Basketball Milwaukee Wave Brew City BruisersShrine Circus Disney - Variety Concerts - VarietyMMA/Pure Championship Fighting US Robotics Milwaukee Theatre - Entertainment
2011 2012 2013 2014 2015 2016UW-Milwaukee Panther ArenaUWM Panther Men's Basketball $6.32 $5.02 $6.40 $6.36 $7.02 $5.46Milwaukee Wave $5.18 $4.50 $5.69 $6.04 $6.50 $6.31Brew City Bruisers $8.15 $7.49 $8.24 $9.18 $11.04 $9.32Shrine Circus $3.48 $3.70 $3.83 $3.63 $4.24 $4.28Disney - Variety $2.50 $2.40 $2.43 $2.21 $2.72 NAMarvel Universe NA NA NA NA NA $2.94Concerts - Variety $6.35 $3.83 $3.82 $6.55 $5.96 $8.56MMA/Pure Championship Fighting NA NA NA NA $16.24 $12.19US Robotics NA $9.03 $7.31 $6.77 $8.07 $11.95
Milwaukee Theatre - Entertainment $3.02 $3.05 $2.99 $2.71 $4.04 $2.43
Source: WCD, Levy.Note: Data has been compiled from different sources.
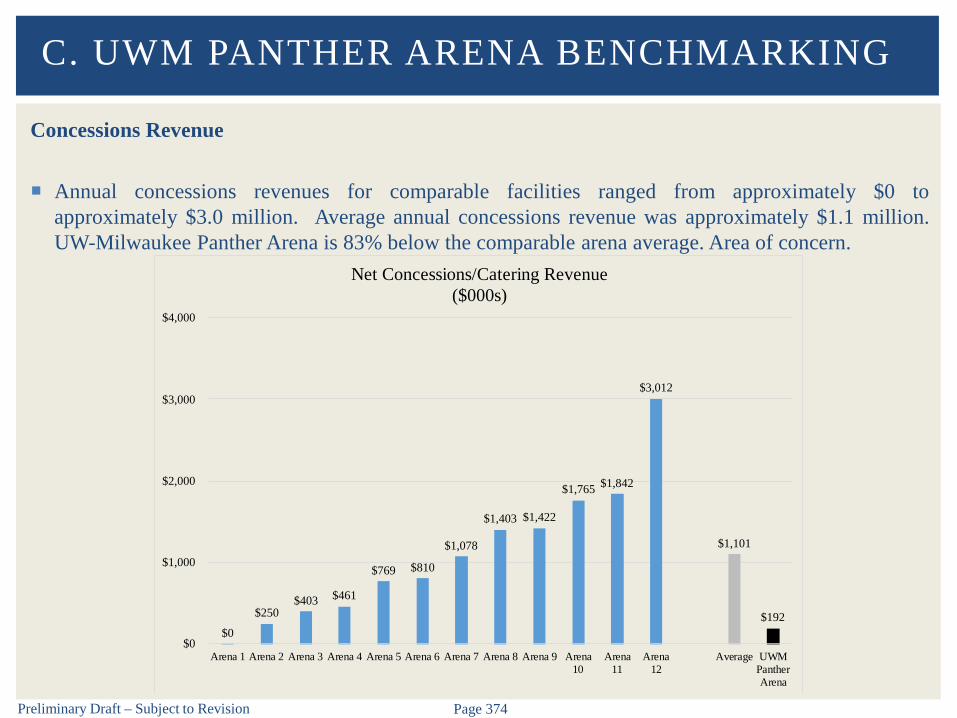
Preliminary Draft – Subject to Revision Page 374
Concessions Revenue
Annual concessions revenues for comparable facilities ranged from approximately $0 toapproximately $3.0 million. Average annual concessions revenue was approximately $1.1 million.UW-Milwaukee Panther Arena is 83% below the comparable arena average. Area of concern.
C. UWM PANTHER ARENA BENCHMARKING
$0
$250 $403 $461
$769 $810
$1,078
$1,403 $1,422
$1,765 $1,842
$3,012
$1,101
$192
$0
$1,000
$2,000
$3,000
$4,000
Arena 1 Arena 2 Arena 3 Arena 4 Arena 5 Arena 6 Arena 7 Arena 8 Arena 9 Arena10
Arena11
Arena12
Average UWMPantherArena
Net Concessions/Catering Revenue($000s)
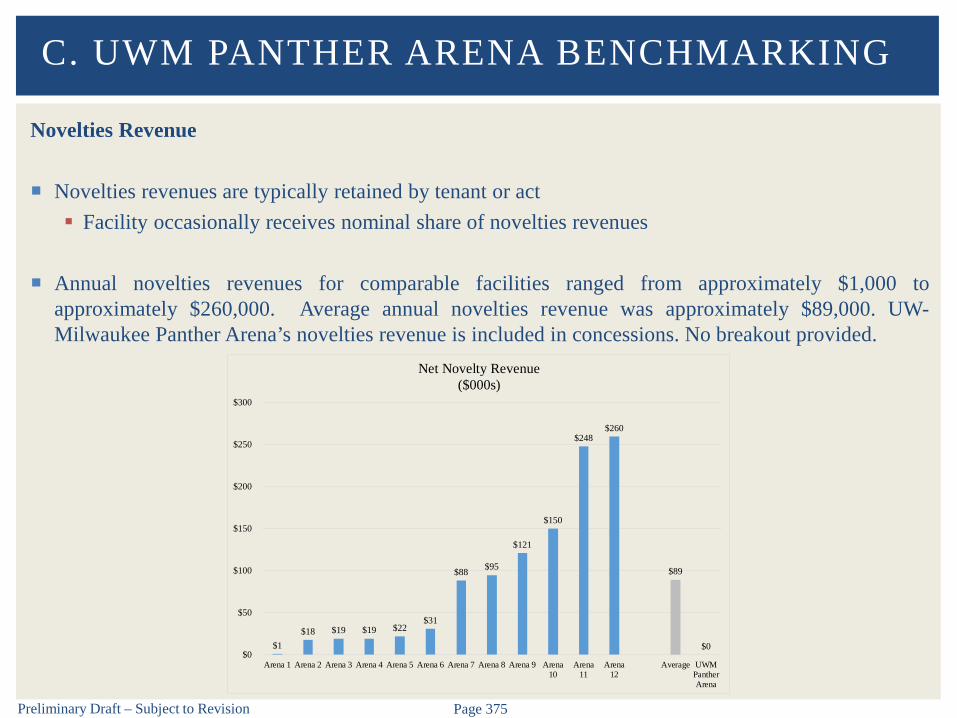
Preliminary Draft – Subject to Revision Page 375
Novelties Revenue
Novelties revenues are typically retained by tenant or act Facility occasionally receives nominal share of novelties revenues
Annual novelties revenues for comparable facilities ranged from approximately $1,000 toapproximately $260,000. Average annual novelties revenue was approximately $89,000. UW-Milwaukee Panther Arena’s novelties revenue is included in concessions. No breakout provided.
C. UWM PANTHER ARENA BENCHMARKING
$1 $18 $19 $19 $22
$31
$88 $95
$121
$150
$248 $260
$89
$0 $0
$50
$100
$150
$200
$250
$300
Arena 1 Arena 2 Arena 3 Arena 4 Arena 5 Arena 6 Arena 7 Arena 8 Arena 9 Arena10
Arena11
Arena12
Average UWMPantherArena
Net Novelty Revenue($000s)
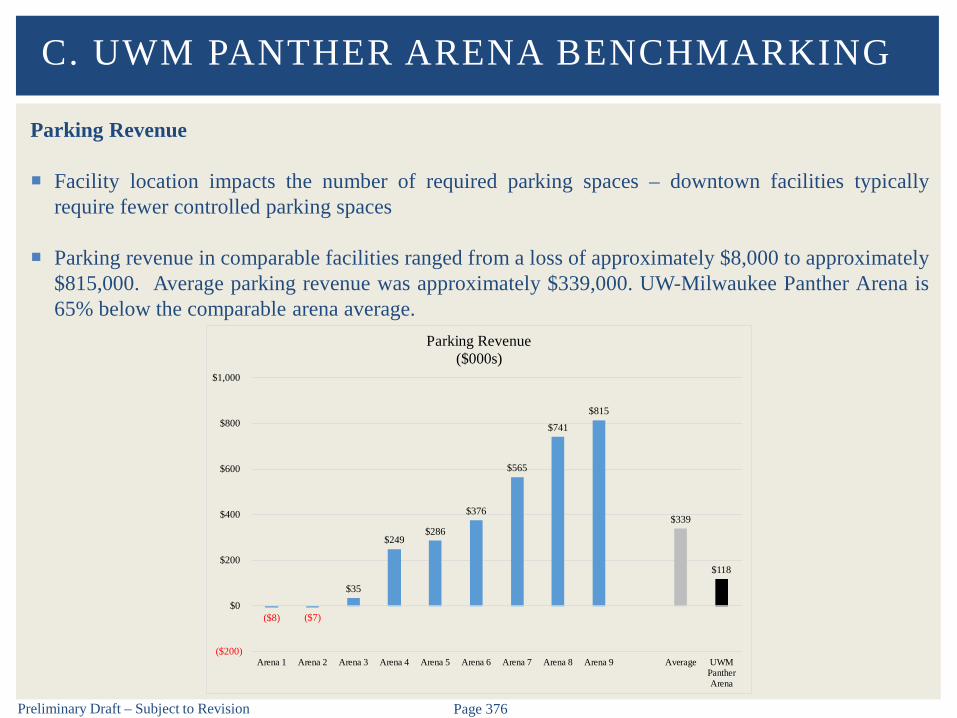
Preliminary Draft – Subject to Revision Page 376
Parking Revenue
Facility location impacts the number of required parking spaces – downtown facilities typicallyrequire fewer controlled parking spaces
Parking revenue in comparable facilities ranged from a loss of approximately $8,000 to approximately$815,000. Average parking revenue was approximately $339,000. UW-Milwaukee Panther Arena is65% below the comparable arena average.
C. UWM PANTHER ARENA BENCHMARKING
($8) ($7)
$35
$249 $286
$376
$565
$741 $815
$339
$118
($200)
$0
$200
$400
$600
$800
$1,000
Arena 1 Arena 2 Arena 3 Arena 4 Arena 5 Arena 6 Arena 7 Arena 8 Arena 9 Average UWMPantherArena
Parking Revenue($000s)

Preliminary Draft – Subject to Revision Page 377
Total Operating Revenue
Total operating revenue in comparable facilities ranged from approximately $1.0 million toapproximately $8.1 million. Average total operating revenue was $4.8 million. UW-MilwaukeePanther Arena is 54% below the comparable arena average.
C. UWM PANTHER ARENA BENCHMARKING
$1,000
$1,931 $2,519
$3,551 $3,974 $4,054
$6,043
$6,938 $7,199 $7,209
$8,140
$4,778
$2,193
$0
$2,000
$4,000
$6,000
$8,000
$10,000
Arena 1 Arena 2 Arena 3 Arena 4 Arena 5 Arena 6 Arena 7 Arena 8 Arena 9 Arena 10Arena 11 Average UWMPantherArena
Total Revenue($000s)
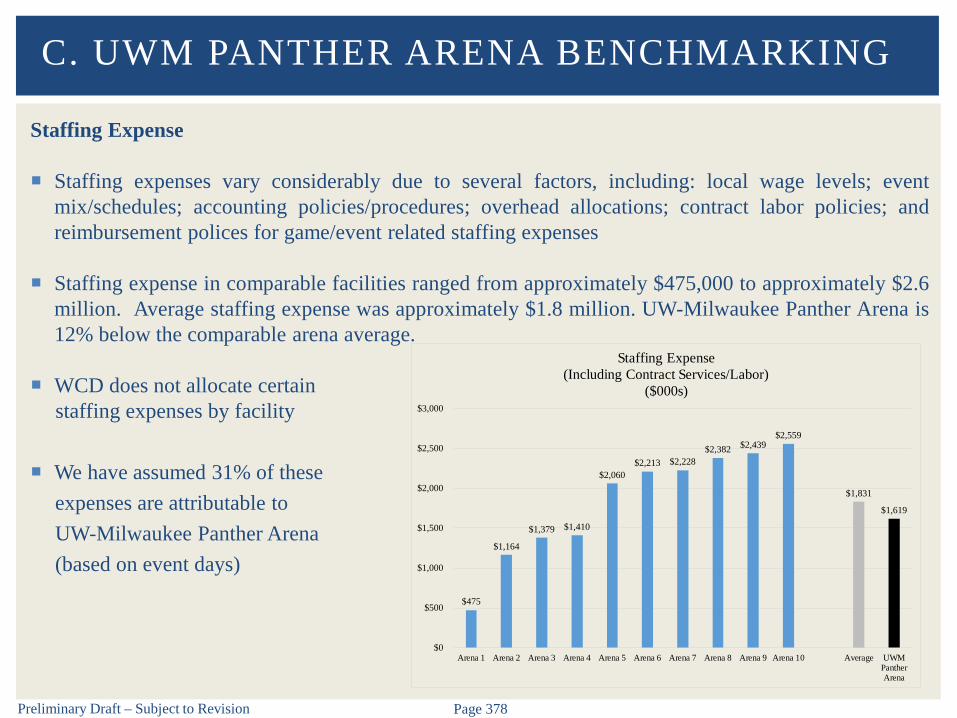
Preliminary Draft – Subject to Revision Page 378
Staffing Expense
Staffing expenses vary considerably due to several factors, including: local wage levels; eventmix/schedules; accounting policies/procedures; overhead allocations; contract labor policies; andreimbursement polices for game/event related staffing expenses
Staffing expense in comparable facilities ranged from approximately $475,000 to approximately $2.6million. Average staffing expense was approximately $1.8 million. UW-Milwaukee Panther Arena is12% below the comparable arena average.
WCD does not allocate certainstaffing expenses by facility
We have assumed 31% of theseexpenses are attributable toUW-Milwaukee Panther Arena(based on event days)
C. UWM PANTHER ARENA BENCHMARKING
$475
$1,164
$1,379 $1,410
$2,060 $2,213 $2,228
$2,382 $2,439 $2,559
$1,831
$1,619
$0
$500
$1,000
$1,500
$2,000
$2,500
$3,000
Arena 1 Arena 2 Arena 3 Arena 4 Arena 5 Arena 6 Arena 7 Arena 8 Arena 9 Arena 10 Average UWMPantherArena
Staffing Expense(Including Contract Services/Labor)
($000s)
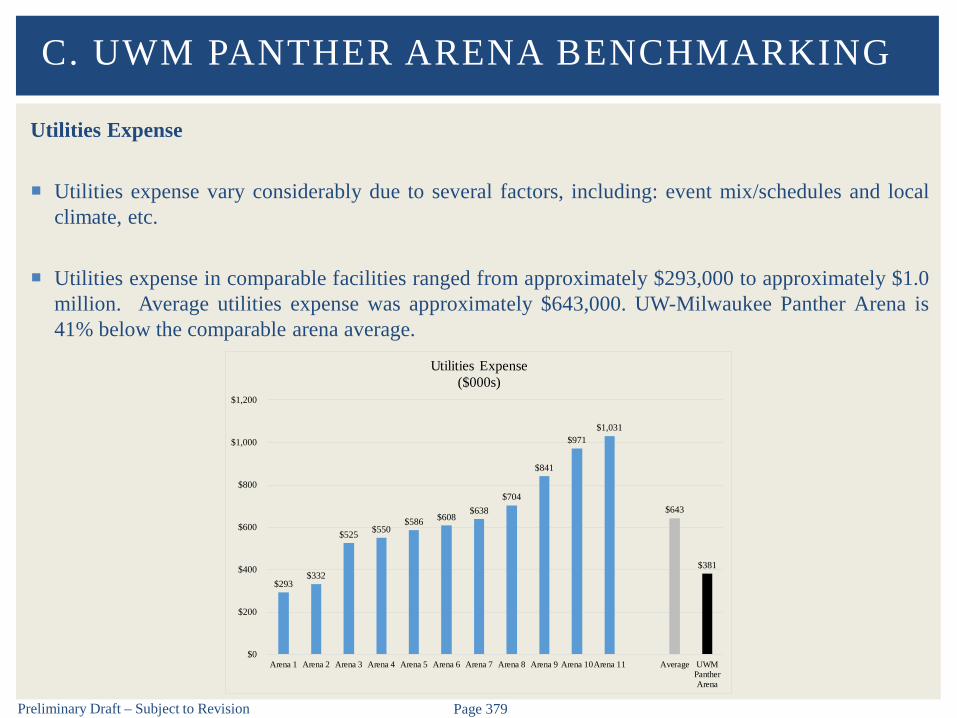
Preliminary Draft – Subject to Revision Page 379
Utilities Expense
Utilities expense vary considerably due to several factors, including: event mix/schedules and localclimate, etc.
Utilities expense in comparable facilities ranged from approximately $293,000 to approximately $1.0million. Average utilities expense was approximately $643,000. UW-Milwaukee Panther Arena is41% below the comparable arena average.
C. UWM PANTHER ARENA BENCHMARKING
$293 $332
$525 $550 $586 $608
$638 $704
$841
$971 $1,031
$643
$381
$0
$200
$400
$600
$800
$1,000
$1,200
Arena 1 Arena 2 Arena 3 Arena 4 Arena 5 Arena 6 Arena 7 Arena 8 Arena 9 Arena 10Arena 11 Average UWMPantherArena
Utilities Expense($000s)
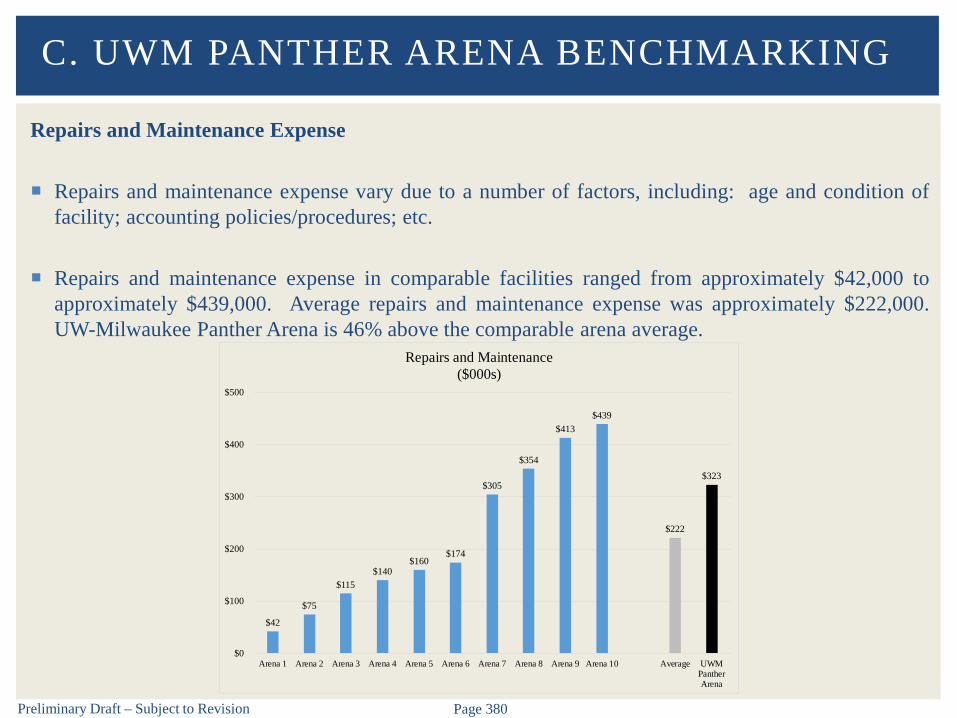
Preliminary Draft – Subject to Revision Page 380
Repairs and Maintenance Expense
Repairs and maintenance expense vary due to a number of factors, including: age and condition offacility; accounting policies/procedures; etc.
Repairs and maintenance expense in comparable facilities ranged from approximately $42,000 toapproximately $439,000. Average repairs and maintenance expense was approximately $222,000.UW-Milwaukee Panther Arena is 46% above the comparable arena average.
C. UWM PANTHER ARENA BENCHMARKING
$42
$75
$115 $140
$160 $174
$305
$354
$413 $439
$222
$323
$0
$100
$200
$300
$400
$500
Arena 1 Arena 2 Arena 3 Arena 4 Arena 5 Arena 6 Arena 7 Arena 8 Arena 9 Arena 10 Average UWMPantherArena
Repairs and Maintenance($000s)
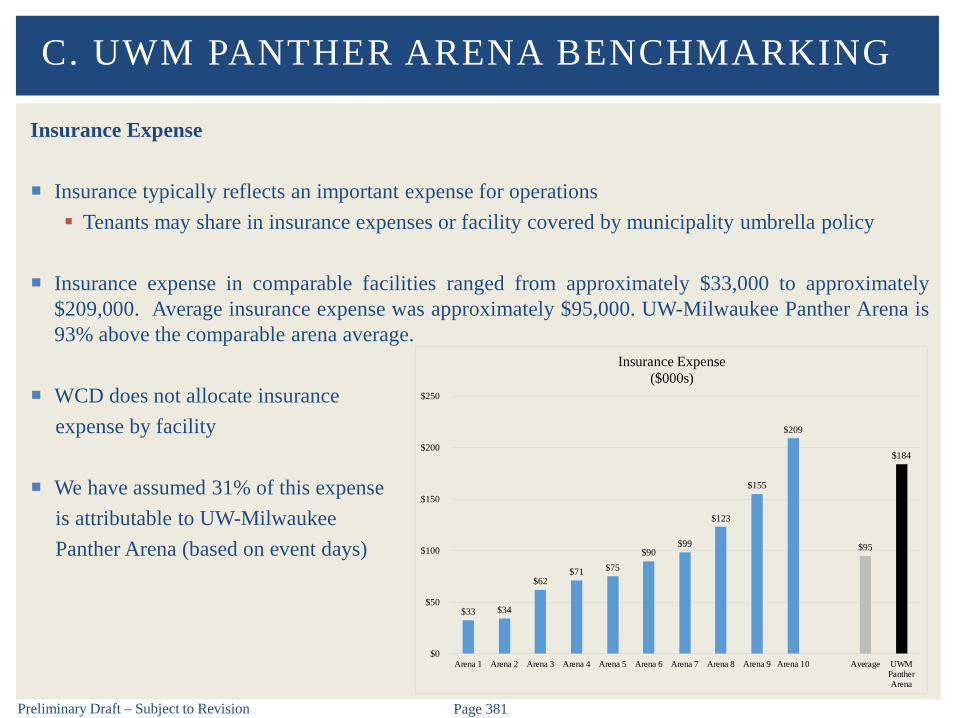
Preliminary Draft – Subject to Revision Page 381
Insurance Expense
Insurance typically reflects an important expense for operations Tenants may share in insurance expenses or facility covered by municipality umbrella policy
Insurance expense in comparable facilities ranged from approximately $33,000 to approximately$209,000. Average insurance expense was approximately $95,000. UW-Milwaukee Panther Arena is93% above the comparable arena average.
WCD does not allocate insuranceexpense by facility
We have assumed 31% of this expenseis attributable to UW-MilwaukeePanther Arena (based on event days)
C. UWM PANTHER ARENA BENCHMARKING
$33 $34
$62 $71 $75
$90 $99
$123
$155
$209
$95
$184
$0
$50
$100
$150
$200
$250
Arena 1 Arena 2 Arena 3 Arena 4 Arena 5 Arena 6 Arena 7 Arena 8 Arena 9 Arena 10 Average UWMPantherArena
Insurance Expense($000s)
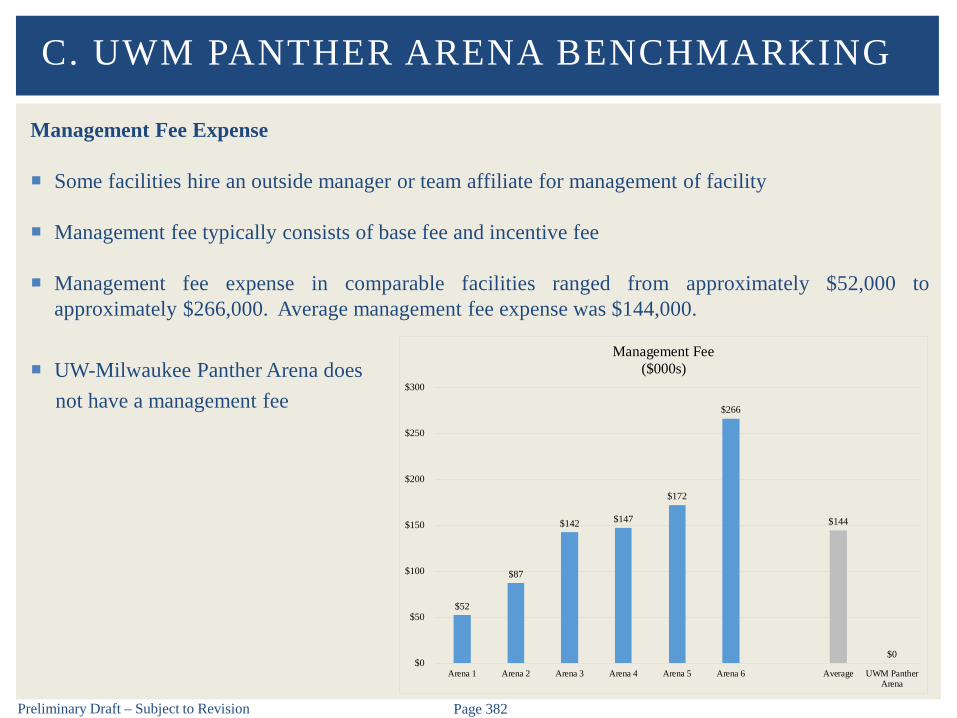
Preliminary Draft – Subject to Revision Page 382
Management Fee Expense
Some facilities hire an outside manager or team affiliate for management of facility
Management fee typically consists of base fee and incentive fee
Management fee expense in comparable facilities ranged from approximately $52,000 toapproximately $266,000. Average management fee expense was $144,000.
UW-Milwaukee Panther Arena doesnot have a management fee
C. UWM PANTHER ARENA BENCHMARKING
$52
$87
$142 $147
$172
$266
$144
$0 $0
$50
$100
$150
$200
$250
$300
Arena 1 Arena 2 Arena 3 Arena 4 Arena 5 Arena 6 Average UWM PantherArena
Management Fee($000s)

Preliminary Draft – Subject to Revision Page 383
Total Operating Expenses
Total operating expenses in comparable facilities ranged from approximately $3.0 million toapproximately $6.2 million. Average total operating expenses were approximately $4.5 million.
WCD does not allocate certain overhead expenses by facility. We have assumed 31% of theseexpenses are attributable to UW-Milwaukee Panther Arena (based on event days). UW-MilwaukeePanther Arena is 29% below the comparable arena average.
C. UWM PANTHER ARENA BENCHMARKING
$2,995
$3,494 $3,688 $3,752
$3,972
$4,457
$5,039 $5,079 $5,278 $5,438
$6,219
$4,492
$3,167
$0
$1,000
$2,000
$3,000
$4,000
$5,000
$6,000
$7,000
Arena 1 Arena 2 Arena 3 Arena 4 Arena 5 Arena 6 Arena 7 Arena 8 Arena 9 Arena 10Arena 11 Average UWMPantherArena
Total Expense($000s)
Preliminary Draft – Subject to Revision Page 384
Net Operating Income
For illustrative purposes, below is a summary of net operating income for comparable facilities.
Facilities in other markets may realize higher (or lower) net operating income based on:
Market demographics Physical characteristics Anchor tenants Tenant lease terms Entertainment alternatives Competitive facilities Other
C. UWM PANTHER ARENA BENCHMARKING
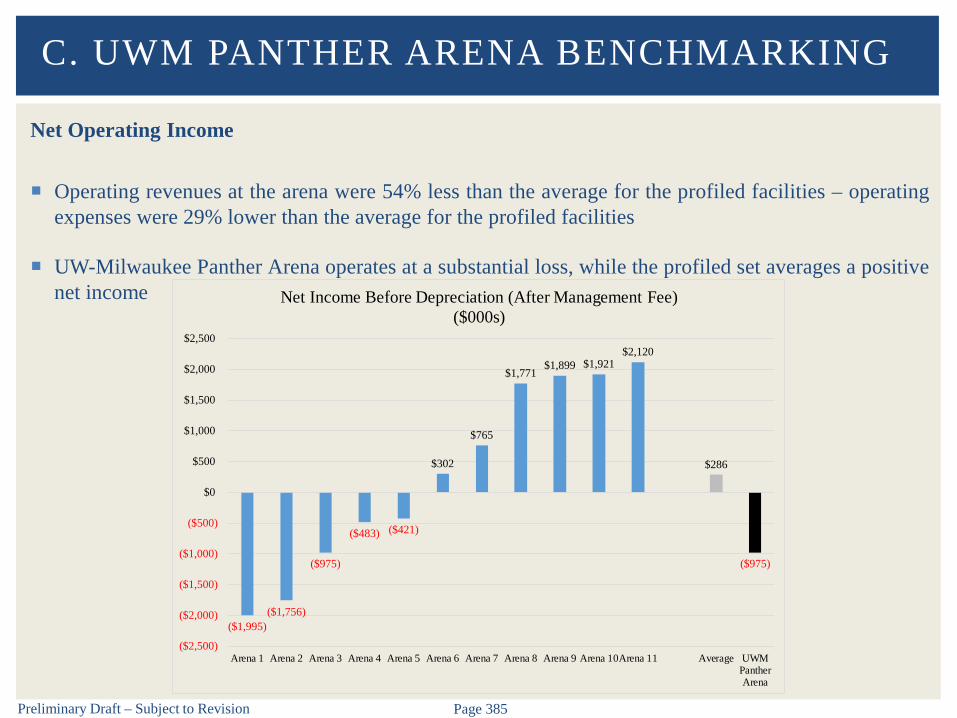
Preliminary Draft – Subject to Revision Page 385
Net Operating Income
Operating revenues at the arena were 54% less than the average for the profiled facilities – operatingexpenses were 29% lower than the average for the profiled facilities
UW-Milwaukee Panther Arena operates at a substantial loss, while the profiled set averages a positivenet income
C. UWM PANTHER ARENA BENCHMARKING
($1,995)($1,756)
($975)
($483) ($421)
$302
$765
$1,771 $1,899 $1,921
$2,120
$286
($975)
($2,500)
($2,000)
($1,500)
($1,000)
($500)
$0
$500
$1,000
$1,500
$2,000
$2,500
Arena 1 Arena 2 Arena 3 Arena 4 Arena 5 Arena 6 Arena 7 Arena 8 Arena 9 Arena 10Arena 11 Average UWMPantherArena
Net Income Before Depreciation (After Management Fee)($000s)
D. MILWAUKEE THEATRE
BENCHMARKING

Preliminary Draft – Subject to Revision Page 387
Overview
The Milwaukee Theatre operates in a competitive environment locally, regionally, and nationally. Itsseating capacity places it in an unique position as compared to traditional theaters or performing artscenters which tend to be smaller in size.
The following facilities comprise the profiled set of auditoriums/theaters that focus on hostingentertainment events such as concerts, family shows, Broadway shows, community events and specialevents.
Cobb Energy Performing Arts Centre DeVos Performance Hall Fox Cities Performing Arts Center Hippodrome Theatre INB Performing Arts Center James L. Knight Center Lowell Memorial Auditorium Ovens Auditorium Raising Cane’s River Center Theatre for the Performing Arts Rosemont Theatre Sandler Center for the Performing Arts
This section profiles each facility’s owner/operator, capacity, utilization, and financial operations.
D. MILWAUKEE THEATRE BENCHMARKING

Preliminary Draft – Subject to Revision Page 388
Comparable Facility Overview
The profiled set of comparable facilities include six publicly-owned venues, four venues owned by anauthority/district, and one owned by a not-for-profit group
Six of the profiled facilities are managed by private management groups, two are publicly managed,two are managed by an authority/district, and one is managed by not-for-profit performing artsorganization
The average capacity of the main theater within the profiled set is 2,680 – the Milwaukee Theatre islarger than most of the profiled facilities
D. MILWAUKEE THEATRE BENCHMARKING
Facility Location Owner Operator Main Theater/
Auditorium Capacity James L. Knight Center Miami, FL City of Miami SMG 4,570Rosemont Theatre Rosemont, IL Village of Rosemont Village of Rosemont 4,200Milwaukee Theatre Milwaukee, WI Wisconsin Center District Wisconsin Center District 4,087Lowell Memorial Auditorium Lowell, MA City of Lowell Spectra 2,800
Cobb Energy Performing Arts Centre Atlanta, GACobb-Marietta Coliseum and
Exhibit Hall Authority Cobb-Marietta Coliseum and
Exhibit Hall Authority 2,750
INB Performing Arts Center Spokane, WA Spokane Public Facilities District Spokane Public Facilities District 2,700
Ovens Auditorium Charlotte, NC City of CharlotteCharlotte Regional Visitors
Authority2,460
DeVos Performance Hall Grand Rapids, MIGrand Rapids-Kent County Convention/Arena Authority
SMG 2,400
Hippodrome Theatre Baltimore, MD Maryland Stadium Authority Broadway Across America 2,280
Fox Cities Performing Arts Center Appleton, WIFox Cities Performing Arts Center
IncFox Cities Performing Arts
Center Inc2,100
Baton Rouge, LA City of Baton Rouge SMG 1,900
Sandler Center for the Performing Arts Virginia Beach, VA City of Virginia Beach Spectra 1,300Note: Sorted in descending order by main theater/auditorium capacity.
Sources: Individual facilities; secondary research.
Profiled Set - Owner/Operator and Capacity
Raising Cane's River Center Theatre for the Performing Arts

Preliminary Draft – Subject to Revision Page 389
Utilization
As previously stated, the Milwaukee Theatredoes not have a tenant organization like someof the profiled facilities
From 2015 to 2016, the Milwaukee Theatreexperienced a significant increase in eventactivity due to a more aggressive marketingstrategy
In 2016, the Milwaukee Theatre hosted 78event days and 122,100 in total attendancewhich ranked 8th and 9th respectively, amongthe profiled set
D. MILWAUKEE THEATRE BENCHMARKING
Facility Event Days/
Performances Attendance A 154 244,500 B 158 232,200 C 166 211,900 D 358 * 197,000 E 74 * 192,100 F 279 * 184,500 G 66 * 158,100 H 131 * 149,200 Milwaukee Theatre - 2016 78 122,100 I 102 * 99,100 J 62 71,100 K 28 46,900 Average (Excluding Milwaukee Theatre) 143 162,400 Median (Excluding Milwaukee Theatre) 131 184,500 Notes: Sorted in descending order by total attendance.
* denotes number of events (not event days/performances).
Sources: Management at individual facilities; secondary research.
Profiled Set - Utilization
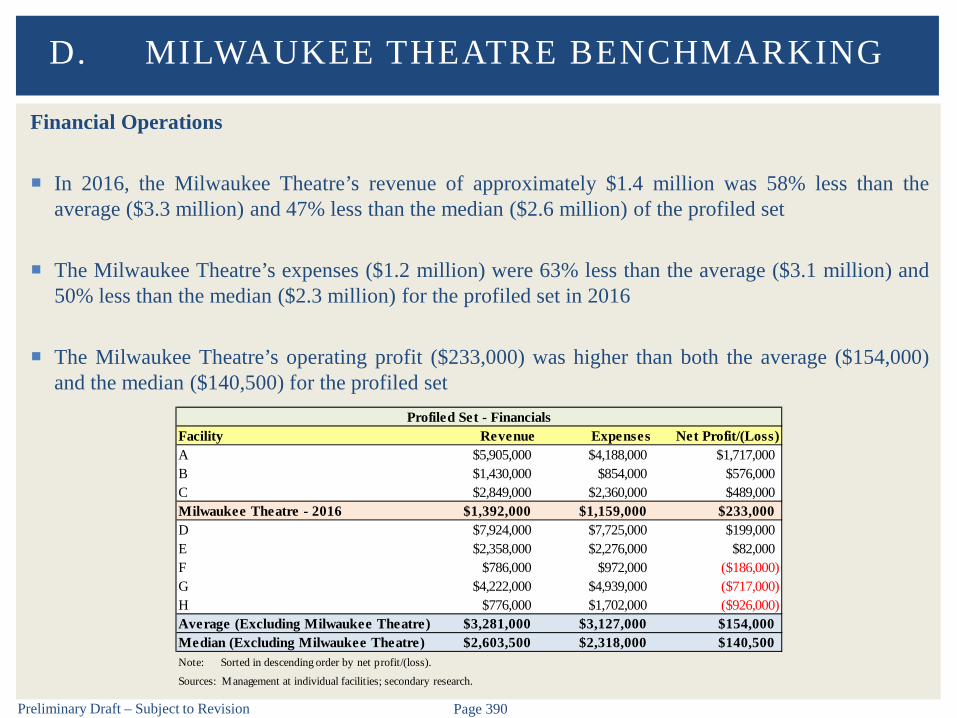
Preliminary Draft – Subject to Revision Page 390
Financial Operations
In 2016, the Milwaukee Theatre’s revenue of approximately $1.4 million was 58% less than theaverage ($3.3 million) and 47% less than the median ($2.6 million) of the profiled set
The Milwaukee Theatre’s expenses ($1.2 million) were 63% less than the average ($3.1 million) and50% less than the median ($2.3 million) for the profiled set in 2016
The Milwaukee Theatre’s operating profit ($233,000) was higher than both the average ($154,000)and the median ($140,500) for the profiled set
D. MILWAUKEE THEATRE BENCHMARKING
Facility Revenue Expenses Net Profit/(Loss)A $5,905,000 $4,188,000 $1,717,000B $1,430,000 $854,000 $576,000C $2,849,000 $2,360,000 $489,000Milwaukee Theatre - 2016 $1,392,000 $1,159,000 $233,000D $7,924,000 $7,725,000 $199,000E $2,358,000 $2,276,000 $82,000F $786,000 $972,000 ($186,000)G $4,222,000 $4,939,000 ($717,000)H $776,000 $1,702,000 ($926,000)Average (Excluding Milwaukee Theatre) $3,281,000 $3,127,000 $154,000Median (Excluding Milwaukee Theatre) $2,603,500 $2,318,000 $140,500Note: Sorted in descending order by net profit/(loss).
Sources: Management at individual facilities; secondary research.
Profiled Set - Financials

V. WCD/VISIT MILWAUKEE STRUCTURE

Preliminary Draft – Subject to Revision Page 392
DMO Overview
Convention/meeting planners have a variety of facilities and destinations to choose from whendeciding where to host their event. Attendees have diverse options where they can spend theirdiscretionary income. Given the competitiveness in the industry, Destination MarketingOrganizations (DMOs) and convention centers need to operate in a manner that is consistent with bestpractices, which includes the ability to quickly react to changes in industry trends.
The operating structure is important because it typically impacts all aspects of the organization’soperations and performance. Often, one specific entity plays a significant role in oversight,establishing and administering policy and maintaining, accountability in order for it to be effective.Objectives of governance generally include the following:
Providing a stable structure for operations insulating it from political influence and involvement Providing an independent entity that focuses on operating the organization in a proper, efficient,
economical and business-like manner Establishing polices that are consistent with industry standards to maximize a destination’s
competitive position, particularly with regard to convention/meeting sales Ensuring that the organization is serving the public needs while being fiscally responsible Providing strategic business planning that is measurable and periodically evaluated for
performance
V. WCD/VISIT MILWAUKEE STRUCTURE
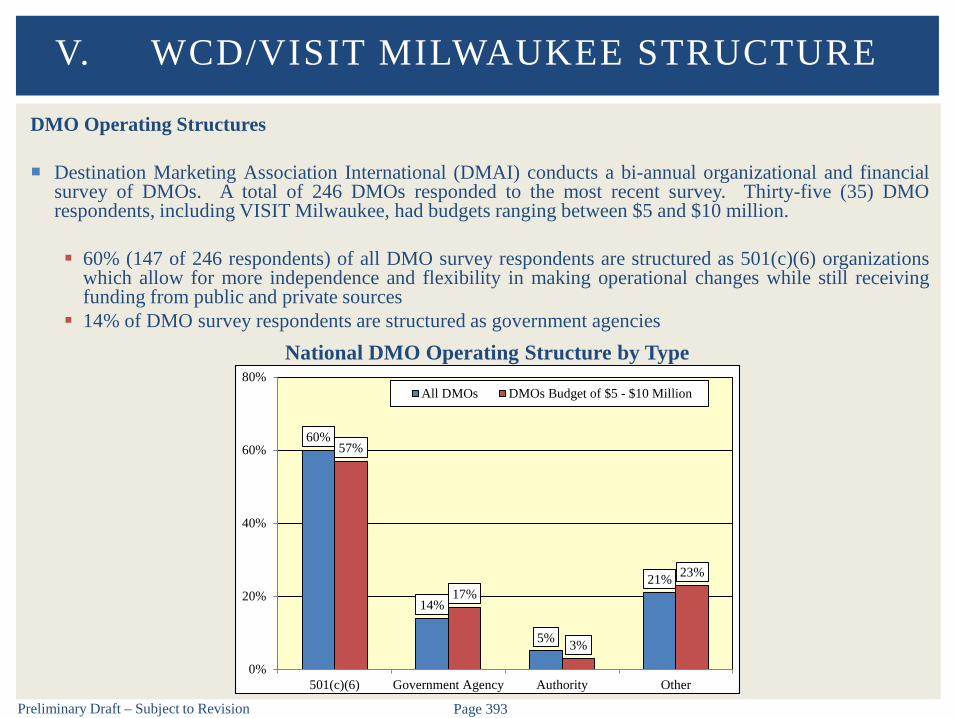
Preliminary Draft – Subject to Revision Page 393
DMO Operating Structures
Destination Marketing Association International (DMAI) conducts a bi-annual organizational and financialsurvey of DMOs. A total of 246 DMOs responded to the most recent survey. Thirty-five (35) DMOrespondents, including VISIT Milwaukee, had budgets ranging between $5 and $10 million.
60% (147 of 246 respondents) of all DMO survey respondents are structured as 501(c)(6) organizationswhich allow for more independence and flexibility in making operational changes while still receivingfunding from public and private sources
14% of DMO survey respondents are structured as government agencies
V. WCD/VISIT MILWAUKEE STRUCTURE
60%
14%
5%
21%
57%
17%
3%
23%
0%
20%
40%
60%
80%
501(c)(6) Government Agency Authority Other
All DMOs DMOs Budget of $5 - $10 Million
National DMO Operating Structure by Type

Preliminary Draft – Subject to Revision Page 394
DMO Funding
With regards to all DMOs, on average, 88% of DMO funding is derived from public sources and 12%from private sources. DMOs with a budget of $5 to $10 million have similar statistics for thedistribution of funding
VISIT Milwaukee receives a slightly higher percentage of its funding from private sources comparedto the average for DMOs with similar budgets
V. WCD/VISIT MILWAUKEE STRUCTURE
88%
12%
88%
12%
85%
15%
0%
20%
40%
60%
80%
100%
Public Private
All DMOs
DMOs Budget $5 - $10 Million
VISIT Milwaukee
National DMO Funding by Type
Preliminary Draft – Subject to Revision Page 395
DMO Operating Structures
DMO structure can impact its ability to operate efficiently and effectively in a competitivemarketplace
Examples of DMO structures include, but are not limited to, the following: Non-Profit Government Agency Authority Other
V. WCD/VISIT MILWAUKEE STRUCTURE
Preliminary Draft – Subject to Revision Page 396
DMO Operating Structures
Non-Profit
Based on information from DMAI, the majority of DMOs are independent, not-for-profit associationsclassified as 501(c)(6) businesses by the Internal Revenue Code. A small percentage of DMOs arestructured as independent, non-profit associations known as 501(c)(3) organizations. Both receive taxexempt status and can accept contributions that are tax-deductible to the donors. The primarydifferences between the two classifications are that 501(c)(3) organizations are required to becharitable organizations with no legislative activity and explicitly prohibit political activity. Theselimitations are less stringent with the 501(c)(6) classification.
Many DMOs chose to structure themselves as independent 501(c)(6) or 501(c)(3) organizations inorder to: Maintain tax exempt status; Collect membership dues; Establish autonomous identity (e.g. separate from Chamber of Commerce); and Have fewer restrictions with regard to changes in staffing, salary levels, bonus compensation, and
other areas. Examples of DMOs structured as 501(c)(6) businesses include those in Cleveland, Columbus, Grand
Rapids, Indianapolis, Kansas City, Minneapolis, Pittsburgh, and Portland
V. WCD/VISIT MILWAUKEE STRUCTURE
Preliminary Draft – Subject to Revision Page 397
DMO Operating Structures
Government Agency
Approximately 17% of profiled DMOs with budgets ranging between $5 and $10 million or moreoperate as a government agency
Given that the majority of funding for DMOs is derived from public sources such as lodging taxes,some destinations have chosen to govern their marketing agency as a governmental department
Benefits of this type of structure include direct oversight of the funding source expenditure by thetaxing entity.
Most governmental departments are not typically involved in a competitive industry, but instead servethe public interest of the jurisdiction by providing core services. DMOs operate in a distinctlydifferent atmosphere more similar to a business environment where sales and marketing efforts arecritical to achieving their mission. As such, many DMOs structured in this manner are hindered bymunicipal policies with regard to sales/marketing expenditures, staff travel, and personnelcompensation.
Operating a successful DMO as a governmental agency requires that specific policies and proceduresbe established that differentiate this unique department from other traditional municipal services,allowing it to operate more competitively in the destination marketing industry.
DMOs that operate as a governmental agency include those in Little Rock, Louisville, Omaha, SanAntonio, and Virginia Beach
V. WCD/VISIT MILWAUKEE STRUCTURE
Preliminary Draft – Subject to Revision Page 398
DMO Operating Structures
Authority
A less common operating structure for DMOs is an authority Some of the reasons DMOs are structured as an authority structure are because they: Are charged with oversight of facility operations; Have the ability to issue debt for development and/or operations of public assembly facilities
(typically convention centers); Are regional in scope representing multiple jurisdictions; and/or Receive dedicated funding from multiple jurisdictions.
Several advantages associated with an authority are the same as a 501(c)(6) or 501(c)(3) Authorities typically allow for greater autonomy while still being funded by public sources and
maintain tax exempt status Authorities are typically governed by a Board of Directors representative of industry stakeholders
that provide organizational oversight However, similar to a government agency, some authorities can have challenges related to
limitations on staff compensation, sales/marketing expenditures, and contract procedures DMOs in Charlotte and St. Louis are structured as independent authorities These authorities are directly responsible for operating their primary convention center
V. WCD/VISIT MILWAUKEE STRUCTURE
Preliminary Draft – Subject to Revision Page 399
DMO Operating Structures
Depending on the operating structure, there can be potential conflicts between balancing the eventmix with activity that generates overnight visitors vs. events that positively impact the facility’sbottom line – in many instances, these are competing operating objectives
For example, DMOs use the convention center as a tool to sell room nights which is directlyrelated to hotel occupancy tax revenues, typically their primary funding source. As such, DMOsmay offer financial concessions such as discounted rental rates at the convention center in order tobook the business and generate hotel room nights and associated tax revenues.
Conversely, convention center management is commonly charged with maximizing financialperformance which may limit its desire and flexibility to discount rental rates to respond tocompetitive realities
This challenge can be mitigated by clearly reflecting the operating objectives and expectations ofthe management team relative to facility performance
V. WCD/VISIT MILWAUKEE STRUCTURE
Preliminary Draft – Subject to Revision Page 400
Facility Operating Structures
As with DMOs, the ownership/operating structure of a facility can impact its ability to operateefficiently and effectively in a competitive marketplace
Examples of existing management options at public assembly facilities include, but are not limited to,the following: Operating through a traditional governmental management structure Operating as an independent public authority Contracting with a destination marketing organization Contracting with a third party that specializes in managing similar facilities
V. WCD/VISIT MILWAUKEE STRUCTURE

Preliminary Draft – Subject to Revision Page 401
Facility Operating Structures
Traditional Governmental Management
Historically, convention centers are one of the few public assets that operate in a semi-businessatmosphere requiring contractual agreements, frequent short term lease/use of facilities by customers,management of part-time and temporary staff resources for numerous events and partnership withthird party vendors and tenants
As with any governmentally run facility, the goals and objectives may change with each politicalcycle. For instance, the number and diversity of events may be the primary objective of one officialand fiscal performance may be the priority of another These changes in a facility’s objectives can be counter-productive if not managed effectively
Clearly defining a mission statement that reflects community consensus and operating objectives(e.g., generating economic impact) can allow a facility to set forth an operating and marketingstrategy that is consistent and long-term in implementation
This approach can also provide a more stable environment for event promoters/producers whenconsidering a convention center for future use
In general, governmentally operated facilities are more successful when management has the abilityand the authority needed to aggressively operate and book the facility without incurring onerousprocedures
V. WCD/VISIT MILWAUKEE STRUCTURE
Preliminary Draft – Subject to Revision Page 402
Facility Operating Structures
Traditional Governmental Management (continued)
In many instances, publicly operated facilities are overseen by a municipal department
Advantages Shared human and financial resources among the jurisdiction’s various facilities Economies of scale in terms of utilities, insurance, and maintenance expenses
Disadvantages Balancing civic/non-profit usage needs with those of events that generate overnight visitors which
can be politically challenging Civil service constraints in terms of staffing, incentive companion, travel/entertainment policies Subject to changes in political cycles Limited staff connections in the broader industry
Examples of this type of operating structure include the Kansas City Convention Center, the OregonConvention Center, and the Greensboro Coliseum Complex
V. WCD/VISIT MILWAUKEE STRUCTURE

Preliminary Draft – Subject to Revision Page 403
Facility Operating Structures
Independent Public Authority
In many states, an authority is a political subdivision of one or more governmental entities (e.g., City, Countyand/or State) that is allowed by an act of local or state legislature.
Authorities, sometimes referred to as districts, are usually governed by a Board of Directors that providesoversight and accountability Board members are typically representatives of the involved government entities as well as related
industry professionals (e.g., hoteliers, CVB executives, etc.) An authority can be multi-jurisdictional and can have a quasi-State organization funded by both the City
and County
This form of management structure is typically pursued when a fiscal resource is created or allocated by aunit(s) of government and when an inter-local agreement is pledged to the authority for specific purposes
Advantages Ability to obtain a funding source that can allow for the independent operations of a facility This approach is particularly valuable if there is a political consensus and will to identify a revenue
stream from existing or new fiscal sources that can help stabilize the operations of a public assemblyfacility and provide for its long-term improvement and maintenance
V. WCD/VISIT MILWAUKEE STRUCTURE
Preliminary Draft – Subject to Revision Page 404
Facility Operating Structures
Independent Public Authority (continued)
Disadvantages Can have limited industry representation for oversight and strategic planning making them
susceptible to political changes Without clear policies to the contrary, can be under same civil service constraints as municipal
management that hinder competitive sales function
Examples of facilities that are operated by an authority include the CenturyLink Center in Omaha andthe Music City Center in Nashville as well as a variety of facilities in Charlotte that are operated bythe Charlotte Regional Visitors Authority The CRVA also operates Visit Charlotte, the City’s Destination Marketing Organization
V. WCD/VISIT MILWAUKEE STRUCTURE
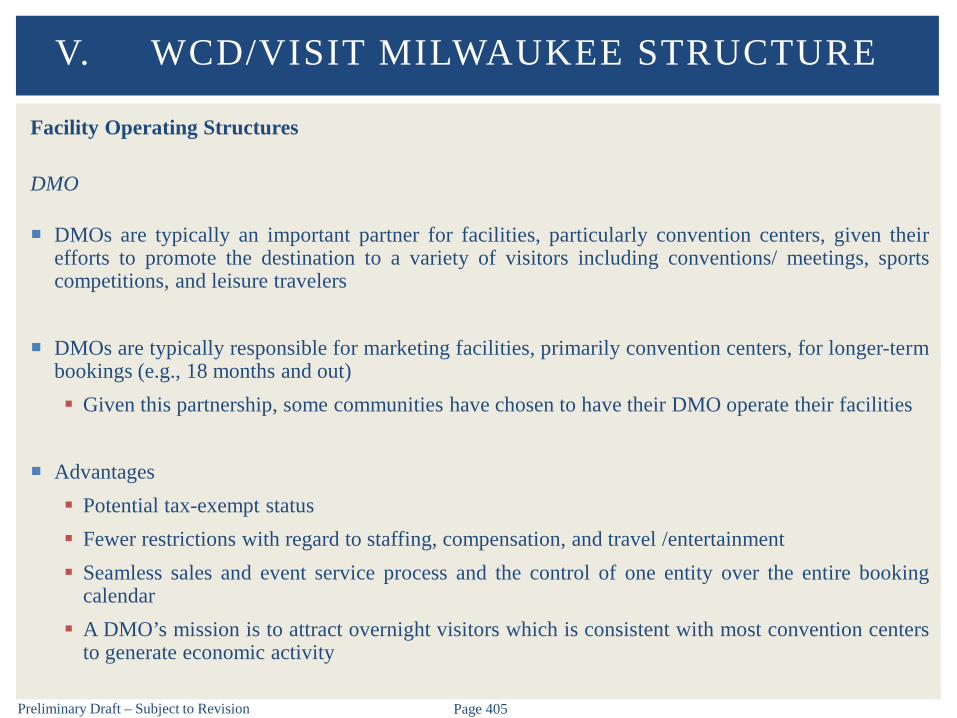
Preliminary Draft – Subject to Revision Page 405
Facility Operating Structures
DMO
DMOs are typically an important partner for facilities, particularly convention centers, given theirefforts to promote the destination to a variety of visitors including conventions/ meetings, sportscompetitions, and leisure travelers
DMOs are typically responsible for marketing facilities, primarily convention centers, for longer-termbookings (e.g., 18 months and out) Given this partnership, some communities have chosen to have their DMO operate their facilities
Advantages Potential tax-exempt status Fewer restrictions with regard to staffing, compensation, and travel /entertainment Seamless sales and event service process and the control of one entity over the entire booking
calendar A DMO’s mission is to attract overnight visitors which is consistent with most convention centers
to generate economic activity
V. WCD/VISIT MILWAUKEE STRUCTURE

Preliminary Draft – Subject to Revision Page 406
Facility Operating Structures
DMO
Disadvantages
Establishing buy-in from the local hotel community who may view the DMO as competing withtheir own sales efforts
An example of this type of management structure is America’s Center Convention Complex in St.Louis which is operated by Explore St. Louis, the areas visitors commission
V. WCD/VISIT MILWAUKEE STRUCTURE

Preliminary Draft – Subject to Revision Page 407
Facility Operating Structure
Third Party Professional Management
There are several professional management companies that operate municipally-owned facilities
Professional management companies can address a variety of needs and issues confronted by publicassembly facilities that, in many cases, result in a more effective and efficient means of operations ascompared to municipally run venues
Typically the management company charges a base fee in addition to a performance or incentive fee -the performance or incentive fee can be capped and is usually tied to producing measurable operatingresults
There is the potential for a conflict for the management team at facilities such as convention centerswhich struggles to balance hosting events that operate at a profit and positively impact the facility’sfinancial performance and hosting events that do not necessarily contribute positive cash flow butgenerate significant economic impact to a community
V. WCD/VISIT MILWAUKEE STRUCTURE

Preliminary Draft – Subject to Revision Page 408
Facility Operating Structure
Third Party Professional Management (continued)
Professional management may be a more effective approach under certain conditions such as when:
Civil service constraints may limit a municipality’s ability to retain and hire qualified personnelthat are experienced in the industry and compensated for their skill set relative to other similarpositions in the industry
Efficient operations may be hampered by strong political influence and operating autonomy isdesired
Municipal constraints make it difficult for facility management to effectively negotiate rates andother concessions and, consequently, the facility may be less competitive with other facilities
Contract approval requirements may be onerous and time consuming in a municipal setting Municipalities have limited funds for significant maintenance requirements and/or capital
improvements to facilities and a professional management company agrees to provide funding aspart of its management agreement
V. WCD/VISIT MILWAUKEE STRUCTURE
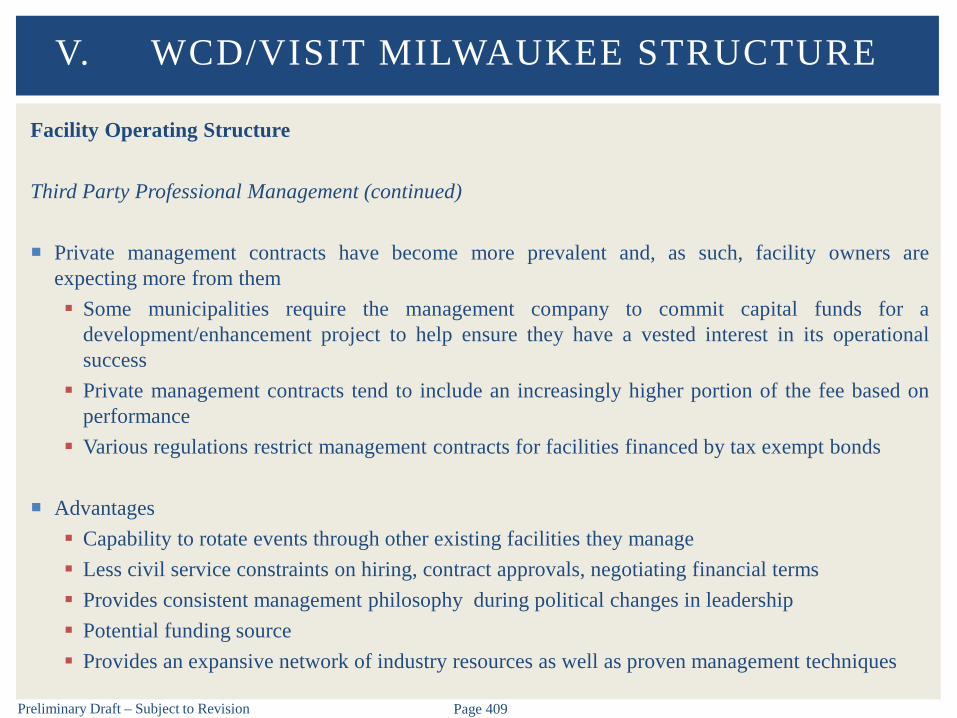
Preliminary Draft – Subject to Revision Page 409
Facility Operating Structure
Third Party Professional Management (continued)
Private management contracts have become more prevalent and, as such, facility owners areexpecting more from them Some municipalities require the management company to commit capital funds for a
development/enhancement project to help ensure they have a vested interest in its operationalsuccess
Private management contracts tend to include an increasingly higher portion of the fee based onperformance
Various regulations restrict management contracts for facilities financed by tax exempt bonds
Advantages Capability to rotate events through other existing facilities they manage Less civil service constraints on hiring, contract approvals, negotiating financial terms Provides consistent management philosophy during political changes in leadership Potential funding source Provides an expansive network of industry resources as well as proven management techniques
V. WCD/VISIT MILWAUKEE STRUCTURE

Preliminary Draft – Subject to Revision Page 410
Facility Operating Structure
Third Party Professional Management (continued)
Disadvantages Balancing event base with generating revenues and/or booking events that drive economic impacts State does not control all aspects of its convention sales function
Examples of privately managed complexes include the DeVos Place Convention Center, Duke EnergyConvention Center, Raising Cane’s River Center, Infinite Energy Center, Iowa Events Center andTucson Convention Center
V. WCD/VISIT MILWAUKEE STRUCTURE
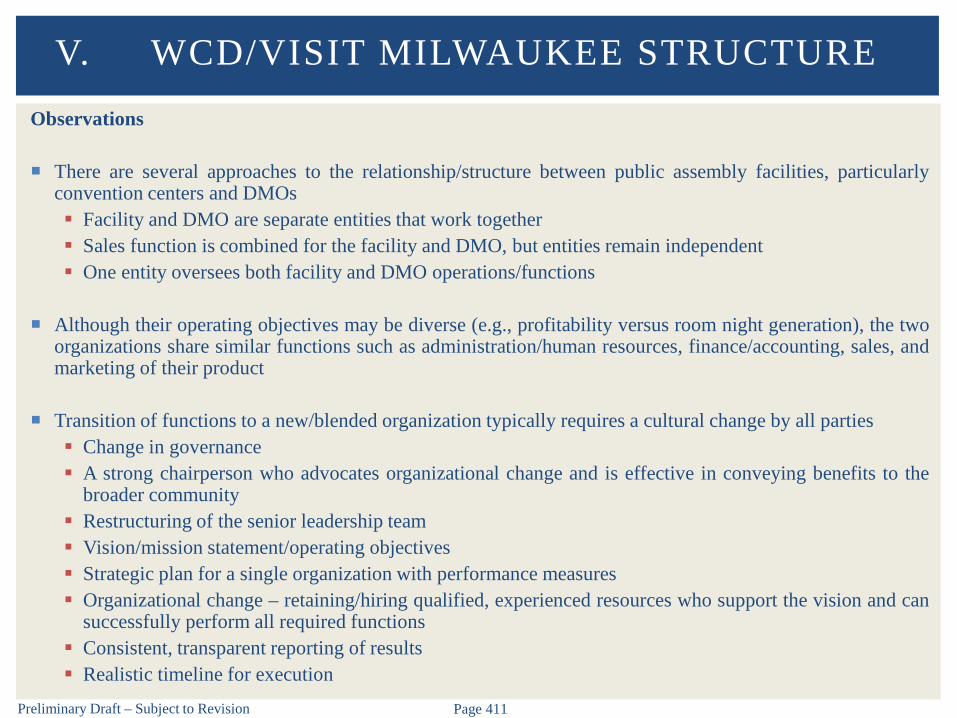
Preliminary Draft – Subject to Revision Page 411
Observations
There are several approaches to the relationship/structure between public assembly facilities, particularlyconvention centers and DMOs Facility and DMO are separate entities that work together Sales function is combined for the facility and DMO, but entities remain independent One entity oversees both facility and DMO operations/functions
Although their operating objectives may be diverse (e.g., profitability versus room night generation), the twoorganizations share similar functions such as administration/human resources, finance/accounting, sales, andmarketing of their product
Transition of functions to a new/blended organization typically requires a cultural change by all parties Change in governance A strong chairperson who advocates organizational change and is effective in conveying benefits to the
broader community Restructuring of the senior leadership team Vision/mission statement/operating objectives Strategic plan for a single organization with performance measures Organizational change – retaining/hiring qualified, experienced resources who support the vision and can
successfully perform all required functions Consistent, transparent reporting of results Realistic timeline for execution
V. WCD/VISIT MILWAUKEE STRUCTURE
VI. FINDINGS AND RECOMMENDATIONS
A. WCD SWOT

Preliminary Draft – Subject to Revision Page 414
General Observations
We have considered trends in the industry (generally) and at the WCD (specifically) in the followingSWOT analysis
The convention, arena, and theater industries appear to have rebounded from the macro economicconditions of most recent recession
Special sales taxes on hotel rooms, prepared food and drinks sold in restaurants and taverns, and carrentals primarily fund debt service, capital projects, VISIT Milwaukee, and certain unrestricted fundsare utilized for WCD operations
WCD is governed by a Board of Directors – Act 60 legislation will modify the composition of theBoard after the construction of the new Bucks arena is completed
WCD is considered generally well managed – potential areas of improvement discussed herein
WCD facilities are well-maintained, but appear somewhat “tired” in their general appearances – acompetitive disadvantage in a highly competitive industry
WCD facilities are generally underutilized Arena utilization expected to improve with addition of Admirals as an anchor tenant
A. WCD SWOT
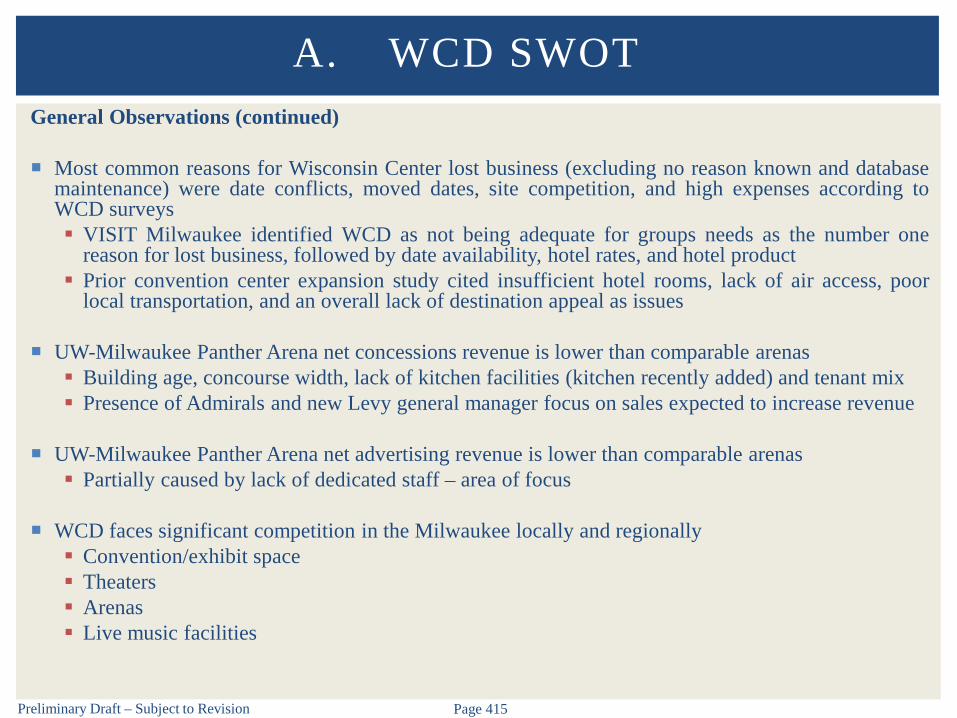
Preliminary Draft – Subject to Revision Page 415
General Observations (continued)
Most common reasons for Wisconsin Center lost business (excluding no reason known and databasemaintenance) were date conflicts, moved dates, site competition, and high expenses according toWCD surveys VISIT Milwaukee identified WCD as not being adequate for groups needs as the number one
reason for lost business, followed by date availability, hotel rates, and hotel product Prior convention center expansion study cited insufficient hotel rooms, lack of air access, poor
local transportation, and an overall lack of destination appeal as issues
UW-Milwaukee Panther Arena net concessions revenue is lower than comparable arenas Building age, concourse width, lack of kitchen facilities (kitchen recently added) and tenant mix Presence of Admirals and new Levy general manager focus on sales expected to increase revenue
UW-Milwaukee Panther Arena net advertising revenue is lower than comparable arenas Partially caused by lack of dedicated staff – area of focus
WCD faces significant competition in the Milwaukee locally and regionally Convention/exhibit space Theaters Arenas Live music facilities
A. WCD SWOT
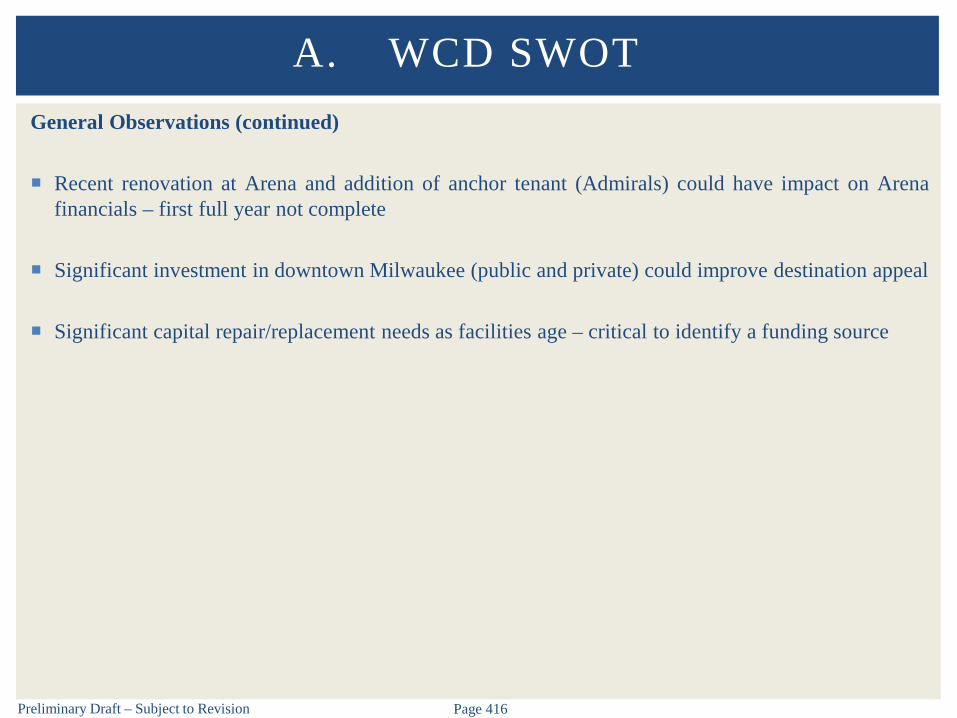
Preliminary Draft – Subject to Revision Page 416
General Observations (continued)
Recent renovation at Arena and addition of anchor tenant (Admirals) could have impact on Arenafinancials – first full year not complete
Significant investment in downtown Milwaukee (public and private) could improve destination appeal
Significant capital repair/replacement needs as facilities age – critical to identify a funding source
A. WCD SWOT
Preliminary Draft – Subject to Revision Page 417
A. WCD SWOT
Threats Weaknesses
Strengths
Opportunities
WCD

Preliminary Draft – Subject to Revision Page 418
Strengths
Well-maintained, clean facilities No deferred maintenance
Engaged, dedicated WCD full-time staff – extensive institutional knowledge Positive customer service surveys from Wisconsin Center users
Facilities are a significant economic generator to the local and State economies
Composition of the WCD Board in terms of diverse representation
Established leisure/hospitality service industry in the Milwaukee market
Location in downtown Milwaukee
Wisconsin Center is connected to several hotels via skywalk
A. WCD SWOT
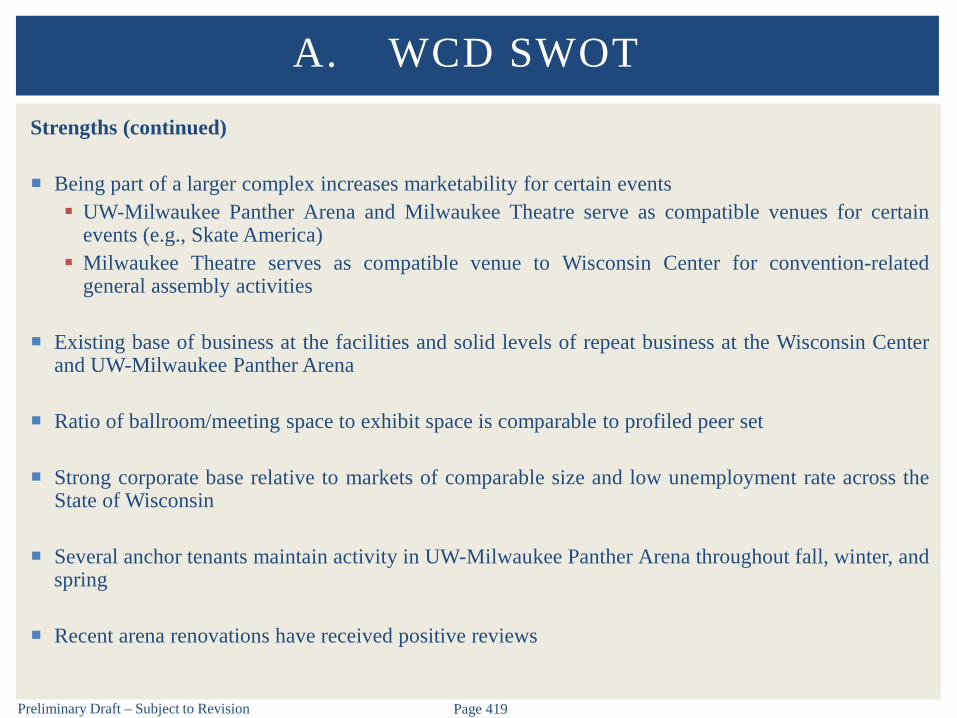
Preliminary Draft – Subject to Revision Page 419
Strengths (continued)
Being part of a larger complex increases marketability for certain events UW-Milwaukee Panther Arena and Milwaukee Theatre serve as compatible venues for certain
events (e.g., Skate America) Milwaukee Theatre serves as compatible venue to Wisconsin Center for convention-related
general assembly activities
Existing base of business at the facilities and solid levels of repeat business at the Wisconsin Centerand UW-Milwaukee Panther Arena
Ratio of ballroom/meeting space to exhibit space is comparable to profiled peer set
Strong corporate base relative to markets of comparable size and low unemployment rate across theState of Wisconsin
Several anchor tenants maintain activity in UW-Milwaukee Panther Arena throughout fall, winter, andspring
Recent arena renovations have received positive reviews
A. WCD SWOT

Preliminary Draft – Subject to Revision Page 420
Strengths (continued)
UW-Milwaukee Panther Arena is the only mid-sized, multi-purpose sports and entertainment arena inthe market
Theatre performance space allows for larger scale events (e.g., Lion King touring Broadway show) Capacity allows upside potential for promoters
Combined lobby and theatre space allows for corporate events that need both spaces without shiftingvenues
A. WCD SWOT
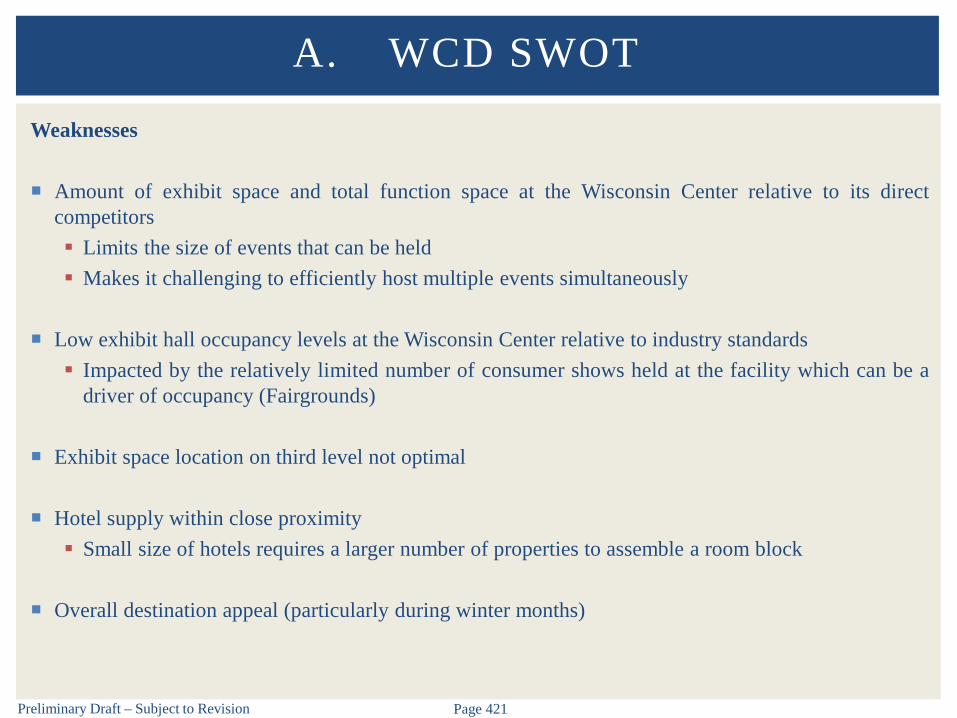
Preliminary Draft – Subject to Revision Page 421
Weaknesses
Amount of exhibit space and total function space at the Wisconsin Center relative to its directcompetitors Limits the size of events that can be held Makes it challenging to efficiently host multiple events simultaneously
Low exhibit hall occupancy levels at the Wisconsin Center relative to industry standards Impacted by the relatively limited number of consumer shows held at the facility which can be a
driver of occupancy (Fairgrounds)
Exhibit space location on third level not optimal
Hotel supply within close proximity Small size of hotels requires a larger number of properties to assemble a room block
Overall destination appeal (particularly during winter months)
A. WCD SWOT
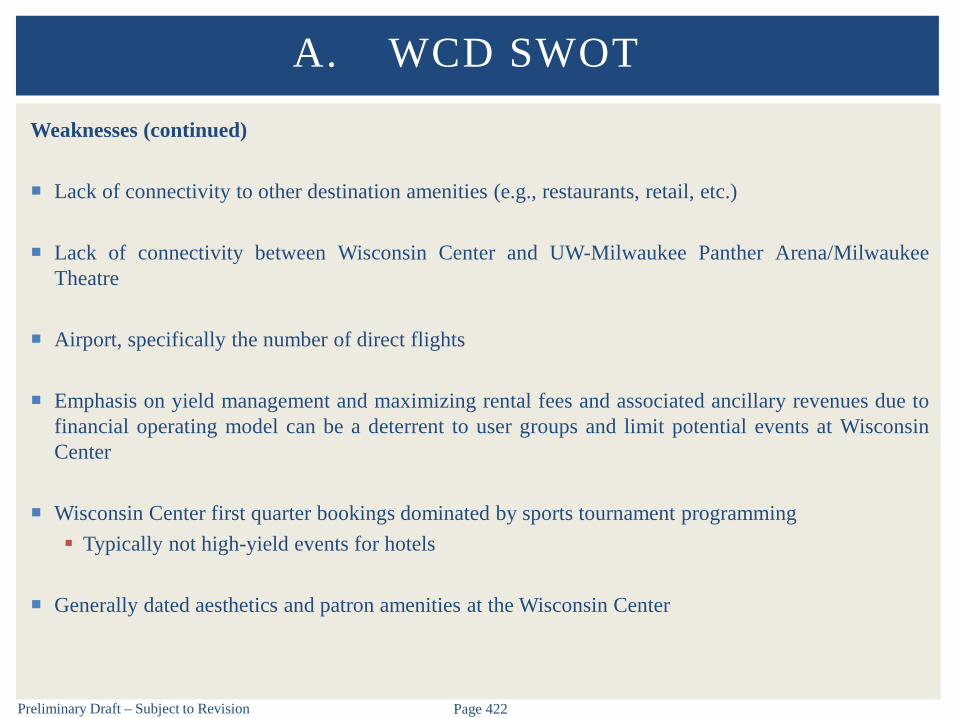
Preliminary Draft – Subject to Revision Page 422
Weaknesses (continued)
Lack of connectivity to other destination amenities (e.g., restaurants, retail, etc.)
Lack of connectivity between Wisconsin Center and UW-Milwaukee Panther Arena/MilwaukeeTheatre
Airport, specifically the number of direct flights
Emphasis on yield management and maximizing rental fees and associated ancillary revenues due tofinancial operating model can be a deterrent to user groups and limit potential events at WisconsinCenter
Wisconsin Center first quarter bookings dominated by sports tournament programming Typically not high-yield events for hotels
Generally dated aesthetics and patron amenities at the Wisconsin Center
A. WCD SWOT

Preliminary Draft – Subject to Revision Page 423
Weaknesses (continued)
Marketing and sales coordination with VISIT Milwaukee
VISIT Milwaukee and WCD operating/financial models determine organizational success utilizingdifferent metrics resulting in inconsistencies and a lack of alignment in marketing/sales efforts
Lack of premium seating inventory limits revenue generating potential in UW-Milwaukee PantherArena (addition of U.S. Bank Club and Ice Box for Admirals games recently added)
Low arena net concessions and advertising revenue relative to comparable facilities
Limited points of sale for arena concessions create long lines even during small events
Arena circulation limited by long concessions lines and narrow concourses
Backstage area at the arena is not up to modern standards
Lack of recognition for the arena and theatre in the music industry at the national level
A. WCD SWOT
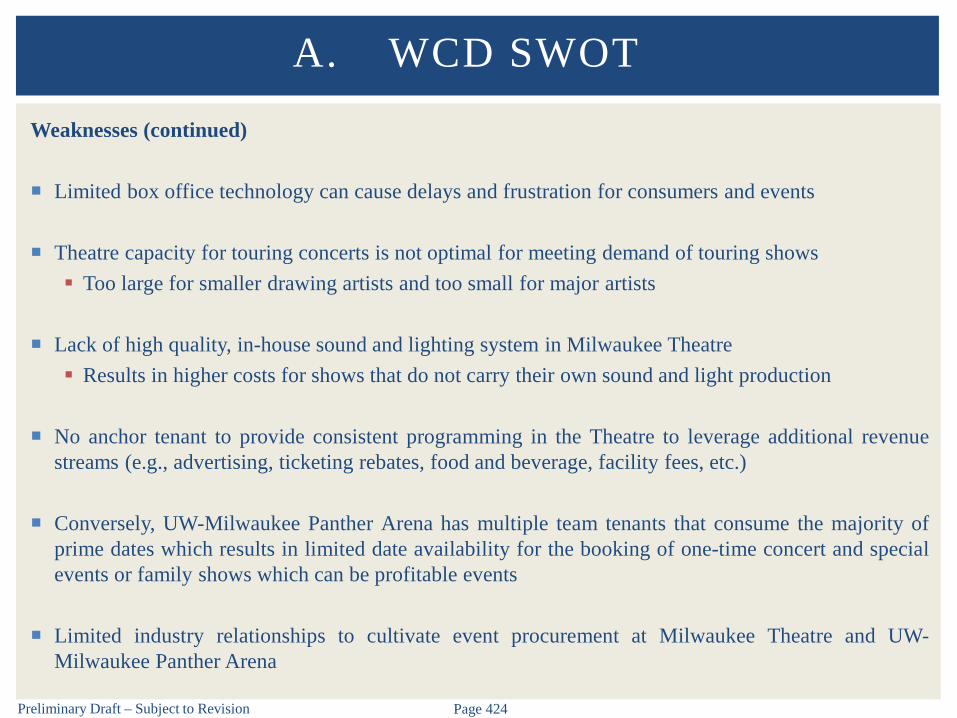
Preliminary Draft – Subject to Revision Page 424
Weaknesses (continued)
Limited box office technology can cause delays and frustration for consumers and events
Theatre capacity for touring concerts is not optimal for meeting demand of touring shows Too large for smaller drawing artists and too small for major artists
Lack of high quality, in-house sound and lighting system in Milwaukee Theatre Results in higher costs for shows that do not carry their own sound and light production
No anchor tenant to provide consistent programming in the Theatre to leverage additional revenuestreams (e.g., advertising, ticketing rebates, food and beverage, facility fees, etc.)
Conversely, UW-Milwaukee Panther Arena has multiple team tenants that consume the majority ofprime dates which results in limited date availability for the booking of one-time concert and specialevents or family shows which can be profitable events
Limited industry relationships to cultivate event procurement at Milwaukee Theatre and UW-Milwaukee Panther Arena
A. WCD SWOT
Preliminary Draft – Subject to Revision Page 425
Weaknesses (continued)
Usher, ticket taking, and food and beverage staff part time at all WCD facilities appear to be efficient,but not consistent or well-trained in guest-focused service that emphasizes a welcoming, friendly, andenergized environment
Overall marketing efforts could be improved Need to be more progressive and evolve with changing industry trends Although this could be enhanced with recent part-time position added, consideration should be
given to increasing marketing staff (see Strategic Recommendations section)
External communication and coordination with key stakeholders could be improved
Number of controlled parking spaces for revenue generating purposes
Lack of formal WCD marketing plan
A. WCD SWOT
Preliminary Draft – Subject to Revision Page 426
Opportunities
Investment in downtown entertainment district with new Bucks arena and Entertainment Projectcreating vibrancy within walkable distance of WCD facilities and hotels and enhancing overalldestination appeal
Infrastructure investment with Milwaukee Streetcar route, Bus Rapid Transit line, and transit Pavilionimmediately adjacent to the Wisconsin Center
Development of 4th and Wisconsin Avenue parcel creating more hotel supply and vibrancy toimmediate vicinity of WCD facilities
Overall value – Milwaukee is among the less expensive destinations when compared to the profiledset of convention center destinations
New Bucks arena could stimulate concert/event market in Milwaukee – market will be on the mindsof promoters/agents Opportunity to enter into strategic relationship with Bucks for booking
A. WCD SWOT
Preliminary Draft – Subject to Revision Page 427
Opportunities (continued)
Renewed efforts to stimulate concert activity through relationship with Venue Coalition andconcentrated efforts with agents and promoters at UW-Milwaukee Panther Arena and MilwaukeeTheatre Booking policies/approach at Milwaukee Theatre resulting from change in management allowed
staff to pursue broader range of events
Addition of South Goal Tap Room to the arena presents an opportunity to create a vibrantenvironment in between hockey periods Direction to Tap Room is currently limited – limited signage to ramp/stairway Video advertisement during Admirals game increased traffic
Lost business reports suggests more groups interested in meeting at Wisconsin Center with animproved physical product and convention quality hotel supply
A. WCD SWOT

Preliminary Draft – Subject to Revision Page 428
Threats
Competitive/comparable convention centers regularly negotiate rental fees WCD’s financial operating model focusing on yield management limits flexibility
Lack of available hotel rooms, particularly during summer months
Competitive supply of convention centers regionally and nationally Competitiveness of the convention/tradeshow and meeting industries predicted to continue to
place financial pressure on facilities
Competitive convention centers continue to improve their physical product and destination attributes
Fairgrounds is able to accommodate larger consumer shows and tradeshows than the WisconsinCenter
Limited available arena dates during tenant seasons
New Bucks arena and ability to modify capacity into smaller configurations could negatively impactUW-Milwaukee Panther Arena ability to attract events
A. WCD SWOT
Preliminary Draft – Subject to Revision Page 429
Threats (continued)
Competitive theater landscape Local and regional theaters with varying and more targeted capacities to better meet demand Local and regional/national promoters that own their own theaters (e.g., Pabst Theater Group and
Madison Square Garden/Chicago Theatre)
Local theaters have production equipment in-house while the Milwaukee Theatre does not, creating acompetitive advantage (e.g., Marcus Center)
Radius clauses for artists may cause them to be contractually prohibited from playing competitivevenues within a certain mileage radius within a certain time frame particularly with festivals (e.g.,Summerfest, Eaux Claires, multiple Chicago festivals)
Consolidation of the live music industry
Concert activity is cyclical and dependent on type and number of acts that tour in any given year
Volatility of general economic conditions
A. WCD SWOT

B. STRATEGIC RECOMMENDATIONS

Preliminary Draft – Subject to Revision Page 431
Overview
The strategic recommendations in this section have been summarized into the following categories
VISIT Milwaukee/WCD Coordination
Food and Beverage
Advertising/Sponsorships
Staffing
Financial Reporting
Utilization
Convention Center Expansion
Other
B. STRATEGIC RECOMMENDATIONS
Preliminary Draft – Subject to Revision Page 432
VISIT Milwaukee/WCD Coordination
Observations
WCD and VISIT Milwaukee have high level goals that do not always align and lead to the same short termobjectives Maintaining facility bottom line (WCD) vs. generating hotel nights (VISIT Milwaukee)
The WCD and VISIT Milwaukee conduct a significant amount of research and produce valuable reportsregarding the visitor industry as a whole and their own organizational performance measurements The reports produced by each organization do not always align
Recommendations
Create joint sales and marketing advisory board for WCD/VISIT Milwaukee to align goals WCD and VISIT Milwaukee to be represented by: Three board members each with experience in convention/hospitality/food and beverage President/CEO from each organization Senior marketing/sales staff (limited) from each organization
Conduct monthly (or quarterly) meetings Consider developing compensation/bonus structure for sales staff at both entities to reward them for
booked room nights and profitable events
B. STRATEGIC RECOMMENDATIONS

Preliminary Draft – Subject to Revision Page 433
VISIT Milwaukee/WCD Coordination
Recommendations (continued)
Jointly develop and adopt a comprehensive strategic plan and marketing strategy WCD management should develop a formal marketing plan and corresponding budget for the
complex as a whole, as well as for each facility that is consistent with joint plan Enhance strategic social media presence
Develop consistent reporting methods between organizations Lost business reports Future bookings/definite room nights Others
Carefully evaluate WCD yield requirements (currently high) and develop an agreed upon formula toevaluate events on an event-by event basis – to be guided by mission statement, booking policies, andcertain eligibility requirements (e.g., event types, seasonality, minimum food/beverage, or otherrevenue requirements)
B. STRATEGIC RECOMMENDATIONS

Preliminary Draft – Subject to Revision Page 434
VISIT Milwaukee/WCD Coordination
Recommendations (continued)
Explore relocating VISIT Milwaukee staff to space within WCD facilities – potential lease/othersavings estimated at $500,000+ Potential savings could be utilized as follows: $100,000 rent to WCD (to offset lost revenue from Wave) $200,000 supplement to opportunity fund Subsidize/reduce rent at Wisconsin Center for events that may not meet WCD yield
requirements $200,000 capital budget reserve fund
Consider broader relationship/operating structure over time based on results of recommendationsabove (e.g., finance, accounting, human resources, information technology, etc.)
B. STRATEGIC RECOMMENDATIONS
Preliminary Draft – Subject to Revision Page 435
Food and Beverage
Observations
Net concessions income at UW-Milwaukee Panther Arena is well below the comparable arena average Partially caused by arena age, historical tenant mix, concourse width, tenant mix, etc. Expected to increase in 2017 with full year of Admirals
Net concessions percentage fluctuates significantly and appears to be below industry average relativeto comparable facilities
Concessionaire contract does not incentivize cost control/WCD net income
Customer survey feedback scores for concessions at the Wisconsin Center have declined in recentyears
Food quality was an issue historically Improvements have been made in this area with addition of new kitchen and new Levy general
manager
B. STRATEGIC RECOMMENDATIONS

Preliminary Draft – Subject to Revision Page 436
Food and Beverage
Recommendations
Carefully observe operating and financial performance for 2017 to observe results with new generalmanager and addition of Admirals
If operating and financial performance does not materially improve in 2017, consider retainingoutside public assembly facility concession specialist to review contract/operations and providerecommendations to maximize revenues and improve customer experience
Consider alternative contract structures when contract expires that incentivize concessionaire tocontrol expenses and maximize margin Ensure concessionaire compensation reflects market conditions – currently above market given
structure and risk profile Contract renewed in April 2015 and expires in June 2018
B. STRATEGIC RECOMMENDATIONS
Preliminary Draft – Subject to Revision Page 437
Food and Beverage
Recommendations (continued)
Receive and review full food and beverage reports monthly showing: Profit and loss statements – total and by individual event Sales broken down by concessions and catering for each event with attendance and per cap for
ticketed events Comparison of actual monthly and year-to-date results to budgeted amounts with an explanation of
deviations
B. STRATEGIC RECOMMENDATIONS

Preliminary Draft – Subject to Revision Page 438
Advertising/Sponsorships
Observations
Advertising/sponsorship revenue are generally below that of comparable facilities, particularly at UW-Milwaukee Panther Arena
Limited staffing dedicated to this area combined with staffing turnover has resulted in significant declines inadvertising/sponsorship revenue WCD is aware of need to address and improve in this area
Recommendations
Increase advertising/sponsorship sales staff with industry specific experience and relationships to increaseadvertising revenues at WCD facilities, particularly at UW-Milwaukee Panther Arena and/or consideralternative approaches Consider retaining third party sports marketing firm to sell inventory at WCD facilities Consider entering into strategic partnership with Bucks selling combined advertising packages for new
arena, real estate development, and WCD facilities, with minimum guarantee and revenue share to WCDfor WCD assets
Consider independent valuation of WCD assets and inventory (existing and potential) by sports marketingfirm (WCD recently retained local firm to conduct similar study)
B. STRATEGIC RECOMMENDATIONS

Preliminary Draft – Subject to Revision Page 439
Staffing
Observations
WCD operates with limited staff relative to peer set
Staff members may be somewhat overextended as result of having to serve multiple functions – maydetract from focus on new industry trends Focus often on completing tasks rather than innovation
Significant amount of institutional knowledge given longevity of many staff members Received feedback from several stakeholders that longevity of staff can foster a culture of
“business as usual” and “that’s the way we have always done things”
Full-time staff does a good job with customer service, hosting events, and other key operational areas
Inconsistency in quality of guest interaction from part time staff
B. STRATEGIC RECOMMENDATIONS
Preliminary Draft – Subject to Revision Page 440
Staffing
Recommendations
Increase staffing levels with experienced personnel with strong relationships in the industry Sales/marketing Research analyst Concerts/entertainment acts Sports tenant relationships and event bids Coordinate with VISIT Milwaukee Sports and Entertainment Manager
Staff should be reflective of the makeup of the community, focused on innovation, and entrepreneurial
A strategy, schedule, and corresponding budget should be developed for staff to have regular access toindustry professional development and continuing education training programs
WCD should continually assess the results of its contracted and in-house services to optimize overallcost/benefit relationships as well as customer service levels Hiring and training practices should be modified to further enhance the guest experience Consider utilizing a third party service for ushers and ticket takers – may provide an opportunity to
recognize cost savings, reduce the hiring burden, and provide more consistent customer service
B. STRATEGIC RECOMMENDATIONS
Preliminary Draft – Subject to Revision Page 441
Financial Reporting
Observations
WCD does not allocate certain non-operating expenses (G&A/overhead)
WCD does not currently allocate all operating revenues and expenses for internal reporting and monitoring –also results in small discrepancy between the sum of each building and the consolidated statement
Under the current methodology, all three WCD facilities appear to operate profitably
Recommendations
Allocate all operating revenues and operating expenses as well as non-operating expenses (G&A/overhead)to all three venues – dedicate resources as appropriate to improve performance
Consider and adopt appropriate allocation methodology (e.g., events, attendance, revenues, expenses, etc.) Methodology could vary by line item – careful evaluation required
Incorporate above approach into P&L for each event
B. STRATEGIC RECOMMENDATIONS
Preliminary Draft – Subject to Revision Page 442
Utilization
Observations
WCD facilities are currently underutilized relative to comparable facilities and complexes – variety offactors contribute to this observation Wisconsin Center – Improved cooperation and communication with VISIT Milwaukee critical UW-Milwaukee Panther Arena – Admirals will improve utilization (concerts an area of concern) Milwaukee Theatre – Although utilization has recently improved, aggressive marketing required
Recommendations
Wisconsin Center See VISIT Milwaukee/WCD Coordination (must be done at Board level) See Staffing recommendations Utilize Board members as resources Improve/expand industry relationships regionally and nationally – internally or through new hires
B. STRATEGIC RECOMMENDATIONS
Preliminary Draft – Subject to Revision Page 443
Utilization
Recommendations (Continued)
UW-Milwaukee Panther Arena Utilize increased staff to aggressively pursue concerts and other high margin events at arena, particularly
during months where schedule is more flexible Continue relationship with Venue Coalition to increase concerts/events Consider booking relationship/cooperation with Bucks to accommodate events
Approach Summerfest (and similar local events) to augment/expand the footprint of those events (e.g.cooperative booking arrangement) (must be done at Board level) Similar to New Orleans Jazz Fest, where events are held throughout New Orleans during the evening WCD staff has approached Summerfest in the past, according to management – opportunities may be
limited given patrons desire to be outdoors during summer months Must consider direct and indirect benefits to both entities
Milwaukee Theatre Continue relationship with Venue Coalition to increase events Curtaining system has provided increased flexibility, although the capacity is still not optimal
Consider/evaluate potential booking relationship with Marcus Center (must be done at Board level) Marcus Center has established operation for front of house, back of house, ticketing, sales and
marketing, and regional/national relationships with industry promoters and booking agents WCD staff has approached Marcus Center in the past, according to management
B. STRATEGIC RECOMMENDATIONS

Preliminary Draft – Subject to Revision Page 444
Convention Center Expansion
Observations
Convention center expansion (completion) has been identified by certain stakeholders as a key issue
Previous convention center expansion study (2013/2014) concluded that the Wisconsin Center offered alimited amount of space, particularly exhibit and meeting space, relative to its national competitors
The previous study found that market conditions were generally positive, but many potential users of thebuilding cited that the destination appeal of downtown Milwaukee needed to be improved Issues cited included insufficient hotel rooms, lack of air access, poor local transportation, and an overall
lack of destination appeal
Recommendations
Consider convention center expansion feasibility study to account for changes locally (new Bucks arena andreal estate development, etc.) and nationally Determine the required space to better penetrate target markets Analyze local market conditions and supporting hospitality infrastructure Analyze industry trends that may impact development of additional space Analyze operating data including reasons for lost business Analyze the competitive market in terms of existing/planned convention space and supporting
amenities Conduct surveys/focus groups with meeting planners and other users to understand future space
requirements
B. STRATEGIC RECOMMENDATIONS
Preliminary Draft – Subject to Revision Page 445
Convention Center Expansion
Recommendations (continued)
Refine the building program parameters based on market-driven research Amount/type of space Exhibit Ballroom Meeting Flex
Supporting infrastructure (e.g. hotel supply) Estimate new business that could be generated from expansion – total events and attendance by
type and hotel room nights Estimate impact to financial operations – operating revenues, operating expenses, cash flow
analysis Quantify economic and fiscal impacts – spending, jobs, earnings and tax revenues Identify potential funding sources
B. STRATEGIC RECOMMENDATIONS

Preliminary Draft – Subject to Revision Page 446
Other
Establish capital repair, replacement, and improvement reserve fund Identify dedicated funding source(s) (e.g., potential VISIT Milwaukee lease savings, Wisconsin
Center naming rights, Walk of Fame naming rights)
The 4th and Wisconsin Development will potentially include meeting or other similar space that couldbe utilized in conjunction with the Wisconsin Center – consider Wisconsin Center and market needsin reviewing development proposals
Consider cooperative, joint booking, and operating arrangements with other public assembly facilitiesin the market once operations are stabilized
Add more specific facility related questions to lost business reports
Evaluate debt refinancing opportunities (if any)
Prioritize recommendations included herein
B. STRATEGIC RECOMMENDATIONS

APPENDIX: MARKET DEMOGRAPHICS

Preliminary Draft – Subject to Revision Page 448
Median Comparable Market Demographic OverviewCBSA Designation – Population and Households
Milwaukee is the median market in terms of population and households
APPENDIX: MARKET DEMOGRAPHICS
Team
2016 Population
(000s) Rank
2021 Population
(000s) Rank
Est. % Growth
2016-2021 Rank
2016 Households
(000s) Rank
2021 Households
(000s) Rank
Est. % Growth
2016-2021 RankPortland, OR 2,372.8 1 2,514.1 2 5.80% 10 918.1 2 969.9 2 5.50% 10Orlando, FL 2,371.9 2 2,597.7 1 9.20% 3 873.0 3 950.3 3 8.55% 3Pittsburgh, PA 2,371.2 3 2,381.6 3 0.45% 29 1,016.6 1 1,025.8 1 0.90% 28Sacramento, CA 2,258.2 4 2,369.4 4 4.85% 15 818.4 7 854.4 6 4.30% 16Cincinnati, OH 2,178.4 5 2,236.7 7 2.65% 23 849.3 5 871.9 4 2.65% 22Las Vegas, NV 2,128.9 6 2,301.8 5 7.85% 6 768.2 10 824.9 10 7.20% 6Kansas City, MO 2,098.1 7 2,181.5 8 3.90% 18 820.8 6 851.7 7 3.70% 18Cleveland, OH 2,065.3 8 2,057.3 12 -0.40% 31 861.3 4 863.7 5 0.25% 31Columbus, OH 2,021.8 9 2,130.7 9 5.25% 13 793.8 8 836.4 9 5.25% 14Indianapolis, IN 2,006.0 10 2,116.5 10 5.40% 12 770.8 9 810.1 11 5.00% 15Austin, TX 1,997.0 11 2,272.8 6 13.10% 1 747.6 11 848.2 8 12.80% 1San Jose, CA 1,970.0 12 2,105.5 11 6.70% 8 658.3 13 701.7 13 6.45% 8Nashville, TN 1,837.3 13 2,000.0 13 8.55% 4 703.7 12 762.0 12 8.05% 4Virginia Beach, VA 1,746.9 14 1,809.8 14 3.55% 19 656.3 14 680.1 14 3.55% 19Providence, RI 1,619.9 15 1,642.1 15 1.35% 25 636.0 15 645.7 15 1.50% 25Milwaukee, WI 1,569.1 16 1,584.0 16 0.95% 27 627.5 16 633.5 16 0.95% 27Jacksonville, FL 1,448.6 17 1,551.4 17 6.90% 7 560.0 17 597.8 17 6.55% 7Oklahoma City, OK 1,379.5 18 1,497.7 18 8.30% 5 532.9 18 576.1 18 7.85% 5Memphis, TN 1,371.6 19 1,410.9 20 2.85% 22 510.3 20 524.1 22 2.65% 22Richmond, VA 1,284.2 20 1,356.0 21 5.45% 11 495.7 22 522.8 23 5.35% 12Louisville, KY 1,278.8 21 1,320.9 23 3.25% 21 511.7 19 527.8 20 3.10% 20Raleigh, NC 1,275.1 22 1,416.0 19 10.60% 2 481.2 23 532.1 19 10.15% 2New Orleans, LA 1,265.7 23 1,327.6 22 4.80% 16 498.4 21 526.3 21 5.50% 10Hartford, CT 1,228.5 24 1,241.1 25 1.05% 26 477.4 25 481.4 24 0.85% 29Salt Lake City, UT 1,179.8 25 1,257.2 24 6.40% 9 387.2 29 411.8 29 6.20% 9Birmingham, AL 1,163.5 26 1,193.7 26 2.55% 24 455.0 26 466.5 26 2.50% 24Buffalo, NY 1,133.0 27 1,133.6 27 0.05% 30 477.8 24 480.7 25 0.60% 30Rochester, NY 1,088.9 28 1,095.8 28 0.65% 28 438.2 27 443.5 27 1.20% 26Grand Rapids, MI 1,037.1 29 1,090.8 29 5.05% 14 386.5 30 407.5 30 5.30% 13Tucson, AZ 1,023.1 30 1,057.5 30 3.30% 20 401.6 28 413.5 28 2.90% 21Honolulu, HI 999.8 31 1,041.9 31 4.15% 17 324.0 31 336.9 31 3.90% 17
Average (Ex. Milwaukee, WI) 1,640.0 1,723.7 4.79% 627.7 658.2 4.68%Source: Esri 2016.
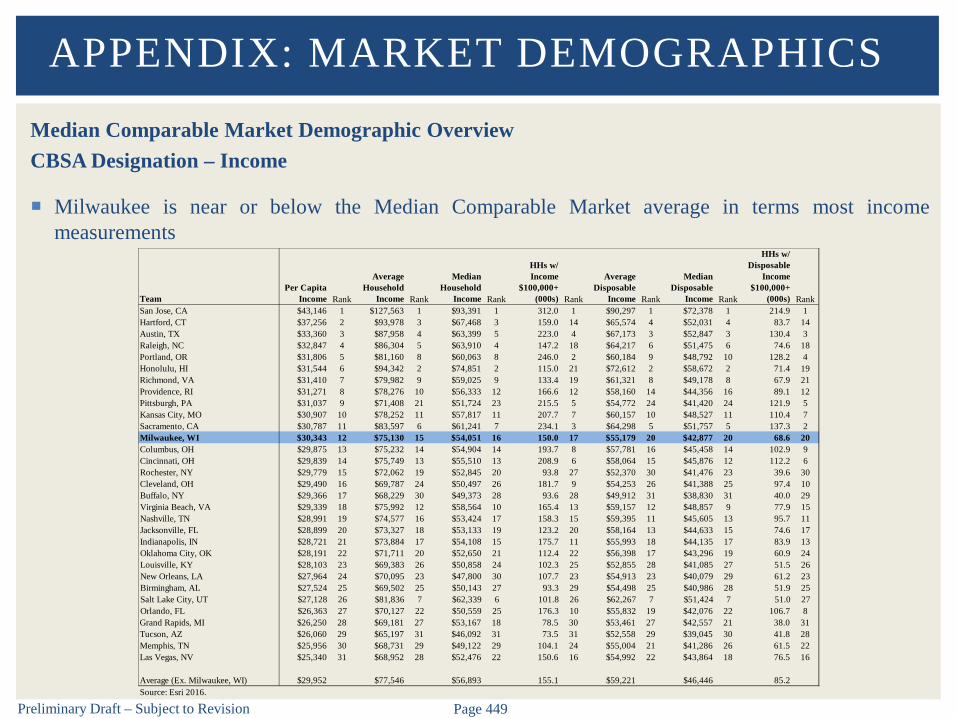
Preliminary Draft – Subject to Revision Page 449
Median Comparable Market Demographic OverviewCBSA Designation – Income
Milwaukee is near or below the Median Comparable Market average in terms most incomemeasurements
APPENDIX: MARKET DEMOGRAPHICS
TeamPer Capita
Income Rank
Average Household
Income Rank
Median Household
Income Rank
HHs w/ Income
$100,000+ (000s) Rank
Average Disposable
Income Rank
Median Disposable
Income Rank
HHs w/ Disposable
Income $100,000+
(000s) RankSan Jose, CA $43,146 1 $127,563 1 $93,391 1 312.0 1 $90,297 1 $72,378 1 214.9 1Hartford, CT $37,256 2 $93,978 3 $67,468 3 159.0 14 $65,574 4 $52,031 4 83.7 14Austin, TX $33,360 3 $87,958 4 $63,399 5 223.0 4 $67,173 3 $52,847 3 130.4 3Raleigh, NC $32,847 4 $86,304 5 $63,910 4 147.2 18 $64,217 6 $51,475 6 74.6 18Portland, OR $31,806 5 $81,160 8 $60,063 8 246.0 2 $60,184 9 $48,792 10 128.2 4Honolulu, HI $31,544 6 $94,342 2 $74,851 2 115.0 21 $72,612 2 $58,672 2 71.4 19Richmond, VA $31,410 7 $79,982 9 $59,025 9 133.4 19 $61,321 8 $49,178 8 67.9 21Providence, RI $31,271 8 $78,276 10 $56,333 12 166.6 12 $58,160 14 $44,356 16 89.1 12Pittsburgh, PA $31,037 9 $71,408 21 $51,724 23 215.5 5 $54,772 24 $41,420 24 121.9 5Kansas City, MO $30,907 10 $78,252 11 $57,817 11 207.7 7 $60,157 10 $48,527 11 110.4 7Sacramento, CA $30,787 11 $83,597 6 $61,241 7 234.1 3 $64,298 5 $51,757 5 137.3 2Milwaukee, WI $30,343 12 $75,130 15 $54,051 16 150.0 17 $55,179 20 $42,877 20 68.6 20Columbus, OH $29,875 13 $75,232 14 $54,904 14 193.7 8 $57,781 16 $45,458 14 102.9 9Cincinnati, OH $29,839 14 $75,749 13 $55,510 13 208.9 6 $58,064 15 $45,876 12 112.2 6Rochester, NY $29,779 15 $72,062 19 $52,845 20 93.8 27 $52,370 30 $41,476 23 39.6 30Cleveland, OH $29,490 16 $69,787 24 $50,497 26 181.7 9 $54,253 26 $41,388 25 97.4 10Buffalo, NY $29,366 17 $68,229 30 $49,373 28 93.6 28 $49,912 31 $38,830 31 40.0 29Virginia Beach, VA $29,339 18 $75,992 12 $58,564 10 165.4 13 $59,157 12 $48,857 9 77.9 15Nashville, TN $28,991 19 $74,577 16 $53,424 17 158.3 15 $59,395 11 $45,605 13 95.7 11Jacksonville, FL $28,899 20 $73,327 18 $53,133 19 123.2 20 $58,164 13 $44,633 15 74.6 17Indianapolis, IN $28,721 21 $73,884 17 $54,108 15 175.7 11 $55,993 18 $44,135 17 83.9 13Oklahoma City, OK $28,191 22 $71,711 20 $52,650 21 112.4 22 $56,398 17 $43,296 19 60.9 24Louisville, KY $28,103 23 $69,383 26 $50,858 24 102.3 25 $52,855 28 $41,085 27 51.5 26New Orleans, LA $27,964 24 $70,095 23 $47,800 30 107.7 23 $54,913 23 $40,079 29 61.2 23Birmingham, AL $27,524 25 $69,502 25 $50,143 27 93.3 29 $54,498 25 $40,986 28 51.9 25Salt Lake City, UT $27,128 26 $81,836 7 $62,339 6 101.8 26 $62,267 7 $51,424 7 51.0 27Orlando, FL $26,363 27 $70,127 22 $50,559 25 176.3 10 $55,832 19 $42,076 22 106.7 8Grand Rapids, MI $26,250 28 $69,181 27 $53,167 18 78.5 30 $53,461 27 $42,557 21 38.0 31Tucson, AZ $26,060 29 $65,197 31 $46,092 31 73.5 31 $52,558 29 $39,045 30 41.8 28Memphis, TN $25,956 30 $68,731 29 $49,122 29 104.1 24 $55,004 21 $41,286 26 61.5 22Las Vegas, NV $25,340 31 $68,952 28 $52,476 22 150.6 16 $54,992 22 $43,864 18 76.5 16
Average (Ex. Milwaukee, WI) $29,952 $77,546 $56,893 155.1 $59,221 $46,446 85.2Source: Esri 2016.
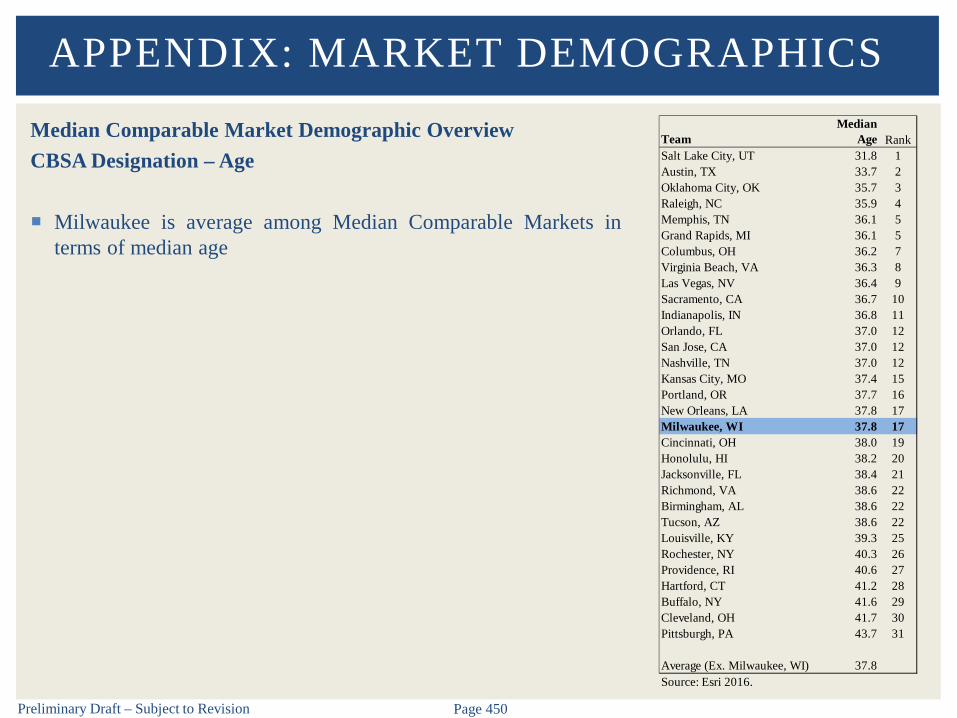
Preliminary Draft – Subject to Revision Page 450
Median Comparable Market Demographic OverviewCBSA Designation – Age
Milwaukee is average among Median Comparable Markets interms of median age
APPENDIX: MARKET DEMOGRAPHICS
TeamMedian
Age RankSalt Lake City, UT 31.8 1Austin, TX 33.7 2Oklahoma City, OK 35.7 3Raleigh, NC 35.9 4Memphis, TN 36.1 5Grand Rapids, MI 36.1 5Columbus, OH 36.2 7Virginia Beach, VA 36.3 8Las Vegas, NV 36.4 9Sacramento, CA 36.7 10Indianapolis, IN 36.8 11Orlando, FL 37.0 12San Jose, CA 37.0 12Nashville, TN 37.0 12Kansas City, MO 37.4 15Portland, OR 37.7 16New Orleans, LA 37.8 17Milwaukee, WI 37.8 17Cincinnati, OH 38.0 19Honolulu, HI 38.2 20Jacksonville, FL 38.4 21Richmond, VA 38.6 22Birmingham, AL 38.6 22Tucson, AZ 38.6 22Louisville, KY 39.3 25Rochester, NY 40.3 26Providence, RI 40.6 27Hartford, CT 41.2 28Buffalo, NY 41.6 29Cleveland, OH 41.7 30Pittsburgh, PA 43.7 31
Average (Ex. Milwaukee, WI) 37.8Source: Esri 2016.

Preliminary Draft – Subject to Revision Page 451
Median Comparable Market Demographic OverviewCBSA Designation – Unemployment
Milwaukee has an unemployment rate lower than theMedian Comparable Market average
APPENDIX: MARKET DEMOGRAPHICS
TeamUnemployment
Rate RankHonolulu, HI 2.7% 1Austin, TX 2.9% 2Grand Rapids, MI 3.1% 3Salt Lake City, UT 3.4% 4Louisville, KY 3.5% 5Indianapolis, IN 3.6% 6San Jose, CA 3.6% 6Nashville, TN 3.6% 6Columbus, OH 3.7% 9Hartford, CT 3.7% 9Raleigh, NC 4.0% 11Milwaukee, WI 4.0% 11Oklahoma City, OK 4.1% 13Richmond, VA 4.1% 13Providence, RI 4.2% 15Portland, OR 4.3% 16Cincinnati, OH 4.3% 16Tucson, AZ 4.3% 16Orlando, FL 4.4% 19Kansas City, MO 4.4% 19Rochester, NY 4.5% 21Virginia Beach, VA 4.6% 22Jacksonville, FL 4.7% 23Sacramento, CA 4.9% 24Cleveland, OH 4.9% 24Buffalo, NY 5.0% 26Pittsburgh, PA 5.1% 27Memphis, TN 5.1% 27Birmingham, AL 5.2% 30Las Vegas, NV 5.1% 27New Orleans, LA 6.2% 31
Average (Ex. Milwaukee, WI) 4.2%Note: BLS defines Unemployment Rate by Metropolitan Area.Source: BLS 2016.

Preliminary Draft – Subject to Revision Page 452
Median Comparable Market Demographic OverviewCBSA Designation – Economy Size (GDP)
Milwaukee is above the Median Comparable Market averagein terms of GDP
APPENDIX: MARKET DEMOGRAPHICS
TeamEconomy Size
(GDP-Billions) RankSan Jose, CA $235.2 1Portland, OR $159.3 2Pittsburgh, PA $138.9 3Indianapolis, IN $134.1 4Cleveland, OH $128.4 5Kansas City, MO $125.6 6Columbus, OH $124.4 7Orlando, FL $121.3 8Cincinnati, OH $120.1 9Sacramento, CA $118.8 10Austin, TX $115.3 11Nashville, TN $113.7 12Milwaukee, WI $102.2 13Virginia Beach, VA $95.7 14Las Vegas, NV $94.5 15Hartford, CT $86.1 16Providence, RI $78.7 17New Orleans, LA $78.5 18Raleigh, NC $75.8 19Salt Lake City, UT $75.7 20Richmond, VA $74.1 21Oklahoma City, OK $72.0 22Memphis, TN $71.3 23Louisville, KY $70.8 24Jacksonville, FL $67.6 25Birmingham, AL $64.1 26Honolulu, HI $61.1 27Buffalo, NY $56.5 28Rochester, NY $55.4 29Grand Rapids, MI $53.9 30Tucson, AZ $36.2 31
Average (Ex. Milwaukee, WI) $96.8Note: GDP is defined by Metropolitan Area.Source: U.S. BEA.

Preliminary Draft – Subject to Revision Page 453
CBSA Designation – Media Market
Milwaukee is below the Median ComparableMarket average in terms of TV population, butabove average in terms of radio population
15th in TV Population
36th in U.S. TV Population
15th in Radio Population
41st in U.S. Radio Population
APPENDIX: MARKET DEMOGRAPHICSMedian Comparable Market Demographic Overview
Team
TV Population
(000s) RankU.S. Rank
Radio Population
(000s) RankU.S. Rank
San Jose, CA 6,580.0 1 5 1,655.0 11 36Sacramento, CA 3,625.5 2 18 1,992.7 3 28Orlando, FL 3,617.3 3 19 1,817.1 7 32Cleveland, OH 3,294.5 4 20 1,774.7 8 33Portland, OR 2,818.5 5 24 2,308.9 1 23Raleigh, NC 2,681.9 6 25 1,546.6 13 38Salt Lake City, UT 2,609.5 7 27 1,885.7 4 29Indianapolis, IN 2,555.4 8 28 1,528.3 14 39Pittsburgh, PA 2,482.1 9 29 2,001.5 2 27Nashville, TN 2,430.4 10 30 1,437.4 16 43Hartford, CT 2,298.7 11 32 1,080.1 23 52Columbus, OH 2,210.0 12 33 1,647.4 12 37Kansas City, MO 2,204.9 13 34 1,720.9 10 35Cincinnati, OH 2,144.0 14 35 1,820.3 6 31Milwaukee, WI 1,985.0 15 36 1,502.5 15 41Las Vegas, NV 1,880.3 16 38 1,838.3 5 30Austin, TX 1,867.9 17 39 1,745.3 9 34Grand Rapids, MI 1,738.2 18 41 779.0 31 68Virginia Beach, VA 1,669.3 19 43 1,409.1 18 45Oklahoma City, OK 1,627.0 20 45 1,251.0 21 50Birmingham, AL 1,624.8 21 46 919.4 28 61Jacksonville, FL 1,614.3 22 48 1,267.3 19 48Memphis, TN 1,519.2 23 50 1,120.6 22 51New Orleans, LA 1,505.4 24 51 1,260.1 20 49Louisville, KY 1,498.7 25 52 1,038.7 25 55Providence, RI 1,410.1 26 53 1,410.1 17 44Buffalo, NY 1,344.7 27 54 987.0 26 57Richmond, VA 1,316.3 28 56 1,041.4 24 54Honolulu, HI 1,233.7 29 59 858.4 30 63Tucson, AZ 1,015.7 30 67 872.5 29 62Rochester, NY 936.4 31 78 966.2 27 58
Average (Ex. Milwaukee, WI) 2,178.5 1,432.7Note: TV market data represents the respective DMAs.Source: Nielsen 2016.
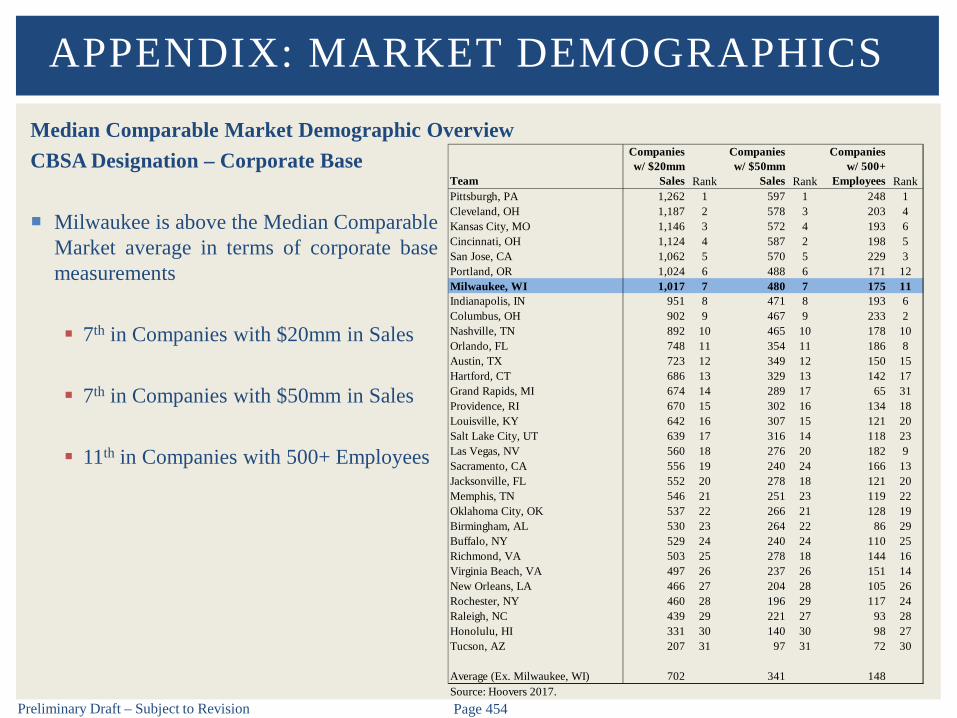
Preliminary Draft – Subject to Revision Page 454
CBSA Designation – Corporate Base
Milwaukee is above the Median ComparableMarket average in terms of corporate basemeasurements
7th in Companies with $20mm in Sales
7th in Companies with $50mm in Sales
11th in Companies with 500+ Employees
APPENDIX: MARKET DEMOGRAPHICSMedian Comparable Market Demographic Overview
Team
Companies w/ $20mm
Sales Rank
Companies w/ $50mm
Sales Rank
Companies w/ 500+
Employees RankPittsburgh, PA 1,262 1 597 1 248 1Cleveland, OH 1,187 2 578 3 203 4Kansas City, MO 1,146 3 572 4 193 6Cincinnati, OH 1,124 4 587 2 198 5San Jose, CA 1,062 5 570 5 229 3Portland, OR 1,024 6 488 6 171 12Milwaukee, WI 1,017 7 480 7 175 11Indianapolis, IN 951 8 471 8 193 6Columbus, OH 902 9 467 9 233 2Nashville, TN 892 10 465 10 178 10Orlando, FL 748 11 354 11 186 8Austin, TX 723 12 349 12 150 15Hartford, CT 686 13 329 13 142 17Grand Rapids, MI 674 14 289 17 65 31Providence, RI 670 15 302 16 134 18Louisville, KY 642 16 307 15 121 20Salt Lake City, UT 639 17 316 14 118 23Las Vegas, NV 560 18 276 20 182 9Sacramento, CA 556 19 240 24 166 13Jacksonville, FL 552 20 278 18 121 20Memphis, TN 546 21 251 23 119 22Oklahoma City, OK 537 22 266 21 128 19Birmingham, AL 530 23 264 22 86 29Buffalo, NY 529 24 240 24 110 25Richmond, VA 503 25 278 18 144 16Virginia Beach, VA 497 26 237 26 151 14New Orleans, LA 466 27 204 28 105 26Rochester, NY 460 28 196 29 117 24Raleigh, NC 439 29 221 27 93 28Honolulu, HI 331 30 140 30 98 27Tucson, AZ 207 31 97 31 72 30
Average (Ex. Milwaukee, WI) 702 341 148Source: Hoovers 2017.
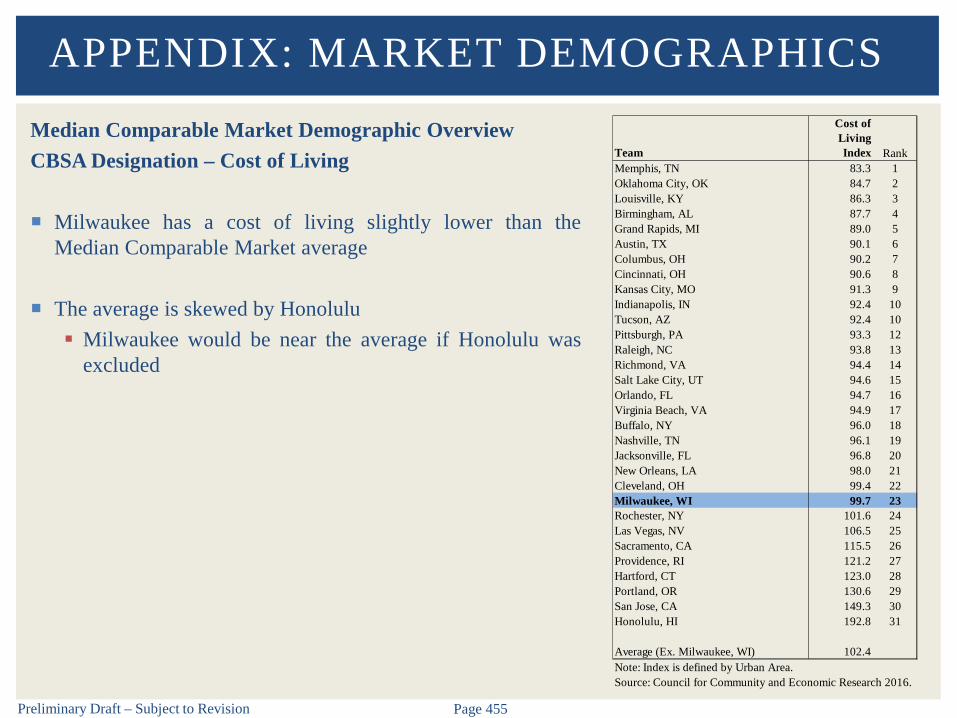
Preliminary Draft – Subject to Revision Page 455
Median Comparable Market Demographic OverviewCBSA Designation – Cost of Living
Milwaukee has a cost of living slightly lower than theMedian Comparable Market average
The average is skewed by Honolulu Milwaukee would be near the average if Honolulu was
excluded
APPENDIX: MARKET DEMOGRAPHICS
Team
Cost of Living Index Rank
Memphis, TN 83.3 1Oklahoma City, OK 84.7 2Louisville, KY 86.3 3Birmingham, AL 87.7 4Grand Rapids, MI 89.0 5Austin, TX 90.1 6Columbus, OH 90.2 7Cincinnati, OH 90.6 8Kansas City, MO 91.3 9Indianapolis, IN 92.4 10Tucson, AZ 92.4 10Pittsburgh, PA 93.3 12Raleigh, NC 93.8 13Richmond, VA 94.4 14Salt Lake City, UT 94.6 15Orlando, FL 94.7 16Virginia Beach, VA 94.9 17Buffalo, NY 96.0 18Nashville, TN 96.1 19Jacksonville, FL 96.8 20New Orleans, LA 98.0 21Cleveland, OH 99.4 22Milwaukee, WI 99.7 23Rochester, NY 101.6 24Las Vegas, NV 106.5 25Sacramento, CA 115.5 26Providence, RI 121.2 27Hartford, CT 123.0 28Portland, OR 130.6 29San Jose, CA 149.3 30Honolulu, HI 192.8 31
Average (Ex. Milwaukee, WI) 102.4
Source: Council for Community and Economic Research 2016.Note: Index is defined by Urban Area.
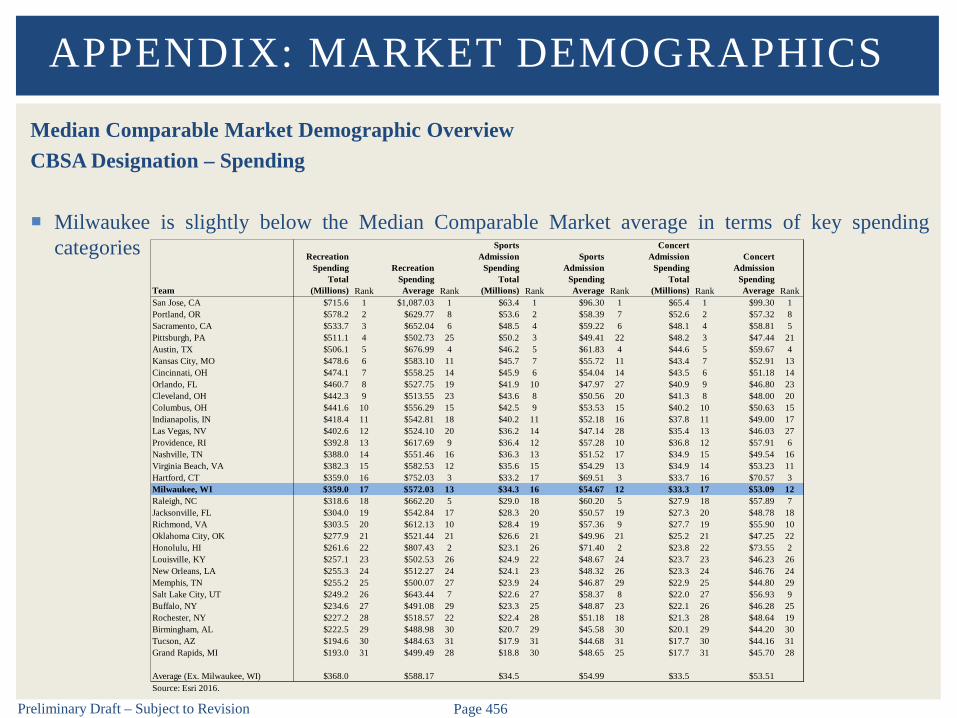
Preliminary Draft – Subject to Revision Page 456
Median Comparable Market Demographic OverviewCBSA Designation – Spending
Milwaukee is slightly below the Median Comparable Market average in terms of key spendingcategories
APPENDIX: MARKET DEMOGRAPHICS
Team
Recreation Spending
Total (Millions) Rank
Recreation Spending Average Rank
Sports Admission
Spending Total
(Millions) Rank
Sports Admission
Spending Average Rank
Concert Admission
Spending Total
(Millions) Rank
Concert Admission
Spending Average Rank
San Jose, CA $715.6 1 $1,087.03 1 $63.4 1 $96.30 1 $65.4 1 $99.30 1Portland, OR $578.2 2 $629.77 8 $53.6 2 $58.39 7 $52.6 2 $57.32 8Sacramento, CA $533.7 3 $652.04 6 $48.5 4 $59.22 6 $48.1 4 $58.81 5Pittsburgh, PA $511.1 4 $502.73 25 $50.2 3 $49.41 22 $48.2 3 $47.44 21Austin, TX $506.1 5 $676.99 4 $46.2 5 $61.83 4 $44.6 5 $59.67 4Kansas City, MO $478.6 6 $583.10 11 $45.7 7 $55.72 11 $43.4 7 $52.91 13Cincinnati, OH $474.1 7 $558.25 14 $45.9 6 $54.04 14 $43.5 6 $51.18 14Orlando, FL $460.7 8 $527.75 19 $41.9 10 $47.97 27 $40.9 9 $46.80 23Cleveland, OH $442.3 9 $513.55 23 $43.6 8 $50.56 20 $41.3 8 $48.00 20Columbus, OH $441.6 10 $556.29 15 $42.5 9 $53.53 15 $40.2 10 $50.63 15Indianapolis, IN $418.4 11 $542.81 18 $40.2 11 $52.18 16 $37.8 11 $49.00 17Las Vegas, NV $402.6 12 $524.10 20 $36.2 14 $47.14 28 $35.4 13 $46.03 27Providence, RI $392.8 13 $617.69 9 $36.4 12 $57.28 10 $36.8 12 $57.91 6Nashville, TN $388.0 14 $551.46 16 $36.3 13 $51.52 17 $34.9 15 $49.54 16Virginia Beach, VA $382.3 15 $582.53 12 $35.6 15 $54.29 13 $34.9 14 $53.23 11Hartford, CT $359.0 16 $752.03 3 $33.2 17 $69.51 3 $33.7 16 $70.57 3Milwaukee, WI $359.0 17 $572.03 13 $34.3 16 $54.67 12 $33.3 17 $53.09 12Raleigh, NC $318.6 18 $662.20 5 $29.0 18 $60.20 5 $27.9 18 $57.89 7Jacksonville, FL $304.0 19 $542.84 17 $28.3 20 $50.57 19 $27.3 20 $48.78 18Richmond, VA $303.5 20 $612.13 10 $28.4 19 $57.36 9 $27.7 19 $55.90 10Oklahoma City, OK $277.9 21 $521.44 21 $26.6 21 $49.96 21 $25.2 21 $47.25 22Honolulu, HI $261.6 22 $807.43 2 $23.1 26 $71.40 2 $23.8 22 $73.55 2Louisville, KY $257.1 23 $502.53 26 $24.9 22 $48.67 24 $23.7 23 $46.23 26New Orleans, LA $255.3 24 $512.27 24 $24.1 23 $48.32 26 $23.3 24 $46.76 24Memphis, TN $255.2 25 $500.07 27 $23.9 24 $46.87 29 $22.9 25 $44.80 29Salt Lake City, UT $249.2 26 $643.44 7 $22.6 27 $58.37 8 $22.0 27 $56.93 9Buffalo, NY $234.6 27 $491.08 29 $23.3 25 $48.87 23 $22.1 26 $46.28 25Rochester, NY $227.2 28 $518.57 22 $22.4 28 $51.18 18 $21.3 28 $48.64 19Birmingham, AL $222.5 29 $488.98 30 $20.7 29 $45.58 30 $20.1 29 $44.20 30Tucson, AZ $194.6 30 $484.63 31 $17.9 31 $44.68 31 $17.7 30 $44.16 31Grand Rapids, MI $193.0 31 $499.49 28 $18.8 30 $48.65 25 $17.7 31 $45.70 28
Average (Ex. Milwaukee, WI) $368.0 $588.17 $34.5 $54.99 $33.5 $53.51Source: Esri 2016.
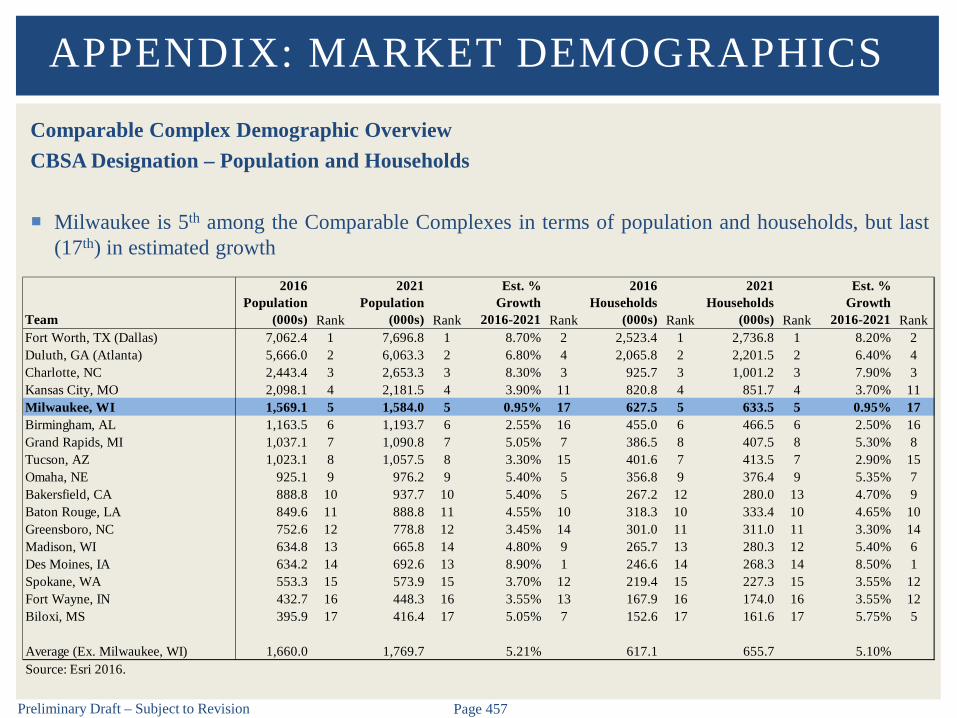
Preliminary Draft – Subject to Revision Page 457
Comparable Complex Demographic OverviewCBSA Designation – Population and Households
Milwaukee is 5th among the Comparable Complexes in terms of population and households, but last(17th) in estimated growth
APPENDIX: MARKET DEMOGRAPHICS
Team
2016 Population
(000s) Rank
2021 Population
(000s) Rank
Est. % Growth
2016-2021 Rank
2016 Households
(000s) Rank
2021 Households
(000s) Rank
Est. % Growth
2016-2021 RankFort Worth, TX (Dallas) 7,062.4 1 7,696.8 1 8.70% 2 2,523.4 1 2,736.8 1 8.20% 2Duluth, GA (Atlanta) 5,666.0 2 6,063.3 2 6.80% 4 2,065.8 2 2,201.5 2 6.40% 4Charlotte, NC 2,443.4 3 2,653.3 3 8.30% 3 925.7 3 1,001.2 3 7.90% 3Kansas City, MO 2,098.1 4 2,181.5 4 3.90% 11 820.8 4 851.7 4 3.70% 11Milwaukee, WI 1,569.1 5 1,584.0 5 0.95% 17 627.5 5 633.5 5 0.95% 17Birmingham, AL 1,163.5 6 1,193.7 6 2.55% 16 455.0 6 466.5 6 2.50% 16Grand Rapids, MI 1,037.1 7 1,090.8 7 5.05% 7 386.5 8 407.5 8 5.30% 8Tucson, AZ 1,023.1 8 1,057.5 8 3.30% 15 401.6 7 413.5 7 2.90% 15Omaha, NE 925.1 9 976.2 9 5.40% 5 356.8 9 376.4 9 5.35% 7Bakersfield, CA 888.8 10 937.7 10 5.40% 5 267.2 12 280.0 13 4.70% 9Baton Rouge, LA 849.6 11 888.8 11 4.55% 10 318.3 10 333.4 10 4.65% 10Greensboro, NC 752.6 12 778.8 12 3.45% 14 301.0 11 311.0 11 3.30% 14Madison, WI 634.8 13 665.8 14 4.80% 9 265.7 13 280.3 12 5.40% 6Des Moines, IA 634.2 14 692.6 13 8.90% 1 246.6 14 268.3 14 8.50% 1Spokane, WA 553.3 15 573.9 15 3.70% 12 219.4 15 227.3 15 3.55% 12Fort Wayne, IN 432.7 16 448.3 16 3.55% 13 167.9 16 174.0 16 3.55% 12Biloxi, MS 395.9 17 416.4 17 5.05% 7 152.6 17 161.6 17 5.75% 5
Average (Ex. Milwaukee, WI) 1,660.0 1,769.7 5.21% 617.1 655.7 5.10%Source: Esri 2016.

Preliminary Draft – Subject to Revision Page 458
Comparable Complex Demographic OverviewCBSA Designation – Income
Milwaukee is above the Comparable Complex average in terms of household income measurements,but below average in terms of disposable income and high income household measurements
APPENDIX: MARKET DEMOGRAPHICS
TeamPer Capita
Income Rank
Average Household
Income Rank
Median Household
Income Rank
HHs w/ Income
$100,000+ (000s) Rank
Average Disposable
Income Rank
Median Disposable
Income Rank
HHs w/ Disposable
Income $100,000+
(000s) RankMadison, WI $33,977 1 $80,577 4 $61,041 2 71.1 11 $58,829 5 $49,974 3 31.9 12Des Moines, IA $32,736 2 $83,547 2 $63,513 1 69.6 12 $62,771 2 $52,129 1 36.4 11Kansas City, MO $30,907 3 $78,252 5 $57,817 5 207.7 4 $60,157 4 $48,527 4 110.4 4Fort Worth, TX (Dallas) $30,905 4 $85,490 1 $60,841 3 726.7 1 $65,756 1 $51,573 2 424.9 1Milwaukee, WI $30,343 5 $75,130 8 $54,051 7 150.0 5 $55,179 9 $42,877 8 68.6 5Duluth, GA (Atlanta) $30,041 6 $81,382 3 $57,792 6 541.2 2 $61,703 3 $48,156 6 317.1 2Omaha, NE $29,612 7 $76,126 7 $57,847 4 88.8 7 $57,895 6 $48,441 5 42.0 7Charlotte, NC $29,206 8 $76,302 6 $53,665 8 219.4 3 $57,541 7 $44,230 7 113.2 3Spokane, WA $27,710 9 $68,281 13 $51,093 11 41.2 15 $54,712 10 $42,627 10 22.8 15Birmingham, AL $27,524 10 $69,502 10 $50,143 13 93.3 6 $54,498 11 $40,986 13 51.9 6Baton Rouge, LA $27,345 11 $71,332 9 $51,341 10 74.8 9 $56,013 8 $42,742 9 40.8 9Grand Rapids, MI $26,250 12 $69,181 11 $53,167 9 78.5 8 $53,461 13 $42,557 11 38.0 10Tucson, AZ $26,060 13 $65,197 15 $46,092 16 73.5 10 $52,558 14 $39,045 16 41.8 8Greensboro, NC $25,681 14 $63,199 16 $43,839 17 50.9 14 $48,829 17 $37,222 17 24.5 14Fort Wayne, IN $25,674 15 $65,510 14 $50,793 12 28.6 16 $50,681 15 $40,826 14 12.7 16Biloxi, MS $23,929 16 $61,033 17 $46,385 15 23.5 17 $49,458 16 $39,296 15 12.5 17Bakersfield, CA $21,178 17 $68,628 12 $49,123 14 55.3 13 $54,228 12 $41,804 12 30.4 13
Average (Ex. Milwaukee, WI) $28,046 $72,721 $53,406 152.8 $56,193 $44,383 84.5Source: Esri 2016.
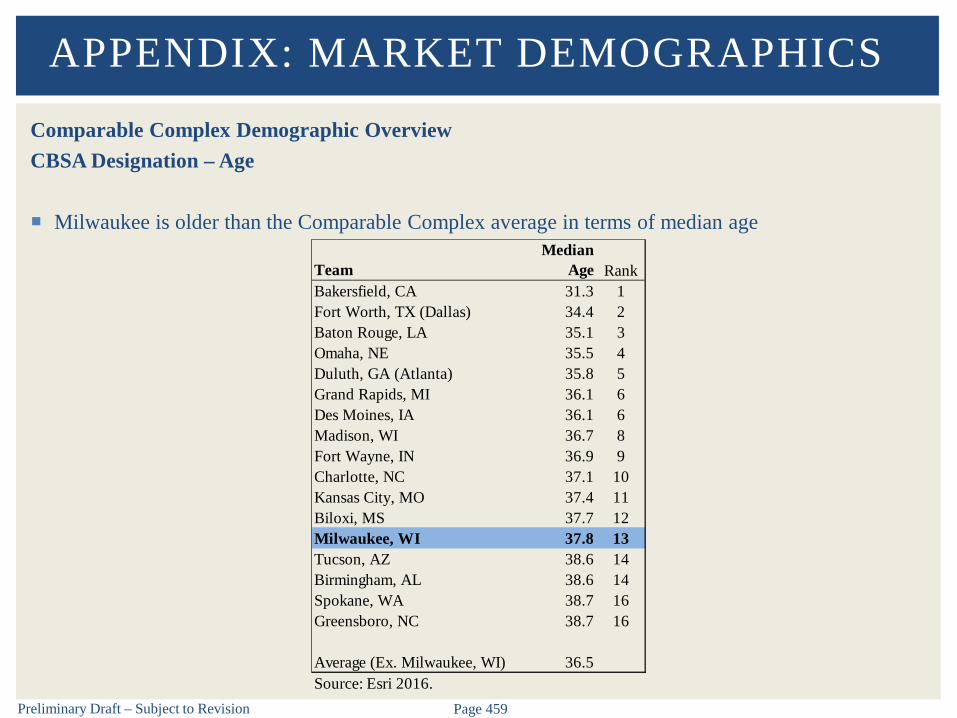
Preliminary Draft – Subject to Revision Page 459
Comparable Complex Demographic OverviewCBSA Designation – Age
Milwaukee is older than the Comparable Complex average in terms of median age
APPENDIX: MARKET DEMOGRAPHICS
TeamMedian
Age RankBakersfield, CA 31.3 1Fort Worth, TX (Dallas) 34.4 2Baton Rouge, LA 35.1 3Omaha, NE 35.5 4Duluth, GA (Atlanta) 35.8 5Grand Rapids, MI 36.1 6Des Moines, IA 36.1 6Madison, WI 36.7 8Fort Wayne, IN 36.9 9Charlotte, NC 37.1 10Kansas City, MO 37.4 11Biloxi, MS 37.7 12Milwaukee, WI 37.8 13Tucson, AZ 38.6 14Birmingham, AL 38.6 14Spokane, WA 38.7 16Greensboro, NC 38.7 16
Average (Ex. Milwaukee, WI) 36.5Source: Esri 2016.
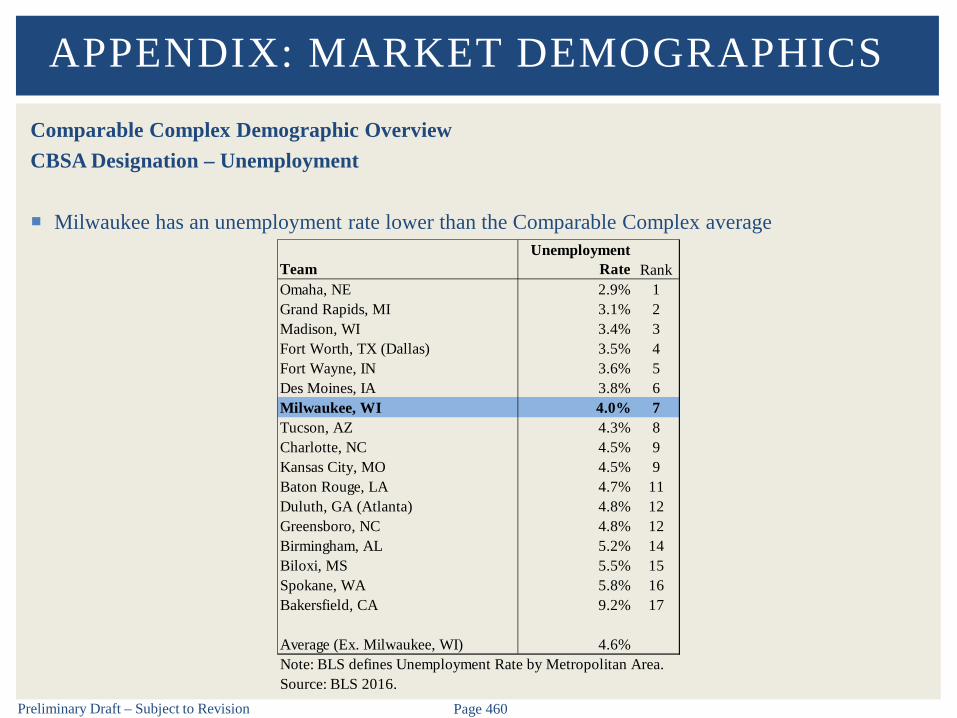
Preliminary Draft – Subject to Revision Page 460
Comparable Complex Demographic OverviewCBSA Designation – Unemployment
Milwaukee has an unemployment rate lower than the Comparable Complex average
APPENDIX: MARKET DEMOGRAPHICS
TeamUnemployment
Rate RankOmaha, NE 2.9% 1Grand Rapids, MI 3.1% 2Madison, WI 3.4% 3Fort Worth, TX (Dallas) 3.5% 4Fort Wayne, IN 3.6% 5Des Moines, IA 3.8% 6Milwaukee, WI 4.0% 7Tucson, AZ 4.3% 8Charlotte, NC 4.5% 9Kansas City, MO 4.5% 9Baton Rouge, LA 4.7% 11Duluth, GA (Atlanta) 4.8% 12Greensboro, NC 4.8% 12Birmingham, AL 5.2% 14Biloxi, MS 5.5% 15Spokane, WA 5.8% 16Bakersfield, CA 9.2% 17
Average (Ex. Milwaukee, WI) 4.6%Note: BLS defines Unemployment Rate by Metropolitan Area.Source: BLS 2016.
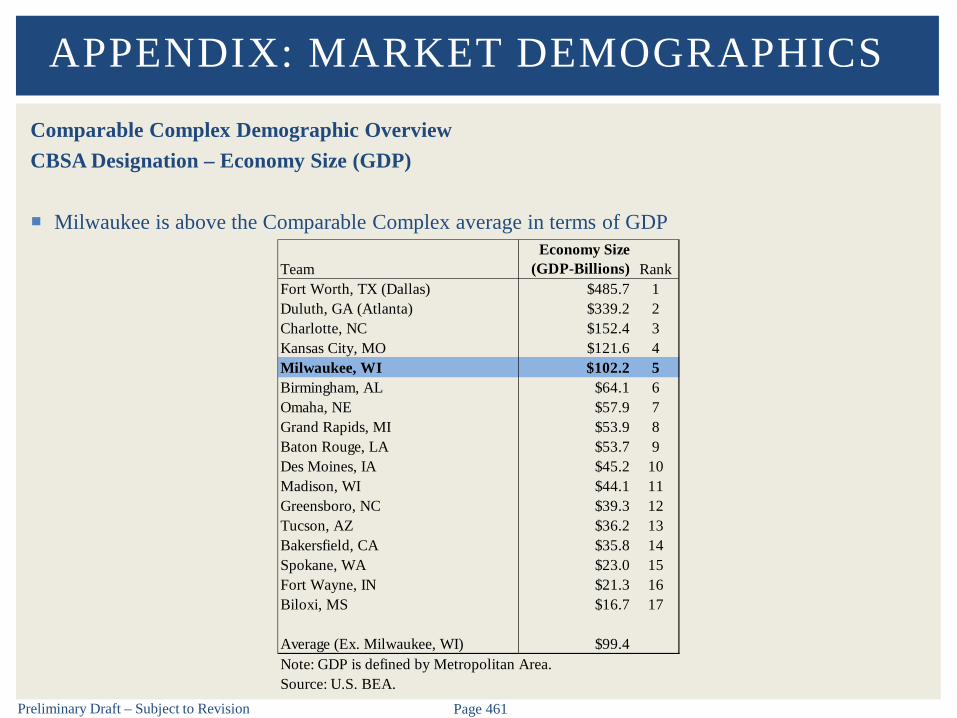
Preliminary Draft – Subject to Revision Page 461
Comparable Complex Demographic OverviewCBSA Designation – Economy Size (GDP)
Milwaukee is above the Comparable Complex average in terms of GDP
APPENDIX: MARKET DEMOGRAPHICS
TeamEconomy Size
(GDP-Billions) RankFort Worth, TX (Dallas) $485.7 1Duluth, GA (Atlanta) $339.2 2Charlotte, NC $152.4 3Kansas City, MO $121.6 4Milwaukee, WI $102.2 5Birmingham, AL $64.1 6Omaha, NE $57.9 7Grand Rapids, MI $53.9 8Baton Rouge, LA $53.7 9Des Moines, IA $45.2 10Madison, WI $44.1 11Greensboro, NC $39.3 12Tucson, AZ $36.2 13Bakersfield, CA $35.8 14Spokane, WA $23.0 15Fort Wayne, IN $21.3 16Biloxi, MS $16.7 17
Average (Ex. Milwaukee, WI) $99.4Note: GDP is defined by Metropolitan Area.Source: U.S. BEA.
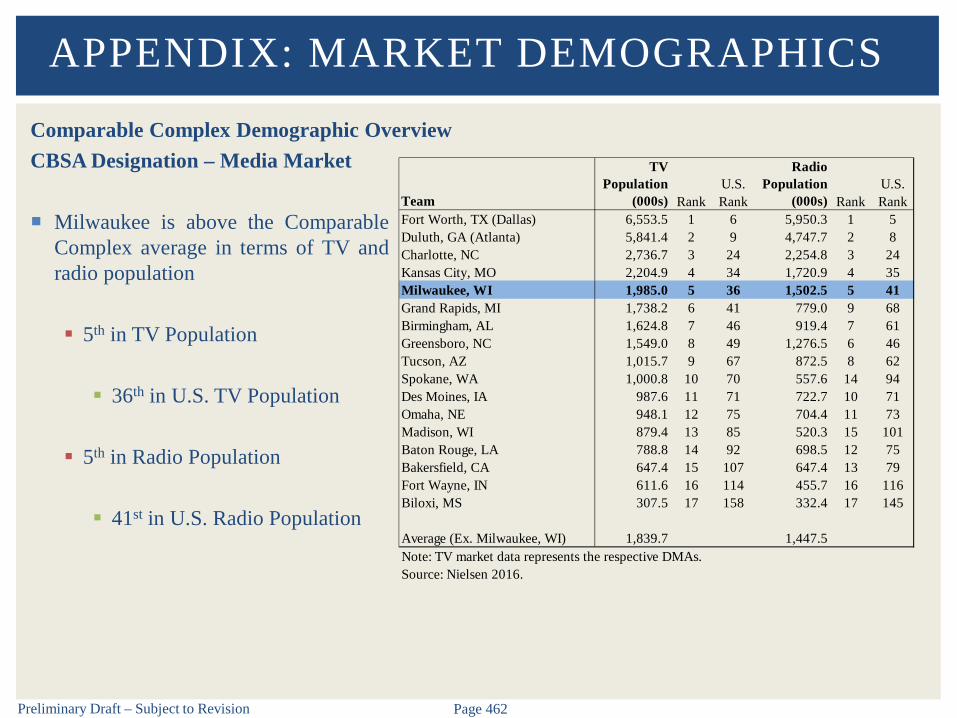
Preliminary Draft – Subject to Revision Page 462
CBSA Designation – Media Market
Milwaukee is above the ComparableComplex average in terms of TV andradio population
5th in TV Population
36th in U.S. TV Population
5th in Radio Population
41st in U.S. Radio Population
APPENDIX: MARKET DEMOGRAPHICS
Team
TV Population
(000s) RankU.S. Rank
Radio Population
(000s) RankU.S. Rank
Fort Worth, TX (Dallas) 6,553.5 1 6 5,950.3 1 5Duluth, GA (Atlanta) 5,841.4 2 9 4,747.7 2 8Charlotte, NC 2,736.7 3 24 2,254.8 3 24Kansas City, MO 2,204.9 4 34 1,720.9 4 35Milwaukee, WI 1,985.0 5 36 1,502.5 5 41Grand Rapids, MI 1,738.2 6 41 779.0 9 68Birmingham, AL 1,624.8 7 46 919.4 7 61Greensboro, NC 1,549.0 8 49 1,276.5 6 46Tucson, AZ 1,015.7 9 67 872.5 8 62Spokane, WA 1,000.8 10 70 557.6 14 94Des Moines, IA 987.6 11 71 722.7 10 71Omaha, NE 948.1 12 75 704.4 11 73Madison, WI 879.4 13 85 520.3 15 101Baton Rouge, LA 788.8 14 92 698.5 12 75Bakersfield, CA 647.4 15 107 647.4 13 79Fort Wayne, IN 611.6 16 114 455.7 16 116Biloxi, MS 307.5 17 158 332.4 17 145
Average (Ex. Milwaukee, WI) 1,839.7 1,447.5Note: TV market data represents the respective DMAs.Source: Nielsen 2016.
Comparable Complex Demographic Overview
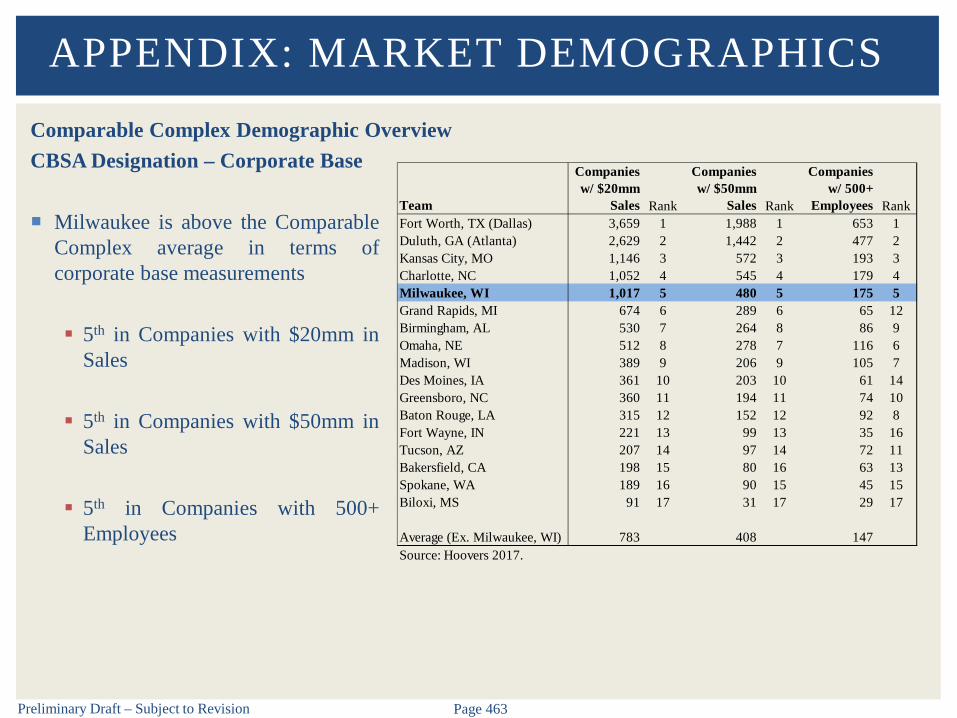
Preliminary Draft – Subject to Revision Page 463
CBSA Designation – Corporate Base
Milwaukee is above the ComparableComplex average in terms ofcorporate base measurements
5th in Companies with $20mm inSales
5th in Companies with $50mm inSales
5th in Companies with 500+Employees
APPENDIX: MARKET DEMOGRAPHICSComparable Complex Demographic Overview
Team
Companies w/ $20mm
Sales Rank
Companies w/ $50mm
Sales Rank
Companies w/ 500+
Employees RankFort Worth, TX (Dallas) 3,659 1 1,988 1 653 1Duluth, GA (Atlanta) 2,629 2 1,442 2 477 2Kansas City, MO 1,146 3 572 3 193 3Charlotte, NC 1,052 4 545 4 179 4Milwaukee, WI 1,017 5 480 5 175 5Grand Rapids, MI 674 6 289 6 65 12Birmingham, AL 530 7 264 8 86 9Omaha, NE 512 8 278 7 116 6Madison, WI 389 9 206 9 105 7Des Moines, IA 361 10 203 10 61 14Greensboro, NC 360 11 194 11 74 10Baton Rouge, LA 315 12 152 12 92 8Fort Wayne, IN 221 13 99 13 35 16Tucson, AZ 207 14 97 14 72 11Bakersfield, CA 198 15 80 16 63 13Spokane, WA 189 16 90 15 45 15Biloxi, MS 91 17 31 17 29 17
Average (Ex. Milwaukee, WI) 783 408 147Source: Hoovers 2017.

Preliminary Draft – Subject to Revision Page 464
Comparable Complex Demographic OverviewCBSA Designation – Cost of Living
Milwaukee has a cost of living higher than the Comparable Complex average
APPENDIX: MARKET DEMOGRAPHICS
Team
Cost of Living Index Rank
Fort Wayne, IN 86.6 1Birmingham, AL 87.7 2Des Moines, IA 88.8 3Grand Rapids, MI 89.0 4Kansas City, MO 91.3 5Omaha, NE 91.6 6Tucson, AZ 92.4 7Charlotte, NC 92.7 8Baton Rouge, LA 94.0 9Fort Worth, TX (Dallas) 97.9 10Duluth, GA (Atlanta) 99.6 11Milwaukee, WI 99.7 12Spokane, WA 100.1 13Madison, WI 106.1 14Bakersfield, CA 107.5 15Biloxi, MS NA NAGreensboro, NC NA NA
Average (Ex. Milwaukee, WI) 94.7
Source: Council for Community and Economic Research 2016.Note: Index is defined by Urban Area.
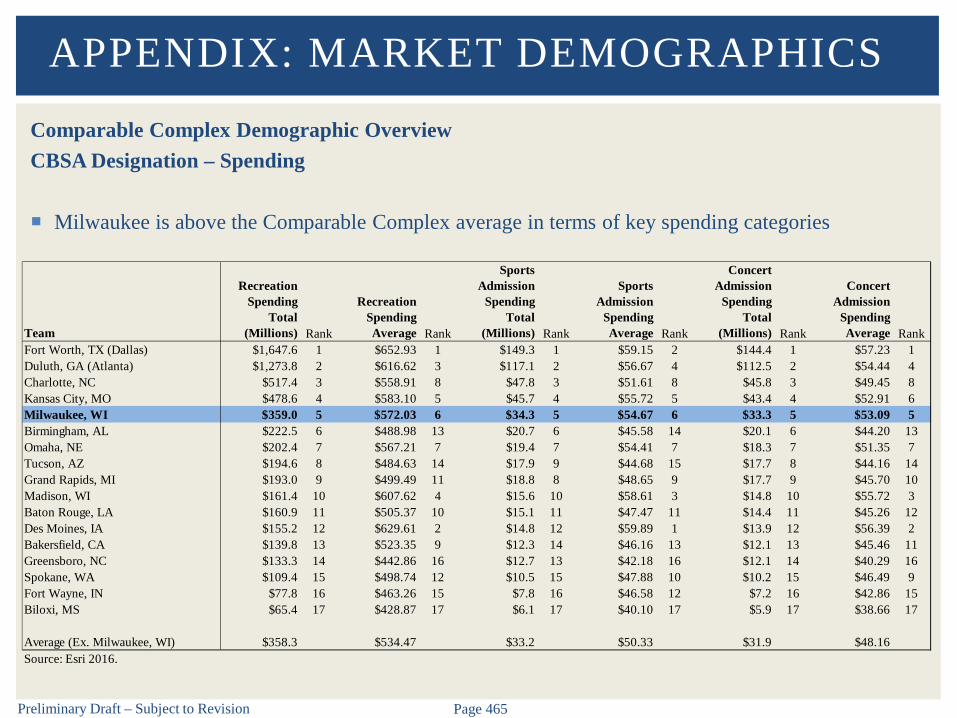
Preliminary Draft – Subject to Revision Page 465
Comparable Complex Demographic OverviewCBSA Designation – Spending
Milwaukee is above the Comparable Complex average in terms of key spending categories
APPENDIX: MARKET DEMOGRAPHICS
Team
Recreation Spending
Total (Millions) Rank
Recreation Spending Average Rank
Sports Admission
Spending Total
(Millions) Rank
Sports Admission
Spending Average Rank
Concert Admission
Spending Total
(Millions) Rank
Concert Admission
Spending Average Rank
Fort Worth, TX (Dallas) $1,647.6 1 $652.93 1 $149.3 1 $59.15 2 $144.4 1 $57.23 1Duluth, GA (Atlanta) $1,273.8 2 $616.62 3 $117.1 2 $56.67 4 $112.5 2 $54.44 4Charlotte, NC $517.4 3 $558.91 8 $47.8 3 $51.61 8 $45.8 3 $49.45 8Kansas City, MO $478.6 4 $583.10 5 $45.7 4 $55.72 5 $43.4 4 $52.91 6Milwaukee, WI $359.0 5 $572.03 6 $34.3 5 $54.67 6 $33.3 5 $53.09 5Birmingham, AL $222.5 6 $488.98 13 $20.7 6 $45.58 14 $20.1 6 $44.20 13Omaha, NE $202.4 7 $567.21 7 $19.4 7 $54.41 7 $18.3 7 $51.35 7Tucson, AZ $194.6 8 $484.63 14 $17.9 9 $44.68 15 $17.7 8 $44.16 14Grand Rapids, MI $193.0 9 $499.49 11 $18.8 8 $48.65 9 $17.7 9 $45.70 10Madison, WI $161.4 10 $607.62 4 $15.6 10 $58.61 3 $14.8 10 $55.72 3Baton Rouge, LA $160.9 11 $505.37 10 $15.1 11 $47.47 11 $14.4 11 $45.26 12Des Moines, IA $155.2 12 $629.61 2 $14.8 12 $59.89 1 $13.9 12 $56.39 2Bakersfield, CA $139.8 13 $523.35 9 $12.3 14 $46.16 13 $12.1 13 $45.46 11Greensboro, NC $133.3 14 $442.86 16 $12.7 13 $42.18 16 $12.1 14 $40.29 16Spokane, WA $109.4 15 $498.74 12 $10.5 15 $47.88 10 $10.2 15 $46.49 9Fort Wayne, IN $77.8 16 $463.26 15 $7.8 16 $46.58 12 $7.2 16 $42.86 15Biloxi, MS $65.4 17 $428.87 17 $6.1 17 $40.10 17 $5.9 17 $38.66 17
Average (Ex. Milwaukee, WI) $358.3 $534.47 $33.2 $50.33 $31.9 $48.16Source: Esri 2016.
LIMITING CONDITIONS AND
ASSUMPTIONS
Preliminary Draft – Subject to Revision Page 467
This analysis is subject to our contractual terms, as well as the following limiting conditions and assumptions:
The analysis has been prepared for internal decision making purposes of the Client only and shall not be used for any other purposeswithout the prior written permission of Barrett Sports Group, LLC.
The analysis includes findings and recommendations; however, all decisions in connection with the implementation of such findingsand recommendations shall be Client’s responsibility.
Ownership and management of the facility are assumed to be in competent and responsible hands. Ownership and management canmaterially impact the findings of this analysis.
Any estimates of historical or future prices, revenues, rents, expenses, occupancy, net operating income, mortgage debt service, capitaloutlays, cash flows, inflation, capitalization rates, yield rates or interest rates are intended solely for analytical purposes and are not tobe construed as predictions of the analysts. They represent only the judgment of the authors based on information provided byoperators and owners active in the market place, and their accuracy is in no way guaranteed.
Our work has been based in part on review and analysis of information provided by unrelated sources which are believed accurate, butcannot be assured to be accurate. No audit or other verification has been completed.
Current and anticipated market conditions are influenced by a large number of external factors. We have not knowingly withheld anypertinent facts, but we do not guarantee that we have knowledge of all factors which might influence the operating potential of theComplex. Due to rapid changes in the external factors, the actual results may vary significantly from estimates presented in this report.
The analysts reserve the right to make such adjustments to the analyses, opinions, and conclusions set forth in this report as may berequired by consideration of additional data or more reliable data which may become available.
The analysis is intended to be read and used as a whole and not in parts. Separation of any section or page from the main body of thereport is expressly forbidden and invalidates the analysis.
Possession of the analysis does not carry with it the right of publication. It shall be used for its intended purpose only and by theparties to whom it is addressed. Other parties should not rely on the findings of this report for any purpose and should perform theirown due diligence.
Our performance of the tasks completed does not constitute an opinion of value or appraisal, or a projection of financial performanceor audit of the Complex in accordance with generally accepted audit standards. Estimates of value (ranges) have been prepared toillustrate current and possible future market conditions.
The analysis shall not be used in any matters pertaining to any financing, or real estate or other securities offering, registration, orexemption with any state or with the federal Securities and Exchange Commission.
No liability is assumed for matters which are legal or environmental in nature.
LIMITING CONDITIONS AND ASSUMPTIONS