wiss, janney, elstner associates, inc. - eden valders · pdf filewiss, janney, elstner...
TRANSCRIPT
Wiss, Janney, Elstner Associates, Inc. 330 Pfingsten Road
Northbrook, Illinois 60062 847.272.7400 tel | 847.291.5189 fax
www.wje.com
Headquarters & Laboratories–Northbrook, Illinois Atlanta | Austin | Boston | Chicago | Cleveland | Dallas | Denver | Detroit | Honolulu | Houston
Los Angeles | Minneapolis | New Haven | New York | Princeton | San Francisco | Seattle | Washington, DC
Via Email & US Mail April 30, 2010 Mr. Pete Roehrig General Manager Valders Stone & Marble 318 West Washington Street Valders WI, 54245 Re: Stone Durability Testing
Chicago Harbors Marina Project WJE No. 2010.0683.0
Dear Mr. Roehrig: Wiss Janney Elstner Associates is pleased to present the following letter summarizing the testing performed on limestone samples provided by Valders Stone. The testing was performed in accordance with the Specification and Test Methods for the Chicago Harbors Marina Project. The testing completed, to date, includes freeze-thaw durability and Los Angeles Abrasion testing. The wetting and drying durability testing is ongoing and has completed a total of 38 cycles. TESTING PROTOCAL
Freeze-Thaw Durability Testing
The freeze-thaw durability testing was performed on five samples, measuring 13” by 15” by 2.5”, in accordance with ASTM D5312, Standard Test Method for Evaluation and Durability of Rock for Erosion Control under Freezing and Thawing Conditions. Prior to testing, the samples were dried to a constant mass, weighed, photographed; and brief petrographic examinations were performed. The samples were cycled 35 times through freezing and thawing at a rate of one cycle per day. During testing, brief visual examinations were performed on a weekly basis to document any distress. At the completion of cycling, the samples were dried to a constant mass; photographs were taken; and final petrographic examinations were completed. The mass loss was calculated by subtracting the final mass from the original mass and dividing by the original mass. Los Angeles Abrasion Testing
Degradation testing was performed on a crushed sample (supplied by Valders) of the limestone in accordance ASTM C535, Standard Test Method for Resistance to Degradation of Large-Size coarse Aggregate by Abrasion and Impact in the Los Angeles Machine. The sample met the “1” grading requirements from Table 1 of ASTM C535 and was subjected to 500 revolutions. The degradation of the aggregate is assessed by measuring the amount of crushed material that passes the No.12 sieve after testing. The percent loss is calculated by subtracting the final mass of material greater than the No.12 sieve from the original mass and dividing by the original mass.

Mr. Pete Roehrig Valders Stone & Marble
April 30, 2010 Page 2
Wetting and Drying Durability Testing
Testing is in progress on five samples, measuring 13” by 15” by 2.5”. The samples are being testing in accordance with ASTM D5313, Standard Test Method for Evaluation of Durability of Rock for Erosion Control under Wetting and Drying Conditions. Similar to the freeze-thaw testing, the samples were dried to a constant mass, weighed, photographed; and brief petrographic examinations were performed. The samples are cycled through wetting and drying at a rate of one cycle per day. TESTING RESULTS
Freeze-Thaw Durability Testing
Prior to freeze-thaw testing, brief petrographic studies were conducted to determine if the stone exhibits characteristics that may adversely affect durability. A report of the studies is presented in Attachment A. At the completion of 35 freeze-thaw cycles, the mass loss of the samples was determined and is presented in the table below. The project specification requires that the mass loss be less than 2 percent after 35 cycles. All of the samples meet this requirement.
Table 1: Freeze-Thaw Mass Loss Results Sample Identification Initial Mass (lbs) Final Mass (lbs) Mass Loss
1 48.35 48.35 0.0% 2 48.90 48.90 0.0% 3 48.55 48.55 0.0% 4 48.55 48.55 0.0% 5 48.65 48.65 0.0%
Brief petrographic studies were conducted on slabs 1 through 5 after 35 cycles of freezing and thawing to determine if the stone exhibits distress. No evidence of distress related to the freeze-thaw testing was observed. Several chipped edges attributed to impact during handling were observed. The post-testing petrographic examinations are presented in Appendix B. Los Angeles Abrasion Testing
The sample loss was calculated to be 18 percent of the original mass. This loss meets the project requirement of a maximum of 20 percent. Wetting and Drying Durability Testing
The samples have completed 38 cycles and have shown no evidence of deterioration. Results of the testing will be supplied upon completion of testing.

Mr. Pete Roehrig Valders Stone & Marble
April 30, 2010 Page 3
We appreciate this opportunity to work with you on this project. Please feel free to contact us with any questions. Sincerely, WISS, JANNEY, ELSTNER ASSOCIATES, INC.
Todd Nelson, P.E. Senior Associate

Mr. Pete Roehrig Valders Stone & Marble
April 30, 2010 Page 4
Attachment A: Petrographic Examinations Prior to Freeze-Thaw Testing
Mr. Pete Roehrig Valders Stone & Marble
April 30, 2010 Page 5
Specimens and Methods
Five stone slabs (Figures 1 through 5) each measuring 13 inches x 15 inches x 2-1/2 inches in thickness were received for examination. The slabs were labeled 1, 2, 3, 4, and 5. The specimens were photographed and then examined visually and at magnifications up to approximately 40X using a stereomicroscope. Petrographic Description
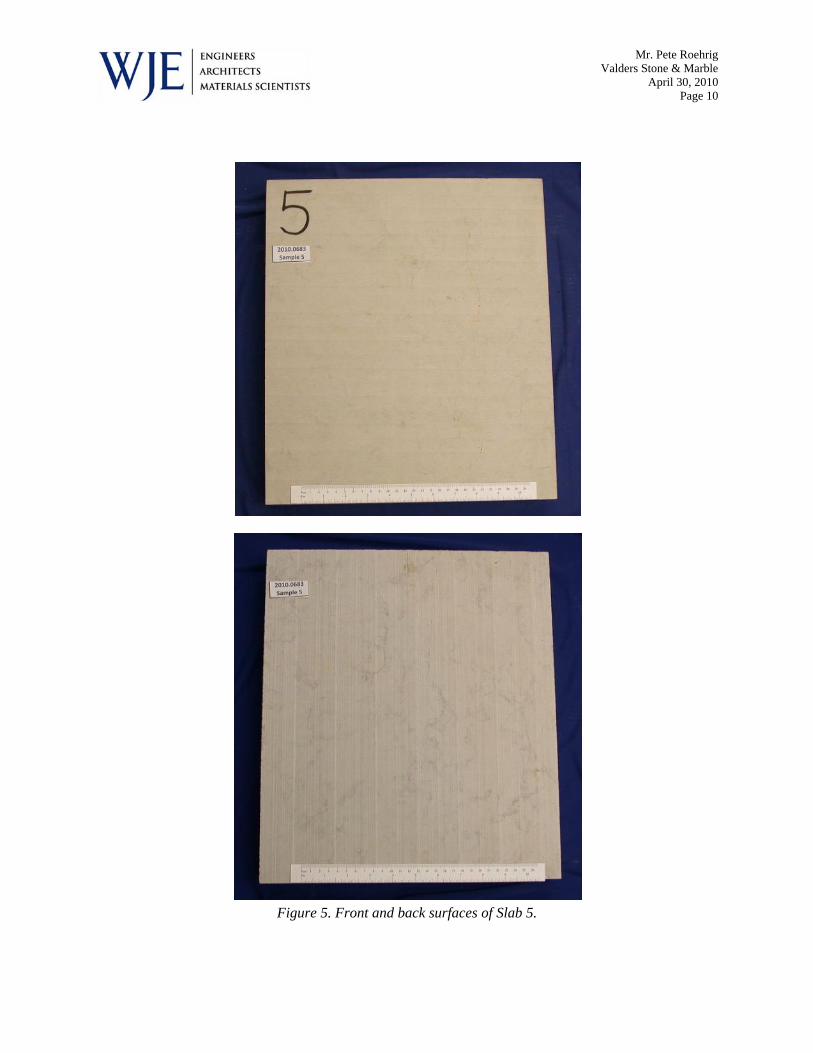
The stone is beige to beige-gray, fine-grained dolomitic limestone. All the specimens contain gray veining that typically occurs as feathery (diffuse), sub-parallel veins up to several inches long. The veins are mostly parallel to the front and back surfaces (Figure 6), but portions of the veins intersect these surfaces and produce random dark mottling of the beige-gray stone. The gray veins do not absorb water more rapidly than the surrounding stone. The stone does not contain prominent bedding planes. No fractures, veins, or stylolites were observed. The stone exhibits fine-scale porosity. No vugs or cavities were observed; however, Slabs 4 and 5 contain a small number of pores up to 0.04 inch in diameter scattered throughout the stone. Slab 3 had been chipped in one location along the back edge prior to examination. Small rust-colored spots and long streaks were observed on some surfaces, possibly caused by saw-cutting or sample handling. Stain-causing minerals such as pyrite were not observed. Chemically and physically unstable materials were not observed.

Mr. Pete Roehrig Valders Stone & Marble
April 30, 2010 Page 6
Figure 1. Front and back surfaces of Slab 1.

Mr. Pete Roehrig Valders Stone & Marble
April 30, 2010 Page 7
Figure 2. Front and back surfaces of Slab 2.

Mr. Pete Roehrig Valders Stone & Marble
April 30, 2010 Page 8
Figure 3. Front and back surface of Slab 3.

Mr. Pete Roehrig Valders Stone & Marble
April 30, 2010 Page 9
Figure 4. Front and back surfaces of Slab 4.
Mr. Pete Roehrig Valders Stone & Marble
April 30, 2010 Page 10
Figure 5. Front and back surfaces of Slab 5.

Mr. Pete Roehrig Valders Stone & Marble
April 30, 2010 Page 11
Figure 6. Oblique view of Slab 3 showing the sub-parallel orientation of gray veins in the beige-gray dolomitic limestone. The surface was moistened prior to being photographed to accentuate the contrast between the veins and the host limestone.

Mr. Pete Roehrig Valders Stone & Marble
April 30, 2010 Page 12
Attachment B: Petrographic Examination after the Completion of Freeze-Thaw Cycling
Mr. Pete Roehrig Valders Stone & Marble
April 30, 2010 Page 13
Five stone slabs have been examined in accordance with the requirements of ASTM D 5212, Standard Practice for Preparation of Rock Slabs for Durability Testing to evaluate the stone at the conclusion of the Freeze-Thaw testing to determine if the stone exhibits evidence of distress. Specimens and Methods
Five stone slabs (Figures 1 through 5) each measuring 13 inches x 15 inches x 2-1/2 inches in thickness were received for examination. The slabs were labeled 1, 2, 3, 4, and 5. The specimens were photographed and then examined visually, at 7X magnification, and at magnifications up to approximately 40X using a stereomicroscope where indicated. Petrographic Observations
Stone represented by the slabs were previously examined and described. The stone is beige to beige-gray, fine-grained dolomitic limestone that exhibits fine-scale porosity and contains gray veining that is mostly parallel to the front and back surfaces. Portions of the veins intersect the surfaces and produce random dark mottling of the beige-gray stone. The stone does not contain prominent bedding planes. No fractures, veins, or stylolites were observed. No vugs or cavities were observed. Slab 3 had been chipped in one location along the back edge prior to initial examination. At the conclusion of testing, chips were observed at slab corners of Slabs 1 and 3. These features appear to represent damage incurred during handling. No evidence of distress related to the freeze-thaw testing was observed. Several chipped edges attributed to impact during handling were observed.

Mr. Pete Roehrig Valders Stone & Marble
April 30, 2010 Page 14
Figure 1. Slab 1 - Top and bottom surfaces at completion of FTtesting.

Mr. Pete Roehrig Valders Stone & Marble
April 30, 2010 Page 15
Figure 2. Slab 2 - Top and bottom surfaces at completion of FT testing.
Mr. Pete Roehrig Valders Stone & Marble
April 30, 2010 Page 16
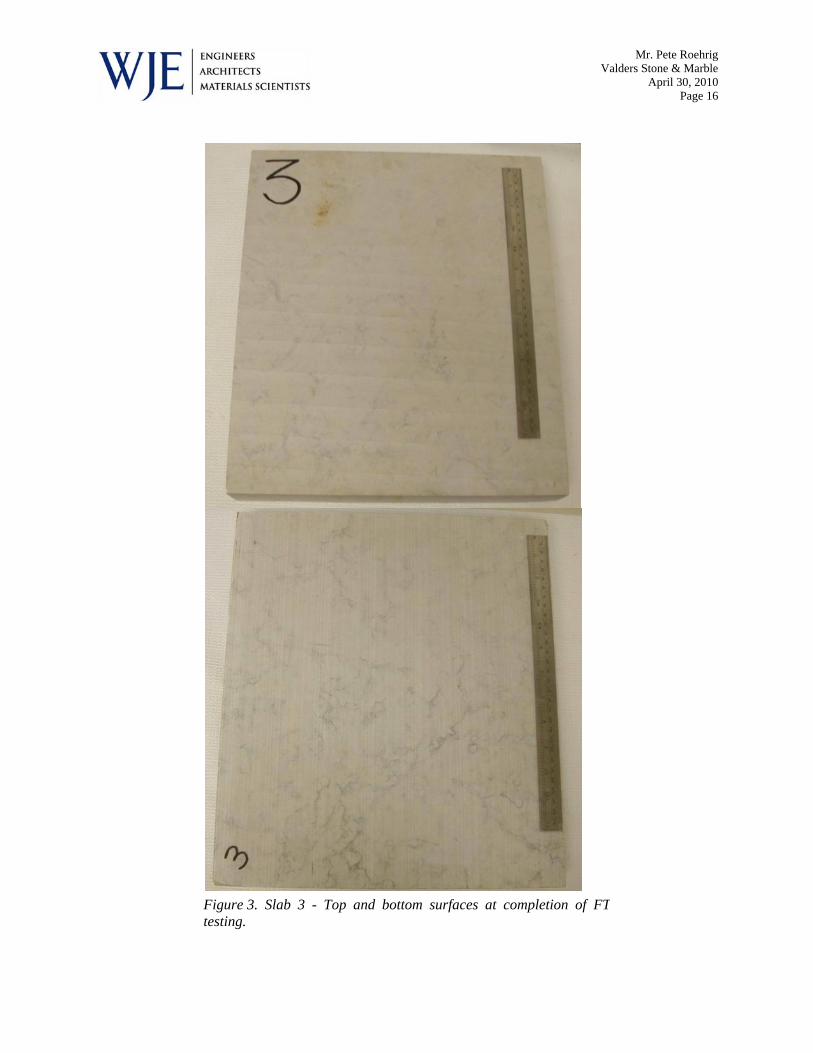
Figure 3. Slab 3 - Top and bottom surfaces at completion of FTtesting.

Mr. Pete Roehrig Valders Stone & Marble
April 30, 2010 Page 17
Figure 4. Slab 4 - Top and bottom surfaces at completion of FTtesting.

Mr. Pete Roehrig Valders Stone & Marble
April 30, 2010 Page 18
Figure 5. Slab 5 - Top and bottom surfaces at completion of FTtesting.

Mr. Pete Roehrig Valders Stone & Marble
April 30, 2010 Page 19
Figure 6. Slab 1- Oblique view of corner showing minor chip (arrow) attributed to handling damage.
Figure 7. Slab 3 - Oblique view of corner showing minor chip (arrow) attributed to handling damage.