wjsf1054-98111540-756xjournal of sustainable forestry, vol
TRANSCRIPT
Journal of Sustainable Forestry, Vol. 26(3) 2008Available online at http://jsf.haworthpress.com
© 2008 by The Haworth Press. All rights reserved.doi:10.1080/10549810701879701 171
WJSF1054-98111540-756XJournal of Sustainable Forestry, Vol. 26, No. 3, Mar 2008: pp. 0–0Journal of Sustainable Forestry
An Exploratory, Post-Harvest Comparison of Ecological and Economic Characteristics of Forest Stewardship Council Certified and
Uncertified Northern Hardwood StandsFoster, Wang, and KeetonJOURNAL OF SUSTAINABLE FORESTRY Bryan C. Foster
Deane WangWilliam S. Keeton
ABSTRACT. As more forest entities worldwide consider pursuing For-est Stewardship Council (FSC) certification, a critical question remains onwhether stand-level management impacts differ between certified anduncertified forests. To begin to answer this question, we measured foreststructure on three FSC-certified stands, three uncertified stands, and sixadjacent unharvested reference stands (12 stands total) composed primarilyof sugar maple (Acer saccharum) on non-industrial private properties in
Bryan C. Foster is a PhD candidate in Natural Resources, Rubenstein Schoolof Environment and Natural Resources, University of Vermont, Burlington,VT 05405 (E-mail: [email protected]).
Deane Wang is Associate Dean and Associate Professor of Ecosystem Ecol-ogy, Rubenstein School of Environment and Natural Resources, University ofVermont, Burlington, VT 05405.
William S. Keeton is Associate Professor of Forest Ecology, Rubenstein Schoolof Environment and Natural Resources, University of Vermont, Burlington,VT 05405.
The Northeastern States Research Cooperative (NSRC) provided funding forthis study. Research was conducted with the assistance of Richard Donovan ofSmartwood, a dozen anonymous forest owners and managers, field assistantsMary Sutton Carruthers and Steffi Gould, and Vermont county foresters JonBouton and David Brynn. Laura Kenefic of the University of Maine providedparticularly valuable comments on a draft of this paper.

172 JOURNAL OF SUSTAINABLE FORESTRY
central Vermont, USA. The certified and uncertified partial harvestsreduced total tree biomass and live tree carbon storage by one-third com-pared to reconstructed pre-harvest conditions. Both treatments alsocontained significantly lower densities of saplings and some mid-size treescompared to non-harvested references due to similar impacts from harvest-ing. The net present value of merchantable sugar maple over 10 year pro-jections was consistently lower on certified than uncertified stands, but thisdifference was insignificant at discount rates from 4–8%. The certifiedstands contained significantly greater total residual volumes of coarsewoody debris (standing and downed) than uncertified stands, although thedebris was smaller than that found in unmanaged mature forests. Overall,our data suggest that FSC-certified harvested stands in northern hardwoodforests have similar sugar maple timber value, aboveground live tree car-bon storage value, similar live tree structure, and greater residual coarsewoody debris than uncertified harvested stands.
KEYWORDS. Forest certification, Forest Stewardship Council (FSC),forest structure, northern hardwoods, sustainable forest management
INTRODUCTION
FSC Certification
Since the 1992 United Nations Commission on Environment and Devel-opment (UNCED) conference, over 150 initiatives on sustainable forestmanagement have developed around the world (Holvoet and Muys, 2004).Many of these initiatives involve the Forest Stewardship Council (FSC), thefirst established international certification program (Sedjo et al., 1998), andthe program most actively promoted by environmental organizations suchas the World Wildlife Fund (WWF). Although FSC-certified forests repre-sent only 5–7% of total productive forest land in North America (over21 million hectares), the certification program has grown rapidly, more than15-fold in a decade from 1996 to 2006 (WWF, 2007).
The voluntary “soft law” of certification protocols theoreticallyinvolves higher standards than the mandatory “hard law” set by govern-ments (Hickey, 2004). Indeed a primary aim of FSC is to implement stan-dards that “make certified management practices better than traditionalpractices” (Cauley et al., 2001). However, empirical studies have not beenconducted to determine whether certified forests yield greater ecologicaland socio-economic benefits than similar uncertified forests. Several

Foster, Wang, and Keeton 173
studies have used auditors’ field reports on preconditions that must be ful-filled prior to certification as evidence of improvement in managementpractices. These studies demonstrated that FSC-certified entities, relativeto their pre-certified condition, improved management plan documenta-tion and monitoring, reduced soil erosion from roads, widened streamsidebuffers, increased coarse woody debris retention, and improved designa-tion and protection of high conservation value forests (Gullison, 2003;Newsom et al., 2006). Yet, neither of these studies showed whether theseimprovements were significant enough to distinguish certified fromuncertified forests in the field.
The economic and ecological benefits of certification seem particularlydifficult to distinguish in the northern hardwood region of the northeast-ern United States (U.S.) where partial harvests (i.e. shelterwood, groupselection, single tree selection, and thinning) are commonly employed toregenerate intermediate and shade-tolerant merchantable tree species.Investigating whether certification has stand-level impacts is particularlyimportant here as high grading or timber mining–selective removal ofcommercially valuable trees on the basis of size, species, and merchant-ability grade–is widely practiced on non-industrial private properties inthe northeastern U.S. (Kittredge et al., 2003). High grading reduces futurestand economic value and homogenizes stand structure (which mayconsequently reduce biodiversity and retard tree regeneration). Ourexploratory study, meant to spur additional research, investigates whethernorthern hardwood stands harvested under FSC standards differ economi-cally and ecologically from similar uncertified stands.
Study Approach
The objective of our study was to compare the economic and ecologicalconditions of recently harvested stands on FSC-certified propertiesagainst uncertified harvested stands. We chose to focus on the stand spatialscale because it remains the primary scale for silvicultural applications(Smith et al., 1997). We chose several aspects of stand structure as com-parative metrics because stand structure can provide information on livetree characteristics, economic timber value, and ecological fine-scale hab-itat for amphibians, birds, small mammals, and soil fauna (McGee et al.,1999; MacNally et al., 2001; McElhinny et al., 2005). Stand structuremetrics also prove germane to certification. The 10 FSC criteria include:(1) compliance with laws and FSC principles, (2) tenure and use rightsand responsibilities, (3) indigenous peoples’ rights, (4) community relations
174 JOURNAL OF SUSTAINABLE FORESTRY
and worker’s rights, (5) benefits from the forest, (6) environmentalimpact, (7) management plan, (8) monitoring and assessment, (9) mainte-nance of high conservation value forests, and (10) plantations. The sixth crite-ria on environmental impact specifically involves coarse woody debrisretention in the U.S. northeast regional standards (“6.3.c.1 Coarse woodydebris in the form of large fallen trees, large logs and snags of various sizes ismaintained in accordance with scientifically credible analyses”) (FSC, 2007).
We use the terms “certified stands” and “certified harvests” throughoutour paper with the recognition that forest properties in our study, ratherthan individual stands or forest managers, were certified. We acknowl-edge that certification assessments are based on entire properties outsideof the scope of our research including at a minimum: ecological factorssuch as road condition and protection of high conservation value areas,management system factors such as GIS maps and pre- and post-harvestinspection checklists, and social factors such as public recreation accessand worker compensation and safety.
Our study takes a retrospective approach to investigate whether FSCcertification is correlated with particular stand-level features–whether FSCforests has a distinguishable stand-level identity–regardless of whethercertification actually caused those features by changing pre- and post-certification management practices. Alhough studies show that certifica-tion changes some management practices (Gullison, 2003; Newsom et al.,2006), we cannot eliminate in our study the possibility of self-selection ofthose owners and managers who customarily employ ecologically orientedmanagement practices predisposing themselves to FSC certification.
METHODS
Study Properties
Three properties were selected from a master list of fifteen FSC certi-fied properties in Vermont provided by Rainforest Alliance’s Smartwoodprogram. Each of the three properties was under separate ownership andmanaged by a separate consulting forester. These three properties werethe only ones that met four criteria characteristic of harvested propertyin the state: (1) sugar maple dominated-northern hardwood cover type;(2) non-industrial private ownership (including family and non-profitorganization ownership, but excluding governmental, timber industry,or timber investment management organization (TIMO) ownership), (3)
Foster, Wang, and Keeton 175
5–25 ha harvest size in one homogeneous stand, and (4) partial harvesttreatment.
Ten uncertified properties also meeting these criteria were identifiedfrom Vermont current use property tax lists provided by state foresters forthe same harvest time period (April-October, 2003) as the FSC certifiedproperties. We limited our selection to the same counties (Addison andWindsor counties in the Green Mountains of central Vermont) as theFSC-certified properties to improve the likelihood that the uncertifiedproperties would share these four characteristics. This area receivesapproximately 1,000 mm of annual rainfall-equivalent precipitation andthe soils are composed primarily of sand and silt derived from glacial till.We randomly chose three of these ten uncertified properties for our study.Selecting comparable certified and uncertified properties on the basis offorest type, ownership, and silvicultural treatment (size and type) reducedpotentially confounding variables but also reduced sample size.
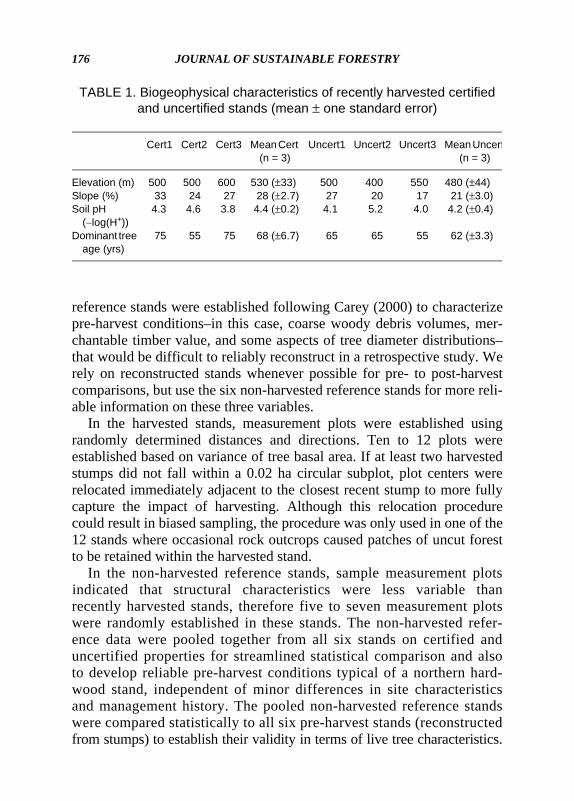
All of the stands were dominated by sugar maple, but also included avariety of other species (in approximate order of occurrence): yellowbirch (Betula alleghaniensis), American beech (Fagus grandifolia), whiteash (Fraxinus americana), eastern red cedar (Juniperus virginiana),eastern hemlock (Tsuga canadensis), and American basswood (Tiliaamericana). Cores from trees in separate canopy positions indicated thatall of the stands contained at least two cohorts separated by 20+ years(multi-aged stands). Stands were harvested using chainsaws and cableskidders, and commercial harvesting had not occurred in any of the standsfor at least 15 years prior to the recent harvests, based on an assessment ofvisible stumps and land manager accounts. Analysis of biogeophysicalcharacteristics also indicated that the stands were similar, and thus compa-rable in terms of elevation (450–550 m with slopes between 20 and 30%),mean soil pH (4.0–4.6), and dominant sugar maple age (60–70 years)(Table 1).
Data Collection
Forest inventory plots were established during June-July, 2004 on thethree uncertified harvested and three certified harvested properties. Twostands were selected for measurement plots at each of these six properties(12 stands total): (1) the stand of northern hardwood cover type harvestedduring spring to fall of 2003; and (2) a portion of the same stand greaterthan 5 ha, or an adjacent stand of northern hardwood cover type, that had notbeen recently harvested to use as the reference stand. These non-harvested
176 JOURNAL OF SUSTAINABLE FORESTRY
reference stands were established following Carey (2000) to characterizepre-harvest conditions–in this case, coarse woody debris volumes, mer-chantable timber value, and some aspects of tree diameter distributions–that would be difficult to reliably reconstruct in a retrospective study. Werely on reconstructed stands whenever possible for pre- to post-harvestcomparisons, but use the six non-harvested reference stands for more reli-able information on these three variables.
In the harvested stands, measurement plots were established usingrandomly determined distances and directions. Ten to 12 plots wereestablished based on variance of tree basal area. If at least two harvestedstumps did not fall within a 0.02 ha circular subplot, plot centers wererelocated immediately adjacent to the closest recent stump to more fullycapture the impact of harvesting. Although this relocation procedurecould result in biased sampling, the procedure was only used in one of the12 stands where occasional rock outcrops caused patches of uncut forestto be retained within the harvested stand.
In the non-harvested reference stands, sample measurement plotsindicated that structural characteristics were less variable thanrecently harvested stands, therefore five to seven measurement plotswere randomly established in these stands. The non-harvested refer-ence data were pooled together from all six stands on certified anduncertified properties for streamlined statistical comparison and alsoto develop reliable pre-harvest conditions typical of a northern hard-wood stand, independent of minor differences in site characteristicsand management history. The pooled non-harvested reference standswere compared statistically to all six pre-harvest stands (reconstructedfrom stumps) to establish their validity in terms of live tree characteristics.
TABLE 1. Biogeophysical characteristics of recently harvested certified and uncertified stands (mean ± one standard error)
Cert1 Cert2 Cert3 Mean Cert (n = 3)
Uncert1 Uncert2 Uncert3 Mean Uncert(n = 3)
Elevation (m) 500 500 600 530 (±33) 500 400 550 480 (±44)Slope (%) 33 24 27 28 (±2.7) 27 20 17 21 (±3.0)Soil pH
(−log(H+))4.3 4.6 3.8 4.4 (±0.2) 4.1 5.2 4.0 4.2 (±0.4)
Dominant tree age (yrs)
75 55 75 68 (±6.7) 65 65 55 62 (±3.3)
Foster, Wang, and Keeton 177
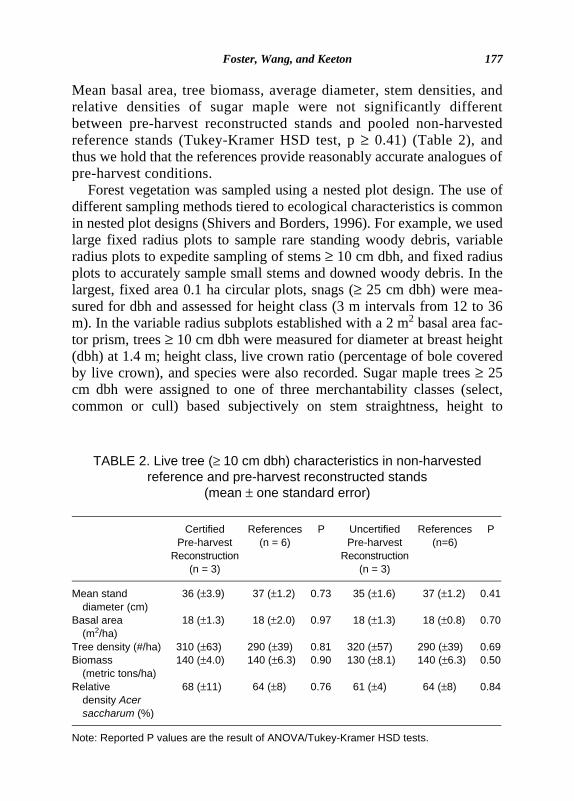
Mean basal area, tree biomass, average diameter, stem densities, andrelative densities of sugar maple were not significantly differentbetween pre-harvest reconstructed stands and pooled non-harvestedreference stands (Tukey-Kramer HSD test, p ≥ 0.41) (Table 2), andthus we hold that the references provide reasonably accurate analogues ofpre-harvest conditions.
Forest vegetation was sampled using a nested plot design. The use ofdifferent sampling methods tiered to ecological characteristics is commonin nested plot designs (Shivers and Borders, 1996). For example, we usedlarge fixed radius plots to sample rare standing woody debris, variableradius plots to expedite sampling of stems ≥ 10 cm dbh, and fixed radiusplots to accurately sample small stems and downed woody debris. In thelargest, fixed area 0.1 ha circular plots, snags (≥ 25 cm dbh) were mea-sured for dbh and assessed for height class (3 m intervals from 12 to 36m). In the variable radius subplots established with a 2 m2 basal area fac-tor prism, trees ≥ 10 cm dbh were measured for diameter at breast height(dbh) at 1.4 m; height class, live crown ratio (percentage of bole coveredby live crown), and species were also recorded. Sugar maple trees ≥ 25cm dbh were assigned to one of three merchantability classes (select,common or cull) based subjectively on stem straightness, height to
TABLE 2. Live tree (≥ 10 cm dbh) characteristics in non-harvested reference and pre-harvest reconstructed stands
(mean ± one standard error)
Certified Pre-harvest
Reconstruction(n = 3)
References (n = 6)
P Uncertified Pre-harvest
Reconstruction(n = 3)
References (n=6)
P
Mean stand diameter (cm)
36 (±3.9) 37 (±1.2) 0.73 35 (±1.6) 37 (±1.2) 0.41
Basal area (m2/ha)
18 (±1.3) 18 (±2.0) 0.97 18 (±1.3) 18 (±0.8) 0.70
Tree density (#/ha) 310 (±63) 290 (±39) 0.81 320 (±57) 290 (±39) 0.69Biomass
(metric tons/ha)140 (±4.0) 140 (±6.3) 0.90 130 (±8.1) 140 (±6.3) 0.50
Relative density Acer saccharum (%)
68 (±11) 64 (±8) 0.76 61 (±4) 64 (±8) 0.84
Note: Reported P values are the result of ANOVA/Tukey-Kramer HSD tests.

178 JOURNAL OF SUSTAINABLE FORESTRY
branches, and visible defects, such as rot or mechanical damage. Twobasal diameters of merchantable trees (≥ 25 cm dbh) were also mea-sured for stump reconstruction. In the smallest, fixed area 0.02 ha cir-cular subplots, saplings (0.1–4.9 cm dbh) and pole-sized trees (5.0–9.9cm dbh) were tallied by species, recent stumps were measured fordiameter and recorded by species, and downed woody debris was mea-sured for large and small end diameters (≥ 10 cm) and length for anyportion that fell within the plot boundaries. At every third circular sub-plot, we gathered site information, including: percent slope (measuredwith a clinometer), dominant understory herbaceous species (deter-mined by ocular estimation within the plots), and A-horizon soil pH(assessed with an electrode in the lab after a Shoemaker-McLean-Pratt(SMP) soil extraction from three mixed soil samples per plot (Shoemakeret al., 1961)).
Data Processing and Analysis
All comparisons between stands were made using parametric statisticaltests (Zar, 1999). Stand means were calculated via ANOVA analysis frommeasurement plots, and then stand means were compared by Tukey-Kramer hsd for statistically significant differences (p ≤ 0.05) (mostcommonly: uncertified vs. certified, uncertified vs. reference, certified vs.reference). F test ratios ≥ 0.20 for homogeneity or equality of varianceassured the validity of the Tukey-Kramer hsd tests. All statistical opera-tions were executed in SAS JMP 5.1.
Live and Reconstructed Tree Values
The dbh of cut trees was reconstructed using least squares linear regres-sion formulas derived from measured dbh and basal diameters (R2 = 0.90).The cubic volume of all trees ≥ 10 cm dbh was calculated using regional,species-specific cubic volume equations based on dbh and total height(Scott, 1981). Relative density was calculated based on the density ofsugar maple ≥ 10 cm dbh compared to total stem density. Diameter distri-butions of all standing trees ≥ 0.1 cm dbh were generated using 5 cm sizeclasses.
Live tree carbon storage was calculated based on 50% (Gower,2003) of total tree biomass determined from allometric equations forU.S. tree species (Jenkins et al., 2003). To calculate economic value,we converted carbon to CO2e by multiplying by 3.67, then multipliedthis figure by voluntary market rates of $3 per metric ton CO2e from
Foster, Wang, and Keeton 179
Chicago Climate Exchange (CCX, 2007). Market rates for carbonhave already doubled to $6/ton in 2008 according to the CCX website,so these figures could be considered conservative estimates of netreturns to forest owners after transaction costs.
Residual timber value was calculated for merchantable sugar mapleusing regional, one-quarter inch international log rule equations(Scott, 1979) based on dbh and bole height to mid-crown. Sugar maplewas chosen for economic analysis because it is the dominant speciesin these stands (> 50% of stems) and because it represents the majorityof the value in these forests, with stumpage prices typically two tofour times those of other northern hardwood tree species. Averagestumpage values for common and select grades of sugar maple in cen-tral Vermont were used in the calculations to eliminate variation inactual prices received due to distance to mill, forest road density, andother factors (2003–04 prices of $444/mbf for select grade sugarmaple and $297/mbf for common grade sugar maple (UVM, 2007)).None of the managers in the certified forests had an opportunity to sellwood for premium certified prices, so standard market prices wereused for all calculations. Merchantability standards were assumed tobe the same across properties. Harvest costs were not included in thecalculations because stumpage prices include the costs of felling,delimbing, skidding, bucking, and hauling. Replanting costs were alsonot included because natural regeneration methods were employedpost-harvest. Annual certification audit costs (an average of five yearre-certification and annual inspection audits) were deducted fromstumpage value in certified stands. These costs were estimated at $6/ha/yrby forest managers in our study excluding internal administration andmanagement costs, a figure that was comparable to published figuresfrom Cubbage et al. (2003). Annual certification audit costs wereassumed to increase at the rate of inflation of 3.4% (the determinationof inflation rate is explained in section 3.5).
Reconstructed stand information was not reliable for calculatingtimber value because tree height, an important component of volume,was poorly correlated with diameter (R2 = 0.10). Furthermore, sugarmaple timber prices differ by 44% between common and select grades,and such differences in bole quality could not be assessed from thestumps. Therefore, estimated recent harvest returns were calculated bydeducting residual standing value in certified and uncertified standsfrom standing value in non-harvested reference stands (referencereturns were set to zero).
180 JOURNAL OF SUSTAINABLE FORESTRY
Timber Growth Projections
Tree diameter growth, height growth, and mortality rates of sugar maplewere projected 10 years into the future, using the Northeast (NE) variant ofU.S. Forest Service’s Forest Vegetation Simulator (FVS) spatially indepen-dent equations (Teck and Hilt, 1991). Future timber prices were calculatedbased on average annual increases from the longest period of historical dataon stumpage prices (from 1982–1985 to 2002–2005) from the University ofVermont (UVM, 2007). These nominal prices were adjusted by producerprice indices of lumber over the same time period from the U.S. Bureau ofLabor Statistics to account for inflation (BLS, 2007). These data showed5.0% annual real rates of change for select grade sugar maple prices and4.1% annual real rates of change for common grade sugar maple prices,after subtracting 3.4% annual inflation. Prices 10 years into the future werecalculated at discount rates of 4, 6 and 8%. These discount rates fall withinthe 2–10% commonly used in forest economics literature (e.g. Ashton et al.,2001; Boltz et al., 2001; Boscolo and Vincent, 2003).
Coarse Woody Debris Volumes
Downed woody debris (≥ 10 cm diameter) volumes were calculatedbased on the equation of the frustum of a cone. Standing woody debris orsnag (≥ 25 cm dbh) volumes were calculated using generic hardwoodcubic foot volume equations (Scott, 1981) based on dbh and total height.Coarse woody debris densities and volumes in both uncertified andcertified stands were compared to non-harvested reference conditions, asprecut coarse woody debris could not be reliably reconstructed.
RESULTS
Live Tree Characteristics
Both certified and uncertified harvests were similar in terms of their impacton live tree structure. Neither certified nor uncertified harvests significantly(α = 0.05) decreased average tree diameter or relative density of sugar maplecompared to pre-harvest reconstructed conditions (Table 3). However, bothharvests significantly reduced both biomass (p < 0.01) and basal area of livetrees ≥ 10 cm dbh (p < 0.01) by approximately one-third compared to pre-harvest reconstructed conditions. Harvesting apparently reduced total tree

Foster, Wang, and Keeton 181
density by one-third (from 320 to 220 trees/ha) as well, but this differencewas not statistically significant (p = 0.26). The impact of both harvests, trans-lated to even-aged stocking charts from the U.S. Forest Service NortheasternState and Private Forestry, involved a reduction from 95% to 65% stocking.
Decreased biomass translated to decreased live tree carbon storage inboth treatments compared to pre-harvest reconstructed stands (p < 0.01).All harvests lowered potential economic carbon storage values by 25–30%compared to pre-harvest reconstructed conditions (p < 0.02).
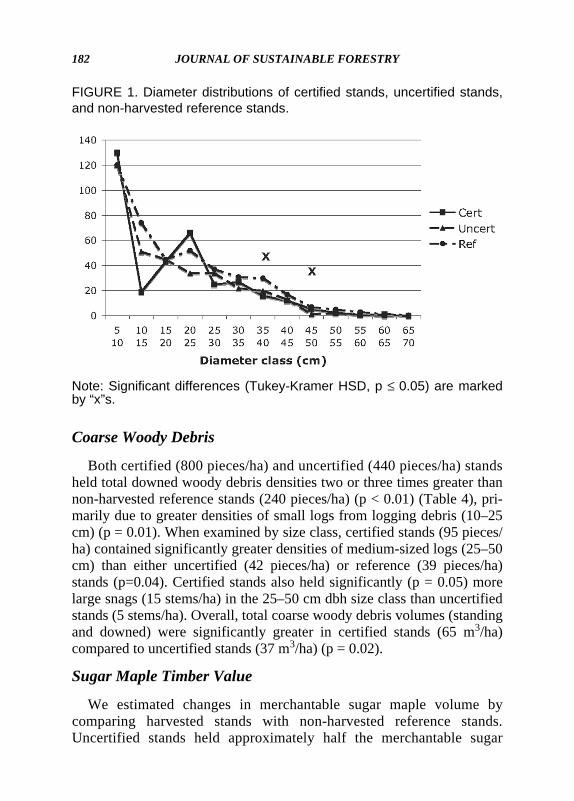
In terms of diameter distributions, both certified and uncertified standsheld sapling densities (0.1–5.0 cm dbh) approximately half those found innon-harvested references, likely due to harvesting operation activity.Post-harvest sapling densities were 590 stems/ha in certified stands and720 stems/ha in uncertified stands compared to 1510 stems/ha in referencestands (p = 0.02). In addition, each harvest type held significantly lower den-sities of trees in one mid-size class compared to non-harvested referencestands (Figure 1). Certified stands contained 16 trees/ha at 35–40 cm dbhcompared to 30 trees/ha in references (p = 0.04). Uncertified stands contained1 tree/ha at 45–50 cm dbh compared to 7 trees/ha in references (p = 0.01).
TABLE 3. Live tree (≥ 10 cm dbh) characteristics in pre-harvest reconstructed and recently harvested stands
(mean ± one standard error)
Certified Pre-harvest
Reconstruction(n = 3)
Certified Post-harvest
(n = 3)
Uncertified Pre-harvest
Reconstruction(n = 3)
Uncertified Post-harvest
(n = 3)
Mean stand diameter (cm) 36 (±3.9) 34 (±3.7) 35 (±1.6) 36 (±2.0)Basal area (m2/ha) 18a (±0.74) 13b (±0.51) 18a (±1.4) 12b (±1.0)Tree density (#/ha) 310 (±63) 220 (±34) 320 (±57) 220 (±48)Biomass
(metric tons/ha)140a (±4.0) 110b (±9.4) 131a (±14) 94b (±10)
Live tree carbon storage (metric tons/ha)
70a (±2.0) 53b (±4.7) 65a (±4.0) 47b (±2.8)
Carbon credit value for aboveground live tree storage ($/ha/yr CO2e)
$771a (±25) $584b (±48) $716 (±48) $518b (±35)
Relative density Acer saccharum (%)
68 (±11) 71 (±12) 61 (±4.0) 60 (±8.0)
Note: Significant differences (Tukey-Kramer HSD, p ≤ 0.05) are marked with different superscript letters.
182 JOURNAL OF SUSTAINABLE FORESTRY
Coarse Woody Debris
Both certified (800 pieces/ha) and uncertified (440 pieces/ha) standsheld total downed woody debris densities two or three times greater thannon-harvested reference stands (240 pieces/ha) (p < 0.01) (Table 4), pri-marily due to greater densities of small logs from logging debris (10–25cm) (p = 0.01). When examined by size class, certified stands (95 pieces/ha) contained significantly greater densities of medium-sized logs (25–50cm) than either uncertified (42 pieces/ha) or reference (39 pieces/ha)stands (p=0.04). Certified stands also held significantly (p = 0.05) morelarge snags (15 stems/ha) in the 25–50 cm dbh size class than uncertifiedstands (5 stems/ha). Overall, total coarse woody debris volumes (standingand downed) were significantly greater in certified stands (65 m3/ha)compared to uncertified stands (37 m3/ha) (p = 0.02).
Sugar Maple Timber Value
We estimated changes in merchantable sugar maple volume bycomparing harvested stands with non-harvested reference stands.Uncertified stands held approximately half the merchantable sugar
FIGURE 1. Diameter distributions of certified stands, uncertified stands,and non-harvested reference stands.
Note: Significant differences (Tukey-Kramer HSD, p ≤ 0.05) are markedby “x”s.

Foster, Wang, and Keeton 183
maple volume as non-harvested reference stands, which was a signifi-cant difference (p = 0.02) in present terms (55 m3/ha versus 110 m3/ha)and in 10 (56 m3/ha versus 120 m3/ha) year projections (Table 5).Residual merchantable sugar maple volume in certified stands wasintermediate between uncertified harvested and non-harvested referencestands and not significantly different from either.
The estimated recent harvest stumpage value averaged $1900 per hafor certified versus $3,300 per ha for uncertified stands–a difference thatwas large but also highly variable and therefore not significantly different(p = 0.42). Similarly the mean internal rates of return over 10 years(6% uncertified, 5.6% certified, and 5% uncut reference) were statistically
TABLE 4. Coarse woody debris densities and volumes in certified, uncertified, and non-harvested reference stands
(mean ± one standard error)
Certified (n = 3)
Uncertified (n = 3)
References(n = 6)
Down woody debris (≥ 10 cm diameter)Residual density (#/ha)
10–25 cm diam. (small end) 690a (±170) 390a (±34) 200b (±24)25–50 cm diam. 95a (±10) 42b (±14) 39b (±8.9)50+ cm diam. 15 (±8.4) 5 (±2.9) 3 (±2.8)Total 800a (±170) 440a (±43) 240b (±30)
Residual volume (m3/ha)10–25 cm diam. (small end) 29 (±4.9) 18 (±3.4) 16 (±5.8)25–50 cm diam. 23 (±3.4) 12 (±3.0) 12 (±3.9)50+ cm diam. 2.7 (±1.7) 1.6 (±0.8) 1.7 (±1.7)Total 54a (±3.9) 32b (±6.7) 30 (±8.9)
Snags (≥ 25 cm dbh)Residual density (#/ha)
25–50 cm dbh 15a (±2.3) 5b (±2.5) 10 (±2.4)50+ cm dbh 2.1 (±1.2) 1.7 (±0.9) 2.2 (±0.6)Total 17 (±3.5) 6.7 (±2.7) 12 (±6.9)
Residual volume (m3/ha)25–50 cm dbh 7.8 (±1.5) 4.3 (±2) 7.4 (±2.3)50+ cm dbh 2.8 (±1.7) 1 (±0.8) 3.4 (±1.3)Total 11 (±3) 5.2 (±2.7) 11 (±3.5)
Total CWDResidual volume (m3/ha) 65a (±3.9) 37b (±5.8) 41 (±11)
Note: Significant differences (Tukey–Kramer HSD, p ≤ 0.05) are marked with different super-script letters.

184 JOURNAL OF SUSTAINABLE FORESTRY
indistinguishable. Follow-up analyses in the discussion section belowshow that statistical significance emerges with longer entry cycles andhigher discount rates. For example, the uncertified harvest compared to non-harvested references produced higher returns approximately $1,900/ha higherin net present value over 20-year entries (rather than 10) at a 10% discountrate (rather than 8%) (p = 0.03).
DISCUSSION
Live Tree Structure
Certified and uncertified harvests had analogous impacts on live treestructure. Both harvest types significantly reduced tree basal area,
TABLE 5. Merchantable sugar maple volume and net present value in certified, uncertified, and non-harvested reference stands
(mean ± one standard error)
Cert. (n = 3)
Uncer. (n = 3)
References (n = 6)
Volume of Acer saccharumMeasured stand vol. AGS* (m3/ha) 79 (±20) 55a (±14) 110b (±11)Modeled growth minus mortality +10 yrs. (m3/ha)
81 (±21) 56a (±17) 120b (±11)
Net present value of Acer saccharum timber ($/ha)–10 yrs
4% real discount rateRecent timber harvest returns (2003) $1900a (±1100) $3300a (±1000) $0b (±0)Residual timber value (+10 years) $5000 (±1400) $4000a (±1300) $6900b (±560)Total net present value $6900 (±1400) $7300 (±1300) $6900 (±560)
6% real discount rateRecent timber harvest returns (2003) $1900a (±1100) $3300a (±1000) $0b (±0)Residual timber value (+10 years) $4100 (±1200) $2900a (±890) $5700b (±470)Total net present value $6000 (±1200) $6200 (±900) $5700 (±470)
8% real discount rateRecent timber harvest returns (2003) $1900a (±1100) $3300a (±1000) $0b (±0)Residual timber value (+10 years) $3400 (±1000) $2400a (±740) $4700b (±400)Total net present value $5300 (±980) $5700 (±740) $4700 (±400)Mean internal rate of return 5.7% (±0.4) 6.2% (±0.4) 5.2% (±0.1)
*AGS = Acceptable Growing Stock of select or common grade sugar maple ≥ 25 cm dbh.Note: Significant differences (Tukey-Kramer HSD, p ≤ 0.05) are marked with different superscript letters.
Foster, Wang, and Keeton 185
biomass, and stocking by one third, and only slightly reduced average treediameters and relative density of sugar maple compared to pre-harvestreconstructed conditions (Table 3).
Diameter distributions in the certified and uncertified stands wereboth moderately different from non-harvested references. Low densitiesof saplings in both types of harvested stands were likely due to cableskidder activity, while lower densities in one mid-size class in certifiedstands and one mid-size class in uncertified stands probably resultedfrom timber removals. There were no significant differences in large-sizetrees (> 50 cm dbh) between the stands because, in part, there were fewof those trees in these 60–70-year-old stands.
Carbon Storage
International carbon storage pilot projects between electric utilities andforest owners, mediated by government agencies and non-governmentalorganizations, suggest that forests will play a role in emerging carbonmarkets. Carbon storage could play a major role in management decisionsin the northern forests. If harvest entry is postponed by a decade to main-tain carbon storage, an extra $1000/ha could accrue in carbon credit value(this calculation is based on discounting at 6% rate, using prices of $3/tonne/CO2e, and using data of pre-harvest reconstructed compared to har-vested stands). This extra $1000/ha represents between 33–50% of nettimber returns from the deferred harvest, a difference that will narroweven further with increases in carbon prices.
We also measured carbon storage as one indicator of the affect of for-est management on the provision of ecosystem services (Costanza et al.,1997). Live trees account for nearly half of the total forest carbon in tem-perate forests (Pregitzer and Euskirchen, 2004) with the remainder informs of coarse woody debris and soil organic and mineral fractions thatwe did not measure. Our results did not show any significant differencesin live tree carbon storage between certified and uncertified harvests(Table 3). Certified and uncertified harvests both reduced total tree biom-ass by one-third compared to pre-harvest reconstructed conditions, thusdiminishing potential economic carbon storage values by approximately$200/ha/yr.
Coarse Woody Debris
Coarse woody debris is an ecologically important component of forestsin the northeastern U.S. Prior to European settlement, over three-quarters
186 JOURNAL OF SUSTAINABLE FORESTRY
of northern hardwood forests were over 150 years old (Lorimer andWhite, 2003), with a concomitant abundance of large snags and downedlogs, along with large trees for future recruitment of coarse woody debris(Gore and Patterson, 1986; Tyrrell and Crow, 1994; Neumann andStarlinger, 2001). Even today, standing snags and downed logs are com-mon legacies of the disease, ice, and wind disturbances in the northernhardwood forest that kill standing trees in-place or break branches andboles (Faccio, 2003).
Coarse woody debris in the northern hardwood forest does not carrysignificant risk of increasing fire hazard, harboring secondary bark bee-tles, or accelerating carbon volatilization. Indeed, leaving standing snagsand down logs in this region provides multiple ecological functions:supplying habitat (though this is also determined by other factors such asforest edge) for vertebrates including grouse, owls, woodpeckers, sala-manders, and voles (McComb and Lindenmeyer, 1999; Butts andMcComb, 2000; McKenny et al., 2006); maintaining detrital productivityby supporting a diversity of arthropods involved in commuting plantmaterial to soil nutrients (Chandler, 1987; Hammond et al., 2001; Jabinet al., 2004; Latty et al., 2006); creating plant microhabitats by generatingheterogeneity in soil carbon and nitrogen levels (Hafner and Groffman,2005); and stabilizing the soil against erosion (Fernandez et al., 2004).
Coarse woody debris volumes, including standing and downed woodydebris, were nearly 60% greater in certified (65 m3/ha) than uncertifiedstands (37 m3/ha) (Table 4). Nearly all of this debris was relatively un-decayed and the harvests were of similar intensity, suggesting that themore abundant debris in certified stands resulted from differing manage-ment practices (perhaps spurred by the FSC-NE standard), such as retain-ing snags instead of felling them, and leaving bole tops instead ofremoving them for fence poles, firewood, biomass, pallet wood, or paperpulp. Retaining an additional 28 m3/ha of debris in the certified thanuncertified stands cost an estimated $47/ha at the time of harvest, basedon hardwood pulp prices of $6 per cord (UVM, 2007). This opportunitycost of coarse woody debris retention was equivalent to 3% of mean certi-fied harvest returns. Although coarse woody debris volumes on certifiedstands (with 54 m3/ha downed wood volume and 17 stems/ha snag density)exceeded uncertified stands (with 32 m3/ha downed wood volume and 7stems/ha snag density), the characteristics of debris in both of these 60- to70-year-old forests differ greatly from unmanaged 150+ year old, north-ern hardwood forests which have double the average volume, double the
Foster, Wang, and Keeton 187
average diameter, and more advanced decay of coarse woody debris(Goodburn and Lorimer, 1998; Hale et al., 1999; McGee et al., 1999).
Sugar Maple Timber Value
There were no significant differences in net present value of sugarmaple between the harvests, or between the harvests and references, atdiscount rates of 4–8% over 10 year entry periods. Follow-up analyses,however, showed that statistically significant differences emerged withlonger entry cycles and higher discount rates. Uncertified harvestsremoved more merchantable sugar maple in the initial harvest as sug-gested by the significant drop in acceptable growing stock of sugar mapleof approximately 50% while certified harvests lost approximately 25%relative to non-harvested references (Table 5). The larger initial removalin uncertified harvests resulted in higher economic returns of approxi-mately $1900/ha in present value over 20 year entries at a 10% discountrate relative to unharvested references (p = 0.03).
Conclusions and Future Research Priorities
Uncertified and FSC-certified partial harvests in the northern hardwoodforest were similar in many regards. Neither uncertified nor certified har-vests had major effects on average tree diameters or relative density of sugarmaple compared to pre-harvest reconstructed conditions. Both harvestsreduced basal area, biomass, and live tree carbon storage by approximatelyone-third. In addition, both uncertified and certified stands held lower sap-ling densities and some mid-size tree densities compared to non-harvestedreferences. Altogether, the similar live tree structure in certified and uncerti-fied stands resulted in aesthetically indistinguishable forests. Certified anduncertified stands also held similar projected net present values of sugarmaple over time. Finally, certified stands contained higher coarse woodydebris volumes that will likely offer ecological benefits, such as increases inpopulations of snag- and log-dependent species and net increases in long-term carbon storage. A follow-up comparison of two management plansfrom certified and uncertified stands in our study re-enforced these findings.Both plans aimed for “long-term production of high-quality hardwood saw-timber” by reducing total stand basal area by one-third, removing first thelowest grade trees, and retaining an acceptable growing stock of sugarmaple. However, only the plan for the certified property contained pre- andpost-harvest data on standing and downed woody debris volume.
188 JOURNAL OF SUSTAINABLE FORESTRY
Our study is the first, to our knowledge, to quantify the similarities anddifferences between certified and uncertified forests in the field. Our find-ings suggest that FSC certification correlates with the modest ecologicalbenefit of additional coarse woody debris, while retaining economic valueunder moderate discount rates. However, finding comparable standsproved difficult. This difficulty, which resulted in a small sample size,limited the statistical significance of many apparent differences betweenthe stands such as net present values of sugar maple, residual tree densi-ties, and total snag densities. In addition, we limited our scope to assess-ing stand-level forest structure in the northern hardwood region. Thus,while our study represents the first field assessment of certification, theresults of our exploratory study are not definitive.
Future research should expand temporally with tree recruitment andregeneration over a number of years, and expand spatially to includeriparian corridors and other high conservation value areas. Futureresearch should also expand into biomes where dominant timber speciesare shade-intolerant to intermediate. Field-based research on the impactsof certified forest management presents experimental design challenges,but such research is critical to accurately assess the full benefits and costsof certification.
REFERENCES
Ashton, M.S., Mendelsohn, R., Singhakurama, B.M.P., Gunatilleke, C.V.S., Gunatilleke,I.A.U.N. and A. Evans. 2001. A financial analysis of rain forest silviculture insouthwestern Sri Lanka. Forest Ecology and Management 154:431–441.
Boltz, F., Carter, D.R., Holmes, T.P. and R. Pereira. 2001. Financial returns under uncer-tainty for uncertified and reduced-impact logging in permanent production forests ofthe Brazilian Amazon. Ecological Economics 39:387–398.
Bureau of Labor Statistics (BLS). 2007. U.S. lumber producer price index commoditydata. Retrieved January, 2007 from http://data.bls.gov/cgi-bin/surveymost?wp.
Boscolo, M. and J.R. Vincent. 2003. Nonconvexities in the production of timber, biodiver-sity and carbon sequestration. Journal of Environmental Economics and Management46:251–268.
Butts, S.R. and W.C. McComb. 2000. Associations of forest-floor vertebrates with coarsewoody debris in managed forests of western Oregon. Journal of Wildlife Management64:95–104.
Carey, A.B., 2000. Effects of new forest management strategies on squirrel populations.Ecological Applications 10:248–257.
Cauley, H.A., Peters, C.M., Donovan, R.Z. and J.M. O’Connor. 2001. Forest stewardshipcouncil forest certification. Conservation Biology 15:311–312.
Foster, Wang, and Keeton 189
Chandler, D.S., 1987. Species richness and abundance of Pselaphiae (Coleoptera) in oldgrowth and 40-year-old forests in New Hampshire. Canadian Journal of Zoology65:608–615.
Chicago Climate Exchange (CCX). 2007. CCX CFI Vintage 2007 Prices. RetrievedJanuary, 2007 from http:// www.chicagoclimatex.com.
Costanza, R., d’Arge, R., de Root, R., Farber, S., Grasso, M., Hannon, B., Limburg, K.,Naeem, S., O’Neill, R.V., Paruelo, J., Raskin, R.G., Sutton, P., and M. van den Belt.1997. The value of the world’s ecosystem services and natural capital. Nature387:253–260.
Cubbage, F., Moore, S., Cox, J., Jervis, L., Edeburn, J., Richter, D., Boyette, W.,Thompson, M., and M. Chesnutt. 2003. Forest certification of state and university landin North Carolina: A comparison. Journal of Forestry Dec.:26–31.
Faccio, S.D., 2003. Effects of ice storm-created gaps on forest breeding communities incentral Vermont. Forest Ecology and Management 186:133–145.
Fernandez, C., Vega, J.A., Gras, J.M., Fonturbel, T., Cuinas, P., Dambrine, E., andM. Alonso. 2004. Soil erosion after Eucalyptus globulus clearcutting: Differencesbetween logging slash disposal treatments. Forest Ecology and Management195:85–95.
Forest Stewardship Council (FSC). 2007. FSC U.S. northeast regional standards.Retrieved January, 2007 from http://www.fscus.org/documents/.
Goodburn, J.M. and C.G. Lorimer. 1998. Cavity trees and coarse woody debris in oldgrowth and managed northern hardwood forests in Wisconsin and Michigan. CanadianJournal of Forest Research 28:427–438.
Gore, J.A. and W.A. Patterson. 1986. Mass of downed wood in northern hardwood forestsin New Hampshire: potential effects of forest management. Canadian Journal of For-est Research 16:335–339.
Gower, S.T. 2003. Patterns and mechanisms of the forest carbon cycle. Annual Review ofEnvironmental Research 28:169–204.
Gullison, R.E. 2003. Does forest certification conserve biodiversity? Oryx 37:153–165.Hafner, S.D. and P.M. Groffman. 2005. Soil nitrogen cycling under litter and coarse
woody debris in a mixed forest in New York State. Soil Biology and Biochemistry37:2159–2162.
Hale, C.M., Pastor, J. and K.A. Rusterholz. 1999. Comparison of structural and composi-tional characteristics in old-growth and mature, managed hardwood forests of Minne-sota, U.S.A. Canadian Journal of Forest Research 29:1479–1489.
Hammond, H.E.J., Langor, D.W. and J.R. Spence. 2001. Early colonization of Populuswood by saproxylic beetles (Coleoptera). Canadian Journal of Forest Research31:1175–1183.
Hickey, G.M. 2004. Regulatory approaches to monitoring sustainable forest management.International Forestry Review 6:89–98.
Holvoet, B. and B. Muys. 2004. Sustainable forest management worldwide: A compara-tive assessment of standards. International Forestry Review 6:99–122.
Jabin, M., Mohr, D., Kappes, H., and W. Topp. 2004. Influence of deadwood on density ofsoil macro-arthropods in a managed oak-beech forest. Forest Ecology and Manage-ment 194: 61–69.
190 JOURNAL OF SUSTAINABLE FORESTRY
Jenkins, J.C., Chojnacky, D.C., Heath, L.S., and R.A. Birdsey. 2003. National-scale biom-ass estimators for United States tree species. Forest Science 49:12–35.
Kittredge, D.B., Finley, A.O., and D.R. Foster. 2003. Timber harvesting as ongoing dis-turbance in a landscape of diverse ownership. Forest Ecology and Management180:425–442.
Latty, E.F., Werner, S.M., Mladenoff, D.J., Raffa, K.F., and T.A. Sickley. 2006. Responseof ground beetle (Carabidae) assemblages to logging history in northern hardwood-hemlock forests. Forest Ecology and Management 222:335–347.
Lorimer, C.G. and A.S. White. 2003. Scale and frequency of natural disturbances in thenortheastern U.S.: Implications for early successional forest habitats and regional agedistributions. Forest Ecology and Management 185:41–64.
MacNally, R., Parkinson, A., Horrocks, G., Conole, L., and C. Tzaros. 2001. Relation-ships between terrestrial vertebrate diversity, abundance and availability of coarsewoody debris on south-eastern Australian floodplains. Biological Conservation99:191–205.
McComb, W. and D. Lindenmeyer. 1999. Dying, dead and down trees. In pp. 335–372,Hunter, M.L., ed. Maintaining Biodiversity in Forested Ecosystems. CambridgeUniversity Press, Cambridge, England.
McElhinny, C., Gibbons, P., Brack, C., and J. Bauhus. 2005. Forest and woodland standstructural complexity: Its definition and measurement. Forest Ecology and Manage-ment 218:1–24.
McGee, G.G., Leopold, D.J., and R.D. Nyland. 1999. Structural characteristics of old-growth, maturing and partially cut northern hardwood forests. Ecological Applications9:1316–1329.
McKenny, H.C., Keeton, W.S., and R.M. Donovan. 2006. Effects of structuralcomplexity enhancement on eastern red-backed salamander (Plethodon cinereus)populations in northern hardwood forests. Forest Ecology and Management230:186–196.
Neumann, M. and F. Starlinger. 2001. The significance of different indices for stand struc-ture and diversity in forests. Forest Ecology and Management 145:91–106.
Newsom, D., V. Bahn and B. Cashore. 2006. Does forest certification matter? An analysisof operation-level changes required during the SmartWood certification process in theUnited States. Forest Policy and Economics 9:197–208.
Point Carbon. 2007. EUA OTC closing price. Retrieved January, 2007 from http://www.pointcarbon.com.
Pregitzer, K.S. and E.S. Euskirchen, E.S. 2004. Carbon cycling and storage in worldforest: biome patterns related to forest age. Global Change Biology 10:1–26.
Scott, C.T., 1979. Northeastern forest survey board foot volume equations, NE-RN-271.USDA Forest Service, Northeastern Research Station, Radnor, PA.
Scott, C.T., 1981. Northeastern forest survey revised cubic foot volume equations,NE-RN-304. USDA Forest Service, Northeastern Research Station, Radnor, PA.
Sedjo, R.A., Goetzl, A., and S.O. Moffat. 1998. Sustainability of temperate forests.Resources for the Future, Washington, D.C.
Shivers, B.D. and B.E. Borders. 1996. Sampling techniques for forest inventory. NewYork, NY: Wiley and Sons.
Foster, Wang, and Keeton 191
Shoemaker, H.E., McLean, E.O., and P.F. Pratt. 1961. Buffer methods of determininglime requirements of soils with appreciable amounts of extractable aluminum. Soil Sci-ence Society of America Proceedings 25:274–277.
Smith, D.M., B.C. Larson, M.J. Kelty, and P.M.S. Ashton, 1997. The practice of silvicul-ture: Applied forest ecology. New York, NY: Wiley and Sons.
Teck, R.M. and D.E. Hilt. 1991. Individual tree diameter model for the northeastern U.S.,NE-RN-649. USDA Forest Service, Northeastern Research Station, Radnor, PA.
Tyrrell, L.E. and T.W. Crow. 1994. Dynamics of dead wood in old-growth hemlock-hardwood forests of northern Wisconsin and northern Michigan. Canadian Journal ofForest Resources 24:1672–1683.
University of Vermont (UVM). 2007. Stumpage price data. Retrieved January, 2007 fromhttp://stumpage.uvm.edu/stumpage.php.
World Wildlife Federation (WWF). 2007. Information on certified forest sites endorsed byForest Stewardship Council (FSC) December 1995-January 2006. Retrieved January,2007 from http://www.certified-forests.org.
Zar, J.H., 1999. Biostatistical analysis, 4th ed. Upper Saddle River, NJ: Prentice Hall.
RECEIVED: 10/25/06REVISED: 02/11/07
ACCEPTED: 03/28/07