wlk 350 project
TRANSCRIPT

Colton Wieck
Westlake Chemical Corp. (NYSE: WLK)
Financial Statement Analysis
FIN 350: Final Project
Executive Summary
Westlake Chemical Corp. is an industry leader in the manufacturing of chemicals,
polymers, and fabricated products. They operate in two main segments: the Olefin & Vinyl
segments and operate in the Americas, Europe, & China. They are officially listed on the NYSE
under the ticker, WLK, where they are currently trading at $74.38 per share.
After further investigation of their financial statements it is clear that their financials are
fairly straightforward and they utilize transparent accounting practices that any company that is
publically traded must adhere to. Their officers and executives own about 68% of the
companies outstanding shares, so it is apparent that they will always be fully responsible and
invested in the business operations of the company and will always do what it takes to make
sure they are running ethically and correctly internally. The fact that management has always
acted conservatively when exercising judgment also reiterates this point. Management has
been true to their word and backed up their talk of exercising extreme discipline and caution
when making substantial financial moves. The company has low debt figures followed up by
ample cash flow generate that is utilized to pay stockholders, buy capital, and purchase
companies through strategic acquisitions. Acquisition prospects are looked at for a great period
before being integrated and management has instituted a strict synergy structure for business
operations.
The company does not seem to be engaging in any substantial short-term earnings
recognition practices that will not be sustainable in the future, as adjustments to income were
not large in nature or devastating to the company and earnings, net income, and sales have
been consistent and growing at a reasonable and healthy pace over the past ten years. Few
2

adjustments were required and they were not detrimental in nature. This paper provides an
analysis of the company’s financials and competitive positioning against an industry competitor.
After this research and analysis was concluded it was evident that the company is in good
financial health, set to endure consistent future growth through the underlying fundamentals
of their business operations, and an attractive company when compared to industry peers.
Economic Analysis
From 2007 through 2009 the U.S. experienced one of the worst periods of GDP growth
since the great depression, caused by the global financial crisis. After the crisis, the Federal
Reserve started the Quantitative Easing program designed to spark positive GDP growth and
help the economy from collapsing. It has been roughly six years since QE began, interest rates
dropped to record low levels, and the economy started improving. The U.S. economy is set to
grow 3% in 2015 and interest rates are predicted to increase later this year as well. Due to
overall improvement, many industries and sectors in the economy have benefitted greatly and
are growing at pre-recession levels. Today’s economic environment is extremely supportive of
businesses, especially those who are capital-intensive. Not only are low interest rates, inflation,
and an improved economy allowing for businesses to borrow cheaply and in turn grow, but low
prices in oil and metal commodities are allowing businesses to save as well. Strong economic
fundamentals let companies improve their underlying fundamentals, while growing internally
and through acquisitions. For companies, like Westlake Chemical, the growth and improvement
specifically in the housing, semiconductor, and auto sectors and the low prices in the energy
sector are greatly benefitting business. Westlake makes raw and finished products needed for
property & auto construction and makes coatings and adhesives for the manufacturing of
3

semiconductors and auto parts. As energy pricing depreciates, it is cheaper for Westlake to buy
raw materials used to make their products and with inflation low and demand high consumers
are willing to pay more for finished products. These items benefit the company’s top and
bottom line simultaneously. Due to this, many companies in the chemical industry are growing
through strategic acquisitions to improve costs and synergies and are engaging in share buy-
back programs or higher dividend payments to return value to shareholders. Many companies,
including Westlake, are growing at great paces, but are still trading at reasonable valuations.
One downside to this industry and the world economy has been the sluggish growth
overseas. This can be seen in Europe and China mainly, as growth has been stagnant and
disappointing. This has led to the dollar’s appreciation against foreign currencies, making
foreign demand disappear, as products are more expensive coming from the U.S. This has hurt
many company’s earnings in the sector. This being said, the chemical industry and Westlake are
set to have another good year ahead of them, coming off of a strong 2014.
Firm Overview
Westlake Chemical Corporation manufactures and markets various petrochemicals,
polymers, and fabricated products. Their products include some of the most widely used
chemicals in the world, which are fundamental to many diverse consumer and industrial
markets, including flexible and rigid packaging, automotive products, coatings, residential and
commercial construction as well as other durable and non-durable goods. The operate primarily
in two main segments, the Olefin and Vinyl segments, with Olefin sales coming in at 62% of ’14
sales and Vinyl sales 38%. They also produce PVC resin and film through a 59% owned joint
venture, Suzhou Huasu Plastics Company. The company has a total of 2,200 employees and the
4

officers of the company own around 70% of stock in the company. The company is
headquartered in Houston, TX and operates in North America, Europe, and China. While last
year was mainly considered a transitional year due to the spinoff of Westlake Chemical Partners
and the acquisition of Vinnolit, a German PVC manufacturer for $611 mm to increase global
market share and expand product lines, revenues and earnings increased 17% and 11% in 2014.
Estimated expansion ranges from 5%-10% in upcoming years as the company has decided to
stall capital undertakings to focus on capital efficiency and management operations that, along
with lower prices, will boost margins and returns.
The company is well conditioned to take advantage of beneficial economic and industry
conditions to outperform peers. Profitable future and past growth has been attributable to the
company’s organizational structure through Westlake Chemical Partners LP and the integration
of acquisitions. With the purchase of Vinnolit, Westlake became the largest producer of low-
density polyethylene and PVC capabilities in the Americas, both of which have future high
demand growth forecasts. This positioning combined with the company’s strong balance sheet
and margins provides positive future outlook. Their ROC, ROA, and EBITDA margin all
outperformed peers last year and the company has more cash than total debt on hand allowing
them to grow through strategic, disciplined acquisitions.
Common Size Analysis
Balance Sheet
Figures 1 and 2 in the appendix section of the paper show both companies’ common
size balance sheets. When looing at Westlake’s balance sheet compared to the comparable
company’s it is first important to note that Westlake’s figures are shown in thousands, whereas
5

the comparable company’s are shown in millions. That being said, when looking at overall total
assets and liabilities it is clear that the two companies are very similar in size and most likely
market cap, because both company’s figures show around $5B in total assets and total liabilities
and equity. While this is definitely helpful when comparing the two companies, the main
differences will be found in looking at the common size figures for each balance sheet entry and
seeing how they differ between companies. Starting with the asset part of the balance sheet,
the main difference in common size numbers comes from the net property, plant, and
equipment figure, as current assets are very similar for the most part. Westlake’s PPE, net has
been around 50% of total assets, whereas the comparable company’s PPE, net has been around
35%.
Moving onto the liability and equity part of the balance sheet, it is most important to
note the differences in the total liabilities and total equity common size figures, as well as
retained earnings numbers. For Westlake, total liabilities make up around 35% of total liabilities
and equity with equity making up the 65% roughly. On the other hand, for the comparable
company we see that it is the opposite; total liabilities make up around 70% of total liabilities
and equity with equity making up the other 30%. This shows how different the company’s
fundamental structures are even though they are about the same size and operate in the same
industry. Westlake is using equity from shareholders to fund the business whereas the other
company is using mainly liabilities like debt, etc. Also, Westlake puts more weight on fixed
assets, which make up half of total assets.
6

Income Statement
Figures 3 and 4 in the appendix section of the paper show both companies’ common
size income statements. Before diving into common size items, it is important to note the
difference in overall sales, net income, and earnings between the two companies. The
comparable company is consistently doing sales of around $7B, whereas Westlake does around
$4B usually. Here, it is rationale to infer that this is due to the comparable company having a
larger market cap. This sales figure has an affect on the bottom lines of the companies, as the
comparable company has net income around $800 mm to $700 mm and Westlake has net
income around $600 mm to $500 mm. Consequently, the two companies earnings numbers
tend to differ slightly as well but not in the way you would expect, as Westlake has a 5-year
average EPS of around $3.4 and the comparable company has a 5-year average EPS of $2.7. This
reaffirms Westlake’s management emphasis on returning value to shareholders. Finally, the
two companies SG&A expenses figures differ widely. Westlake’s figures come in around 4% of
total sales, whereas the comparable company’s come in at around 25% of total sales. This is
really a revelation to Westlake’s emphasis on disciplined organizational structure and business
operations that also enhances the company’s margins and profitability.
Cash Flow Statement
Figures 5 and 6 in the appendix section of the paper show each company’s common size
cash flow statements. From looking at these common size figures for both companies it is clear
there are some similarities and differences in cash structure. Most noticeable are the
differences in CFO and CFI as percentages of total sales. Westlake’s CFO usually makes up about
20% of sales, whereas the comparable company’s makes up about 13%. Also, Westlake’s CFI
7

makes up about 16% of total sales and the other company’s make up 5%. It is rationale to infer
that this indicates Westlake relies more heavily on operations and investing to generate sales
and less on financing. This would make sense as Westlake’s long term debt is about $500 mm
and the comparable company’s long term debt is about 3 times that at $1.5B. Westlake has a
small debt figure compared to other companies in the industry, which allows them to use cash
in a healthy way to invest in cap ex and acquisitions, as well as returning value to shareholders
through earnings and dividends. The difference in the CFI numbers comes mainly from
Westlake’s higher cap ex and purchase of fixed assets numbers, which make up about 12% of
sales, whereas the comparable company’s make up only 5%. Westlake is dedicated to growing
through capital expenditures and acquisitions and has been doing so more efficiently then
other companies in the industry. Both companies dividend payments make up about the same
amount as a percentage of sales, indicating small dividend yields from each company. This is
consistent with many companies in the chemical industry. Although companies in this industry
have been dedicated to increasing dividends in this great economic environment, not many
investors look to companies in the industry for high yield and fixed income payments due to the
low yields.
The comparable company’s cash flow statement was constructed manually based off of
their given balance sheet and income statement. Starting with the CFO section, net income and
depreciation were taken from the income statement for each year. Asset accounts in this
section were calculated by taking the given prior year minus the current year and liability
accounts were calculated by taking the given current year minus the prior year. Moving to the
CFI section, purchases/sales of PPE was calculated by taking ending PPE minus beginning PPE
8

and adding back depreciation to that figure. If the number was positive it was added to the cash
flow statement as a negative to represent a cash outflow for the purchase of PPE. Other
accounts in this section such as intangibles and goodwill were calculated by taking prior years
minus the current year for each year. Next, in the CFF section, liability accounts were calculated
as they were in the CFO and CFI sections, which included treasury stock. Capital surplus was
calculated as if it was an asset and dividends paid were calculated by taking beginning retained
earnings plus net income for each year and subtracting ending retained earnings from that
figure. Dividends paid numbers were put into the cash flow statement as negatives as they
represent cash outflows for the company. Finally, CFO, CFI, and CFF were added to get total
cash flow and this number was compared to the change in cash for each year, which was
calculated as cash at the end of the year minus cash at the beginning of the year. If the change
in cash and total cash flow were equal then the cash flow balanced.
Balance Sheet Adjustments & Analysis
Figures 7 and 8 in the appendix section of the paper show Westlake’s pre-adjustment
balance sheet and post-adjustment balance sheet.
Inventories
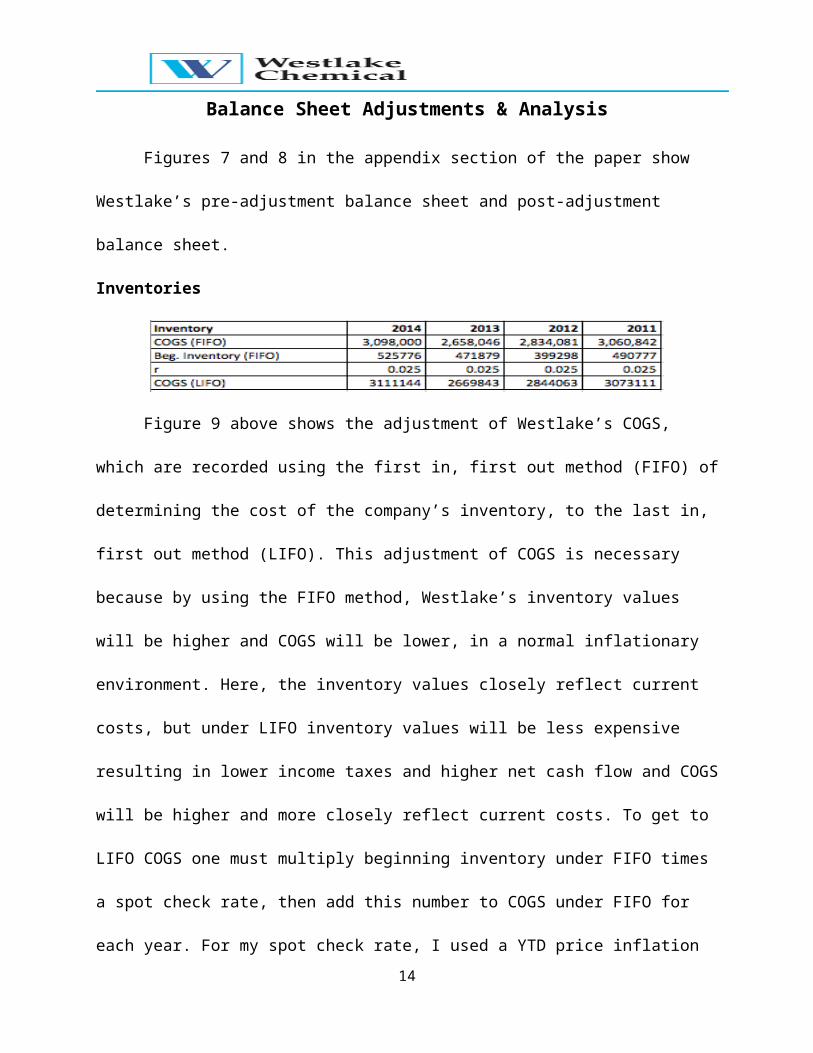
Figure 9 above shows the adjustment of Westlake’s COGS, which are recorded using the
first in, first out method (FIFO) of determining the cost of the company’s inventory, to the last
in, first out method (LIFO). This adjustment of COGS is necessary because by using the FIFO
method, Westlake’s inventory values will be higher and COGS will be lower, in a normal
9

inflationary environment. Here, the inventory values closely reflect current costs, but under
LIFO inventory values will be less expensive resulting in lower income taxes and higher net cash
flow and COGS will be higher and more closely reflect current costs. To get to LIFO COGS one
must multiply beginning inventory under FIFO times a spot check rate, then add this number to
COGS under FIFO for each year. For my spot check rate, I used a YTD price inflation spot check
on chemical commodities used in chemical companies main operations the most. This gave me
an r of 2.5%. The result of this adjustment was slightly higher COGS, which is a truer measure of
costs. This adjustment will in turn reduce gross profit and as a result net income. This will have
an affect on corresponding ratios by increasing activity ratios, like inventory turnover, and
decreasing profitability ratios, like profit margin. The accounting of COGS under FIFO is allowing
for the company’s net income and profitability numbers on the income statement to look a
little better than they are.
Capitalized Interest
Figure 10 above details the adjustment of Westlake’s capitalized interest resulting in a
truer measure of the company’s interest expense and cash flow items. Capitalized interest
items allow for lower interest expense and investing cash flow numbers and higher cash flow
from operations numbers and in turn better-shaped financial statements. In order to arrive at
10
more accurate numbers we must adjust for capitalized interest by adding it back to interest
expense figures on the income statement and cash flow from investing numbers on the cash
flow statement, as well as subtracting it from cash flow from operations. This is summarized in
the table above and from it we can see that it increases interest expense and cash flow from
investing numbers and decreases the cash flow from operating numbers. This adjustment
lowers net income on the income statement and in turn decreases EPS and CFO. These
decreases decrease the interest coverage ratio and profitability ratios, which negatively affects
the company.
Research & Development
Westlake has historically licensed technology from third party providers and do not
include any research and development costs to any items on their balance sheets in their 10-
k’s. Due to this, this item has no apparent effect on the company’s financial statements and
therefore does not affect the company’s financial ratios either.
Depreciation & Amortization Methods
Figures 11 and 12 above show calculations for long-lived assets of the company given
PPE net and gross, accumulated depreciation, and annual depreciation both before adjustments
to the company’s financials and after adjustments. Westlake uses straight-line methods for
their financial statements regarding these items. Estimated useful life is calculated by dividing
11

gross PPE by depreciation for each year, estimated age is calculated by dividing accumulated
depreciation by depreciation each year, and estimated remaining life is calculated by dividing
net fixed assets by depreciation each year. The adjustments to PPE due to operating and capital
leases, which will be discussed later in this paper, lead to a relatively invisible difference in the
calculations of these formulas, as the adjustment is miniscule. From these calculations for long-
lived assets we can infer that Westlake’s long-lived assets have a relatively long useful life, are
pretty young in nature, and have a long estimated remaining life compared to their comparable
company, who’s calculations will be shown below in the ratio section of the paper. This means
that significant capital expenditures should not be needed in the near future to replace assets
and in turn should not be expected or forecasted for the company. This benefits the company
greatly and management has said that they have pushed back capital-intensive activities to
focus more on operations and management, which will boost margins and profitability for the
company.
Acquisitions
Westlake has been involved in strategic acquisitions in order to grow operations and
profits in the industry. Acquisitions are a requirement to survive in the chemical industry and
Westlake has excelled at integrating acquired companies into operations and synergize
business. They also use acquisitions to increase EBITDA margin and add different segment
capacities and capabilities to their operations. For example, they acquired Vinnolit to boost
their PVC capabilities and segment in Europe, where demand is forecasted to be high. These
activities can be seen in the investing cash flow section of the financial statements and will
impact different items on the statements including asset, debt, and cap ex items. Specifically,
12

the balance sheet is affected the most, as both assets and liabilities will increase. Westlake has
been fortunate to have ample cash to pay for acquisitions and take in little debt in doing so.
Specifically, activity and solvency ratios will be affected as assets and debt increase.
Asset Impairments
Figure 13 above outlines long-lived asset impairments the company has had in the past
four years and shows that the company has not recorded any goodwill impairments in their
financials. The long-lived asset impairments that are shown as occurring and being recorded in
2014 and 2011 decrease fixed assets and equity in the firm. This will increase asset turnover
and debt-to-equity as equity and assets decrease. Net income will also decrease as a result
along with book value and deferred tax liabilities. However, in the future, due to these
impairments, depreciation will decrease, net income will increase, and ROA and ROE will
increase, which will reflect the company’s position and health positively. Most companies
impair assets all at once in order to say that the current quarter was bad, but future outlook will
be better and is positive.
Liabilities
In Westlake’s 10-k it is stated that, “The preparation of financial statements in
conformity with accounting principles generally accepted in the United States of America
requires management to make estimates and assumptions that affect the reported amounts of
assets, liabilities, revenues and expenses, and the disclosure of contingent assets and liabilities.
Actual results could differ from those estimates.” This results in a recording of contingent tax
13
liabilities in the company’s 10-k that is an estimate and true numbers could or could not
accurately reflect this number. If this account was not utilized or was under-utilized, it could
have a positive impact on liabilities and ratios involving liabilities, like solvency and liquidity
ratios.
Deferred Taxes
Figure 14 above details Westlake’s deferred taxes over the past four years. Westlake
uses the liability method for income taxes and deferred tax assets and liabilities are recorded
based on temporary differences between the tax basis of assets and liabilities and their carrying
values. Valuation allowances are created and recorded on deferred tax assets when it is likely
that these assets will not be realized. Deferred tax liabilities are caused by things like
depreciation, impairments, and inventories and will increase liabilities, whereas deferred tax
assets created by warranty items, etc. will increase assets. Deferred tax liabilities record smaller
taxable income and therefore pay less taxes today and more in the future; deferred tax assets
do the exact opposite. If the tax rate were to increase, DTL’s would increase along with tax
expenses, while decreasing net income and equity. Westlake’s tax rate has been increasing over
the years, along with their DTL’s. A growing firm who adds fixed assets will increase DTL’s and
this will benefit cash flows because future taxes wont be paid. On the opposite end, with DTA’s
and valuation allowances, if VA’s decrease, DTA’s will increase which will increase net income
14

and earnings, along with assets and equity and decrease solvency ratios and increase
profitability ratios.
Operating and Capital Leases
Figure 15 above shows Westlake’s operating and capital leases through the recording of
their net present values. Each capital and operating lease found on the company’s 10-ks over
the past four years were put into a cash flow register to be discounted back to their net present
value using future cash flows associated with the leases and the company’s long term
borrowing rate average. These NPV’s were then added back to the balance sheet in the asset
and liabilities sections. In the asset section, they were added to PPE, net and in the liability
section they were added to other liabilities. This and its affect are shown in the appendix
section in Figures 7 & 8, but will be explained here as well. This adjustment is done to
accurately reflect current assets and liabilities on the balance sheet, as they are hidden under
these leases, when added assets and liabilities will increase. This will increase long-lived assets
and their formulas for estimated life, will increase liquidity ratios, like the current ratio, and
decrease profitability ratios, like ROE and ROA.
Income Statement Adjustments and Analysis
Figures 16 and 17 in the appendix section of the paper show Westlake’s pre-adjustment
income statement and post-adjustment income statement.
15

Revenue Recognition
Starting this current year old revenue recognition standards regarding long-term
contracts will be changed to a new standard, where the transaction price will be allocated
based on performance obligations and revenue will be recognized based on performance
satisfaction. This will cause Westlake to make estimates and judgment on recorded
performance obligations and recognition. For product items and sales, revenue is recognized
when evidence of a contract occurs, products are delivered, price is determined, and collection
is assured. For domestic items, risk passes when product is delivered; for foreign items, risk
passes during a specified time in the contract agreement.
Meaningful Items
Westlake did not record any unusual items, discounted operations, extraordinary items,
or prior period adjustments in their 10-k, but did record and state a change in accounting
principles and estimates, which is also detailed above in regard to revenue recognition. Starting
this current year old revenue recognition standards regarding long-term contracts will be
changed to a new standard, where the transaction price will be allocated based on
performance obligations and revenue will be recognized based on performance satisfaction.
This will cause Westlake to make estimates and judgment on recorded performance obligations
and recognition. It is important to note though that in 2012, the company recorded a $16 mm
loss to net income on their comprehensive income statement due to an unscheduled shut
down of a vinyl facility due to a fire.
16

Net Income & Comprehensive Income
In 2014, Westlake recorded net income of $678 mm and comprehensive income of $601
mm. The difference in incomes was due largely to a $60 mm loss on foreign currency
translations that occurred because of the company’s foreign operations and the appreciation of
the dollar against foreign currencies. The translation of dollars to foreign currency resulted in
this loss for 2014. In 2013, the company recorded net income of $610 mm and comprehensive
income of $618 mm largely due to the amortization of benefits liabilities of $2 mm and other
comprehensive gains. Finally, in 2012, the company recorded net income of $385 mm and
comprehensive income of $383 mm, which is only a slight change. A net realized loss to net
income of $16 mm was probably offset by a recorded unrealized gain on investments of $15
mm. This loss to net income in 2012 was due to an unscheduled shut down of a vinyl facility as
a result of a fire.
Cash Flow Statement Adjustments & Analysis
Figures 18 and 19 in the appendix section of the paper show Westlake’s pre-adjustment
cash flow statement and post-adjustment cash flow statement.
Reclassified Interest & Dividend Cash Flows
In the adjustments pointed out in the figures named above, which are located in the
appendix section of the paper below, we can see that interest income, interest payments, and
dividends received were all added to the financing section of the statement of cash flows to
adjust for this item that relates to financing. They are deducted from operating cash flow and
added to financing to better show cash flow assignment and classification so it is possible to
better estimate and see where cash is going to and coming from for the company. Interest
17

income of $3.4 mm, $3.1 mm, $4.01 mm, and $2.9 mm were deducted from CFO and added to
cash flow from financing from 2014 to 2011, respectively. Interest paid of $35.3 mm, $16.4 mm,
$42.3 mm, and $48.4 mm were also deducted from CFO and added to cash flow from financing
from 2014 to 2011, respectively. Finally, dividends received of $5.4 mm, $5.1 mm, $4.4 mm,
and $0 mm were deducted from CFO and added to cash flow from financing from 2014 to 2011,
respectively. This resulted in decreases in CFF and CFO accounts each year after the
adjustments due to the accounts being deducted from CFO and added negatively to CFF. This
more accurately reflects the cash flows Westlake is using for financing and operations, as
before the adjustments CFF was understated and CFO was overstated.
Cash Flow Statement Analysis
Again, the cash flow statements referred to are showed in Figures 18 and 19 in the
appendix section of the paper. From these, we can see that CFO and CFI are the most
consistent and large sections of the cash flow statement as Westlake generates ample cash
from operations and utilizes it to acquire companies and add fixed assets to their business each
year efficiently. The major outflows recorded in the CFF sections are the repayment of debt in
2012 alone and the payment of dividends each year to return value to shareholders.
In the CFO section, net income and depreciation shape of the make up of the segment,
as they make up around 90% of CFO each year. CFO increased largely in 2014 due to higher net
income, depreciation, accounts receivable, deferred income taxes, and inventories to come out
at $952 mm compared to $680 mm in 2013. In 2013, accounts receivable were actually -$14
mm due to unfulfilled contract obligations and bad estimations.
18

In the CFI section, 2013 and 2014 represented a large outflow for investing due to large
acquisitions of $611 mm and $178 mm each year and additions to fixed assets of $431 mm and
$679 mm each year as well. In both years, the company recorded proceeds from the sale of
securities of $342 mm and $252 mm to offset these big outflows due to cap ex in order to fund
growth for the company and gaining of market share. 2013 was the only year the company saw
more outflows due to CFI and CFF then they saw inflows from CFO, this represents overall good
health for the company.
In the CFF section, 2013 and 2012 saw big outflows due to paid dividends and interest.
In 2012, the company repaid debt of $250 mm, which is the only year they have done so in this
four-year period, but also issued debt of $248 mm as an offset account. 2014 was a peculiar
year and situation due to the fact that the CFF that year was actually a cash inflow of $138 mm
due to proceeds from the issuance of Westlake Partners, which represented a cash inflow of
$286 mm and represents the IPO of the company and sale of 48% of it through common share
issuance. Westlake Corp. owns the remaining 52% in the limited partnership, which was formed
to operate, acquire, and develop ethylene production facilities and other assets.
From the cash flow statement it is evident that Westlake is generating high, sustainable
cash from operations each year and utilizing it to fund growth through cap ex, acquisitions, and
purchases of fixed assets. It is also evident they are doing a good job of financing appropriately
and the formation of Westlake Partners last year was extremely beneficial and will be going
forward for the company.
19

FCFF & FCFE
Figures 20 and 21 shown above outline the calculations of the company’s FCFE and FCFF
both before adjustments were made to their financial statements and after. Multiplying each
year’s interest expense by 1- the tax rate and adding that number to CFO was done and after,
cap ex was subtracted to get the FCFF number. FCFF represents the profitability and cash
generated for the firm after expenses and reinvestments are accounted for. From these
numbers we can see that Westlake is generating ample cash for the firm, around $600 mm
specifically. FCFE was calculated by subtracting cap ex and net borrowing from CFO and FCFE
represents the amount of cash that can be used to pay shareholders after expenses,
reinvestments, and debt are accounted for. These numbers are in line with the FCFF numbers at
around $600 mm and shows ample cash generation that can be used to return value to
shareholders of the company. Westlake generates major amounts of cash flows to pump back
into the firm or give out to shareholders and this gives us an overview of the health of the
company after factors like debt, expenses, and reinvesting are done.
Regardless of the adjustments, it is evident that large CFO generation and low
borrowing numbers boost FCFE and FCFF and benefit the firm greatly. It is also evident that
FCFE and FCFF are still supported and still plentiful even after large amounts of cap ex due to
20

fixed asset buying and acquisitions of other businesses, which bodes very well for Westlake.
Regarding FCFF, the adjustments decreased CFO due to decreased net income and taking out
the interest paid, dividends received, and interest income from CFO. Interest was also increased
due to the adding back of capitalized interest, which resulted in an overall reduction of FCFF.
Regarding FCFE, the adjustments did the same to decrease CFO, which resulted in the same
reduction of overall FCFE.
Financial Ratio Analysis
Westlake Corp. & Comparable Co.
21

In Figure 22, 23, & 24 shown above, various activity, liquidity, solvency, profitability,
valuation, and long-lived asset ratios were calculated for Westlake Corp., both before and after
adjustments were made to their financial statements, and for their comparable company in an
effort to compare the ratios against one another to get a better perspective on where the
company stands and what the company does well and poorly. The adjustments for Westlake
did not alter the ratios substantially, but did have an effect on the inventory turnover, interest
coverage, and profitability ratios the most. Inventory turnover increased with the adjustment of
COGS from FIFO to LIFO as COGS increased. Interest coverage decreased due to increased
interest because of the adjustment that added capitalized interest to interest expense. All of
the profitability ratios decreased because of the various increases in assets, liabilities, expenses,
and the decrease of net income and earnings because of the adjustments.
22

Overall, looking at Westlake’s ratios compared to their comparable company’s ratios, an
equity investor should be excited about Westlake’s performance against their peer. Their
liquidity, solvency, profitability, and long-lived asset ratios all dominate their peers and drive
their business. Their low debt, high cash flow generation, increasing net income and earnings,
and strong sales growth shows in their profitability and solvency ratios and indicates overall
good health and margin expansion for the company. Cash used for acquisitions and capital
purchases are driving this margin expansion and financial health. Their financials are in great
shape and it shows through their ratios. Their long-lived asset ratios also indicate that the
company will not have to make any large cap ex on fixed assets anytime soon so they will be
able to focus on the core business and margin expansion like they plan to.
**(Appendix is located below on pg. 24)
23

Appendix
Figure 1
Figure 2
24

Figure 3
Figure 4
25
Figure 5
Figure 6
26

Figure 7
27

Figure 8
Figure 16
28

Figure 17
Figure 18
29

Figure 19
30