women & children’s institute
TRANSCRIPT

Women & Children’s InstituteTrina Jellison, GVPSeptember 28, 2021
Physician Leads: Mike Barsotti, MD & Kevin Pieper, MDSystem Leadership: Trina Jellison, Group VP & Courtney Jackson, Director
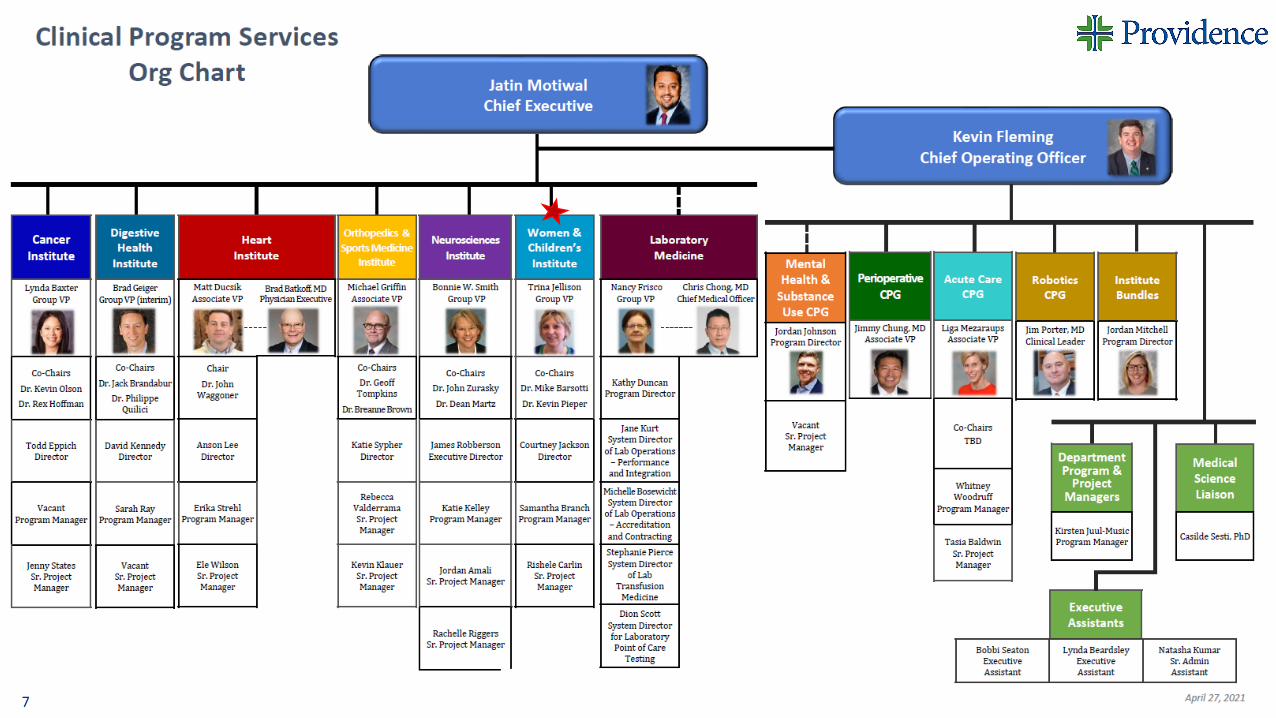
Clinical Program Services (CPS)
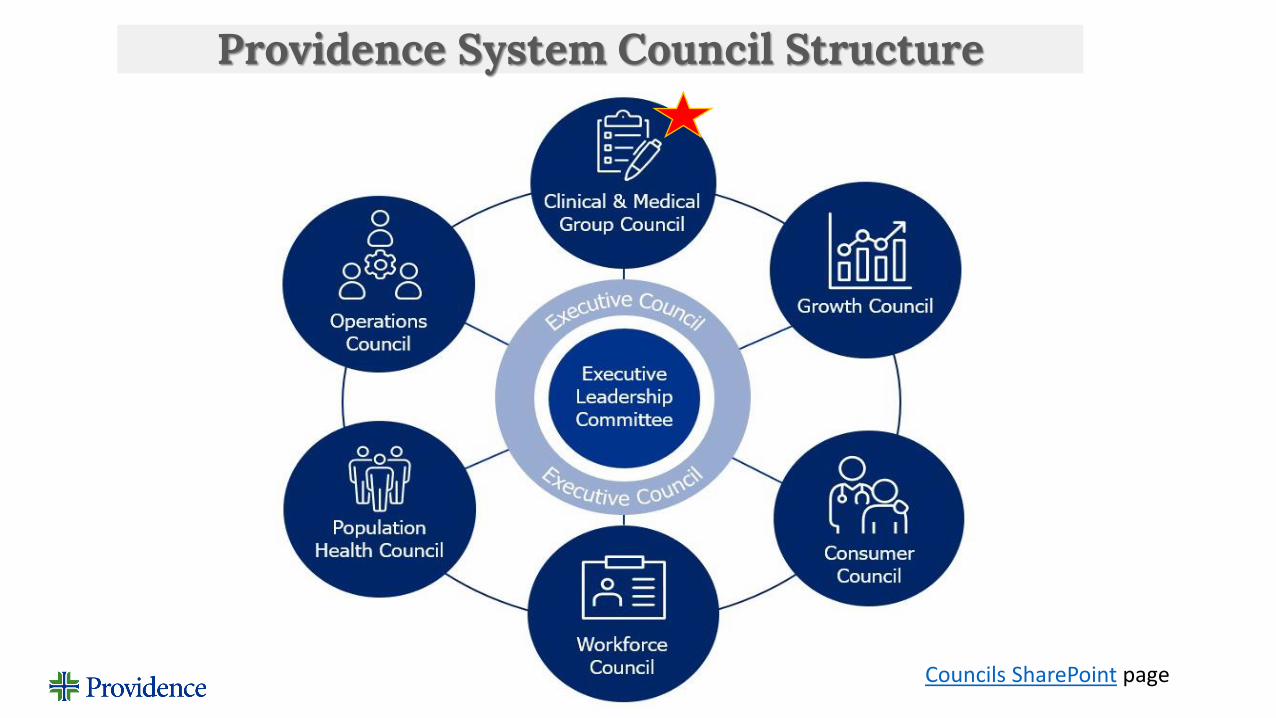
Councils SharePoint page
Providence System Council Structure


7
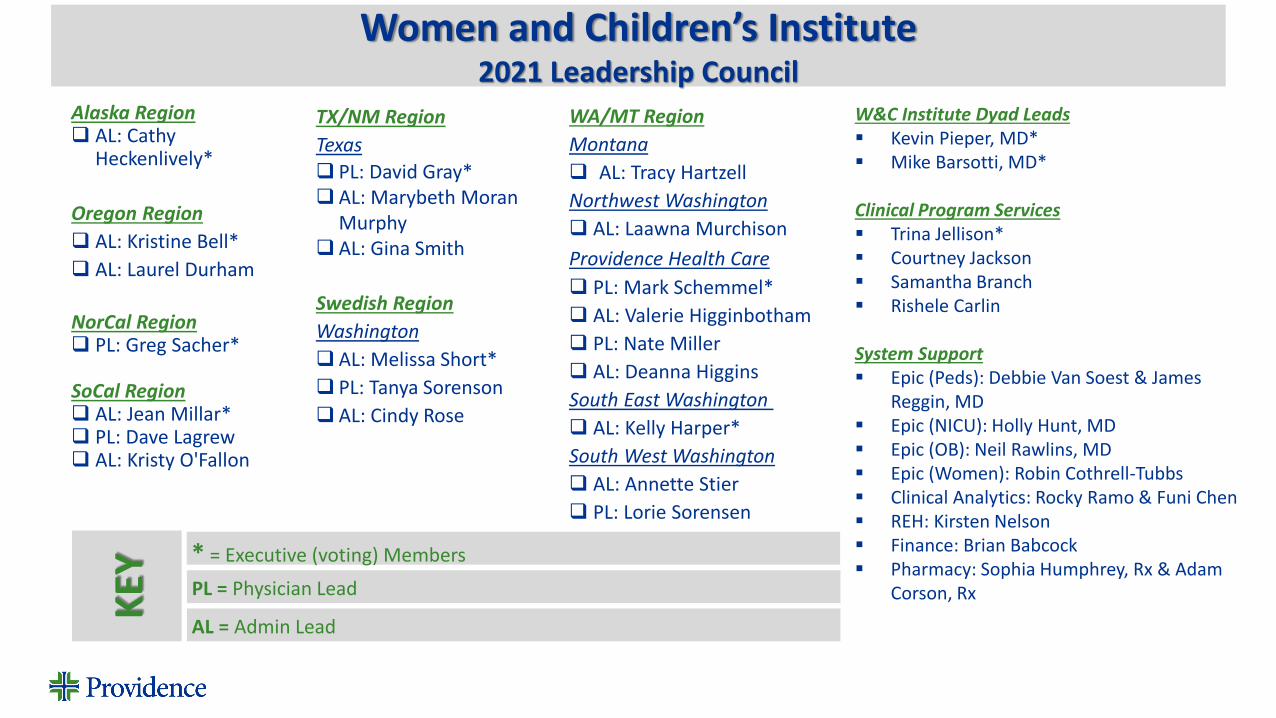
Alaska Region❑ AL: Cathy
Heckenlively*
Oregon Region
❑ AL: Kristine Bell*
❑ AL: Laurel Durham
NorCal Region❑ PL: Greg Sacher*
SoCal Region❑ AL: Jean Millar*❑ PL: Dave Lagrew❑ AL: Kristy O'Fallon
WA/MT Region
Montana
❑ AL: Tracy Hartzell
Northwest Washington
❑ AL: Laawna Murchison
Providence Health Care
❑ PL: Mark Schemmel*
❑ AL: Valerie Higginbotham
❑ PL: Nate Miller
❑ AL: Deanna Higgins
South East Washington
❑ AL: Kelly Harper*
South West Washington
❑ AL: Annette Stier
❑ PL: Lorie Sorensen
W&C Institute Dyad Leads▪ Kevin Pieper, MD*▪ Mike Barsotti, MD*
Clinical Program Services▪ Trina Jellison*▪ Courtney Jackson▪ Samantha Branch▪ Rishele Carlin
System Support▪ Epic (Peds): Debbie Van Soest & James
Reggin, MD▪ Epic (NICU): Holly Hunt, MD▪ Epic (OB): Neil Rawlins, MD▪ Epic (Women): Robin Cothrell-Tubbs▪ Clinical Analytics: Rocky Ramo & Funi Chen▪ REH: Kirsten Nelson▪ Finance: Brian Babcock▪ Pharmacy: Sophia Humphrey, Rx & Adam
Corson, Rx
* = Executive (voting) Members
Women and Children’s Institute2021 Leadership Council
TX/NM Region
Texas
❑ PL: David Gray*❑ AL: Marybeth Moran
Murphy❑ AL: Gina Smith
Swedish Region
Washington
❑ AL: Melissa Short*
❑ PL: Tanya Sorenson
❑ AL: Cindy Rose
PL = Physician Lead
AL = Admin Lead
KEY
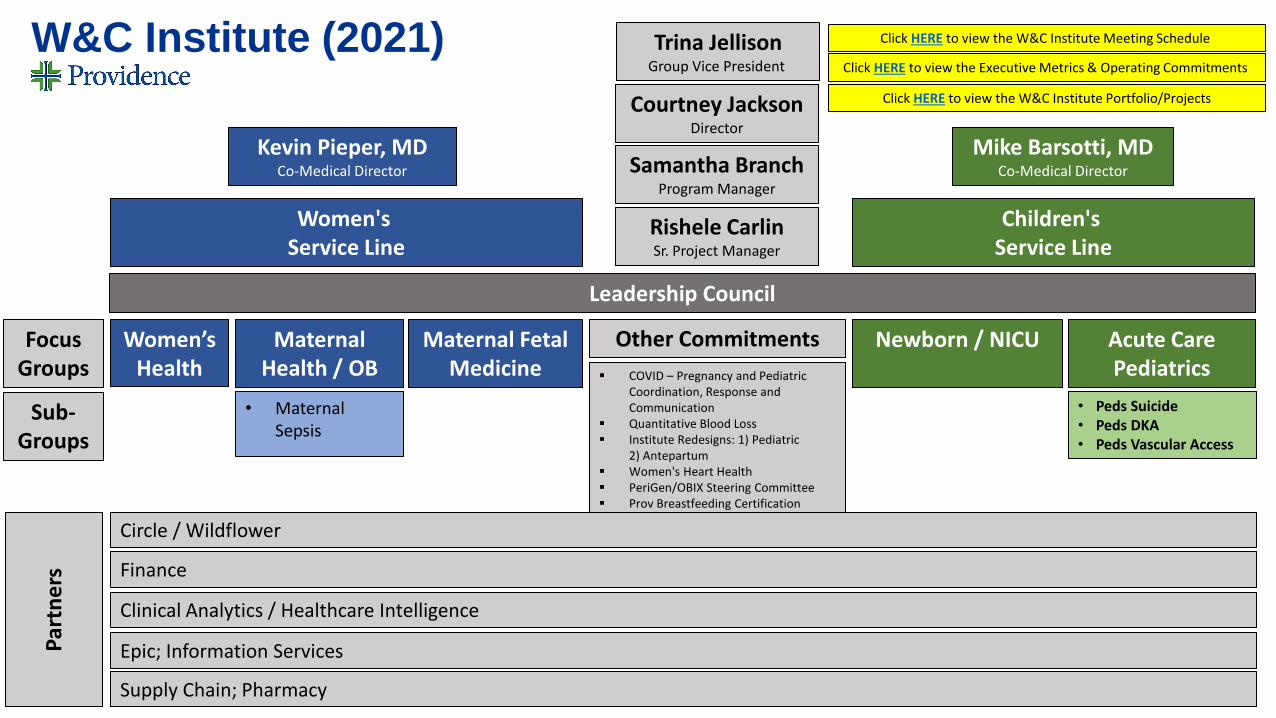
Rishele CarlinSr. Project Manager
Samantha BranchProgram Manager
Courtney JacksonDirector
Trina JellisonGroup Vice President
Mike Barsotti, MDCo-Medical Director
Kevin Pieper, MDCo-Medical Director
Women'sService Line
Children'sService Line
Leadership Council
Women’s Health
Maternal Health / OB
Maternal Fetal Medicine
Focus Groups
Sub-Groups
• Maternal Sepsis
Newborn / NICU Acute Care Pediatrics
• Peds Suicide• Peds DKA• Peds Vascular Access
Other Commitments
▪ COVID – Pregnancy and Pediatric Coordination, Response and Communication
▪ Quantitative Blood Loss▪ Institute Redesigns: 1) Pediatric
2) Antepartum▪ Women's Heart Health▪ PeriGen/OBIX Steering Committee▪ Prov Breastfeeding Certification
Review BoardCircle / Wildflower
Click HERE to view the W&C Institute Meeting Schedule
Click HERE to view the Executive Metrics & Operating Commitments
W&C Institute (2021)P
artn
ers Finance
Clinical Analytics / Healthcare Intelligence
Epic; Information Services
Supply Chain; Pharmacy
Click HERE to view the W&C Institute Portfolio/Projects

2021 Women & Children’s Institute Focus Groups/Subgroups
2021 Completed Projects:✓ Acute Care Peds – ED Sepsis✓ Acute Care Peds – NAS to NOWS✓ Acute Care Peds – DKA Pathway✓ MFM – Cord GasVisit SharePoint for full list of completed project and additional details (LINK)
2021 Ongoing Collaboration Projects:▪ Zero Suicide and Acute Care Peds – Pediatric Suicide
Screening Tools▪ W&C and Heart Institute - Women's Heart Health▪ Maternal Health/OB and MFM – Postpartum Hypertension▪ MFM – Vigilance & OBIX▪ W&C and Circle – Circle App (Wildflower)
2021 Monitored Work:▪ Executive Metrics (LINK)▪ Maternal Health/OB - Quantitative Blood Loss▪ Providence Breastfeeding Certification
2021 Upcoming Projects:❑ Acute Care Peds – Peds ED Readiness❑ Acute Care Peds – Abuse Screening Tools❑ Maternal Health/OB – Teambirth❑ Maternal Health/OB – Telehealth❑ MFM - Consultation and Transfer GuidelinesTo participate in this work (LINK), please contact [email protected]
Maternal Fetal Medicine
Focus Group
Acute Care Peds –
Vascular Access
Maternal Health/OB -
Maternal Sepsis
MFM –PeriGenSteering
Committee
Acute Care Pediatrics
Focus Group
Maternal Health/OB
Focus Group
Newborn & NICU Focus
Group
InstituteRedesigns: 1) Pediatric
2) Antepartum
Women's Health Focus
Group
David Lagrew, MD &Laurel Durham, RN
Courtney Jackson
Samantha Branch & Rishele CarlinMike Barsotti, MD
Lead(s) - TBD
Nam Hong &Trina Jellison, MHA, RN
David Gray, MD &Cathy Heckenlively, RN
Tanya Sorensen, MD &Dale Reisner, MD
Greg Sacher, MD &Sarah Myers, RN
Title & IntentTarget
(System)Current
Baseline
(System)
Data
Source
Target Setting Methodology &
Connection to StrategyCurrent Status
Ex
ec
uti
ve
Me
tric
s
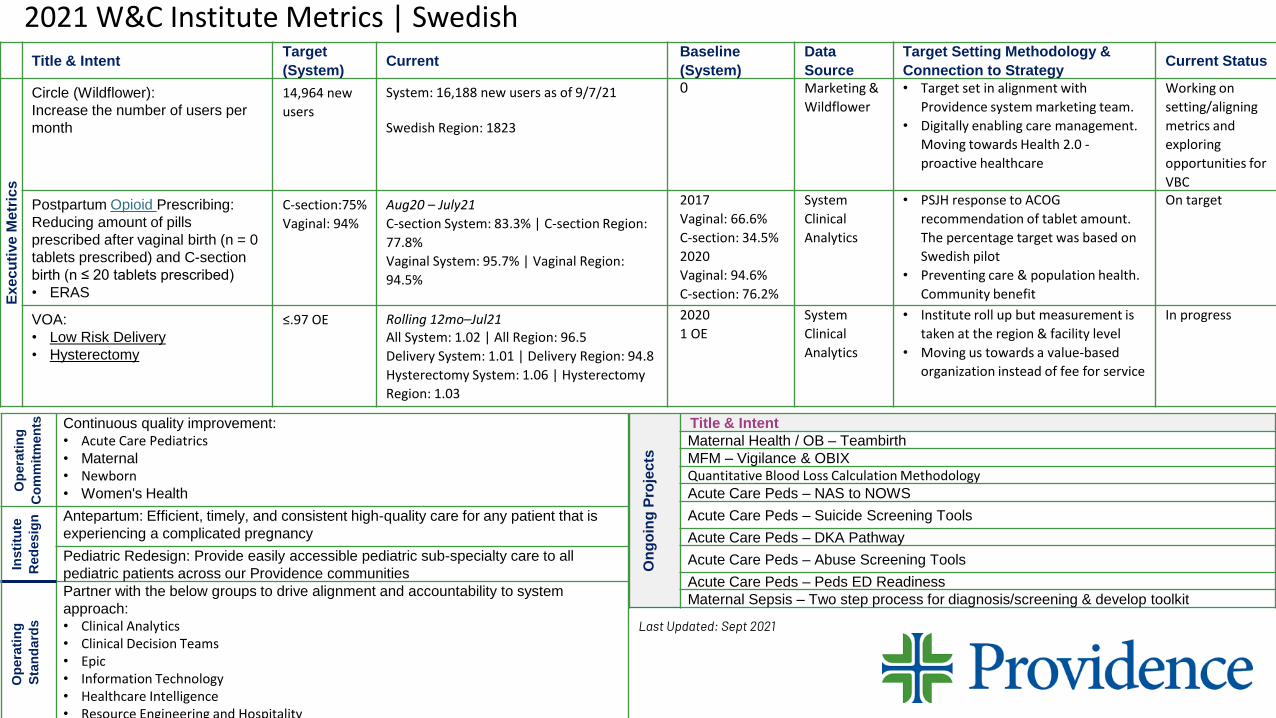
Circle (Wildflower):
Increase the number of users per
month
14,964 new
users
System: 16,188 new users as of 9/7/21
Swedish Region: 1823
0 Marketing &
Wildflower
• Target set in alignment with
Providence system marketing team.
• Digitally enabling care management.
Moving towards Health 2.0 -
proactive healthcare
Working on
setting/aligning
metrics and
exploring
opportunities for
VBC
Postpartum Opioid Prescribing:
Reducing amount of pills
prescribed after vaginal birth (n = 0
tablets prescribed) and C-section
birth (n ≤ 20 tablets prescribed)
• ERAS
C-section:75%
Vaginal: 94%
Aug20 – July21
C-section System: 83.3% | C-section Region:
77.8%
Vaginal System: 95.7% | Vaginal Region:
94.5%
2017
Vaginal: 66.6%
C-section: 34.5%
2020
Vaginal: 94.6%
C-section: 76.2%
System
Clinical
Analytics
• PSJH response to ACOG
recommendation of tablet amount.
The percentage target was based on
Swedish pilot
• Preventing care & population health.
Community benefit
On target
VOA:
• Low Risk Delivery
• Hysterectomy
≤.97 OE Rolling 12mo–Jul21All System: 1.02 | All Region: 96.5
Delivery System: 1.01 | Delivery Region: 94.8
Hysterectomy System: 1.06 | Hysterectomy
Region: 1.03
2020
1 OE
System
Clinical
Analytics
• Institute roll up but measurement is
taken at the region & facility level
• Moving us towards a value-based
organization instead of fee for service
In progress
2021 W&C Institute Metrics | Swedish
On
go
ing
Pro
jects
Title & Intent
Maternal Health / OB – Teambirth
MFM – Vigilance & OBIXQuantitative Blood Loss Calculation MethodologyAcute Care Peds – NAS to NOWS
Acute Care Peds – Suicide Screening Tools
Acute Care Peds – DKA Pathway
Acute Care Peds – Abuse Screening Tools
Acute Care Peds – Peds ED Readiness
Maternal Sepsis – Two step process for diagnosis/screening & develop toolkit
Op
era
tin
g
Co
mm
itm
en
ts Continuous quality improvement:
• Acute Care Pediatrics• Maternal
• Newborn• Women's Health
Ins
titu
te
Red
esig
n Antepartum: Efficient, timely, and consistent high-quality care for any patient that is
experiencing a complicated pregnancy
Pediatric Redesign: Provide easily accessible pediatric sub-specialty care to all
pediatric patients across our Providence communities
Op
era
tin
g
Sta
nd
ard
s
Partner with the below groups to drive alignment and accountability to system
approach:• Clinical Analytics• Clinical Decision Teams• Epic• Information Technology• Healthcare Intelligence • Resource Engineering and Hospitality
Last Updated: Sept 2021

P&L by Discharge Year
2021Q1 2018 2019 2020 2021Q1
Facility Statistics
ADC 957.3 936.7 898.5 850.5
CMI 0.86 0.89 0.91 0.95
ALOS 3.1 3.1 3.1 3.2
% Commercial 51% 53% 53% 49%
Inpatient Cases 113,169 111,023 105,278 23,945
Outpatient Cases 328,673 313,856 244,484 63,312
Combined P&L
Facility Direct:
Net Service Revenue 1,236,489,609$ 1,272,866,041$ 1,246,985,011$ 302,623,021$
Top Side Revenue 33,147,436$ 39,865,840$ 38,398,499$ 9,457,150$
Total Revenue 1,269,637,045$ 1,312,731,881$ 1,285,275,803$ 312,080,171$
Supply (75,410,526)$ (76,085,935)$ -$ (18,868,626)$
Labor (518,960,584)$ (517,647,307)$ -$ (135,183,240)$
Pharm (19,917,466)$ (18,129,717)$ -$ (4,287,507)$
Professional Fee (33,452,205)$ (38,598,166)$ -$ (11,436,320)$
Purchased Services (40,014,661)$ (42,133,976)$ -$ (10,513,386)$
Other (12,361,280)$ (12,320,541)$ -$ (3,402,341)$
Total Facility Direct Expenses (700,116,722)$ (704,915,642)$ -$ (183,691,420)$
Professional Investment (33,125,429)$ (29,296,115)$ -$ (5,963,087)$
Program Subtotal 536,394,894.00$ 578,520,124$ 122,425,664$
Program Subtotal Margin (% of NOR) 43% 45% 40%
Medical Group Primary Care Investment (45,076,658)$ (41,448,914)$ (11,539,295)$
Facility Indirect Expense (232,032,267)$ (227,769,144)$ (56,473,243)$
Regional & System Overhead (177,465,056)$ (186,959,384)$ (51,409,036)$
Net Operating Income (Fully Loaded) 81,820,913$ 122,342,682$ 3,004,090$
Net Operating Income Margin (% of NOR) 7% 10% 1%
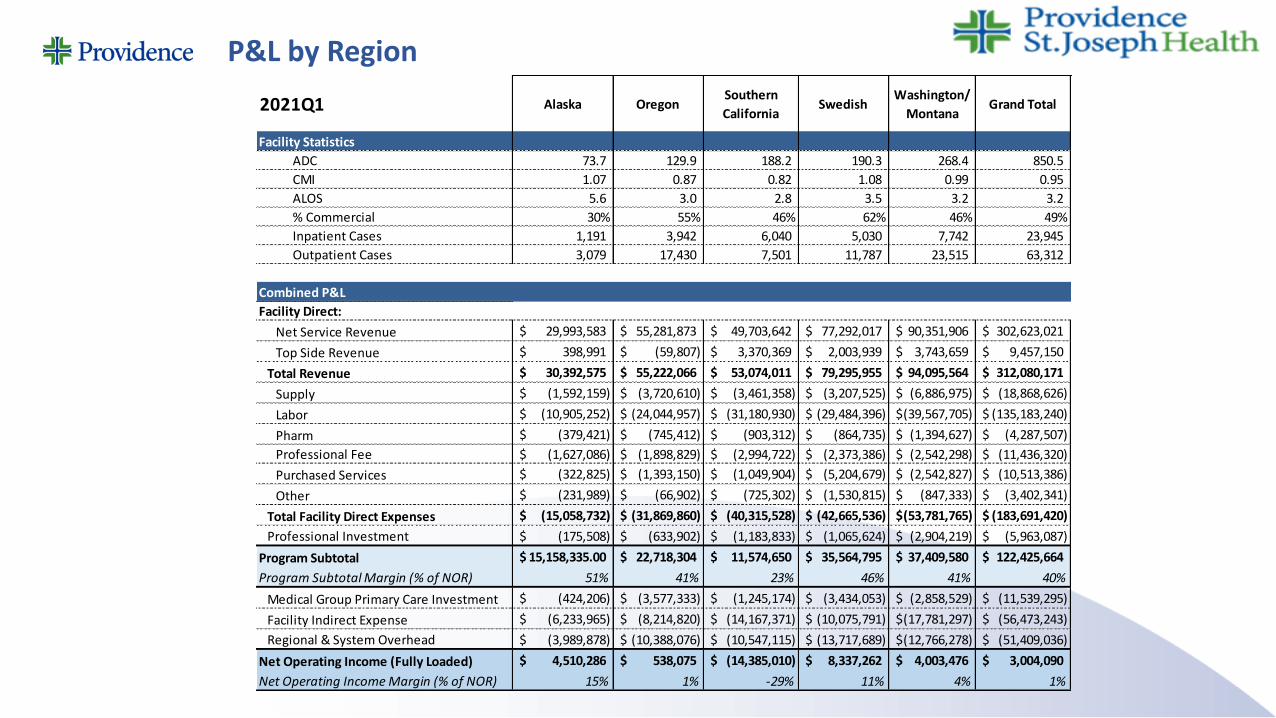
P&L by Region
2021Q1 Alaska OregonSouthern
CaliforniaSwedish
Washington/
MontanaGrand Total
Facility Statistics
ADC 73.7 129.9 188.2 190.3 268.4 850.5
CMI 1.07 0.87 0.82 1.08 0.99 0.95
ALOS 5.6 3.0 2.8 3.5 3.2 3.2
% Commercial 30% 55% 46% 62% 46% 49%
Inpatient Cases 1,191 3,942 6,040 5,030 7,742 23,945
Outpatient Cases 3,079 17,430 7,501 11,787 23,515 63,312
Combined P&L
Facility Direct:
Net Service Revenue 29,993,583$ 55,281,873$ 49,703,642$ 77,292,017$ 90,351,906$ 302,623,021$
Top Side Revenue 398,991$ (59,807)$ 3,370,369$ 2,003,939$ 3,743,659$ 9,457,150$
Total Revenue 30,392,575$ 55,222,066$ 53,074,011$ 79,295,955$ 94,095,564$ 312,080,171$
Supply (1,592,159)$ (3,720,610)$ (3,461,358)$ (3,207,525)$ (6,886,975)$ (18,868,626)$
Labor (10,905,252)$ (24,044,957)$ (31,180,930)$ (29,484,396)$ (39,567,705)$ (135,183,240)$
Pharm (379,421)$ (745,412)$ (903,312)$ (864,735)$ (1,394,627)$ (4,287,507)$
Professional Fee (1,627,086)$ (1,898,829)$ (2,994,722)$ (2,373,386)$ (2,542,298)$ (11,436,320)$
Purchased Services (322,825)$ (1,393,150)$ (1,049,904)$ (5,204,679)$ (2,542,827)$ (10,513,386)$
Other (231,989)$ (66,902)$ (725,302)$ (1,530,815)$ (847,333)$ (3,402,341)$
Total Facility Direct Expenses (15,058,732)$ (31,869,860)$ (40,315,528)$ (42,665,536)$ (53,781,765)$ (183,691,420)$
Professional Investment (175,508)$ (633,902)$ (1,183,833)$ (1,065,624)$ (2,904,219)$ (5,963,087)$
Program Subtotal 15,158,335.00$ 22,718,304$ 11,574,650$ 35,564,795$ 37,409,580$ 122,425,664$
Program Subtotal Margin (% of NOR) 51% 41% 23% 46% 41% 40%
Medical Group Primary Care Investment (424,206)$ (3,577,333)$ (1,245,174)$ (3,434,053)$ (2,858,529)$ (11,539,295)$
Facility Indirect Expense (6,233,965)$ (8,214,820)$ (14,167,371)$ (10,075,791)$ (17,781,297)$ (56,473,243)$
Regional & System Overhead (3,989,878)$ (10,388,076)$ (10,547,115)$ (13,717,689)$ (12,766,278)$ (51,409,036)$
Net Operating Income (Fully Loaded) 4,510,286$ 538,075$ (14,385,010)$ 8,337,262$ 4,003,476$ 3,004,090$
Net Operating Income Margin (% of NOR) 15% 1% -29% 11% 4% 1%
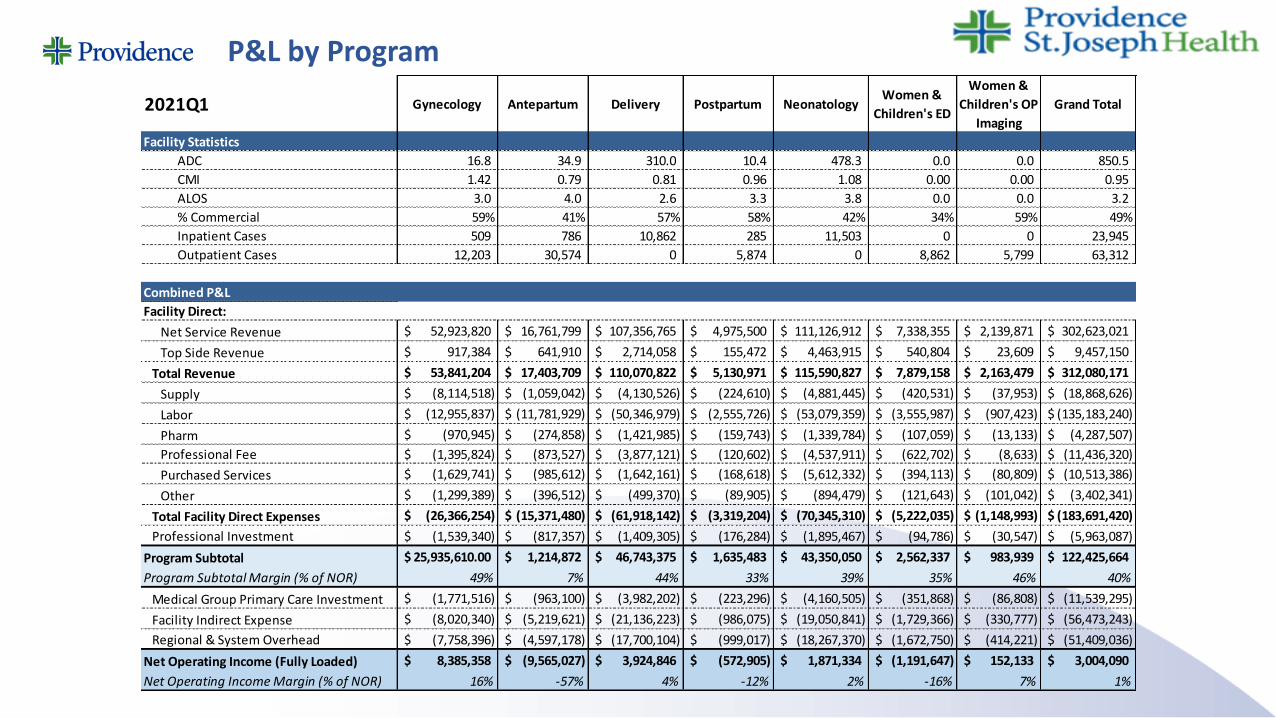
2021Q1 Gynecology Antepartum Delivery Postpartum NeonatologyWomen &
Children's ED
Women &
Children's OP
Imaging
Grand Total
Facility Statistics
ADC 16.8 34.9 310.0 10.4 478.3 0.0 0.0 850.5
CMI 1.42 0.79 0.81 0.96 1.08 0.00 0.00 0.95
ALOS 3.0 4.0 2.6 3.3 3.8 0.0 0.0 3.2
% Commercial 59% 41% 57% 58% 42% 34% 59% 49%
Inpatient Cases 509 786 10,862 285 11,503 0 0 23,945
Outpatient Cases 12,203 30,574 0 5,874 0 8,862 5,799 63,312
Combined P&L
Facility Direct:
Net Service Revenue 52,923,820$ 16,761,799$ 107,356,765$ 4,975,500$ 111,126,912$ 7,338,355$ 2,139,871$ 302,623,021$
Top Side Revenue 917,384$ 641,910$ 2,714,058$ 155,472$ 4,463,915$ 540,804$ 23,609$ 9,457,150$
Total Revenue 53,841,204$ 17,403,709$ 110,070,822$ 5,130,971$ 115,590,827$ 7,879,158$ 2,163,479$ 312,080,171$
Supply (8,114,518)$ (1,059,042)$ (4,130,526)$ (224,610)$ (4,881,445)$ (420,531)$ (37,953)$ (18,868,626)$
Labor (12,955,837)$ (11,781,929)$ (50,346,979)$ (2,555,726)$ (53,079,359)$ (3,555,987)$ (907,423)$ (135,183,240)$
Pharm (970,945)$ (274,858)$ (1,421,985)$ (159,743)$ (1,339,784)$ (107,059)$ (13,133)$ (4,287,507)$
Professional Fee (1,395,824)$ (873,527)$ (3,877,121)$ (120,602)$ (4,537,911)$ (622,702)$ (8,633)$ (11,436,320)$
Purchased Services (1,629,741)$ (985,612)$ (1,642,161)$ (168,618)$ (5,612,332)$ (394,113)$ (80,809)$ (10,513,386)$
Other (1,299,389)$ (396,512)$ (499,370)$ (89,905)$ (894,479)$ (121,643)$ (101,042)$ (3,402,341)$
Total Facility Direct Expenses (26,366,254)$ (15,371,480)$ (61,918,142)$ (3,319,204)$ (70,345,310)$ (5,222,035)$ (1,148,993)$ (183,691,420)$
Professional Investment (1,539,340)$ (817,357)$ (1,409,305)$ (176,284)$ (1,895,467)$ (94,786)$ (30,547)$ (5,963,087)$
Program Subtotal 25,935,610.00$ 1,214,872$ 46,743,375$ 1,635,483$ 43,350,050$ 2,562,337$ 983,939$ 122,425,664$
Program Subtotal Margin (% of NOR) 49% 7% 44% 33% 39% 35% 46% 40%
Medical Group Primary Care Investment (1,771,516)$ (963,100)$ (3,982,202)$ (223,296)$ (4,160,505)$ (351,868)$ (86,808)$ (11,539,295)$
Facility Indirect Expense (8,020,340)$ (5,219,621)$ (21,136,223)$ (986,075)$ (19,050,841)$ (1,729,366)$ (330,777)$ (56,473,243)$
Regional & System Overhead (7,758,396)$ (4,597,178)$ (17,700,104)$ (999,017)$ (18,267,370)$ (1,672,750)$ (414,221)$ (51,409,036)$
Net Operating Income (Fully Loaded) 8,385,358$ (9,565,027)$ 3,924,846$ (572,905)$ 1,871,334$ (1,191,647)$ 152,133$ 3,004,090$
Net Operating Income Margin (% of NOR) 16% -57% 4% -12% 2% -16% 7% 1%
P&L by Program
Thank you for partnering with us to bring…Health for a Better World!