women’s inheritance rights and entrepreneurship gender gap · prevent women from starting...
TRANSCRIPT

Women’s Inheritance Rights and Entrepreneurship Gender Gap
S. Lakshmi Naaraayanan †
November 12, 2019
Abstract
The gender gap in entrepreneurship undermines economic growth, which emphasizes the im-portance of understanding what impedes business formation by women. Utilizing a staggeredreform that granted women from specific religious groups inheritance rights equal to men, Iexamine whether relaxing financial constraints in the presence of discriminatory social normsfosters entrepreneurship among women. Exploiting variation in inheritance rights across genderand religion, I find that the reform significantly increased firm creation by women without wors-ening the quality of new entrants. Post reform, collateral enables financial inclusion and leadsto business formation. Overall, results suggest that improved access to finance can narrow thegender gap in entrepreneurship, even in the presence of discriminatory social norms.
JEL classification: D14, J23, L26, M13
Keywords: Entrepreneurship, Financial Inclusion, Gender Gap, Economic Growth
†Ph.D. candidate, Department of Finance, HKUST. Email: [email protected]. I am indebted to Kasper MeisnerNielsen for his guidance and continued support. For helpful comments and suggestions, I thank Vimal Balasubrama-nian, Utpal Bhattacharya, Rohan Ganduri, Marco Giacoletti, Chang Gong, John Griffin, Camille Hebert, Harrison Hong,Sabrina Howell, Sasha Indarte, Matti Keloharju, William Kerr, Divya Kirti, Praveen Kumar, Juhani Linnainmaa, Abhi-roop Mukherjee, Narayan Naik, Marcus Opp, Paige Ouimet, Daniel Paravisini, Shivaram Rajgopal, Kunal Sachdeva,Sarada, Arkodipta Sarkar, Rik Sen, Manpreet Singh, Pablo Slutzky, Suresh Sundaresan, Margarita Tsoutsoura, Constan-tine Yannelis, Xiaoyun Yu, Xinxin Wang, Daniel Wolfenzon, and seminar participants at the 2019 WFA Meetings, 2019 SFSCavalcade North America, 2019 FIRS (Ph.D. Session), USC Marshall Ph.D. Conference, LBS Trans-Atlantic Doctoral Con-ference, 19th REER Conference, 2019 NFA Meetings (Ph.D. Session), 2019 Greater Bay Area Summer Finance Conference,2nd Dauphine Finance PhD Workshop, 2018 Financial Research Workshop, 2018 FMA Annual Meetings (Ph.D. Session)and HKUST. I thank Andrew Foster and the National Council for Applied Economic Research (NCAER) for sharing data.All errors are my own.

1 Introduction
Entrepreneurship has long been a hallmark of economic growth through its key role in driving
innovation and job creation (Schumpeter, 1911; King and Levine, 1993). Despite its benefits, there
is a pervasive gender gap in entrepreneurship across countries, that is starker in emerging mar-
kets (World Bank, 2012). Reducing this gap can have a significant impact on economic growth,
highlighting the importance of understanding the frictions that impede business formation among
women.
This study investigates whether financial constraints are behind the gender gap in entrepreneur-
ship. Financing constraints are a critical barrier to entry for aspiring entrepreneurs, especially for
women (World Bank, 2012). In many emerging markets, women lack ownership of assets as a re-
sult of unequal inheritance rights giving rise to financial constraints by limiting women’s ability to
put up collateral (Klapper and Parker, 2010; World Bank, 2019). Over the past few decades, more
than twenty countries have resorted to legal reforms to end such discrimination by granting women
equal inheritance rights to those of men. Standard economic theory predicts that entrepreneurship
should respond to easing financial constraints through such reforms (Holtz-Eakin, Joulfaian, and
Rosen, 1994a; Kerr and Nanda, 2011). However, it is possible that discriminatory social norms, such
as disapproval of women working outside the home, may weaken or even sever this link for women
(Field, Jayachandran, and Pande, 2010; Jensen, 2012).1 In this setting, the social costs of starting
a business might outweigh the potential gains, making such inheritance reforms ineffective. Such
a tradeoff makes this paper’s key question – whether legal reforms granting women equal inher-
itance rights are sufficient in catalyzing entrepreneurship, even in the presence of discriminatory
social norms – an empirical issue worth examining.
I utilize a legal reform in India that granted women from specific religious groups equal in-
heritance rights, and find that the improved access to finance for women can indeed narrow the
gender gap in entrepreneurship. The reform significantly increased firm creation by women with-
out worsening the quality of new entrants. Post reform, women have access to collateral, which
enables financial inclusion and leads to business formation. Further, the reform led to an increase
in aggregate entrepreneurial activity. Overall, this study underscores the importance of access to
1Field, Jayachandran, and Pande (2010) show that these social norms work against the beneficial effects of businesstraining programs rendering them ineffective. Jensen (2012) argues that social norms prevent programs that aim toimprove female labor force participation.
1

finance in narrowing the gender gap in entrepreneurship.
This study focuses on staggered changes in inheritance rights for women. Five states imple-
mented the reform between the late 1970s and the early 1990s, followed by the remaining 24 states
in 2005 pursuant to a federal amendment to the law (see Figure 1). A key feature of the reform is
that it affected only women from specific religious groups as most personal laws in India, including
inheritance laws, vary by religion. Specifically, women from the Hindu, Sikh, Buddhist, and Jain
religious communities (hereafter, treated) were granted equal inheritance rights, while women from
other religious groups, i.e., Muslims, Christians, Jews, and others (hereafter, non-treated) were unaf-
fected. This variation in inheritance rights across gender and religion allows comparisons (i) across
treated and non-treated women, and (ii) across treated males and females, which effectively rule out
concerns about overall trends, gender-specific trends, and religion-specific trends in entrepreneur-
ship.
Comparing the inheritances of women (relative to men) due to parental death before and after
the reform, I show that the reform had the intended effect of increasing inheritance among women.2
While other factors might correlate with the timing of the state-specific reform, the identifying
assumption is that the timing of death relative to the timing of the reform at the state-level is
exogenous.
For treated women, the reform increased the probability of inheriting land by 12% and the size
of the inherited land by 26%. The average value of land inherited is economically significant, as it is
almost twice as large as the average annual household income. Additional tests rule out unobserved
factors driving the increase in inheritance by showing no change in inheritance patterns among the
non-treated households.
In my main tests, I examine whether the reform led to business formation among women. I use
census microdata on small and medium-sized enterprises that contain detailed information on the
timing of business formation, and on the gender, and religion of the entrepreneur.
Comparing women from treated religious groups to everyone else (i.e., men from treated reli-
gious groups and individuals from the non-treated religious groups) within the same state, I find
that the number of new women enterprises increases by 16%. This increase is equivalent to a 5%
2Mainly, the reform led to an increase in inheritance, in the form of land. In many developing countries, farmland isamong the most critical assets to the rural poor, and it is more often inherited than bought. For example, figures from theWorld Bank Living Standards Measurement Surveys suggest 65% of landholding households inherit agricultural land inPeru, 70% in Nigeria, 85% in India and 86% in Nepal.
2

reduction in the gender gap among entrepreneurs. Early reform states drive most of the observed
increase in entrepreneurial activity among women, thus corroborating that it takes time to close the
gender gap through reforming inheritance laws.
My setting allows me to rule out concerns about unobserved omitted variables differentially af-
fecting individuals from different religious groups, which might drive the estimated increase in fe-
male entrepreneurial activity. Results comparing business formation rates across females and males
from treated religious groups show that women from treated groups drive the baseline increase in
business formation.
Furthermore, I rule out concerns about differential gender-specific trends driving my findings.
Comparing business formation rates of women from treated religious groups to women from non-
treated religious groups, I show that the reform led to significant more growth in business formation
among women from treated groups.
The empirical specification rules out concerns about location and industry-specific effects that
may differentially affect business formation. First, state-industry fixed effects control for unobserved
time-invariant determinants of state-industry performance (e.g., natural endowments, location, etc.).
Second, industry-year fixed effects control for time-varying industry shocks (e.g., technological in-
novation). Lastly, state-year fixed effects control for trends in the local economic conditions and
general policies that affect business formation. Further analysis shows that the increase in female
entrepreneurial activity is robust to the inclusion of state-industry-year fixed effects.
Two pieces of evidence suggest that the relaxation of financial constraints drives the estimated
increase in business formation. First, after the reform, industries with higher financing needs ex-
hibit a more significant increase in business formation by women relative to men. Second, areas
with more developed financial institutions experienced a more substantial increase in female en-
trepreneurial activity as compared to other areas. To identify regions with improved access to
financial institutions, I use the policy-driven nature of a bank branching program that led to a plau-
sibly exogenous variation in bank entry into different regions (Burgess and Pande, 2005). These
results suggest that the financial inclusion of women is the primary driver for the observed increase
in entrepreneurship.
Next, I examine any potential interaction effects between social norms and such financial con-
straints. In particular, I test and confirm the hypothesis that discriminatory social norms indeed
3

prevent women from starting businesses. In particular, regions where women face low discrimina-
tion, experienced a significant increase in business formation by women relative to men. While, on
average, the reform relaxes financial constraints for the marginal women entrepreneur, these find-
ings suggest that discriminatory social norms do indeed work against the beneficial effects of the
reform, in some cases.
An alternative interpretation of the baseline results is that women could be listed as owners
while males in households operate firms. If that were the case, one would expect to see more
businesses being formed in traditionally male-dominated industries. However, when I compare
the treatment effect across industries, I find that the documented increase in women enterprises
is concentrated in female-dominated industries relative to male-dominated industries. Further, the
documented women enterprises employ more women and fewer men. Overall, results suggest,
thereby, that the reform induces women to become entrepreneurs.
While the identification strategy can disentangle macroeconomic confounds from the effect of
the reform, the data do not allow for welfare analysis. First, the inability to observe counterfactual
males from the treated religious groups who are potentially crowded out because of the reallocation
of land from males to females, makes assessing welfare changes challenging. Second, the reform has
the effect of redistributing assets among some heirs. Hence, the net effect on aggregate activity will
crucially depend on whether the effect of the inherited land on the propensity to start a business is
non-linear. However, the following two pieces of evidence suggest an overall positive impact of the
reform.
First, I estimate the average quality of the marginal women entrepreneur under the assumption
that differences in quality will show up as differences in outcomes measured by performance. If
the reform relaxes the financial constraints of aspiring women entrepreneurs, then we would ex-
pect these post-reform businesses to be of higher quality. Alternatively, the reform could draw in
women with lower ability, in which case the post-reform businesses are likely to be of lower qual-
ity. Comparing measures of quality (closure rates and performance), I find that firms created by
women after the reform are of higher quality (relative to firms created by men) based on observable
characteristics.
Second, I evaluate the effect of the reform on the aggregate entrepreneurial activity. On one
hand, the resulting loss of collateral for some males might negate the increase in business for-
4

mation by women leading to a decline in overall entrepreneurial activity. On the other hand, as
males from treated religious groups might have access to other sources of financing, the aggre-
gate entrepreneurial activity might increase, driven by the increase in business formation among
women. The results comparing overall business formation across the treated and non-treated reli-
gious groups suggest that the reform led to an increase in aggregate entrepreneurial activity.
To assess the external validity of the main results, I relate inheritance rights and the gender gap
in entrepreneurship, among 102 economies. In countries with equal inheritance rights, we expect a
higher level of entrepreneurial activity among women than in countries without equality of rights. I
measure the gender gap in entrepreneurship as the number of women entrepreneurs per 100 male
entrepreneurs. Estimates suggest that countries with equal inheritance laws have a smaller gender
gap than do countries with unequal inheritance laws, with the difference of 25 percentage points
being statistically significant and economically large. While informative, drawing causal inference
in this cross-country setting could be problematic because of potential endogeneity (e.g., countries
with equal inheritance laws may discriminate less against women).
This paper contributes to the existing literature that analyzes the impact of wealth on the deci-
sion to become an entrepreneur by focusing on the role of financial constraints on the gender gap in
entrepreneurship in the presence of discriminatory social norms. Prior literature on financial con-
straints and entrepreneurship emphasizes the role of wealth and credit in firm creation in developed
countries. For example, Evans and Leighton (1990); Holtz-Eakin, Joulfaian, and Rosen (1994b) doc-
ument a robust positive correlation between wealth and the likelihood to start a business. Schmalz,
Sraer, and Thesmar (2017); Adelino, Schoar, and Severino (2015) document a collateral channel in
stimulating entrepreneurship. This study shows that, even in the presence of discriminatory social
norms, financial inclusion through equal inheritance rights reduces the gender gap in entrepreneur-
ship.
Second, this study contributes to the literature on factors that discourage entrepreneurship
among women. Several papers have documented differences in propensity among men and women
to pursue an entrepreneurial activity (Fischer, Reuber, and Dyke, 1993; Ayres and Siegelman, 1995;
Ardagna and Lusardi, 2008; Gompers and Wang, 2017). Buttner and Rosen (1989); Howell and
Nanda (2019) find that women have more difficulty than men obtaining financing from banks or
venture capitalists. This study contributes to our understanding of constraints to entrepreneurship
5

by highlighting that initial asset inequality through unequal inheritance rights fosters the gender
gap in entrepreneurship in emerging markets.
Third, this paper provides evidence that inheritance reforms alter occupational choices, thereby
adding to the literature that examines the effect of inheritance laws across different countries. Previ-
ous literature finds that the equal inheritance rights reform is associated with an increase in female
education (Deininger, Goyal, and Nagarajan, 2013; Harari, 2019), increased autonomy, and labor
supply (Heath and Tan, 2019), and greater bargaining power (Roy, 2008). This study shows that
inheritance reforms significantly increased firm creation by women without worsening the quality
of new entrants.
From a policymaker’s perspective, these results underscore that policies aimed at financial in-
clusion are likely to narrow the gender gap in entrepreneurship even in environments with discrim-
inatory social norms and underdeveloped financial markets. This finding is important as recent
evidence from the United States suggests that misallocation of talent in the labor market is a signif-
icant hindrance to growth (Hsieh, Hurst, Jones, and Klenow, 2019).
2 Institutional setting and data
2.1 Inheritance laws in India
After independence, the formulated constitution of India allowed personal laws, including inheri-
tance laws, to vary by religion. The Hindu Succession Act of 1956 (HSA 1956), governs the present-
day inheritance rights of four religious communities: Hindus, Buddhists, Jains, and Sikhs. The act
was a first attempt at establishing a woman’s right to inherit property and codify a law of succession
that gave equal rights of inheritance to sons and daughters. The act, however, lost by a majority vote
in parliament.3
To secure equal inheritance rights for sons and daughters belonging to the four treated religious
communities, five states amended the act. These states include Kerala in 1976; Andhra Pradesh in
1986; Tamil Nadu in 1989; and Maharashtra and Karnataka in 1994 (see map in Figure 1). In the
remaining 24 states, men retained the right by birth to the joint property until 2005. In 2005, an
amendment to the Hindu Succession Act, 1956 was enacted as a law by the assent of the President
3See Appendix A.1 for more details on the evolution of female property rights in India.
6

of India in 2005. Under the amendment called the Hindu Succession (Amendment) Act of 2005, all
daughters, hold the right by birth to joint property. In my empirical approach, I exploit the cross-
state variation in the timing of the amendments, which increased inheritance rights for women.
Additionally, Table IA1 shows that observable differences in state-level macroeconomic charac-
teristics can not explain the timing of reform consistent with Anderson and Genicot (2015), who
argues that no systematic reason exists for the specific years in which these different states enacted
their changes before 2005. Further, an examination of decisions in court cases reveal that the judicial
system in India upholds the letter and spirit of the regulation.
2.2 Data sources
I use two datasets, (i) a representative survey data on households with information on inheritances,
and (ii) the universe of small and medium-sized enterprises with information on the timing of the
startup alongside the gender and religion of the entrepreneur.
2.2.1 Inheritance dataset
I use the 1999 wave of the Rural Economic and Demographic Survey (REDS), which is a nationally
representative survey of rural households in 17 major states of India spread across 100 districts.4
The REDS panel was collected in four waves between 1971 and 2006 and has been used previously
to study agricultural productivity in India (Foster and Rosenzweig, 1995); (Foster and Rosenzweig,
1996). The survey contains detailed information on inherited landholdings, parents’ landholdings,
and individual characteristics on all household members, including all siblings of the household
head, married daughters.
2.2.2 Entrepreneurship dataset
To investigate the impact of inheritance reform on women’s entrepreneurship, I use the All India
Census of Micro, Small and Medium Enterprises (hereafter MSME Census). The census covers the
universe of existing businesses that are formally registered with the respective state governments.5
4Because HSA 1956 did not apply to Jammu and Kashmir (Agarwal, 1994), I drop the state from my analysis thusleaving me with 16 major states.
5The Micro, Small and Medium Enterprises (MSME) sector is a significant contributor to the Indian economy. Officialfigures from the Ministry of MSME, state that this sector contributes 8% of the National GDP and comprises 50% ofIndia’s total manufactured exports, 45% of India’s total industrial employment and 95% of all industrial units.
7

Two factors make this dataset particularly well suited to examine the impact of the inheritance
reform on the gender gap in entrepreneurship. First, the dataset contains detailed information on
gender, the geography of operations, and the religion of the owner of the enterprise. Second, the
data contains current and historical information on the enterprise itself, such as the start date, initial
investment in real assets, etc. which is particularly suited to study entry decisions of owners. How-
ever, the main drawback of the MSME Census is that it does not collect information on inheritances
or the family structure of the entrepreneur.
3 Effect of the reform on inheritance of land
In this section, I verify that the inheritance reform led to a significant increase in females’ likelihood
to inherit land. I briefly overview the empirical strategy and the main estimating equations. I then
present the results of this estimation.
3.1 Empirical strategy
The starting point of the analysis is to document changes in inheritance patterns among females
(relative to males) around the reform. To do so, I estimate a linear probability model specified in
Equation 1. The unit of observation is an individual, and the sample includes 5,252 siblings in the
early reform states with a positive amount of family landholdings and experiencing parental death.
6
To identify the effect of inheritance reform, I compare the probability of inheritance (and size of
the land inherited) by males and females belonging to the same family (siblings) in the reforming
states before and after the reform. Thus, the specification tests whether the legal change affected
inheritance received by females relative to male siblings. More formally, I estimate the following
equation:
yitsh = α1 + β1Femalei + β2Death post reformh + β3Death post reformh × Femalei+
β4Xh ×Death post reformh × Femalei + ωs + θt + εitsh
(1)
where yith is an indicator variable (or natural logarithm of one plus land inherited in acres) for
whether individual i, born in year t, in household h inherited any land. Femalei and Death post reformh
6This sample allows for a clean identification of the effect of the reform by utilizing the variation in religion. Ad-ditional tests in Section 8 show robustness to several alternative specifications including comparisons between treatedwomen and non-treated women.
8

are indicator variables for whether an individual is a female and for whether the household head
died after the state-specific date of the reform, respectively. Xh is a set of individual and parental
characteristics that include marital status at the time of the reform, caste, parental landholdings,
and parental education. ωs are sibling-composition fixed effects to which effectively controls for
the effect of family structure on inheritance allocations and θt are the year of birth fixed effects to
control for time-varying factors that may affect inheritance patterns independently from the reform.
7
The estimations compare inheritances of women in households where the household head’s
death occurred before the reform to inheritances of women in households where the death occurred
after the reform. While other factors might correlate with the timing of the state-specific reform,
the identifying assumption is that the timing of death relative to the timing of the reform at the
state-level is exogenous. Moreover, I use non-treated siblings in reforming states as a placebo to
rule out time-varying unobserved factors that might explain the outcomes.8
The coefficient of interest is β3, which identifies the effect of the law change on the propensity
(and magnitude) of females to inherit the land. I also vary the specification to allow for the impact
of the reform to be time-varying by interacting Death post reformh × Femalei with indicator variables
for the year of death of household head. I present alternative specifications and further robustness
in Section 8.
3.2 Results
Table 1 reports regression results examining changes in inheritance among women around the re-
form. Columns 1 to 4 model the likelihood of inheriting land among siblings, using a linear prob-
ability model, while columns 5 to 8 model the size of the inherited land (measured in acres). The
estimates from column 1 suggest that the proportion of males in reforming states that inherit land
compared to females increases by around 66%, if the death occured before the reform. This lower
proportion among women contrasts with the significantly higher proportion (by 12%) in households
7India exhibits a general preference toward sons, and this tendency shown to have a significant impact on resourceallocation across children (Jayachandran and Pande, 2017). Hence, a household with male-skewed child compositionmight allocate resources and transfer assets differently and comparisons that do not hold sibling sex composition fixedmight pick-up selection effects rather than reflecting the impact of the reform.
8In the REDS dataset, 60% of respondents, became the head of their household after their father died. While thesurvey does not give the exact time at which they inherited the land, children typically inherit the land upon a father’sdeath. Also, note that, household headship does not necessitate the inheritance of land or a father’s death.
9
where the head died after the reform.
Next, I examine the magnitude of inheritance. Column 5 uses the natural log of one plus the
size of land inherited (in acres) as the dependent variable. The results mirror those from column 1
and suggest that females inherit a 26 percent larger plot of land after the reform.9,10
Columns 2 (and 6) investigate pre-trends in inheritance by including indicator variables Death, t
∈ {−5,−1}, Death, t ∈ {0, 5}, and Death, t ≥ 6 for whether the household head died in the six years
leading up to the reform, the first five years after the reform, and beyond six years after the reform,
respectively. The coefficients in the pre-reform years are small and statistically insignificant thereby
ensuring the validity of the parallel trends assumption. Additionally, the point estimate increases
over time implying that inheritances increase over time as social norms change.
Columns 3 (and 7) include additional controls for the marital status of the individual at the time
of the reform, mother’s education in years, father’s education in years, father’s landholding in acres,
and whether an individual belongs to historically disadvantaged groups such as scheduled castes
or scheduled tribes. The inclusion of additional controls increases the coefficient estimates.
To rule out secular time trends in inheritances driving the observed inheritance patterns among
females, I repeat my baseline tests on a placebo sample of non-treated religious groups unaffected
by the reform. Columns 4 (and 8) reports results from this exercise. I find no evidence of changes
in the inheritance among women from non-treated religious groups around the reform, either in
terms of economic magnitude or statistical significance, indicating that the spurious correlation is
not driving changes in inheritance.11 Overall, Table 1 suggests that the inheritance reform granting
equal inheritance rights to women increased the inheritance of land among women.
4 Bridging the entrepreneurship gender gap
The goal of this paper is to investigate whether the inheritance reform offsets social norms and nar-
rows the gender gap in entrepreneurship. Apriori, it is not obvious that such legal reforms benefit
9The REDS dataset contains limited information on the market value or purchase value of the land. Note that, evenif the reform led to an unequal distribution (based on value or quality) among the siblings, this limitation would biasagainst me finding an effect of the reform.
10In Appendix Figure IA 1, I show that inheritance is a significant source of asset acquisition among households inrural areas. In my sample, 70% of respondents report no change in inherited landholdings, while 84.4% report changesof less than 2 acres.
11Given the limited number of individuals from non-treated religion in the sample, I conduct additional placebo testsusing individuals from treated religious groups in the nonreform states and with various cutoffs for the reform date. Idiscuss these and other alternative specifications in Section 8 and report the results in Table 8.
10

women. On one hand, theoretical models of poverty traps suggest that initial asset endowments can
ease financial constraints and allow women to take advantage of investment opportunities (Banerjee
and Newman, 1993; Galor and Zeira, 1993).12
On the other hand, legal reform alone may not be effective in stimulating entrepreneurship in
the presence of discriminatory social norms (Field, Jayachandran, and Pande, 2010; Benschop, 2002;
UN-HABITAT, 2006; Watch, 2003; USAID, 2003). In this section, I show that the inheritance reform,
which allowed women from treated religious groups to inherit the land, leads them to start new
businesses.
4.1 Empirical strategy
To test whether the reform induced business formation by women, I compare the evolution of
business formation by women (relative to men) around the state-specific reform year. In particular,
I estimate :
yijst = α + β1Treatedi + β2Post reformst × Treatedi + δsj + ωjt + θst + εijst (2)
yijst is an indicator variable for whether a business i is started by a female in a two-digit industry j,
state s, in year t. Postre f ormst is an indicator variable if the year of the startup is greater than (or
equal to) the state-specific reform year. Treatedi refers to individuals belonging to the four religious
groups - Hindus, Sikhs, Buddhists, and Jains - to which the inheritance reform applied, while other
religious groups, serving as the control group, includes Muslims, Christians, Jews, and others,
to which the inheritance reform did not apply.13 δsj are state-industry fixed-effects controls for
unobserved time-invariant determinants of state-industry performance (e.g., natural endowments,
location, etc.) while ωjt are industry-year fixed-effects controls for industry-specific time effects (e.g.,
industry-specific shocks such as technological innovation). θst are state-year fixed-effects controls
for state-specific time effects (e.g., regional macroeconomic shocks).
The regression exploits information on the timing of business formation relative to the reform
year.14 The coefficient of interest (β2) is identified by the mix of gender, religion, and state-year
12Other evidence from experimental and non-experimental settings shows that asset transfers to women and in generalto the rural poor support their entry into the non-agricultural sector (Blattman, Fiala, and Martinez, 2013; Bandiera,Burgess, Das, Gulesci, Rasul, and Sulaiman, 2017).
13The inclusion of Treated dummy controls for differences in the propensity of becoming entrepreneurs across treatedand control groups.
14The main focus of the analyses is on the extensive margin, because of data limitations. While the intensive margin
11

variation in the inheritance reform. I cluster standard errors at the state-year level in case idiosyn-
cratic factors exist that are specific to businesses within each state-year pair (Bertrand, Duflo, and
Mullainathan, 2004). This approach assumes that idiosyncratic factors related to new businesses
within each state-year are uncorrelated with errors of other state-year pairs.
Given the staggered nature of the reform across states, this empirical approach is attractive be-
cause it effectively controls for time-varying macroeconomic conditions that are likely to impact the
decision to become an entrepreneur. Additionally, the ability to control for macroeconomic condi-
tions within the reforming states because of the reform applied to women from specific religious
groups allows me to use other religious groups as a control group, to effectively control for secular
time trends in the propensity to become an entrepreneur.
To corroborate that the observed effects are not driven by unobserved contemporaneous changes
that might be changing differentially across males and females, I also implement a difference-in-
differences strategy, exploiting variation in inheritance rights across religious groups. This strategy
compares entrepreneurs of the same gender but different religions, thereby holding some factors
that are different between males and females constant.
4.2 Results
Table 2 reports baseline regression results. Columns 1 and 2 present results for all states while
columns 3 and 4 present results for the five early states. Column 1 includes the Treated dummy and
its interaction with the Post reform dummy along with industry-year fixed effects that control for
industry-specific time effects. Because the reform affected women from specific religious groups,
I am able to include state-year fixed effects to control for local macroeconomic conditions. The
resulting regressions,then, identify changes in female business formation rates among the treated
relative to control groups within the same state. Thus, the unaffected religious groups control for
time trends that might be driving the propensity to become an entrepreneur.
The results suggest that, after the reform, the yearly number of new firms by women increased
by a significant proportion. Column 2 shows that the point estimates sharpen upon the inclusion of
state-industry fixed effects that control for unobserved time-invariant determinants of state-industry
is interesting, it is unclear whether we expect to see an effect of relaxing financial constraints for entrepreneurs whocould already start a business even before the reform. We would expect these entrepreneurs to be differ along multipledimensions (such as quality, business network, etc.) from the credit constrained marginal women entrepreneur for whomthis reform relaxes financial constraints.
12

performance.
Given that social norms are likely to change slowly and the process of inheriting land takes time,
I conjecture that the increase in business formation by women is likely strongest among the early
states. Comparing coefficient estimates from columns 1 and 2 to columns 3 and 4, I find evidence
consistent with this conjecture as women in early states drive most of the increase in business
formation. Thus, the reform takes time for the reform to alter occupational choice among women.
Alternative specifications in Section 8 and Internet Appendix Table IA2 show that the increase
in entrepreneurship among the treated drives the baseline increase in female business formation.
Moreover, the baseline results are robust to the inclusion of high-dimensional fixed-effects.
To put the economic magnitude into perspective, the coefficient estimate in column 2, Table 2
suggests that after the reform, the yearly number of new women enterprises increased by 16%,
equivalent to a 5% reduction in the gender gap among entrepreneurs.15
4.3 Discussion of the identifying assumptions
The empirical strategy entails two main concerns. The first concern relates to differential trends
in business formation rates among men and women. To understand whether this concern drives
the results, I examine pre-trends in entrepreneurial activity around the reform. Figure 2a plots
the evolution of relative rates of business formation among treated women after controlling for
year fixed effects. The coefficients are obtained from estimating a regression where the dependent
variable – is an indicator variable for whether a business was started by a women from the treated
religious group – on a set of dummy variables for each value of three years relative to the year of
the reform. The coefficients on the years leading up to the reform are economically small and not
statistically significant. Thus, importantly, no pre-reform trend in business formations rates exists
among men and women.
This finding has two implications. First, the absence of significant effects before the reform
implies that women who enter into self-employment do not anticipate the reform. Second, the fact
that entrepreneurial activity increases only after the reform suggests that this relationship is not
the result of state lawmakers merely responding to vagaries of economic conditions (an omitted
variable) or increases in female entrepreneurship rates (reverse causality). The key is that the effect
15Before the reform, 11% of the entrepreneurs are women, equivalent to a 39% gender gap. After the reform, 12.7% arewomen, equivalent to a gender gap of 37.3%. Hence, the reduction in the gender gap is approximately 5% (1.7%/37.3%).
13

of the reform is increasing over time which is consistent with parental deaths and inheritances
increasing over time. Additionally, the observed increase in startup activity takes around 3-5 years,
suggesting that, before the reform other constraints such as traditional institutions and social norms
among others contributed to low female self-employment rates in India.
4.4 Comparing treated women to non-treated women
Another plausible concern is that gender differences, or other policies that affect the business for-
mation rates of women could explain the increase in female entrepreneurial activity. However, the
plausibility of these alternative explanations relies on the crucial assumption that the changes af-
fecting business formation precisely mirror the same staggered nature of the reform. Nonetheless, I
design several tests to rule out these concerns.
First, I examine pre-trends in entrepreneurial activity only among women based on religion. I’m
able to do so because the reform did not apply to all religions. Hence, these tests effectively con-
trol for time-varying factors that encourage women to become entrepreneurs. Figure 2b plots the
evolution of business formation among women, treated relative to control, after controlling for year-
of-creation fixed effects. The coefficients are obtained from estimating a regression – where the
dependent variable is an indicator variable for whether a business was started by a woman from
the treated religion – on a set of dummy variables for each value of three years relative to the year
of the reform. The coefficients in the years leading up to the reform are economically small and
statistically insignificant.
This finding has three implications. First, from the perspective of identification, any bias in
coefficient estimates due to differential trends between female and male firm creation rates is ruled
out by these tests. Second, the absence of significant lead effects among treated women implies that
the adoption of the reform was plausibly exogenous to female entrepreneurial activity. Third, the
fact that business formation increases only after the reform suggests that this relationship is not
the result of state lawmakers merely responding to economic conditions (an omitted variable) or
driven by the increase in women entrepreneurship rates (reverse causality). Moreover, the observed
increase in startup activity takes around 3-5 years, which lines up with the baseline estimates sug-
gesting the reform significantly affected entry rates among women into small and medium-sized
enterprises.
14

To confirm that the results hold after controlling for other time-varying state and industry fac-
tors, I use an empirical specification akin to a standard difference-in-differences, exploiting variation
in inheritance rights across religious groups among women. Table 3 reports the results. The depen-
dent variable is the fraction of businesses started by women from treated religious groups (relative
to women from non-treated religious groups) in a two-digit industry j, state s, in year t. Columns
1 and 2 present results for all states while columns 3 and 4 present results for the five early states.
Column 1 (and 3) includes the Post reform dummy and its interaction with the Treated dummy.
The coefficient on Treated dummy is informative of the pre-reform difference in the average
business formation rate between the treated and the placebo. The estimates indicate that a higher
proportion of women (around 40 percentage points) from treated religious groups are business
owners relative to women from non-treated religious groups. The coefficient on the interaction term
is informative of changes in the propensity to engage in entrepreneurial activity among treated
women around the reform. The positive coefficient on the interaction term suggests that after the
reform, women from treated religious groups are even higher in proportion (around 11 percentage
points) compared to women from non-treated religious groups. This effect remains robust even
after the inclusion of state-industry fixed effects. In columns 3 and 4, I find evidence that most of
the observed increase comes from the early reforming states, thus corroborating that reform takes
time to alter occupational choices among women.
Collectively, the above results suggest that granting women equal inheritance rights leads entry
into entrepreneurship.
5 Economic mechanism: Access to finance
A sizeable theoretical literature has highlighted different mechanisms through which access to fi-
nancing enables individuals to alter their production and employment choices (Aghion and Bolton,
1997; Banerjee and Newman, 1993). However, lenders might rationing their access to capital optimal
(Stiglitz and Weiss, 1981). Moreover, the underdeveloped financial sector might prevent collateral
pledging, thereby inhibiting females from altering their occupational choices (Liberti and Mian,
2010). Therefore, even if the inheritance reform relaxes financial constraints for women, given addi-
tional capital market frictions, it is unclear if women can start businesses. Hence, in this section, I
present two pieces of evidence, which suggests that the financing mechanism drives the increase in
15

business formation among women.
5.1 Heterogeneous treatment effects by financing needs
I begin by examining the business formation rates by the financing required to start a business. If
collateral in the form of inherited land indeed relaxes financial constraints for women, the increase
in entrepreneurial activity is likely highest in industries where startup capital requirements are
high. In industries where startup capital requirements are low, the effect will be more moderate
as entry costs in such industries is lower. Motivated by this observation, I examine whether the
reform increases entrepreneurship in high startup capital industries more than in low capital startup
industries.
Figure 3 plots female entrepreneurship rates in high startup capital industries (relative to low
startup capital industries). The figure shows the coefficients and 95% confidence intervals from esti-
mating a regression – where the dependent variable is an indicator variable for whether a business
was started by a women from the treated religious group – on a set of dummy variables for each
value of three years relative to the year of the reform. The blue circles show the impact by financing
need based on whether pre-reform original purchase value of physical assets are in the top tercile.
All regressions include state-industry fixed effects that control for unobserved time-invariant de-
terminants of state-industry performance (e.g., natural endowments, location, etc.). All coefficients
are plotted relative to the business formation rate in k=-1, which is normalized to zero. Evidence
from the figure suggests no pre-trends in the evolution of business formation by women among
high-startup-capital and low-startup-capital industries. However, a clear and marked increase in
entrepreneurship by women in high startup capital industries (relative to low startup capital indus-
tries) occurs after the reform.
To confirm that the results hold after controlling for other time-varying state and industry fac-
tors, I use an empirical specification that controls for time-varying effects across states and indus-
try. Table 4 reports results from this exercise. Panel A reports heterogeneity based on required
startup capital, while panel B uses the financial dependence index from (Rajan and Zingales, 1998).
Columns 1 and 2 in both panels present results for all states, while columns 3 and 4 in both panels
present results for the five early states. Industries are classified as High if their purchase value of
plant and machinery in the pre-treatment period is in the top tercile or quartile of the distribution.
16
In both panels, columns 1 and 3 present results based on the tercile measure, while columns 2 and
4 present results based on the quartile measure. The sample is restricted to business owners from
treated religious groups. Additionally, panel B restricts the sample to manufacturing industries,
given that the index measure is only available for manufacturing. The financial dependence index is
an industry-level measure to approximately capture a firm’s intrinsic demand for external finance.
Across both panels, the estimates suggest that the increase in female business formation rates
is higher in industries that have higher financing needs. This evidence is consistent with the view
that after the reform, women entrepreneurs have collateral to access financing, which allows them
to enter into capital-intensive industries.
5.2 Identifying the financing channel: Bank branching expansion
The critical challenge in identifying the impact of access to financing is the non-random nature
of credit supply. For example, political considerations can often determine credit allocation and
make the banking sector susceptible to elite capture (La Porta, Lopez-de Silanes, and Shleifer, 2002;
Sapienza, 2004). Further, credit supply responds to positive investment opportunities which might
be correlated to local economic conditions. This uncertainty makes identification of the causal
impact of bank lending on entrepreneurial outcomes challenging.
To circumvent this issue, I use an instrumental variables approach which exploits exogenous
variation in bank entry into different geographical regions.16 Burgess and Pande (2005) find that the
state-led rural bank branching expansion led to a significant increase in credit availability to rural
households and reduction in rural poverty. The policy was instituted by the Indian Central Bank
in 1977 and remained in place until 1990.17 It mandated that a bank must open branches in four
eligible unbanked locations if it wanted to obtain a license for opening a bank branch in an already
banked location (i.e., with one or more branches).
The research design exploits the policy-driven nature of the program, which required banks
to open bank branches in unbanked rural locations. I begin by showing that between 1977 and
1990, rural bank branching expansion was significantly higher in less financially developed states.
I exploit the trend reversals and deviations introduced by the bank branching policies. The crucial
16This strategy has most notably used in Burgess and Pande (2005). The empirical strategy used here is similar inspirit to bank deregulation in the U.S. (Jayaratne and Strahan, 1996; Black and Strahan, 2002).
17Given the timing of this program, I’m able to exploit this variation among four out of five early states.
17

identifying assumption is that other state-level economic or political factors do not exhibit the same
trend reversal as the policy. Burgess and Pande (2005) show that this assumption holds.
I adopt a linear trend break model that closely resembles the actual trend reversals in bank
branching expansion (Burgess and Pande, 2005). Specifically, I estimate the following first stage
model (Equation 3) and second stage model (Equation 4):
BRst = αs + ωt + β1(Bs1961 × [t− 1961]) + β2(Bs1961 × [t− 1977])
+ β3(Bs1961 × [t− 1990]) + β4(Bs1961 × P1977) + β5(Bs1961 × P1990) + εst (3)
αs and ωt represent state and year fixed effects which account for time-invariant differences across
states and national level trends which may affect branch expansion. [t-1961], [t-1977], and [t-1990]
are linear time trends, which switch on in 1961, 1977, and 1990, respectively. They enter the re-
gression interacted with a measure of a state’s initial financial development, Bs1961. P1977 and P1990
are dummy variables which equal one from 1977 and 1990, respectively. I cluster standard errors
at the state level in case there are idiosyncratic factors specific to states exist (Bertrand, Duflo, and
Mullainathan, 2004). Internet Appendix Table IA8 reports the results of the first-stage regression
establishing that rural branch expansion associated with the branch licensing policy increased credit
disbursement in rural India.
The second stage regression examining the impact of access to finance through rural bank
branching takes the following form:
yst = αs + ωt + φBRst + κPost reformst + λ(Post reformst × BR
st) + η1(Bs1961 × [t− 1961])
+η2(Bs1961 × [t− 1977]) + η3(Bs1961 × [t− 1990])+
η4(Bs1961 × P1977) + η5(Bs1961 × P1990) + εst
(4)
The dependent variable yst is the state-level fraction of women entrepreneurs that belong to the
treated religious group each year and Post reformst is an indicator variable for post reform years.
Clustering at the state-level is problematic as too few clusters lead to over-rejection of the null
hypothesis (Cameron, Gelbach, and Miller, 2008). Therefore, I resort to other clustering refinements
for inference.
Table 5 reports the instrumental variables estimates for the specification laid out in Equation 4.
18

Columns 1 and 2 adopt clustering at the state level to account for correlations across observations
within the states. Columns 3 and 4 adopt cluster-robust standard errors that permit heteroscedastic-
ity, while columns 5 and 6 use cluster bootstrap-t procedures to estimate standard errors. Estimates
in column 1 suggest that in the pre-reform period, branch openings in rural unbanked locations
are weakly negatively associated with female entrepreneurship. However, the interaction term is
positive and statistically significant, suggesting that rural branch openings had a positive effect on
female entrepreneurial activity after the inheritance reform (p-value=0.042).
In sum, the two pieces of evidence presented above support financial inclusion as the primary
driver for the observed increase in female entrepreneurship rates. 18
6 Heterogeneous treatment effects by discriminatory social norms
Evidence from the previous sections is consistent with the prediction that entrepreneurship re-
sponds to easing financial constraints through equal inheritance reforms (Holtz-Eakin, Joulfaian,
and Rosen, 1994a). However, discriminatory social norms, such as disapproval of women working
outside the home, may weaken or even sever this link for women (Field, Jayachandran, and Pande,
2010; Jensen, 2012). Further analysis tests and confirms the hypothesis that discriminatory social
norms weaken the effect of the reform.
To identify social norms that are discriminatory towards women, I use the number of "missing
women." Sen (1992) argues that as many as 100 million women could be missing in India. Gender
bias and mistreatment of young girls are the candidate explanations for this phenomenon. Thus,
regions with more missing women can proxy for more significant discrimination against women.
Table 6 reports results examining heterogeneity in treatment effects by social norms using this
measure. Districts are classified as Low discrimination if the number of estimated missing women
(Anderson and Ray, 2010), computed as the difference between the actual number of women per
1000 men minus the counterfactual number of women per 1000 men, is in the top tercile and quartile
of the distribution. Columns 1 and 3 present results for the tercile measure, while columns 2 and 4
present results for the quartile measure. The sample is restricted to business owners from treated
religious groups.
18In Table IA6, I consider an alternative mechanism distinct from the collateral channel. After the reform, higherwealth (or expected wealth) might lead women from treated religious groups to also have higher human capital, thusincreasing the probability of starting-up. I do not find evidence consistent with this.
19

Across the columns, districts where women face low discrimination, experienced a significant
increase in business formation by women relative to men. These effects are stronger in early re-
forming states. These findings suggest that, on average, the reform relaxes financial constraints for
the marginal women entrepreneur, discriminatory social norms work against the beneficial effects
of the reform, in extreme cases.
7 Aggregate effect of the reform
The identification strategy can disentangle macroeconomic confounds from the effect of the reform,
however, the data do not allow for welfare analysis. First, the inability to observe the counterfactual
males from the treated religious groups who are potentially crowded out because of the reallocation
of land from males to females, makes welfare analysis challenging. Second, the reform has the effect
of redistributing assets among some heirs. Hence, the net effect on aggregate activity will crucially
depend on whether the effect of the inherited land on the propensity to start a business is non-linear.
However, the following two pieces of evidence suggest an overall positive impact of the reform.
7.1 Quality of the marginal women entrepreneur
First, I estimate the average quality of the marginal women entrepreneur under the assumption that
differences in quality will show up as differences in outcomes measured by performance. If the
primary effect of the reform was to draw in women with lower ability, then the startups created
after the reform should be less likely to create jobs and more likely to perform poorly. Alternatively,
if the reform drew in women with higher ability, then the startups should be as likely as before
to create jobs and perform as well. I use two proxies for firm quality, namely, closure rates and
performance. Table 7 reports the results of examining closure rates while Table IA7 reports results
examining performance.
Columns 1 and 2 present results for all states, while columns 3 and 4 present results for the five
early states. Column 1 (and 3) includes the Female dummy and its interaction with Female dummy
along with high-dimensional fixed effects similar to our main empirical strategy as in Equation 2.
The dependent variable is an indicator variable for business closure, which takes the value one if
the business is closed anytime during its operation between inception until the time of the survey.
20

Note that the entrepreneurship dataset contains information on all surviving businesses, and hence
the closure rates capture the operational performance of the business.
The coefficient on Female dummy is informative of the pre-reform average closure rates for
female businesses. The estimates from column 1 (column 2) suggest that before the reform, on
average, businesses of women from treated religious groups experience 1% (0.7%) higher operational
closure than males from the treated religious groups. The interaction term is informative on how
the closure rates differ among new enterprises started by women after the reform relative to other
enterprises. The negative coefficient on the interaction term suggests that new female businesses
exhibit a lower probability of closure in comparison to other enterprises. The better performance of
female enterprises relative to male enterprises is statistically significant, as confirmed by the joint
test. Columns 3 and 4 show that the effect also exists among enterprises in the early reforming
states. Results on performance in Table IA7 mirror the results on closure rates.
Overall, these results suggest that the main effect of the reform was to draw in females with
higher ability, and these new businesses by women perform better in comparison to male businesses.
Although these results are encouraging, in the absence of data on owner characteristics, I am unable
to rule out differences in risk aversion driving the lower performance.
7.2 Aggregate entrepreneurial activity
Second, I evaluate the effect of the reform on the aggregate entrepreneurial activity. Apriori, the
effects of the reform on the aggregate entrepreneurial activity are not apparent. On one hand, the
reform led to reallocation from males to females resulting in lower inheritance for some males. Thus,
a loss in inheritance may negatively affect business formation by males leading to an overall decline
in entrepreneurial activity. On the other hand, the reform might not affect overall entrepreneurial
activity as treated males may have access to other sources of finance.
To examine whether the reform’s effect on overall entrepreneurial activity, Table 8 compares
business formation rates across the treated and non-treated religious groups. Post reform, the
business formation rates are higher among the treated religious groups. These results show that the
reform led to an increase in overall business formation among the treated. Thus, on average, any
reallocation from males to females caused by the reform did not dampen the overall entrepreneurial
activity.
21

Note that while the identification strategy is quite attractive in disentangling macroeconomic
confounds from the effect of the reform, the data do not allow for welfare analysis. First, the inabil-
ity to observe the counterfactual males from treated religious groups who are potentially crowded
out because of the loss in collateral due to the reform makes welfare analyses challenging. Second,
the net effect on aggregate business formation will crucially depend on what is the marginal effect
of inherited land on the propensity to start a business. Moreover, the lack of data combining inheri-
tances to the occupational choices of the population prevents me from drawing welfare conclusions.
However, the results from the analysis of business formation rates indicate that around the reform,
the aggregate entrepreneurial activity did not decrease.
8 Alternative specifications and external validity
8.1 Alternative interpretation
Results so far are consistent with inheritance reforms relaxing collateral constraints for the marginal
women entrepreneur. In the absence of data, however, on the household structure of the enterprise
owner and the distinction between the owner and the operator of the businesses, women could act
as a proxy for males within their households. This concern stems from the findings that business
decisions are made in the context of available opportunities and constraints within their house-
hold and not merely their enterprise (Bernhardt, Field, Pande, and Rigol, 2017). To mitigate these
concerns, I examine whether female and male entrepreneurs enter similar industries.
I begin by plotting female entrepreneurship rates in each industry. Figure 4 plots the coeffi-
cients and 95% confidence intervals from estimating a regression – where the dependent variable
is an indicator variable for whether a business was started by a female – on dummy variables for
each two-digit industry classification. The circles and triangles display the coefficient estimates on
industry dummies from estimating separate regressions for pre-reform and post-reform periods,
respectively. All coefficients are plotted relative to agriculture. The sample is restricted to business
owners from treated religious groups. As evident from the figure, female entrepreneurship rates
are higher in industries that previously had a higher share of female entrepreneurs.
More formally, I compare entrepreneurship rates across industries based on the most represen-
tative gender of an industry. To do so, I designate an industry as female-dominated industry if the
22

share of female entrepreneurs within an industry in the pre-treatment period is in the top tercile or
quartile of the distribution. Table 9 presents results from this exercise. Second, female enterprises
(relative to male enterprises) employ more women and fewer men (see Table IA5). Taken together,
these two pieces of evidence mitigate concerns regarding female occupational choices determined
by males within the context of their household.19
8.2 Alternative specifications
Table 10 reports key results for a number of alternative specifications of the main analysis. Panel
A reports tests examining the effect of the reform on inheritance among women. The dependent
variable is the natural logarithm of one plus total inherited land (measured in acres). Column 1 of
Table 10 reports results from Table 1 for ease of comparison.
First, I examine whether the key findings of this paper are robust to the exclusion of Kerala
which passed a slightly different amendment in the form of the Kerala Joint Hindu Family System
(Abolition) Act. Column 2 shows that the results are robust to the exclusion of Kerala. Next, I
address concerns that idiosyncratic factors are correlated within a village instead of the household
because communities at the village-level impose and defend social norms. Column 3 shows that
even though the standard errors are larger compared to the baseline, the point estimates are statisti-
cally significant at the 1% level. In addition, households in non-reform states might serve as a better
control group to capture macroeconomic unobservables. Thus, column 4 includes households from
non-reforming states and finds attenuation in the point estimates. Further, in column 5, I also show
robustness to measurement by using the share of land inherited as the dependent variable, yielding
a point estimate of 3.7 basis points (p-value=0.009).
Furthermore, to rule out concerns relating to omitted factors that might affect females and males
differentially and, thereby, the outcomes of interest, I conduct additional tests by limiting the sample
to women and comparing across and within the states. Column 6 finds a consistent effect of the
inheritance reform among women from treated religious groups across early reforming and late
reforming states, while column 7 finds no effect among women from non-treated religious groups.
Lastly, in columns 8 through 11, I check for inheritance patterns among women from treated
19These results also mitigate the possibility that inheritance of the enterprise itself drives the observed increase infemale business formation. If females inherited businesses from male household heads instead of starting new businesses,then one would expect female entrepreneurship rates to be larger in male-dominated industries than in female-dominatedindustries.
23

religious groups in late reforming states with different cutoffs for the reform date. Across the
various specifications, I find no evidence of changes in the inheritance among women around the
reform in late states, either in terms of economic magnitude or statistical significance, indicating
that the spurious correlation is not driving changes in inheritance.
In panels B, C, and D, I examine alternative specifications for female entrepreneurial activity
around the reform. These panels present results from estimations, which include high-dimensional
fixed- effects. Mainly, they compare female business formation rates among the treated within the
same state, industry and year, thus effectively controlling for industry conditions within each state
and year, that might affect the propensity to become an entrepreneur. Additional results in Internet
Appendix Table IA2, suggest that the increase in entrepreneurship among the treated drives the
baseline increase in female business formation.
Overall, the results from the alternative specifications are consistent with the baseline results,
documenting a reduction in the gender gap in entrepreneurship.
8.3 External validity
To assess the external validity of my main results, I analyze the correlation between the gender gap
in entrepreneurship and inheritance rights (see Figure 5). I show that my findings that inheritance
rights reduces the gender gap in entrepreneurship is not specific to India but is common across
both advanced and developing economies. I construct a cross-country dataset of 102 countries with
different inheritance rights. I classify countries into two types namely: "Equal Inheritance Laws"
and "Unequal Inheritance Laws" based on whether these countries have laws treating sons and
daughters equally on the matters of property rights. I measure the gender gap in entrepreneurship
as the number of women entrepreneurs per 100 male entrepreneurs. For the sake of completeness
of data sources, all measurements, and classifications are as of the end of 2014.
I find that countries with equal inheritance laws have a smaller gender gap than do countries
with unequal inheritance laws with the difference of 11 percentage points being statistically signif-
icant (p-value=0.001) (see Figure 6). While these results are informative, drawing causal inference
is problematic because of omitted variable bias. Overcoming this challenge requires analysis of
microdata and reform within a country which is one of the contributions of this study.
Thus, the positive correlation indicates that unequal inheritance rights and hence access to fi-
24

nance might contribute to the gender gap in entrepreneurship.
9 Conclusion
The gender gap in employment, education, and many other domains has declined considerably over
the last century, but a significant gender gap in entrepreneurship remains. This gap in business
formation directly translates to a difference in business leadership which is detrimental to growth.
Hence, identifying and implementing effective policies to increase women’s economic activity could
have a significant impact on economic growth. This paper investigates one such source of gender
inequality namely discriminatory inheritance rights which prevents women from owning assets.
In this paper, I examine the effects of statutory law reform, granting women from specific reli-
gious groups inheritance rights equal to men’s, on the growth of female entrepreneurship in India.
Using micro data on business registration and exploiting variation in inheritance rights across re-
ligious groups and gender, I show that these reforms lead to an increase in business formation by
women relative to men, especially in the formal sector and in rural areas. Moreover, the evidence
is consistent with a financing mechanism driving this effect, wherein after the reform, the marginal
female entrepreneur has collateral to access financing. An instrumental variables strategy, which
exploits exogenous variation in bank entry into different geographical regions, corroborates that
financial inclusion is the primary driver for the observed increase in women entrepreneurship rates.
Overall, these findings highlight that legal recognition of women’s inheritance rights is beneficial in
narrowing the entrepreneurship gender gap in the face of persistent deep-rooted social norms.
25

References
Adelino, Manuel, Antoinette Schoar, and Felipe Severino, 2015, House prices, collateral, and self-employment, Journal of Financial Economics 117, 288–306.
Agarwal, Bina, 1994, A field of one’s own: Gender and land rights in South Asia, volume 58 (CambridgeUniversity Press).
Aghion, Philippe, and Patrick Bolton, 1997, A theory of trickle-down growth and development,Review of Economic Studies 64, 151–172.
Anderson, Siwan, and Garance Genicot, 2015, Suicide and property rights in India, Journal of Devel-opment Economics 114, 64 – 78.
Anderson, Siwan, and Debraj Ray, 2010, Missing women: age and disease, Review of Economic Studies77, 1262–1300.
Ardagna, Silvia, and Annamaria Lusardi, 2008, Explaining international differences in entrepreneur-ship: The role of individual characteristics and regulatory constraints, Technical report, NationalBureau of Economic Research.
Ayres, Ian, and Peter Siegelman, 1995, Race and gender discrimination in bargaining for a new car,American Economic Review 304–321.
Bandiera, Oriana, Robin Burgess, Narayan Das, Selim Gulesci, Imran Rasul, and Munshi Sulaiman,2017, Labor markets and poverty in village economies, Quarterly Journal of Economics 132, 811–870.
Banerjee, Abhijit V, and Andrew F Newman, 1993, Occupational choice and the process of develop-ment, Journal of Political Economy 101, 274–298.
Benschop, Marjolein, 2002, Rights and reality: are women’s equal rights to land, housing and propertyimplemented in East Africa? (UN-HABITAT).
Bernhardt, Arielle, Erica Field, Rohini Pande, and Natalia Rigol, 2017, Household matters: Revisit-ing the returns to capital among female micro-entrepreneurs, Technical report, National Bureauof Economic Research.
Bertrand, Marianne, Esther Duflo, and Sendhil Mullainathan, 2004, How much should we trustdifferences-in-differences estimates?, Quarterly Journal of Economics 119, 249–275.
Black, Sandra E, and Philip E Strahan, 2002, Entrepreneurship and bank credit availability, Journalof Finance 57, 2807–2833.
Blattman, Christopher, Nathan Fiala, and Sebastian Martinez, 2013, Generating skilled self-employment in developing countries: Experimental evidence from Uganda, Quarterly Journal ofEconomics 129, 697–752.
Burgess, Robin, and Rohini Pande, 2005, Do rural banks matter? Evidence from the Indian socialbanking experiment, American Economic Review 95, 780–795.
Buttner, E Holly, and Benson Rosen, 1989, Funding new business ventures: Are decision makersbiased against women entrepreneurs?, Journal of Business Venturing 4, 249–261.
Cameron, A Colin, Jonah B Gelbach, and Douglas L Miller, 2008, Bootstrap-based improvements forinference with clustered errors, Review of Economics and Statistics 90, 414–427.
26

Ciccone, A, and E Papaioannou, 2008, Human capital, the structure of production, and economicgrowth, Review of Economics and Statistics .
Deininger, Klaus, Aparajita Goyal, and Hari Nagarajan, 2013, Women’s inheritance rights and inter-generational transmission of resources in India, Journal of Human Resources 48, 114–141.
Evans, David S, and Linda S Leighton, 1990, Some empirical aspects of entrepreneurship, in Eco-nomics of Small Firms, 79–99 (Springer).
Field, Erica, Seema Jayachandran, and Rohini Pande, 2010, Do traditional institutions constrainfemale entrepreneurship? A field experiment on business training in India, American EconomicReview 100, 125–29.
Fischer, Eileen M, A Rebecca Reuber, and Lorraine S Dyke, 1993, A theoretical overview and exten-sion of research on sex, gender, and entrepreneurship, Journal of Business Venturing 8, 151–168.
Foster, Andrew D, and Mark R Rosenzweig, 1995, Learning by doing and learning from others:Human capital and technical change in agriculture, Journal of Political Economy 103, 1176–1209.
Foster, Andrew D, and Mark R Rosenzweig, 1996, Technical change and human-capital returns andinvestments: evidence from the green revolution, American Economic Review 931–953.
Galor, Oded, and Joseph Zeira, 1993, Income distribution and macroeconomics, Review of EconomicStudies 60, 35–52.
Gompers, Paul A, and Sophie Q Wang, 2017, Diversity in innovation, Technical report, NationalBureau of Economic Research.
Halder, Debarati, and K Jaishankar, 2008, Property rights of Hindu women: A feminist review ofsuccession laws of ancient, medieval, and modern India, Journal of Law and Religion 24, 663–687.
Harari, Mariaflavia, 2019, Women’s inheritance rights and bargaining power: Evidence from Kenya,Economic Development & Cultutral Change 1–47.
Heath, Rachel, and Xu Tan, 2019, Intrahousehold bargaining, female autonomy, and labor supply:Theory and Evidence from India, Journal of the European Economic Association Forthcoming.
Holtz-Eakin, Douglas, David Joulfaian, and Harvey S. Rosen, 1994a, Entrepreneurial Decisions andLiquidity Constraints, RAND Journal of Economics 25, 334–347.
Holtz-Eakin, Douglas, David Joulfaian, and Harvey S Rosen, 1994b, Sticking it out: Entrepreneurialsurvival and liquidity constraints, Journal of Political Economy 102, 53–75.
Howell, Sabrina, and Ramana Nanda, 2019, Networking Frictions in Venture Capital, and the Gen-der Gap in Entrepreneurship, Harvard Business School Working Paper .
Hsieh, Chang-Tai, Erik Hurst, Charles I Jones, and Peter J Klenow, 2019, The Allocation of Talentand U.S. Economic Growth, Econometrica 87, 1439–1474.
Jayachandran, Seema, and Rohini Pande, 2017, Why are Indian children so short? The role of birthorder and son preference, American Economic Review 107, 2600–2629.
Jayaratne, Jith, and Philip E Strahan, 1996, The finance-growth nexus: Evidence from bank branchderegulation, Quarterly Journal of Economics 111, 639–670.
27

Jensen, Robert, 2012, Do labor market opportunities affect young women’s work and family deci-sions? Experimental evidence from India, The Quarterly Journal of Economics 127, 753–792.
Kerr, William, and Ramana Nanda, 2011, Financing constraints and entrepreneurship, in David BAudretsch, Oliver Falck, and Stephan Heblich, eds., Handbook of Research on Innovation and En-trepreneurship, chapter 1, 88–103 (Edward Elgar Publishing).
King, Robert G, and Ross Levine, 1993, Finance and growth: Schumpeter might be right, QuarterlyJournal of Economics 108, 717–737.
Kishwar, Madhu, 1994, Codified Hindu law: Myth and reality, Economic and Political Weekly 2145–2161.
Klapper, Leora F, and Simon C Parker, 2010, Gender and the business environment for new firmcreation, World Bank Research Observer 26, 237–257.
La Porta, Rafael, Florencio Lopez-de Silanes, and Andrei Shleifer, 2002, Government ownership ofbanks, Journal of Finance 57, 265–301.
Liberti, Jose M, and Atif R Mian, 2010, Collateral spread and financial development, Journal ofFinance 65, 147–177.
Rajan, Raghuram G., and Luigi Zingales, 1998, Financial Dependence and Growth, American Eco-nomic Review 88, 559–586.
Roy, Sanchari, 2008, Female Empowerment through Inheritance Rights: Evidence from India, Work-ing Paper .
Sapienza, Paola, 2004, The effects of government ownership on bank lending, Journal of FinancialEconomics 72, 357–384.
Schmalz, Martin C, David A Sraer, and David Thesmar, 2017, Housing collateral and entrepreneur-ship, Journal of Finance 72, 99–132.
Schumpeter, J, 1911, Theory of Economic Development, Cambridge University Press .
Sen, Amartya, 1992, Missing women, BMJ: British Medical Journal 304, 587.
Stiglitz, Joseph E, and Andrew Weiss, 1981, Credit rationing in markets with imperfect information,American Economic Review 71, 393–410.
UN-HABITAT, 2006, Women’s Equal Rights to Housing, Land and Property in International Law (UN-HABITAT).
USAID, 2003, Women’s Equal Rights to Housing, Land and Property in International Law, Technicalreport, Final Synthesis and Conference Proceedings Paper.
Watch, Human Rights, 2003, Double Standards: Women’s Property Rights Violations in Kenya,Human Rights Watch 15, 1–54.
World Bank, World, 2012, World Development Report 2012 : Gender Equality and Development .
World Bank, World, 2019, Women, Business, and the Law 2019 .
28

FIGURE 1: EARLY STATES ADOPTING THE INHERITANCE REFORM
Notes: This figure provides information on timing among the five early states that implemented equal inheritance rightsfor men and women. The year of adoptions is as follows: Kerala in 1976; Andhra Pradesh in 1986; Tamil Nadu in 1989;Maharashtra and Karnataka in 1994. The remaining states (indicated in gray) adopted equal inheritance in 2005.
29

FIGURE 2: BUSINESS FORMATION RATES AROUND THE REFORM
(a) Women relative to men
(b) Treated women relative to non-treated women
Notes: The two figures plot evolution of business formation rates around the reform. Panels (a) and (b) plot the regressioncoefficients and 95% confidence intervals from estimating a regression – where the dependent variable is an indicatorvariable for whether a business was started by a treated women – on a dummy variable for each year relative to theyear of the reform. For brevity, I combine three years into one bin. Panel (a) plots business formation rates for treatedwomen relative to untreated entrepreneurs while panel (b) plots business formation rates for treated women relative tountreated women. All regressions include year-of-creation fixed effects. All coefficients are plotted relative to the businessformation rate in k=-1, which is normalized to zero. Data Source: All India Micro Small & Medium Enterprise Census.
30

FIGURE 3: BUSINESS FORMATION BY FINANCING NEEDS
Notes: This figure plots female entrepreneurship rates in high startup capital industries (relative to low startup capitalindustries) around the reform. The figure shows the coefficients and 95% confidence intervals from estimating a regression– where the dependent variable is an indicator variable for whether a business was started by a women – on a set ofdummy variables for each year relative to the year of the reform interacted with high startup capital industry. Highstartup capital industry is an industry where the pre-treatment original purchase value of plant and machinery is inthe top tercile. The regression includes state-industry fixed effects. The coefficients are plotted relative to the businessformation rate in k=-1, which is normalized to zero. For brevity, I combine three years into one bin. Data Source: AllIndia Micro Small & Medium Enterprise Census.
31

FIGURE 4: BUSINESS FORMATION BY INDUSTRY
Notes: This figure plots female entrepreneurship rates by industry around the reform. The figure shows the coefficientsand 95% confidence intervals from estimating a regression of the dependent variable – an indicator variable for whethera business was started by a women – on a set of dummy variables for each industry. The circles and triangles displaythe effects from estimating separate regressions for pre-reform and post-reform periods, respectively. All coefficients areplotted relative to the industry category Agriculture. The sample is restricted to business owners from treated religiousgroups. Data Source: All India Micro Small & Medium Enterprise Census.
32

FIGURE 5: WOMEN’S INHERITANCE RIGHTS REFORMS AROUND THE WORLD, 1960-2017
Notes: This figure presents a map of the countries that adopted equal inheritance rights between 1960 and 2017. Equal inheritance rights refer to equal legal propertyrights to both sons and daughters. The low intensity shaded countries have equal inheritance rights since before 1960 while the highest intensity shaded countries donot have equal inheritance rights as of 2017. The intermediate intensity shaded regions introduced reforms between 1960 and 2017. Source: Author’s calculation usingvarious reports from the World Bank.
33

FIGURE 6: INHERITANCE LAWS AND ENTREPRENEURSHIP GENDER GAP
Notes: This figure compares the gender gap in entrepreneurship between countries that have unequal inheritance lawsto countries that have equal inheritance laws. The classification of countries is based on whether these countries havelaws that treat sons and daughters as equal on the matter of legal property rights. The gender gap in entrepreneurshipis measured as the number of women entrepreneurs per 100 male entrepreneurs. For the sake of completeness of datasources, all measurements, and classifications are done by the end of 2014. The difference in gender gap betweencountries in these two inheritance regimes is statistically significant at the 1% level. Source: Author’s calculation usingvarious reports from the World Bank, OECD, and ILO.
34

TABLE 1: EFFECT OF INHERITANCE REFORM ON WOMEN’S INHERITANCE OF LAND
This table presents results from regressions to test the effect of inheritance reform. Columns 1 to 4 models the likelihood of inheriting land among siblings, using linearprobability model while columns 5 to 8 models the magnitude of the inheritance (measured in acres). The sample consists of siblings with parents owning positivelandholdings in the early reform states. Female is an indicator variable for female. Death post reform is an indicator variable for whether the father of the individual diedafter the reform. Death, t ∈ {−5,−1} is an indicator variable for whether the death of the father occurred in the six years leading up to the reform. Death, t ∈ {0, 5}is an indicator variable for whether the father died in the first five years after the reform and Death, t ≥ 6 is an indicator variable for whether the father died in thesixth year after the reform and beyond. Additional controls include whether the individual married at the time of the reform, mother’s education in years, father’seducation in years, father’s landholding in acres, and whether an individual belongs to scheduled castes or scheduled tribes. All pair wise interactions are includedbut not shown for brevity. All regressions include sibling-composition fixed effects and gender-specific year-of-birth fixed effects. Standard errors are corrected forheteroscedasticity and auto correlation, and clustered by household. Standard errors are reported in parentheses. *,**, and *** indicate significance at the 10%,5% and1% levels (two-sided) respectively. Data Source: Rural Economic and Demographic Survey.
1inheritance Land inherited (acres)
Baseline Pre-trends Addl. controls Placebo Baseline Pre-trends Addl. controls Placebo(1) (2) (3) (4) (5) (6) (7) (8)
Female -0.663∗∗∗ -0.699∗∗∗ -0.665∗∗∗ -0.546∗∗∗ -0.950∗∗∗ -0.966∗∗∗ -0.976∗∗∗ -0.312∗∗∗
(0.019) (0.063) (0.019) (0.120) (0.036) (0.105) (0.036) (0.109)
Female x Death post reform 0.117∗∗∗ 0.166∗∗∗ -0.194 0.258∗∗∗ 0.397∗∗∗ 0.048(0.034) (0.057) (0.134) (0.053) (0.073) (0.120)
Female x Death, t ∈ {−6,−1} 0.036 0.015(0.061) (0.100)
Female x Death, t ∈ {0, 5} 0.127∗∗ 0.143(0.051) (0.087)
Female x Death, t ≥ 6 0.172∗∗ 0.513∗∗∗
(0.080) (0.117)Fixed effects:
Sibling-composition Yes Yes Yes Yes Yes Yes Yes YesBirth-year Yes Yes Yes Yes Yes Yes Yes Yes
Adjusted-R2 0.475 0.482 0.476 0.665 0.469 0.471 0.469 0.787Observations 5252 5252 5252 307 5252 5252 5252 307
35

TABLE 2: FEMALE ENTREPRENEURSHIP AROUND THE REFORM
This table presents results from regressions to test whether women from treated religious groups start a business afterthe inheritance reform in their state. I classify business owners from treated religious groups as Treated while businessowners from non-treated religious groups serve as my control group. Treated refers to individuals from the four religiousgroups, i.e., Hindus, Sikhs, Buddhists, and Jains while the non-treated consists of individuals from the other religiousgroups, i.e., Muslims, Christians, Jews, and others. Columns 1 and 2 present results for all states while columns 3 and4 present results for the five early states. The dependent variable is an indicator variable for whether a woman starts abusiness in a two-digit industry i, state s, in year t. Post reform is an indicator variable equal to 1 from the reform yearand onwards. Standard errors are corrected for heteroscedasticity and autocorrelation and clustered by state and year.Standard errors are reported in parentheses. *,**, and *** indicate significance at the 10%,5% and 1% levels (two-sided)respectively. Data Source: All India Micro Small & Medium Enterprise Census.
All states Early states
(1) (2) (3) (4)Treated 0.017∗∗∗ 0.012∗∗∗ 0.016∗∗∗ 0.015∗∗∗
(0.004) (0.004) (0.004) (0.004)
Post reform × Treated 0.012∗∗ 0.017∗∗∗ 0.015∗∗ 0.013∗∗
(0.005) (0.005) (0.006) (0.007)Fixed effects:
Industry x Year Yes Yes Yes YesState x Year Yes Yes Yes YesState x Industry No Yes No Yes
Adjusted-R2 0.13 0.16 0.14 0.15Observations 1,120,491 1,120,491 489,332 489,332
36

TABLE 3: FEMALE ENTREPRENEURSHIP AROUND THE REFORM, TREATED VS.UNTREATED WOMEN
This table reports results from regressions examining business formation among women from treated religions (relativeto women from non-treated religions) around the inheritance reform. The dependent variable is the fraction of businessesstarted by women from treated religious groups (relative to women from non-treated religions) in a two-digit industry i,state s, in year t. Columns 1 and 2 presents the results for all states while columns 3 and 4 presents the results for the fiveearly states. Treated refers to individuals from the four religious groups, i.e., Hindus, Sikhs, Buddhists, and Jains whilethe non-treated consists of individuals from the other religious groups, i.e., Muslims, Christians, Jews, and others. Postreform is an indicator variable if the year of the startup is greater than (or equal to) the state-specific reform year. Femaleis an indicator variable for females. All regressions are estimated using ordinary least squares (OLS). Standard errors areclustered at the state-year level, and are robust to heteroscedasticity. *,**, and *** indicate significance at the 10%,5% and1% levels (two-sided) respectively.Data Source: All India Micro Small & Medium Enterprise Census.
All states Early states
(1) (2) (3) (4)Treated 0.396∗∗∗ 0.392∗∗∗ 0.362∗∗∗ 0.352∗∗∗
(0.007) (0.007) (0.016) (0.018)
Post reform x Treated 0.097∗∗∗ 0.110∗∗∗ 0.108∗∗∗ 0.127∗∗∗
(0.018) (0.020) (0.026) (0.031)Fixed effects:
Industry x Year Yes Yes Yes YesState x Year Yes Yes Yes YesState x Industry No Yes No Yes
Adjusted-R2 0.39 0.39 0.36 0.36Observations 42,124 42,124 15,456 15,456
37

TABLE 4: HETEROGENEOUS TREATMENT EFFECTS BY FINANCING NEEDS
This table presents results from regressions examining heterogeneity in the business formation based on financing needsaround the inheritance reform in their state. Panel A reports heterogeneity based on required startup capital while panelB uses the index of financial dependence from (Rajan and Zingales, 1998). Columns 1 and 2 in both panels present resultsfor all states while columns 3 and 4 in both panels present results for the five early states. The dependent variable isan indicator variable for whether a women starts a business in a two-digit industry i, state s, in year t. Post reform is anindicator variable equal to 1 from the reform year and onwards. Industries are classified as High if their purchase valueof plant and machinery in the pre-treatment period is in the top tercile and quartile of the distribution, and interactedwith the Post reform dummy. In both panels, columns 1 and 3 present results based on the tercile measure while columns2 and 4 present results based on the quartile measure. The sample is restricted to business owners from treated religiousgroups. Additionally, panel B restricts the sample to manufacturing industries given the financial dependence measure isonly available for manufacturing. The coefficients are estimated using ordinary least squares (OLS). Standard errors arecorrected for heteroscedasticity and autocorrelation and clustered by state and year. *,**, and *** indicate significance atthe 10%,5% and 1% levels (two-sided) respectively. Data Source: All India Micro Small & Medium Enterprise Census.
Panel A: Startup capital
All states Early states
(1) (2) (3) (4)Post reform × High 0.032∗ 0.044∗∗ 0.020∗∗ 0.041∗∗∗
(0.017) (0.017) (0.009) (0.014)Fixed effects:
Industry x Year Yes Yes Yes YesState x Year Yes Yes Yes YesState x Industry Yes Yes Yes Yes
Adjusted-R2 0.17 0.17 0.13 0.13Observations 991,653 991,653 374,522 374,522
Panel B: Finance dependence
All states Early states
(1) (2) (3) (4)Post reform × High 0.013∗∗ 0.014∗∗ 0.016∗ 0.015∗
(0.007) (0.006) (0.009) (0.009)Fixed effects:
Industry x Year Yes Yes Yes YesState x Year Yes Yes Yes YesState x Industry Yes Yes Yes Yes
Adjusted-R2 0.12 0.12 0.10 0.10Observations 629,267 629,267 246,590 246,590
38

TABLE 5: FEMALE ENTREPRENEURSHIP AND ACCESS TO FINANCE
This table presents results from instrumental variable regressions examining whether access to finance complements theinheritance reform and subsequently drives increase in female entrepreneurship. Columns 1 and 2 adopt clustering atthe state-level to account for correlations across observations within the states. Columns 3 and 4 adopt cluster-robuststandard errors that permit heteroscedasticity while columns 5 and 6 use cluster bootstrap-t procedures to estimatestandard errors. The dependent variable is the ratio of state-level female businesses to total male businesses each year.Explanatory variables reported are bank branches in 1961 per 100,000 persons interacted with (row-wise) (a) Post reform(b) a time trend, (c) a post-1976 time trend, and (d) a post-1989 time trend. Other controls include state population density,log state income per capita, and log rural locations per capita, all measured in 1961. They enter the regression in the sameway as branches per capita in 1961. Post reform is an indicator variable equal to 1 from the reform year and onwards.Standard errors are reported in parentheses. *,**, and *** indicate significance at the 10%,5% and 1% levels (two-sided)respectively.
Standard errors Cluster Robust Bootstrap
(1) (2) (3) (4) (5) (6)Cumulative bank branches opened -0.009 -0.004 -0.009 -0.004 -0.009 -0.004in rural, unbanked locations (0.011) (0.005) (0.008) (0.008) (0.010) (0.010)
Post reform x Cumulative bank branches 0.042∗∗ 0.013∗ 0.042∗∗∗ 0.013∗∗ 0.042∗∗ 0.013in rural areas (0.018) (0.008) (0.014) (0.007) (0.018) (0.010)
Number of bank branches per capita 0.000 -0.001 0.000 -0.001 0.000 -0.001in 1961 × (1961-2000) trend (0.001) (0.001) (0.002) (0.001) (0.002) (0.001)
Post-1976 × (1977-2000) trend 0.018 0.021∗∗ 0.018 0.021 0.018 0.021(0.030) (0.010) (0.019) (0.017) (0.021) (0.023)
Post-1989 × (1977-2000) trend -0.011 0.037∗∗∗ -0.011 0.037∗∗∗ -0.011 0.037∗∗∗
(0.015) (0.007) (0.016) (0.010) (0.017) (0.011)Fixed effects:
State Yes Yes Yes Yes Yes YesYear Yes Yes Yes Yes Yes Yes
Controls No Yes No Yes No Yes
Adjusted-R2 0.31 0.44 0.31 0.44 0.31 0.44Observations 556 556 556 556 556 556
39

TABLE 6: HETEROGENEOUS TREATMENT EFFECTS BY DISCRIMINATORY SOCIALNORMS
This table presents results from regressions examining heterogeneity in business formation based on regional differencesin discriminatory social norms. Columns 1 and 2 present results for all states, while columns 3 and 4 present results forthe five early states. The dependent variable is an indicator variable for whether a woman starts a business in a two-digitindustry i, state s, in year t. Post reform is an indicator variable equal to 1 from the reform year and onwards. Districts areclassified as Low discrimination if the number of estimated missing women (Anderson and Ray, 2010), computed as thedifference between the actual number of women per 1000 men minus the counterfactual number of women per 1000 men,is in the top tercile and quartile of the distribution. Columns 1 and 3 present results for the tercile measure, while columns2 and 4 present results for the quartile measure. The sample is restricted to business owners from treated religious groups.The coefficients are estimated using ordinary least squares (OLS). Standard errors are corrected for heteroscedasticity andautocorrelation and clustered by state and year. *,**, and *** indicate significance at the 10%,5% and 1% levels (two-sided)respectively. Data Source: All India Micro Small & Medium Enterprise Census.
All states Early states
(1) (2) (3) (4)Low discrimination 0.005∗∗ 0.005∗∗∗ 0.000 -0.003
(0.002) (0.002) (0.004) (0.005)
Post reform × Low discrimination 0.028∗∗∗ 0.016∗∗ 0.039∗∗∗ 0.028∗∗∗
(0.009) (0.006) (0.009) (0.008)Fixed effects:
Industry × Year Yes Yes Yes YesState × Year Yes Yes Yes YesState × Industry Yes Yes Yes Yes
Adjusted-R2 0.17 0.17 0.16 0.16Observations 968,823 968,823 429,904 429,904
40
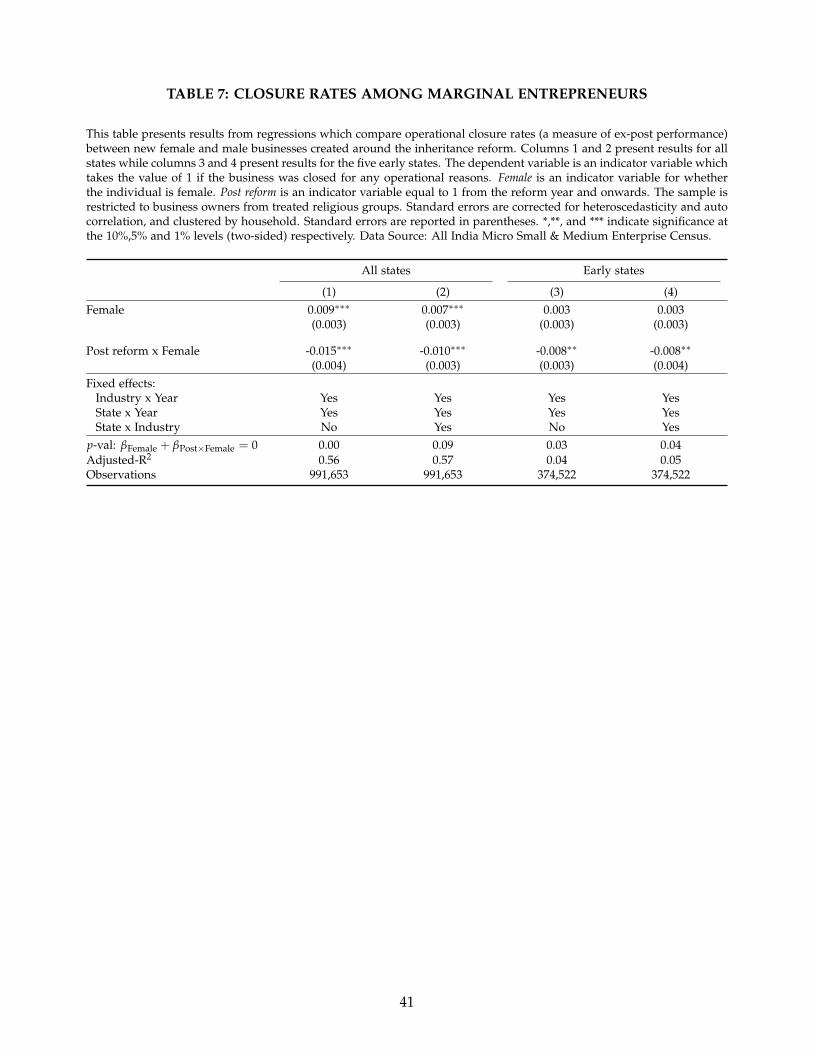
TABLE 7: CLOSURE RATES AMONG MARGINAL ENTREPRENEURS
This table presents results from regressions which compare operational closure rates (a measure of ex-post performance)between new female and male businesses created around the inheritance reform. Columns 1 and 2 present results for allstates while columns 3 and 4 present results for the five early states. The dependent variable is an indicator variable whichtakes the value of 1 if the business was closed for any operational reasons. Female is an indicator variable for whetherthe individual is female. Post reform is an indicator variable equal to 1 from the reform year and onwards. The sample isrestricted to business owners from treated religious groups. Standard errors are corrected for heteroscedasticity and autocorrelation, and clustered by household. Standard errors are reported in parentheses. *,**, and *** indicate significance atthe 10%,5% and 1% levels (two-sided) respectively. Data Source: All India Micro Small & Medium Enterprise Census.
All states Early states
(1) (2) (3) (4)Female 0.009∗∗∗ 0.007∗∗∗ 0.003 0.003
(0.003) (0.003) (0.003) (0.003)
Post reform x Female -0.015∗∗∗ -0.010∗∗∗ -0.008∗∗ -0.008∗∗
(0.004) (0.003) (0.003) (0.004)Fixed effects:
Industry x Year Yes Yes Yes YesState x Year Yes Yes Yes YesState x Industry No Yes No Yes
p-val: βFemale + βPost×Female = 0 0.00 0.09 0.03 0.04Adjusted-R2 0.56 0.57 0.04 0.05Observations 991,653 991,653 374,522 374,522
41

TABLE 8: AGGREGATE ENTREPRENEURIAL ACITIVITY
This table presents results from regressions examining overall business formation around the inheritance reform. In bothcolumns, the dependent variable is the total businesses per 100,000 started by treated (non-treated) religious groups inindustry i, state s, and year t. Column 1 presents the results for all states while column 2 presents the results for the fiveearly states. Treated refers to individuals from the four religious groups, i.e., Hindus, Sikhs, Buddhists, and Jains whilethe non-treated consists of individuals from other religious groups, i.e., Muslims, Christians, Jews, and others. Post reformis an indicator variable if the year of the startup is greater than (or equal to) the state-specific reform year. All regressionsinclude state-year, industry-year, and state-industry fixed effects and are estimated using ordinary least squares (OLS).Standard errors are clustered at the state-year level, and are robust to heteroscedasticity. *,**, and *** indicate significanceat the 10%,5% and 1% levels (two-sided) respectively.Data Source: All India Micro Small & Medium Enterprise Census.
Dependent variable Total businesses per 100,000
All states Early states
(1) (2)Treated 0.072∗∗∗ 0.035∗∗∗
(0.006) (0.004)
Post × Treated 0.030∗∗∗ 0.075∗∗∗
(0.011) (0.012)Fixed effects:
Industry × Year Yes YesState × Year Yes YesState × Industry Yes Yes
Adjusted-R2 0.35 0.31Observations 37,316 16,690
42

TABLE 9: FEMALE ENTREPRENEURSHIP BY INDUSTRY TYPE
This table presents results from regressions examining female entrepreneurship by industry. Columns 1 and 2 presentresults for all states while columns 3 and 4 present results for the five early states. The dependent variable is an indicatorvariable for whether a female starts a business in a two-digit industry i, state s, in year t. Post reform is an indicatorvariable equal to 1 from the reform year and onwards. Female-dominated industry is a dummy variable that takes a valueof 1 if the share of female entrepreneurs within an industry in the pre-treatment period is in the top tercile or quartile ofthe distribution, and zero otherwise. Columns 1 and 3 present results based on the tercile measure while columns 2 and 4present results based on the quartile measure. The sample is restricted to business owners from treated religious groups.The coefficients are estimated using ordinary least squares (OLS). Standard errors are corrected for heteroscedasticity andautocorrelation and clustered by state and year. *,**, and *** indicate significance at the 10%,5% and 1% levels (two-sided)respectively. Data Source: All India Micro Small & Medium Enterprise Census.
All states Early states
(1) (2) (3) (4)Post reform × Female-dominated industry 0.064∗∗∗ 0.080∗∗∗ 0.014∗ 0.024∗∗
(0.011) (0.013) (0.007) (0.009)Fixed effects:
Industry x Year Yes Yes Yes YesState x Year Yes Yes Yes YesState x Industry Yes Yes Yes Yes
Adjusted-R2 0.17 0.17 0.13 0.13Observations 991,653 991,653 374,522 374,522
43

TABLE 10: ALTERNATIVE SPECIFICATIONS
This table presents alternative specifications of the main analyses. Panel A of the table reports robustness checks on actual land inheritance among females. Allcolumns (except column 5) models the inheritance of land among siblings, using a linear probability model.Death post- reform is an indicator variable for whether thefather of the individual died after the reform, Female is an indicator variable for whether the individual is Female and Reform states is an indicator variable. The sampleconsists of siblings in the five reform states. All regressions include gender-specific year-of-birth fixed effects and sibling-composition fixed effects. Standard errorsare corrected for heteroscedasticity and auto correlation, and clustered by household. Panels B, C and D includes state-industry-year fixed effects and The coefficientsare estimated using ordinary least squares (OLS). Panel B presents the results from regression examining whether women start a business after the inheritancereform. Panel C reports results of a heterogeneous treatment intensity. I classify business owners from treated religious groups as Treated while business ownersfrom non-treated religious groups serve as my control group. The dependent variable is the defined as the ratio of total new businesses created by women fromtreated religious groups to the total new businesses created by all women in a two-digit industry i, state s, in year t. The sample is restricted to only women. Panel Drestricts the baseline estimation to entrepreneurs from treated religious groups. The dependent variable is the defined as the ratio of business share of women fromtreated religious groups to the business share by men from treated religious groups in a two-digit industry i, state s, in year t. Treated refers to individuals from thefour religious groups, i.e., Hindus, Sikhs, Buddhists, and Jains while the non-treated consists of individuals from the other religious groups, i.e., Muslims, Christians,Jews, and others. Post reform is an indicator variable equal to 1 from the reform year and onwards. Standard errors are reported in parentheses. *,**, and *** indicatesignificance at the 10%,5% and 1% levels (two-sided) respectively.
Panel A: Alternative specifications
Baseline Exclude Village Non-reform Dep. var.: Treated Placebo Treated women in non-reform states
Ln(inheritance) Kerala clustering states Empirical share women women 1976 1986 1989 1994
(1) (2) (3) (4) (5) (6) (7) (8) (9) (10) (11)Female -0.950∗∗∗ -1.004∗∗∗ -0.950∗∗∗ -0.905∗∗∗ -0.230∗∗∗ - - - - - -
(0.036) (0.037) (0.065) (0.019) (0.010)
Female x Death post reform 0.258∗∗∗ 0.150∗∗ 0.258∗∗∗ 0.205∗∗∗ 0.037∗∗∗ - - - - - -(0.053) (0.062) (0.081) (0.046) (0.014)
Death post reform -0.251∗∗∗ -0.144∗∗ -0.251∗∗∗ -0.253∗∗∗ -0.019∗ - - 0.014 0.019 0.006 -0.021(0.051) (0.057) (0.076) (0.042) (0.011) (0.033) (0.025) (0.026) (0.029)
Death post reform x Reform states - - - - - 0.043∗∗∗ 0.002 - - - -(0.016) (0.057)
Fixed effects:Sibling-composition Yes Yes Yes Yes Yes Yes Yes Yes Yes Yes YesBirth-year Yes Yes Yes Yes Yes Yes Yes Yes Yes Yes Yes
Adjusted-R2 0.351 0.394 0.351 0.287 0.249 0.027 0.071 0.031 0.031 0.031 0.031Observations 5,252 4,517 5,252 16,913 5,252 2,064 755 4,417 4,417 4,417 4,417
44

Panel B: Baseline
All states Early states
(1) (2)Treated 0.012∗∗∗ 0.017∗∗∗
(0.004) (0.004)
Post reform × Treated 0.017∗∗∗ 0.012∗
(0.006) (0.007)Fixed effects:
State x Industry x Year Yes Yes
Adjusted-R2 0.17 0.16Observations 1,117,207 488,175
Panel C: Treated women relative to untreated women
All states Early states
(1) (2)Treated 0.392∗∗∗ 0.352∗∗∗
(0.007) (0.017)
Post reform x Treated 0.110∗∗∗ 0.152∗∗∗
(0.020) (0.027)Fixed effects:
State x Industry x Year Yes Yes
Adjusted-R2 0.23 0.22Observations 42,124 16,716
Panel D: Baseline, treated only
All states Early states
(1) (2)Female -0.788∗∗∗ -0.768∗∗∗
(0.006) (0.011)
Post reform x Female 0.091∗∗∗ 0.082∗∗∗
(0.012) (0.016)Fixed effects:
State x Industry x Year Yes Yes
Adjusted-R2 0.57 0.54Observations 42,124 16,716
45

INTERNET APPENDIX
Women’s Inheritance Rights and Entrepreneurship Gender Gap

FIGURE IA 1: CHANGES IN LANDHOLDINGS AND INHERITANCE BY WOMEN
(a) Change in Landholdings
(b) Land Inherited by women - Treated vs. Others
Notes: These figures plot changes in landholdings and inherited landholdings by women around the reform. Panel(a) plots the change in landholdings (measured in acres) while panel (b) plot the change in inheritance share amongwomens around the reform. Inheritance share is computed as observed inheritance share minus the counterfactual equalinheritance share under the reform. Data Source: Rural Economic and Demographic Survey
1

TABLE IA1: SURVIVAL ANALYSIS OF ADOPTION OF INHERITANCE REFORM
A Cox proportional hazards model is fitted to the time taken to adopt the inheritance reform in a state prior to 2005.Explanatory variables include the following: Growth rate in women entrepreneurship is the annual growth rate in numberof women businesses within a state using data obtained from the MSME Census. Fraction legislators from Congress,Janata, Hindu, Hard Left, and Regional refer to the number of seats held in state legislatures by parties in these politicalgroupings. Cumulative land reform is the total number of land reform acts passed by an Indian state. Health and educationspending is the fraction of total state spending on health and education. GSP growth rate is the real annual growth ratein gross state product (GSP). Aggregate headcount ratio is defined as the percentage of rural and urban households withper capita monthly expenditures below the poverty line. Log (real agricultural wage) is log real male daily agriculturalwage, and Log (factory wage) is log real remuneration per worker in registered manufacturing plants. Cumulative bankbranches opened is the annual cumulative bank branches opened in each year. Priority sector lending share is the share ofbank lending going to priority sectors while Rural credit share is the percentage of total bank credit accounted for by ruralbranches. Real per capita total bank credit is the total bank credit per capita disbursed within a state.
(1) (2) (3) (4)Growth rate in -0.020 -0.028 -0.052 -0.022
women entrepreneurship (0.020) (0.027) (0.044) (0.023)Fraction legislators from:
Congress parties -9.424(8.662)
Hard Left parties -9.179(9.542)
Janata parties -7.812(8.443)
Hindu parties -13.762(15.213)
Regional parties -3.547(7.929)
Cumulative land reform acts 0.128(0.273)
Health and education spending share 15.373(19.211)
GSP growth rate -0.188(0.131)
Aggregate headcount ratio 0.000(0.106)
Log(real agricultural wage) -3.016(2.929)
Log(factory wage) -8.189(5.148)
Cumulative bank branches opened 0.000(0.000)
Priority sector lending share 0.074(0.096)
Rural credit share -0.018(0.136)
Real per capita total bank credit 0.006(0.005)
Observations 476 476 405 385
2

TABLE IA2: FEMALE ENTREPRENEURSHIP AROUND THE REFORM, TREATED ONLY
This table reports results from regressions examining business formation among women from treated religions (relativeto men from treated religions) around the inheritance reform. The dependent variable is the fraction of businesses startedby women from treated religious groups in a two-digit industry i, state s, in year t. Column 1 presents the results for allstates while column 3 presents the results for the five early states. Treated refers to individuals from the four religiouscommunities, i.e., Hindus, Sikhs, Buddhists, and Jains. Post reform is an indicator variable if the year of the startup isgreater than (or equal to) the state-specific reform year. Female is an indicator variable for females. All regressions includeare estimated using ordinary least squares (OLS). Standard errors are clustered at the state-year level, and are robust toheteroscedasticity. *,**, and *** indicate significance at the 10%,5% and 1% levels (two-sided) respectively.Data Source: AllIndia Micro Small & Medium Enterprise Census.
All states Early states
(1) (2)Female -0.785∗∗∗ -0.769∗∗∗
(0.006) (0.011)
Post reform x Female 0.097∗∗∗ 0.088∗∗∗
(0.013) (0.018)Fixed effects:
Industry × Year Yes YesState × Year Yes YesState × Industry Yes Yes
Adjusted-R2 0.74 0.70Observations 42,124 16,716
3

TABLE IA3: FEMALE ENTREPRENEURSHIP AROUND THE REFORM, ADDITIONAL TESTS
This table reports additional results from regressions examining business formation among women around the inheritancereform. Panel A restricts the sample to formal businesses in rural areas while panel B restricts the sample to unregisteredbusinesses. The dependent variable is an indicator for a female business in a two-digit industry i, state s, in year t. Inboth panels, column 1 presents the results for all states while column 2 presents the results for the five early states.Treated refers to individuals belonging to the four religious communities, i.e., Hindus, Sikhs, Buddhists, and Jains whilethe non-treated consists of individuals from other religious groups, i.e., Muslims, Christians, Jews, and others. Post reformis an indicator variable if the year of the startup is greater than (or equal to) the state-specific reform year. All regressionsinclude state-year, industry-year, and state-industry fixed effects and are estimated using ordinary least squares (OLS).Standard errors are clustered at the state-year level, and are robust to heteroscedasticity. *,**, and *** indicate significanceat the 10%,5% and 1% levels (two-sided) respectively.Data Source: All India Micro Small & Medium Enterprise Census.
Panel A: Rural areas
Dependent variable 1Female business
All states Early states
(1) (2)Treated 0.008∗∗ 0.011
(0.004) (0.008)
Post reform × Treated 0.021∗∗∗ 0.020∗∗
(0.006) (0.010)Fixed effects:
Industry × Year Yes YesState × Year Yes YesState × Industry Yes Yes
Adjusted-R2 0.20 0.19Observations 483,772 213,476
Panel B: Unregistered businesses
Dependent variable 1Female business
All states Early states
(1) (2)Treated 0.019∗∗∗ 0.038∗∗∗
(0.007) (0.014)
Post reform × Treated 0.031∗∗∗ 0.031∗
(0.010) (0.017)Fixed effects:
Industry × Year Yes YesState × Year Yes YesState × Industry Yes Yes
Adjusted-R2 0.15 0.15Observations 98,504 22,968
4

TABLE IA4: FEMALE ENTREPRENEURSHIP AROUND THE REFORM, STATE LEVEL
This table reports results from state-level regressions examining business formation among women around the inheritancereform. The dependent variable is the number of businesses started by women from treated religious groups per 100,000of the population each year. Treated refers to individuals belonging to the four religious communities, i.e., Hindus, Sikhs,Buddhists, and Jains while the non-treated consists of individuals from other religious groups, i.e., Muslims, Christians,Jews, and others. Post reform is an indicator variable if the year of the startup is greater than (or equal to) the state-specificreform year. All regressions include state and year fixed effects and are estimated using ordinary least squares (OLS).Standard errors are clustered at the state-level, and are robust to heteroscedasticity. *,**, and *** indicate significance atthe 10%,5% and 1% levels (two-sided) respectively.Data Source: All India Micro Small & Medium Enterprise Census.
Dependent variable female businesses per 100,000
(1) (2)Post reform 1.175∗∗ 1.028∗∗
(0.520) (0.455)Fixed effects:
State Yes YesYear Yes Yes
Controls No Yes
Adjusted-R2 0.40 0.44Observations 799 584
5

TABLE IA5: FEMALE ENTREPRENEURSHIP BY INDUSTRY TYPE, ADDITIONAL TESTS
This table presents results ruling out concerns related to proxy entrepreneurship. Panel A reports tests examining busi-ness formation by females using female employment share to classify industries while panel B examines the nature ofemployment within these firms. In both panels, columns 1 and 2 present results for all states while columns 3 and 4present results for the five early states. The dependent variable in panel A is an indicator variable for whether a Femalestarts a business in a two-digit industry i, state s, in year t while the dependent variable in panel B is the natural logarithmof one plus the total employment (by gender) in each firm. Post reform is an indicator variable equal to 1 from the reformyear and onwards. Female-dominated industry is a dummy variable that takes a value of 1 if in the year before the reformthe share of Female employment within an industry is the above the median share, and zero otherwise. Additionally,each industry is ranked based on the pre-reform median share. In panel A, columns 1 and 3 present results based on themedian measure while columns 2 and 4 present results based on the rank measure. The sample is restricted to businessowners from treated religious groups. All regressions include State-Industry-Year fixed effects. The coefficients are esti-mated using ordinary least squares (OLS). Standard errors are corrected for heteroscedasticity and autocorrelation andclustered by state and year. *,**, and *** indicate significance at the 10%,5% and 1% levels (two-sided) respectively. DataSource: All India Micro Small & Medium Enterprise Census.
Employment by gender
All states Early states
(1) (2) (3) (4)Female Male Female Male
Female 0.300∗∗∗ -0.278∗∗∗ 0.249∗∗∗ -0.300∗∗∗
(0.017) (0.017) (0.017) (0.026)
Post reform x Female 0.079∗∗∗ -0.234∗∗∗ 0.133∗∗∗ -0.220∗∗∗
(0.021) (0.028) (0.023) (0.035)Fixed effects:
Industry x Year Yes Yes Yes YesState x Year Yes Yes Yes YesState x Industry Yes Yes Yes Yes
p-val: βFemale + βPost×Female = 0 0.00 0.00 0.00 0.00Adjusted-R2 0.38 0.39 0.25 0.43Observations 982,194 982,194 369,923 369,923
6

TABLE IA6: HETEROGENEOUS TREATMENT EFFECTS BY HUMAN CAPITAL NEEDS
This table presents results ruling out concerns related to proxy entrepreneurship. Columns 1 and 2 present results for allstates while columns 3 and 4 present results for the five early reforming states. The dependent variable is an indicatorvariable for whether a female starts a business in a two-digit industry i, state s, in year t. Post reform is an indicatorvariable equal to 1 from the reform year and onwards. Industries are classified as High if their human capital index((Ciccone and Papaioannou, 2008)) in the pre-treatment period is in the top tercile and quartile of the distribution, andinteracted with the Post reform dummy. Columns 1 and 3 present results based on the tercile measure while columns 2and 4 present results based on the quartile measure. The sample is restricted to business owners from treated religiousgroups. Additionally, the sample is restricted to manufacturing industries given the index measure is only availablefor manufacturing. The coefficients are estimated using ordinary least squares (OLS). Standard errors are corrected forheteroscedasticity and autocorrelation and clustered by state and year. *,**, and *** indicate significance at the 10%,5%and 1% levels (two-sided) respectively. Data Source: All India Micro Small & Medium Enterprise Census.
All states Early states
(1) (2) (3) (4)Post reform × High -0.004 -0.001 -0.005 -0.000
(0.003) (0.003) (0.003) (0.003)Fixed effects:
Industry x Year Yes Yes Yes YesState x Year Yes Yes Yes YesState x Industry Yes Yes Yes Yes
Adjusted-R2 0.12 0.12 0.10 0.10Observations 626,359 626,359 245,690 245,690
7

TABLE IA7: PERFORMANCE OF THE MARGINAL ENTREPRENEUR, ALTERNATEMEASURES
This table presents results from regressions which compares alternative measures of ex-post performance between newfemale and male businesses created around the inheritance reform. Columns 1 and 2 in both panels present results forall states while Columns 3 and 4 in both panels present results for the five early states. The dependent variable in panelA is an indicator variable which takes the value of 1 if the business experienced a decline in networth between 2008 and2009 and zero otherwise while the dependent variable in panel B is an indicator variable which takes the value of 1 ifthe business experienced a decline in gross output over the same period. Female is an indicator variable for whether theindividual is a female. Post reform is an indicator variable equal to 1 from the reform year and onwards. The sample isrestricted to Hindu business owners only. Standard errors are corrected for heteroscedasticity and auto correlation, andclustered by household. Standard errors are reported in parentheses. *,**, and *** indicate significance at the 10%,5% and1% levels (two-sided) respectively. Data Source: All India Micro Small & Medium Enterprise Census.
Panel A: Decline in net worth
All states Early states
(1) (2) (3) (4)Female 0.001 0.001 0.001 0.002
(0.001) (0.001) (0.002) (0.002)
Post reform x Female -0.006∗∗∗ -0.006∗∗∗ -0.007∗∗ -0.007∗∗∗
(0.002) (0.002) (0.003) (0.003)Fixed effects:
Industry x Year Yes Yes Yes YesState x Year Yes Yes Yes YesState x Industry No Yes No Yes
p-val: βFemale + βPost×Female = 0 0.00 0.00 0.00 0.00Adjusted-R2 0.04 0.05 0.05 0.05Observations 991,653 991,653 374,522 374,522
Panel B: Decline in gross output
All states Early states
(1) (2) (3) (4)Female 0.009∗∗∗ 0.007∗∗ 0.010∗∗∗ 0.009∗∗∗
(0.003) (0.003) (0.003) (0.002)
Post reform x Female -0.010∗∗∗ -0.007∗∗ -0.008∗∗ -0.006∗∗
(0.004) (0.003) (0.003) (0.003)Fixed effects:
Industry x Year Yes Yes Yes YesState x Year Yes Yes Yes YesState x Industry No Yes No Yes
p-val: βFemale + βPost×Female = 0 0.54 0.96 0.09 0.08Adjusted-R2 0.08 0.10 0.02 0.03Observations 991,653 991,653 374,522 374,522
8

TABLE IA8: BANKING AS A FUNCTION OF INITIAL FINANCIAL DEVELOPMENT
This table presents results from first-stage regressions to test whether a state’s initial financial development affects ruralbranch expansion and constitutes a valid instrument for branch openings in rural unbanked locations. Rural bank credit(saving) share is the percentage of total bank credit (saving) accounted for by rural branches. Priority credit share is share ofbank lending going to priority sectors. Cooperative credit share is primary agricultural cooperative credit as a percentageof total cooperative and bank lending. Explanatory variables reported are bank branches in 1961 per 100,000 personsinteracted with (row-wise) (a) a time trend, (b) a post-1976 time trend, and (c) a post-1989 time trend. Other controlsinclude state population density, log state income per capita, and log rural locations per capita, all measured in 1961. Theyenter the regression in the same way as branches per capita in 1961. F-test 1 and F-test 2 are the joint significance test forcoefficients in the first two rows and first three rows, respectively. Standard errors are corrected for heteroscedasticity andauto correlation, and clustered by state. Standard errors are reported in parentheses. *,**, and *** indicate significance atthe 10%,5% and 1% levels (two-sided) respectively.
Rural Rural Rural Rural Priority Cooperativeunbanked credit share savings share banked sector sector
(1) (2) (3) (4) (5) (6)Number of bank branches per capita 0.075∗∗ 0.178 -0.027 0.141∗∗∗ -0.081 0.415
in 1961*(1961-2000) trend (0.028) (0.209) (0.235) (0.012) (0.626) (0.337)
Number of bank branches per capita -0.246∗∗∗ -1.095∗∗ -0.820∗∗∗ -0.072∗∗∗ 0.085 0.018in 1961*(1977-2000) trend (0.030) (0.434) (0.252) (0.020) (0.865) (0.416)
Number of bank branches per capita 0.168∗∗∗ 0.873∗∗∗ 0.434∗ 0.100∗∗ -0.180 -0.181in 1961*(1990-2000) trend (0.042) (0.263) (0.229) (0.041) (0.333) (1.013)
Post-1976 dummy*(1977-2000) trend 0.340 -0.302 -0.167 0.530∗∗ -3.369 -3.798(0.251) (1.495) (0.777) (0.187) (2.402) (2.237)
Post-1989 dummy*(1990-2000) trend -0.238 1.947 0.443 -0.404∗∗∗ -0.048 -3.318(0.152) (1.490) (0.533) (0.103) (1.858) (2.803)
Fixed effects:Year Yes Yes Yes Yes Yes YesState Yes Yes Yes Yes Yes Yes
Controls Yes Yes Yes Yes Yes YesF-test 1 16.87 12.80 25.67 8.97 0.00 5.48F-test 2 0.49 0.10 9.00 27.22 1.79 0.06Adjusted-R2 0.963 0.879 0.870 0.981 0.863 0.806Observations 636 512 512 636 512 494
9

Appendix A.1 Inheritance reforms in India
Under traditional Hindu law, women had almost no rights to property ownership. Inheritance lawsmirrored traditional law and were governed by two main schools of Hindu law, Mitakshara, andDayabhaga. The Mitakshara school prevailed in most of India, whereas the Dayabhaga school heldin Bengal and Assam. The Mitakshara school was further sub-divided into four schools namely:Dravida (Madras) School in South India, Maharashtra (Bombay) School, Banares School in Orissa andBihar, and Mithila School in Uttar Pradesh. These sub-schools differed with regard to their succes-sion laws; the Madras and Bombay sub-schools, in particular, were somewhat more progressive inrecognizing the rights of women (Halder and Jaishankar, 2008). None of the traditional schools,however, gave equal inheritance rights to men and women; the 1956 Hindu Succession Act (HSA1956), an effort to codify and reform Hindu personal law following Indian Independence, was animprovement over all of them. The act attempted to unify different traditional schools of law thatvaried not only from region to region but sometimes by caste within regions. Inherent differencesacross the schools made passage of the act a huge challenge and subject to much debate at the time(Kishwar, 1994). As such, the Succession Act was by far the most controversial part of the reform toHindu personal law.
The most important distinction between the two main schools of law related to their classifica-tions of property. The Mitakshara system made a distinction between "joint family property" and"separate property."
Joint family property consists of ancestral property, i.e., property inherited from the father, pa-ternal grandfather, or paternal great-grandfather, while Separate property comprises property thatis self- acquired if acquired without detriment to the ancestral estate, and any property inheritedfrom persons other than the father, paternal grandfather, or paternal great-grandfather (Agarwal,1994). Crucially, separate property could be bequeathed at will, while rights to joint family propertywas limited to male members of the dynasty.20 The distinction was crucial as it created significantinequity in inheritance among siblings, especially constraining womenâAZs ability to inherit theland to rarely, if ever.21
The original provisions on succession by women, framed by the B. N. Rau committee and pilotedby B. R. Ambedkar in 1947, incorporated the concept of daughters as coparceners in the joint familyproperty. These proposals met with significant opposition from those who were not in favor ofdaughters inheriting property from their families at the cost of their brothers. Consistent withthe regional differences in the traditional schools of law, the northern states dismissed the moreprogressive ideas of the southern states, and by a majority vote, the proposed clauses allowingequal inheritance rights to women were removed from the act, and the traditional laws remainedintact on this issue.
According to HSA 1956, upon the intestate death of the Hindu male household head, daughtersof the head were equal inheritors along with sons of their fatherâAZs separate property and his"notional" portion of joint family property. Daughters did not have the direct inheritance rights ofthe sons to joint property. Sons had the direct right by birth to the share of joint family property in
20more than 65% of people die every year without making any wills, and this proportion is higher in rural areas.Recent newspaper articles have put this number higher, at 80%. The low prevalence of wills in India suggests that theHSA 1956 is the primary determinant of inheritance patterns within households.
21In her exhaustive study of gender and land rights in India, Agarwal (1994) concludes that women seldom inheritland. In particular, she states: "Ethnographic information, although it is extremely fragmentary, consistently indicatesthat women in traditionally patrilineal communities of South Asia rarely realize the rights that contemporary laws havepromised them. Custom still dominates practice. Hence the vast majority of women do not inherit landed property asdaughters, most donâAZt do so even as widows and few women inherit in other capacities. To the extent women inheritis usually under very restricted conditions."
10

addition to the share of the fatherâAZs own property.22 Further, in rural India, the most commonform of family property is land.23 Thus, under HSA 1956, women continued to suffer significantdiscrimination concerning inheritance and ultimately asset ownership.
The five states that subsequently introduced amendments to the Hindu Succession Act of 1956were those whose traditional schools of law (the Madras and Bombay sub-schools) had previouslyagreed to the inclusion of womenâAZs inheritance rights at the time of passage of the original act,in provisions that parliament overruled at the time. These later state-level amendments includedprecisely the original provisions framed by the committee in 1947 but removed from the act of 1956.Given the historical evolution of the amendment, no precise reasons for the specific years in whichthese different states enacted their amendments (Kerala in 1976; Andhra Pradesh in 1986; TamilNadu in 1989; Maharashtra and Karnataka in 1994) are apparent.
22Besides, sons could also demand the partition of joint family property at will while daughters could not. Forexample, if the joint family property is pertaining to a dwelling house, sons could demand a partition, but daughterswere only allowed the right of residence while being excluded from the right to ownership or possession.
23In my dataset, I find that ancestral property constitutes around 80% of total household property in India, suggestingthat the salience of the inheritance rights reform was indeed quite high in India.
11