work plan, limited field investigation · 2.7 5271.001 work plan limited field investigation...
TRANSCRIPT

2.7
5271.001
WORK PLAN
LIMITED FIELD INVESTIGATION
LANDFILL AREA
Burgess Brothers Superfund SiteWoodford and Bennington, Vermont
BURGESS BROTHERS SUPERFUND SITE STEERING COMMITTEE
DECEMBER 1991
O'Brien & Gere Engineers, Inc.5000 Brittonfield ParkwaySyracuse, New York 13221

WORK PLAN LIMITED FIELD INVESTIGATION
BURGESS BROTHERS SUPERFUND SITE WOODFORD AND BENNINGTON, VERMONT
TABLE OF CONTENTS
SECTION 1. INTRODUCTION 1 1.01. Summary of Background Information 1 1.02. Delineation of Study Area 4 1.03. Limited Field Investigation Purpose and Objectives 4 1.04. Scope of Work 4
SECTION 2. DATA QUALITY OBJECTIVES 6 2.01. Introduction 6 2.02. Ground Penetrating Radar Survey 7 2.03. Vapor Screening Survey 8 2.04. Monitoring Well Evaluation and Ground Water Screening 8
SECTIONS. PROJECT MANAGEMENT PLAN 9 3.01. Introduction 9 3.02. Personnel Involved in On-Site Activities and Management 9 3.03. Health and Safety Plan 10
SECTION 4. LIMITED FIELD INVESTIGATION WORK TASKS 11 4.01. Introduction 11 4.02. Inventory of Municipal and Residential Water Supplies in the Vicinity
of the Study Area 11 4.03. Historical Records and Aerial Photograph Review 12 4.04. Geologic Literature Review 13 4.05. Geographical Reconnaissance 13
4.05.01. Initial Air Quality Survey 13 4.05.02. Wetlands Assessment 15 4.05.03. Sensitive Environmental Receptor Survey 15 4.05.04. Stream Flow Measurements 15
4.06. Topographic Study Area Map Development 17 4.07. Ground Penetrating Radar (GPR) Survey 18 4.08. Vapor Screening Survey 19
December 1991 O'Brien & Gere Engineers

4.08.01. Soil Headspace Screening in Marsh Soils 19 4.08.02. Surface Water and Sediment Screening 21 4.08.03. Soil Gas Survey and Water Table Screening 22
4.09. Existing Monitoring Well Evaluation and Analyses 23 4.09.01. Well Inspections 23 4.09.02. Monitoring Well Re-Development 23 4.09.03. In-Situ Hydraulic Conductivity Testing 24 4.09.04. Ground Water Level Measurements 24 4.09.05. Ground Water Screening 24
4.10. Field Screening of Metals 25
SECTION 5. INTERIM MEMORANDUM PREPARATION 26
SECTION 6. SCHEDULE 27
FIGURES
1. Site Location Map 2. Site Base Plan 3. Existing Monitoring Wells and Sampling Points 4. Study Area Outline 5. Stream Flow Measurement Locations 6. Ground Penetrating Radar Survey Area 7. VOC Concentrations in Shallow Soils (February 1989) 8. Shallow Soil Screening Locations 9. Stream and Sediment Screening Locations 10. Soil Gas and Shallow Ground Water Screening Locations 11. Project Schedule
APPENDICES
A Decontamination Protocol of Sampling Equipment B Shallow Soil Sampling Protocol C Soil and Sediment Headspace Protocol for Gas Chromatograph Analysis D Stream Water and Sediment Sampling Protocol E Ground Water Headspace Protocol for Ground Water Sample Collection and
Gas Chromatograph (GC) Analysis F Soil Gas Protocol for Sample Collection and Gas Chromatograph (GC)
Analysis G Well Development
December 1991 O'Brien & Gere Engineers

SECTION 1. INTRODUCTION
1.01. Summary of Background Information
In August 1991, the U.S. Environmental Protection Agency (USEPA) entered into
a Consent Order with the Burgess Brothers Super-fund Site Steering Committee for a
Remedial Investigation and Feasibility Study (RI/FS) for the Burgess Brothers Superfund
Site. The following presents a Work Plan for conductinga Limited Field Investigation (LFI)
at the Burgess Brothers Superfund Site. This LFI Work Plan is submitted in accordance
with the Consent Order [Appendix I, Statement of Work (SOW), Section 2(11)], which was
effective September 4, 1991.
The Burgess Brothers Superfund Site is located directly due east of the City of
Bennington, Vermont, in the towns of Bennington and Woodford, as shown in Figure 1.
The privately owned landfill is situated on the western slope of Harmon Hill and is part of
a 60 acre plot owned by Clyde Burgess, Jr., and operated by Burgess Brothers, Inc. Dating
back to the 1940s, the site has reportedly been used as a source of sand, a metal salvage
facility, and as a disposal area for construction debris, metals, sludges, and liquid wastes.
Lead sludge was reportedly disposed from 1956 to 1970 in the lagoon area at the southern
end of the landfill area. Battery processing waste was disposed in the lagoon area from
1971 to 1976. To date, there is no record of the disposal of these wastes in any location at
the site other than the lagoon area.
The focus of the investigation is approximately a two to three acre area located in
the northeastern section of the property, adjacent to a national forest. This area is shown
on Figure 2. The portion of the area formerly used for unlined lagoon disposal has been
backfilled, cleared, graded and seeded. Except for several 55 gallon drums, materials have
been removed from the surface. An unnamed stream flows adjacent to the southeast side
of the landfill and joins Barney Brook approximately 1,500 feet from the lanaxill.
Various investigative activities have occurred at this site over the last six years under
the oversight of the Vermont Department of Environmental Conservation (VTDEC), Waste
Management Division. Sampling programs were conducted from 1985 to 1989 by
contractors for the Eveready Battery Company (EEC) and for USEPA. These programs
December 1991 \ O'Brien & Gere Engineers

were conducted to characterize the potential impact of residues from the former lagoon area
to the surrounding environment. These activities included terrain geophysical surveys, soil
and soil gas analyses, as well as surface water, ground water, soil, and leachate sampling.
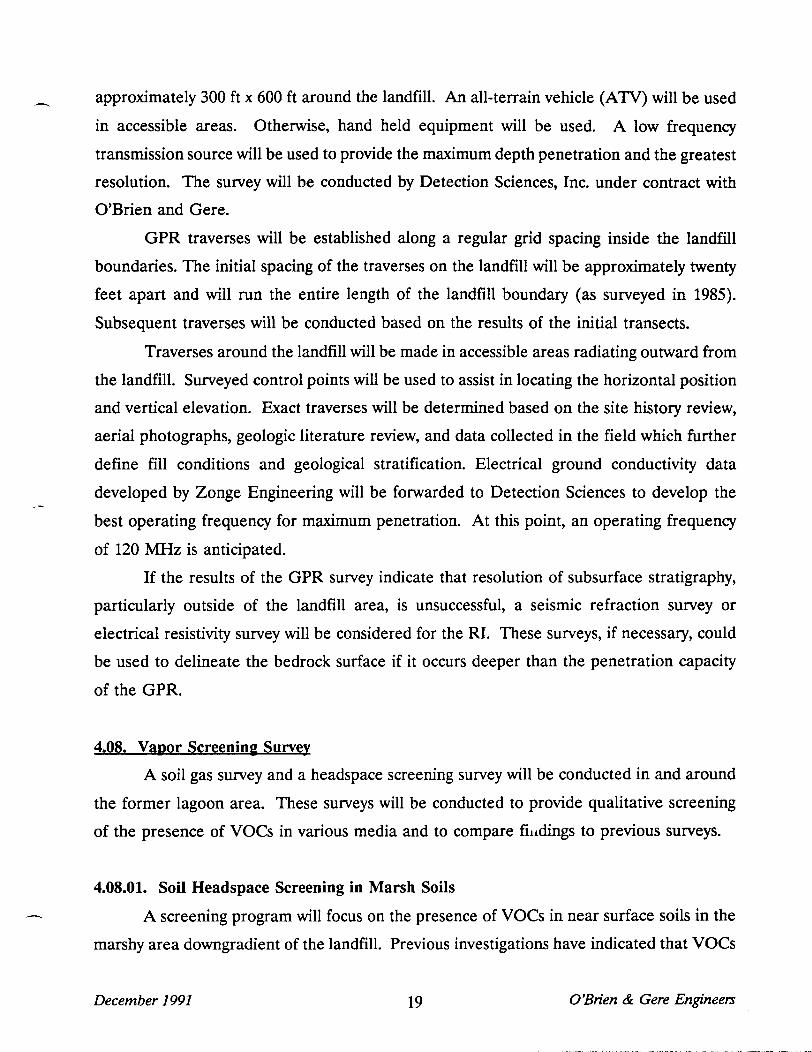
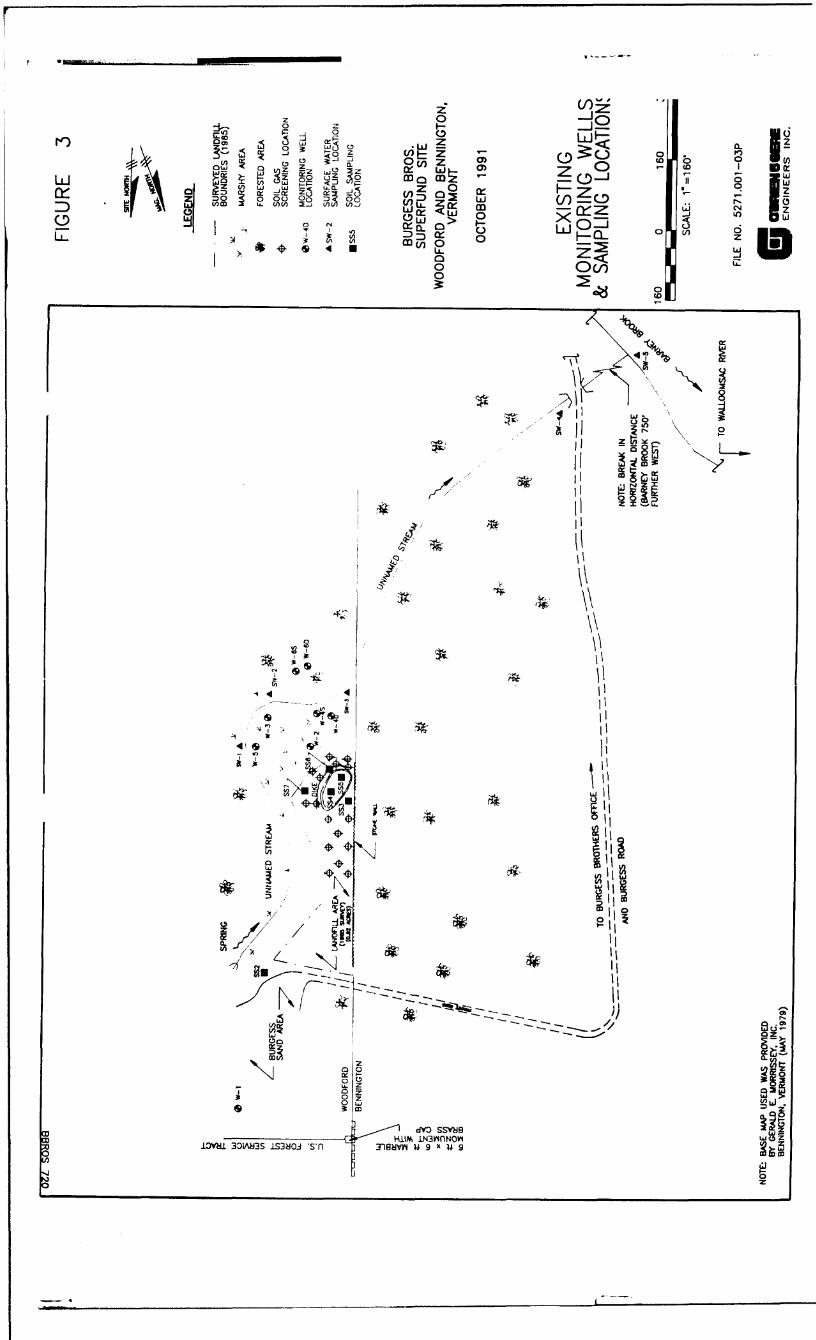
A site map depicting existing ground water monitoring wells and other sampling points is
shown in Figure 3.
In the summer of 1988 the Burgess Brothers Superfund Site was placed on the
National Priorities List as a Superfund site, with USEPA assuming an active role in the site
investigation. Geraghty & Miller was retained by the Eveready Battery Company. In
February of 1989, Geraghty & Miller published a report summarizing the 1988
hydrogeologic investigations conducted at the site. In February of 1989, USEPA contractors
collected surface water samples. Subsequent to this activity, Geraghty & Miller collected
ground water and surface water samples in March 1989. In April of 1989, USEPA
contractors conducted a soil gas survey and soil sampling activities. The soil gas survey
concentrated on the former lagoon area as well as a marshy area downgradient from the
lagoon area. Five soil samples were collected from these areas, selected on the basis of the
soil gas survey. These samples were analyzed for volatile organic compounds (VOCs),
metals and base neutral/acid extractable compounds.
Results of a soil gas survey and soil sampling program conducted by a USEPA
contractor in the Winter and Spring of 1989 indicated detectable concentrations of
trichloroethene (TCE) and tetrachloroethene (PCE) in the vicinity of the lagoon area.
Specifically, soil gas samples collected around the known location of the former lagoon area
indicated detectable TCE and PCE concentrations in five of eight samples plus "several
unidentified early eluting peaks".
Screening of eight soil samples collected from near surface soils in the marshy area
also indicated concentrations of TCE and PCE in the headspace at concentrations ranging
from 1.2 to greater than 40 parts per million (ppm). Chlorobenzene was also tentatively
identified.
Soil analyses conducted at this time indicated detectable TCE and PCE
concentrations of 0.1 to 16 ppm in four of five samples in and adjacent to the former lagoon
area. Metals including lead, mercury, iron, nickel and zinc were detected at various
concentrations. Some metals (copper, nickel and zinc) in each sample were above the
December 1991 2 O'Brien & Gere Engineers

background concentration. Elevated lead, nickel, and mercury were detected in and around
the former lagoon area.
Semi-volatile compounds have been analyzed in soil samples. Analytical results
indicated that these compounds were for the most part non-detectable. A few compounds
(pyrene and fluoranthene) were detected at low concentrations in a soil sample collected
from the toe of the former lagoon area.
The Eveready Battery Company retained Geraghty & Miller to install eight
monitoring wells at the site, one upgradient of the former lagoon area and the remainder
downgradient. The downgradient wells included five shallow and two deep wells positioned
to characterize site conditions. The results of the well installations indicated that ground
water occurs in an unconsolidated deposit at depths of less than eight feet below ground
surface. Previous investigations indicate that ground water flow is predominantly toward the
south and southeast.
In the most recent March 1989 sampling program conducted by Geraghty & Miller,
VOCs were not detected in the upgradient (background) well. However, VOCs were
detected in all downgradient wells west of the unnamed stream in quantities exceeding 10
ppm. This confirmed results dating back to 1985. The main constituents detected in these
downgradient wells included TCE, PCE, dichlorethene (DCE) and vinyl chloride (VC). A
shallow and deep well on the eastern side of the unnamed stream (W-6S, 6D) did not
contain any of the VOCs detected in the other wells. The samples did however contain 80
and 22 ppb of carbon disulfide, respectively, which was not previously identified at the site.
Five surface water samples were collected at locations corresponding to original
Geraghty and Miller locations in February 1989. No VOCs were detected in the upstream
location (SW-1), but TCE, PCE, and isomers of 1,2-DCE were detected at 0.47 to 1.9 ppm
in three downstream sampling points near the former lagoon area. These concentrations
decreased by nearly an order of magnitude from February to March 1989 and may be the
result of increased dilution during wetter periods. The furthest downstream sampling point
(SW-5) has historically exhibited concentrations below quantifiable limits, and has not
exceeded federal or state drinking water standards. This point is located at the confluence
of the unnamed stream with Barney Brook.
December 1991 3 O'Brien & Gere Engineers

1.02. Delineation of Study Area
Based upon the results of previous investigations, the proposed study area is shown
on Figure 4. This study area includes a one-half mile radius around the former lagoon area,
which is the focus of the investigation. Therefore, field activities will be concentrated in a
downgradient direction (southeast to southwest) from the former lagoon area. The
boundaries of the study area were developed to include the unnamed stream and a
reasonable area downgradient from the former lagoon area, considering site hydrogeology
and potential contaminant plumes identified to date.
The detailed topographic site map generated in the LFI will be utilized to delineate
an area most likely encompassing a radius of approximately 500 feet around the former
lagoon area, which may be modified later if needed. Results of efforts conducted in the LFI
will be used to modify the boundaries of the study area as appropriate.
1.03. Limited Field Investigation Purpose and Objectives
As stated in the Statement of Work (SOW), September 1991, the purpose of the LFI
is to produce a focused Work Plan for the RI/FS. Data obtained through the LFI will be
used for the refinement of the sampling plans for the Phase I RI/FS. Field activities will
consist of the collection of data obtained by non-invasive methodologies and with Levels I
and II analytical support.
The objectives of the LFI are to:
1. Increase the understanding of the site in order to enhance the scoping effort.
2. Improve the focus of the RI/FS.
3. Collect data to be used in the establishment of health and safety requirements
and procedures.
4. Identify potential past disposal locations.
1.04. Scope of Work
The scope of work described in this work plan has been developed in accordance
with requirements of the SOW. A variety of tasks have been identified which include a
background literature and document review, field reconnaissance studies, and screening
December 1991 4 O'Brien & Gere Engineers

1
2
3
4
5
6
7
8
9
surveys to update site conditions. Specific tasks are as follows, in the approximate order in
which they will be conducted:
. Inventory of Municipal and Residential Wells in Vicinity of Study Area
. Historical Records and Aerial Photo Review
. Geological Literature Review
. Geographical Reconnaissance
. Topographic Study Area Map Development
. Ground Penetrating Radar (GPR) Survey
. Vapor Screening Survey
. Stream Sampling and Screening
. Existing Monitoring Well Evaluation and Field Screening
December 1991 5 O'Brien & Gere Engineers

SECTION 2. DATA QUALITY OBJECTIVES
2.01. Introduction
Data Quality Objectives (DQOs) are quantitative and qualitative statements
specifying the quality of the environmental data required to support the decision-making
process. DQOs define the uncertainty in the data that is acceptable for each specific activity
during the investigation. This uncertainty includes both sampling error and analytical error.
Ideally, zero uncertainty is the intent; however, the variables associated with the natural
environment and the analytical process inherently contribute to the uncertainty of the data.
It is the overall objective to keep the total uncertainty within an acceptable range that will
not hinder the intended use of the data.
Development of DQOs for a field investigation involves defining the minimum
criteria for statistical, logistical, sampling, and analytical parameters, that must be attained
in order to generate data of the quality that is consistent with the intended use of the data.
Examples of data quality parameters for which qualitative or quantitative criteria are
developed include sensitivity, accuracy, precision, sample representativeness, data
comparability and data completeness. Statistical considerations include factors such as the
determination of sample size and identification of appropriate data analysis methods.
Sampling considerations include consideration of sample representativeness, sample
completeness, and sample integrity. Analytical considerations involve the development of
criteria for accuracy, precision, and sensitivity. To facilitate the evaluation of analytical
factors in development of DQOs, USEPA has defined four Analytical Levels (Level I
Level IV). Each Level describes a set of minimum instrumentation and Quality
Assurance/Quality Control criteria that must be attained in order to meet the appropriate
DQOs.
This section presents an overview of the DQOs established for the LFI. s\ detailed
statement of QA/QC criteria to achieve these DQOs is discussed in the field protocols
contained in the appendices. The discussion is organized according to the field tasks that
will be conducted during the LFI.
December 1991 6 O'Brien & Gere Engineers

2.02. Ground Penetrating Radar Survey
The objectives of the ground penetrating radar (GPR) survey are to identify
subsurface features that may result in reflective anomalies, and to develop a clearer
understanding of the layering in the glacial overburden and top of bedrock in and around
the landfill. The rationale for conducting this survey is further explained in Section 4.07
(GPR Survey). To achieve the objectives of the survey, the following DQO parameters have
been identified for the GPR survey:
1. The GPR survey will be conducted over the entire portion of the landfill,
encompassing the former lagoon area north to the access road entrance, to
develop sufficient electromagnetic profiles. Survey lines will also be extended
northward into the adjoining material storage area. Hand held surveying
equipment will be utilized for surveying areas which are inaccessible to
vehicles. Profiles will also be conducted in adjoining areas near and around
the landfill to evaluate natural stratigraphy. The survey area is shown on
Figure 6.
2. A surveyed grid system will be established over the area which to be covered
by the GPR survey in order that the locations of subsurface anomalies may
be identified in the field. Appropriate annotation techniques will be
employed to reference grid markers on the GPR output.
3. The spacing between survey lines will be selected so that there is a low
probability that subsurface anomalies of interest may be undetected as a result
of being between the scanning range of two sequential survey lines. This
criteria will be selected based on the estimated minimum size of potential
subsurface anomalies of interest in the landfill.
4. The radar frequency will be selected so that a minimum penetration of 50 ft,
and adequate resolution of subsurface anomalies and existing soil horizons,
is obtained. The selection of the radar frequency employed will depend on the
nature of the soils present at the site, and the estimated size of subsurface
anomalies that may be present at the landfill.
December 1991 7 O'Brien & Gere Engineers

2.03. Vapor Screening Survey
The objective of the vapor screening survey will be to provide qualitative screening
of the presence of VOCs in various media, and to compare findings to previous surveys. To
achieve these objectives, the following sampling and analytical parameters will be addressed:
1. Monitoring wells, sediment samples, and soil samples for the headspace
analysis will be collected from locations which have indicated the presence of
VOCs in previous surveys. Additional soil and sediment samples will be
collected, as appropriate, to estimate the approximate areal extent of VOCs
in soils and sediments in the landfill area.
2. Proper sampling techniques and equipment as presented in the USEPA
guidance document: A Compendium of Superfund Field Operations Methods
(USEPA 600/2-80-018) will be utilized for sample collection activities. If the
necessary sampling techniques are not contained in this guidance document,
sampling will be conducted according to pre-approved sampling protocols.
3. Samples will not be composited. This action will minimize the volatilization
of the residues during sample handling.
4. Headspace analysis, soil vapor analysis, and stream water analysis will be
conducted according to the USEPA Level II analytical level, as described in
the USEPA guidance document: Data Quality Objectives for Remedial
Response Activities (USEPA 540/G-87/1003) (USEPA 1987). Level II involves
the use of portable instruments to obtain qualitative and quantitative
identification of compounds. The QA/QC activities for Level II activities
include documentation of blank injections, calibration standard runs, and runs
of qualitative standards between samples.
2.04. Monitoring Well Evaluation and Ground Water Screening
Existing monitoring wells will be redeveloped and water level measurements will be
collected. In addition, groundwater samples will be collected from each monitoring well for
field screening according to USEPA Level II analytical level. The Quality Control/Quality
Assurance parameters for the ground water screening will be the same as the QA/QC
parameters identified for screening of the stream water samples.
December 1991 8 O'Brien & Gere Engineers

SECTION 3. PROJECT MANAGEMENT PLAN
3.01. Introduction
The LFI will be implemented by O'Brien & Gere Engineers, Inc. (O'Brien & Gere)
and its subcontractors. The following section identifies the personnel who will be
supervising field activities and their qualifications. Field activities will be performed in
accordance with the Health and Safety Plan as described in Section 3.03.
3.02. Personnel Involved in On-Site Activities and Management
The LFI will be performed under the direction of Robert C. Ganley, P.E., who will
serve as Project Officer. Mr. Ganley is an environmental engineer with over 17 years of
experience in the field, including investigation and remediation of hazardous waste sites.
Day-to-day project management will be the responsibility of Cheryl L. Cundall, P.E., Esq.,
a chemical engineer with expertise in hazardous waste site investigation and remedial
technology assessment.
Field activities will be supervised by Mr. Richard G. Stromberg, a hydrogeologist with
over 11 years of experience in the development and implementation of hazardous waste site
investigations. O'Brien & Gere's Health and Safety Officer is Dr. Swiatoslav W. Kaczmar,
C.I.H. The O'Brien & Gere personnel who will perform on-site field work for the LFI have
received training and medical surveillance in accordance with the applicable regulations in
29 CFR 1910.
Questions and correspondence regarding the LFI should be addressed to:
Cheryl L. Cundall O'Brien & Gere Engineers, Inc. 5000 Brittonfield Parkway Syracuse, New York 13221 Phone: (315) 437-6100 Fax: (315) 463-7554
December 1991 9 O'Brien & Gere Engineers

3.03. Health and Safety Plan
The Health and Safety Plan for this investigation has been prepared as a separate
document to facilitate its use during field activities.
December 1991 10 O'Brien & Gere Engineers

SECTION 4. LIMITED FIELD INVESTIGATION WORK TASKS
4.01. Introduction
The following describes the work tasks which will be completed in the LFL These
tasks are presented in the approximate order in which they will be completed, although it
is anticipated that many of the tasks will overlap during implementation, as described in
Section 6.
4.02. Inventory of Municipal and Residential Water Supplies in the Vicinity of the Study
Area
An inventory of the municipal or private ground water or surface water supplies
within a one-mile radius of the landfill will be developed by updating information contained
in Appendix C of the Geraghty & Miller report dated May 1989. As of 1989, the Town of
Bennington received most of its drinking water supply from Bolles Brook in Woodford.
Bolles Brook is located several miles northeast of the site and converges with Walloomsac
River which flows westerly about a mile north of the site. According to the Geraghty &
Miller report, "the Bennington water supply system does not extend out to the houses
located downgradient from the site on Burgess Road; the eastern limit of the system is
Barney Road. Those houses not on the Bolles Brook system receive their water supply from
a separate Town source in Woodford. This source is a spring located approximately 1.5
miles east of the landfill on Burgess Road, upgradient of the site."
Also according to the Geraghty & Miller report, "two bedrock water supply wells are
located within a mile of the site in the Una Bella trailer park on Gore Road." At the time
of the Geraghty & Miller report, these were the only private wells in the immediate area,
according to the Town Listers office. According to USEPA, there are two additional
residential wells in the vicinity, the Dickinson and Kenney residences located on burgess
Road.
Gorham Heights, a proposed housing development within one mile of the landfill
near Gore Road, was expected to install bedrock wells by 1989. During a well inventory
December 1991 n O'Brien & Gere Engineers

conducted by Geraghty & Miller for the May 1989 report, no water supply wells were found
to be less than a half-mile from the site.
The Bennington Municipal Water Department, the Woodford Public Works
Department and the Bennington County Board of Health will be contacted to obtain
updated information on water supplies, including Morgan Spring, which serves as a backup
water supply for the Town of Bennington. Additionally, protected zones and areas of direct
or indirect recharge to water supplies, if designated, will be researched. The Vermont
Agency of Natural Resources (ANR) will be contacted to review information potentially on
file concerning current water uses, requirements, and regulations and those planned in the
future. Finally, the Vermont Department of Health (VTDOH) will also be contacted.
4.03. Historical Records and Aerial Photograph Review
A series of black and white aerial photographs which provide historical coverage of
the site and surrounding areas will be obtained from the Earth Science Information Office
in Reston, Virginia. This office maintains a file of commercially available photographs
which was last updated in 1989. In addition to the black and white aerial photographs,
color infrared photos will be selected from several years depending on availability.
Additionally, private mapping companies and other agencies will be contacted if necessary
to fill in gaps in the coverage provided by this agency. At present, it appears that photos
are available for this site from 1952 until 1987 with reasonable coverage.
A review will be conducted of available historical information relative to activities
conducted at the site and nearby surrounding areas. Appropriate state and local agencies
will be contacted. Agencies and other public sources to be contacted will include, but not
be limited to, the Bennington Free Library, the Town Listers Offices in Woodford and
Bennington, Planning and Building Departments, Tax Assessor's Office, and Town Clerk.
VTDEC's Solid Waste Management Division and the Hazardous Materials Management
Division will also be contacted regarding information concerning use and releases of oil,
hazardous wastes, and solid wastes in the study area.
December 1991 12 O'Brien & Gere Engineers

4.04. Geologic Literature Review
A summary of the regional geology of the Bennington area has been provided in
Appendix A of Geraghty and Miller's hydrogeologic report dated May 1988. A literature
review will be conducted to further define the nature of the unconsolidated glacial deposits
and bedrock in the area.
Based on a visual reconnaissance of the site by an O'Brien & Gere geologist in June
1991, the glacial sequence in the area consists of ice contact kames and glacio fluvial
deposits over glacial till and bedrock. The kame and glacio fluvial deposits are primarily
sandy in nature but fine grained silt and clay layers are known to occur in the study area.
These layers may be significant in affecting ground water and associated contaminant
movements, especially east and south of the site. Additionally, the nature and orientation
of fracture zones in the bedrock is important and will be further researched.
Ms. Diane Conrad (acting State Geologist) of the State Geologist's office in
Waterbury will be contacted to identify geologic and hydrologic publications for the area of
study. The U.S. Soil Conservation Survey office in Bennington will also be visited to review
information.
Information obtained from these efforts will be used together with previously
developed information at the site (such as from soil borings and geophysical surveys) to
develop a conceptual understanding of the site geology and hydrogeology.
4.05. Geographical Reconnaissance
The geographical reconnaissance will consist of a number of surveys and assessments
which will constitute the initial field surveying effort. These surveys will be conducted at
times corresponding to optimum field conditions and, if possible, will occur after the data
from tasks described in Sections 4.02 through 4.04 are collected and reviewed.
4.05.01. Initial Air Quality Survey
Upon entering the vicinity of the former lagoon area and landfill area, an initial air
quality survey will be conducted in the breathing zone at surveyed control points around the
landfill to determine whether concentrations of site related indicator compounds (VOCs and
particulates) in the air require personal safety precautions. The air quality survey will be
December 1991 13 O'Brien & Gere Engineers

conducted using: an HNu photoionization detector to measure total VOCs; an ASP-1
radiation detector to measure total beta and gamma emissions; and a MIE miniram to
measure airborne respirable particulates. The air quality survey will be performed at
monitoring points around the perimeter of the landfill and within the landfill. The survey
will be a walkover assessment of conditions. If findings from the walkover indicate readings
of concern as presented in the Health and Safety Plan, a plan for more detailed screening
or a higher level of PPE will be submitted to USEPA
A photoionization detector (PID) will be used to monitor the air for total volatile
organic compounds. The PID will be fitted with a 10.2 eV lamp to provide the highest
range of detection capability. The PID will be calibrated to isobutylene standard calibration
gas.
Respirable dust will be monitored during suitably dry conditions using a mini-ram or
equivalent dust monitoring meter. An Eberline ASP-1 radiation detector, or equivalent,
with a HP-260 beta/gamma probe and SP-A-8 gamma probe will also be used to assess total
beta and gamma emissions from the study area with respect to background levels. If
considerable dust is present, alpha emissions will also be quantified using a ASP-1 radiation
detector equipped with an AC-3-8 alpha scintillation probe. The radiation detector will be
calibrated to the manufacturer's specifications for the particular type of sensor used.
The monitoring points around the perimeter of the landfill will be located at
approximately eighty-foot intervals. The monitoring points located within the landfill area
and lagoon area will be located along a parallel line approximately forty feet east of the
retaining wall. This will correspond to an approximate total of twenty-one measuring
locations, of which approximately fifteen will be around the perimeter and approximately
six will be within the landfill area. Measurements will be taken at approximately eighty-foot
intervals. Locations for follow up and/or continued sampling, if necessary, will be
determined at the site, based on the results of these air samples. Meteorological conditions
preceding and during the air quality survey will be recorded and reported with the data. A
hand-held anemeter will be used to determine the wind conditions. The wind direction,
which will be determined at each monitoring point prior to sampling, will indicate whether
the measurements are upwind or downwind of the landfill. Monitoring will be a "breathing
zone" elevations (i.e., five feet above ground surface). HNu, ASP-1, and miniram
December 1991 14 O'Brien & Gere Engineers

measurements will be taken for a minimum of three minutes. The high, low, and apparent
average readings and wind conditions will be noted in the health and safety notebook.
4.05.02. Wetlands Assessment
A preliminary wetlands survey will be conducted to evaluate areas around the site
that exhibit the characteristics of wetlands. A review of local, state and federal wetland
delineation maps will be conducted prior to the assessment to define existing designated
wetlands. Additionally, maps from the U.S. Soil Conservation Survey will be reviewed.
Existing delineations will be reviewed to identify the presence of hydrophitic
vegetation and hydric soils. Local hydrology will be reviewed for wetland characteristics.
Existing boundaries will be checked if they exist and if no wetlands have been designated,
areas exhibiting some or all wetlands characteristics will be identified. This assessment will
involve a visual screening of soil samples to evaluate coloration, structure and water content.
The area to be surveyed will extend 500 feet around the upgradient side of the site and
1,000 feet downgradient in a south and southeasterly direction.
4.05.03. Sensitive Environmental Receptor Survey
A preliminary review of the presence of rare and endangered or threatened species
will be conducted to identify the potential for sensitive environmental receptors.
Existing information developed by ANR's Department of Fish and Wildlife Natural
Heritage program will be reviewed to assess fragile areas. The Fish and Wildlife Board,
Water Resources Board, and Forests, Parks and Recreation Board will also be contacted
regarding sensitive areas.
4.05.04. Stream Flow Measurements
Stream flow measurements will be conducted during the course of the RI to develop
a data base containing surface water flows and estimates of runoff around the site. At the
time of flow measurements, antecedent precipitation conditions will be noted to provide a
qualitative assessment of flow during varying runoff conditions to evaluate the components
of ground water and surface water runoff to the streams.
December 1991 15 O'Brien & Gere Engineers

During the LFI, one round of stream flow measurements will be collected at several
locations. When the stream flow measurements are collected, information regarding local
precipitation during the previous 72 hours will be noted.
Stream flow measurements will be collected at six specific points which will be
surveyed for future measurements. The points to be measured are shown on Figure 5 and
will include:
1. the unnamed brook at the toe of the former lagoon area
2. the unnamed brook 50 feet upstream from its confluence with Barney Brook
3. Barney Brook 50 feet upstream from its confluence with the unnamed stream
4. Barney Brook 50 feet upstream from its confluence with the Walloomsac
River
5. the Walloomsac River 50 feet up from its confluence with Barney Brook
6. the feeder stream adjacent to the eastern toe of the landfill.
These locations are shown on Figure 5. Additional stream measurements will be collected
during the course of the RI as specified in the RI work plan.
Readings of velocity will be collected using a mechanical Price Pygmy® rotating
current meter or equivalent for unit widths of the stream including correction factors for
friction, and turbulence. The operation and calibration of the meter will be completed
according to methods in the manufacturer' manual. Velocities will be measured at one-foot
stream segments at the midpoint of each section. The resultant velocities will be multiplied
by the measured channel area to obtain discharge in gallons per minute (gpm). The stream
flow measurements will be conducted according to procedures in the "National Handbook
of Recommended Methods for Water Data Acquisition", United States Department of the
Interior, 1981, and the "Stevens Water Resources Data Book", Stevens, Inc., 1987.
Open channel stream gauging stations will be established at locations where flows are
too low, (<0.10 ft/sec) to measure with a rotating meter device. Since stream flow
fluctuates and at times may be non-existent, V-notched water weirs will be constructeu at
the appropriate station. Triangular or V-notched weirs permit the accurate measurement
of very low flows and greatly reduces the random uncertainty of measurements. If
appropriate, notifications will be made to local agencies concerning the weirs.
December 1991 16 O'Brien & Gere Engineers

To accommodate the range of flows anticipated, a 90° notched, sharp crested weir
with a metal strip will be constructed of marine plywood at each location. A six mil sheet
or plastic tarp will be installed on the upstream side of the weir lining the adjacent stream
channel and weir to prevent leaking. A splashboard will be used on the downstream side
to prevent erosion. Two by four studs and boulders or blocks will be placed along the weir
to support it. The stream area will be nine times the notch area to provide a consistently
measurable head. The notch will be 1.5 times as deep as the expected maximum head and
the weir crest or apex will be placed to accurately measure very low flow conditions and to
prevent overtopping.
A staff gauge or stilling well will be installed in the stream channel upstream of the
weir a minimum of four times the length of the maximum anticipated head. The gauge or
well will be surveyed relative to two independent reference points by running a level from
known points to elevation. The gauges will be affixed if possible to permanent structures.
The head reading above the weir crest or apex will be used together with a rating table to
establish flow.
4.06. Topographic Study Area Map Development
The USGS 7.5 minute Bennington and Pownal quadrangle topographic maps will be
used to develop a study area map which will present topographic, physiographic and cultural
features around the former lagoon area. This map will include an area of roughly one half-
mile radius around the former lagoon area. The map will show a larger area in
downgradient directions from the former lagoon area.
Following review of information gathered from the geographic reconnaissance, a
registered land surveyor will supervise the preparation of a base map of the former lagoon
area and immediately surrounding areas. The area included in this map will encompass a
radius of about 500 feet around the former lagoon area. The datum used will serve as a
benchmark for the USGS map (19z7 North American datum) along Burgess Road.
This map will present two foot topographical contours, existing monitoring wells,
sampling point locations, buildings, roads, drainage patterns, and fill areas as identified by
visual observations. Control points will be established at key areas around the landfill for
use in the geophysical surveys and screening efforts.
December 1991 17 O'Brien & Gere Engineers

4.07. Ground Penetrating Radar (GPIO Survey
Terrain geophysical surveys have been previously conducted at the site by Geraghty
& Miller together with Zonge Engineering and Research in June 1988. This information
was summarized in the "Results of the 1988 Hydrogeologic Investigation at the Burgess
Brothers Superfund Site," Geraghty & Miller, 1989.
Results from the previous geophysical surveys conducted in the landfill area
qualitatively identified trends and estimated depths of the bedrock surface beneath the site.
The exact depth to bedrock, however, could not be determined. These surveys according
to Zonge suggest that a fault zone underlies the landfill and trends N 30° E.. A zone of
porous alluvium may be associated with the fault zone. The surveys also suggest that the
bedrock surface dips to the northwest at 13°. These geophysical surveys identified features
which may exist in the subsurface, but their presence was not confirmed. Therefore, a GPR
survey will be performed to further develop these hypotheses and to provide further
delineation of clay layers and the top of bedrock. According to Mr. Daniel Stanfill of.
Detection Sciences, the resistivity of the soils in the area as developed in the Zonge survey
is sufficient enough to permit penetration of 50 to 75 feet outside of filled land. The
penetration of the GPR beneath the landfill will be hindered by objects in the landfill.
Therefore, the GPR survey will be used to identify objects and the structure of the landfill
and naturally occurring stratigraphy outside of it.
A standard transmittal source of 120 mhz will be used unless resolution is required
in the uppermost layers (< 30 inches) in which a higher frequency transmitter will be used.
The GPR survey will be conducted to prepare an electromagnetic profile of the
subsurface structure, particularly in the overburden, in and around the site through a series
of continuous profiles. The general GPR survey area is shown on Figure 6. The survey will
focus on the structure of the landfill and the stratigraphy of immediately surrounding areas.
The primary objectives of the survey are to identify subsurface reflective anomalies i.e.
objects in the landfill and to develop a better understanding of the layering in the glacial
overburden around the landfill. The GPR survey will be used to evaluate the extent of clay
layers on the top of glacial till which could affect ground water movement. A secondary
objective of the survey is to identify the bedrock surface if it occurs at depths shallower than
50 to 75 feet. The GPR survey will be conducted using surveyed control points in an area
December 1991 18 O'Brien & Gere Engineers
approximately 300 ft x 600 ft around the landfill. An all-terrain vehicle (ATV) will be used
in accessible areas. Otherwise, hand held equipment will be used. A low frequency
transmission source will be used to provide the maximum depth penetration and the greatest
resolution. The survey will be conducted by Detection Sciences, Inc. under contract with
O'Brien and Gere.
GPR traverses will be established along a regular grid spacing inside the landfill
boundaries. The initial spacing of the traverses on the landfill will be approximately twenty
feet apart and will run the entire length of the landfill boundary (as surveyed in 1985).
Subsequent traverses will be conducted based on the results of the initial transects.
Traverses around the landfill will be made in accessible areas radiating outward from
the landfill. Surveyed control points will be used to assist in locating the horizontal position
and vertical elevation. Exact traverses will be determined based on the site history review,
aerial photographs, geologic literature review, and data collected in the field which further
define fill conditions and geological stratification. Electrical ground conductivity data
developed by Zonge Engineering will be forwarded to Detection Sciences to develop the
best operating frequency for maximum penetration. At this point, an operating frequency
of 120 MHz is anticipated.
If the results of the GPR survey indicate that resolution of subsurface stratigraphy,
particularly outside of the landfill area, is unsuccessful, a seismic refraction survey or
electrical resistivity survey will be considered for the RI. These surveys, if necessary, could
be used to delineate the bedrock surface if it occurs deeper than the penetration capacity
of the GPR.
4.08. Vapor Screening Survey
A soil gas survey and a headspace screening survey will be conducted in and around
the former lagoon area. These surveys will be conducted to provide qualitative screening
of the presence of VOCs in various media and to compare findings to previous surveys.
4.08.01. Soil Headspace Screening in Marsh Soils
A screening program will focus on the presence of VOCs in near surface soils in the
marshy area downgradient of the landfill. Previous investigations have indicated that VOCs
December 1991 19 O'Brien & Gere Engineers

have been detected in marshy area soils. These compounds have been identified as TCE,
PCE, and 1,2-dichloroethene isomers. The location of previous sampling points and
April 1989 total VOC concentrations in mg/kg are shown on Figure 7.
Analytical results indicated by soil sample numbers SS-3 through SS-7 (except SS-5)
indicated detectable VOC concentrations ranging from 100 to 16,000 mg/kg in the former
lagoon area and along the southeastern toe of the lagoon dike. Soil analyses were limited
to this area except SS-2, which was collected several hundred feet upgradient.
Soil headspace analyses conducted from samples along the toe of the lagoon dike,
again indicated detectable VOC concentrations of 2.7 to greater than 62.3 ppm. An area
of detectable VOCs was described in the R.F. Weston report and is shown on Figure 7. It
should be noted that additional samples were not collected outside of this zone to verify this
boundary.
This soil screening survey is designed to provide for a further delineation of VOCs
in near surface soils in the marshy area adjoining the former lagoon area. The soil gas
survey described in Section 4.08.03 will be used to screen for VOCs within the landfill and
in shallow ground water beneath the marshy area. The protective equipment to be worn
by field crews during sampling and surveying activities is described in the Health & Safety
Plan.
A total of eighteen soil samples will be collected from a depth of six to twelve inches
below grade. The proposed soil sample locations are shown on Figure 8. The soils will not
be composited to minimize the loss of volatiles to the atmosphere. A cleaned stainless steel
trowel or scoop will be used to excavate the hole. Cleaning procedures are discussed in the
decontamination protocol in Appendix A. Larger gravel sized rock fragments will be
manually removed from the sample.
At each location, the top six inches of soil will be removed. The exposed area will
then be screened with a PID calibrated as described in section 4.05.01. Readings will be
recorded in a field log. The operator will note potential factors affecting readings such as
temperature, humidity, and methane. The soil sample will then be collected according to
the procedure described in the protocol in Appendix B.
A constant temperature bath will be used to stabilize the temperatures of the soil
samples prior to analysis by the portable GC. A portable gas chromatograph (Photovac
December 1991 20 O'Brien & Gere Engineers

10S70) equipped with a CPSIL-5 capillary column, isothermal column oven, and either a
10.6 or 11.7 eV photoionization detector will be used. The samples will be analyzed within
2 days (48 hours) of collection. The analytical procedures are described in the protocol in
Appendix C.
4.08.02. Surface Water and Sediment Screening
Nine stream sediment and surface water samples will be collected from the unnamed
stream, the feeder stream, and Barney Brook. Stream sediment and surface water samples
will also be collected from the same locations corresponding to SW-1 through SW-5
locations employed previously by Geraghty & Miller. These samples were collected to
evaluate water quality: 1) in the unnamed streams at locations upgradient, at, and
downgradient of the landfill area, and 2) in Barney Brook, up and downgradient from its
confluence with the unnamed stream. Sediment and surface water samples will also be
collected from: 1) The unnamed strea, upstream from the landfill area, 2) the feeder
stream, near its confluence with the unnamed stream, 3) Barney Brook, 50 feet upstream
from its confluence with the unnamed stream, and 4) Barney Brook, 50 feet upstream from
its confluence with Walloomsac River. The methods to be used to collect the samples are
described in the protocol in Appendix D. Seven samples will be collected as shown in
Figure 9.
In collecting surface water and sediment samples at each location, the surface water
sample will be collected from approximately one foot from the shore closest to the landfill
area. Sediment samples will be collected from the depositional areas of the stream. The
sampler will stand downstream to minimize agitation of the stream bed and surface water.
Samples will be collected at the downstream point first, proceeding upstream. In collecting
sediment samples, a cleaned shovel or post hole digging device will be used to collect a
sample to a depth of six inches below the stream bed. The sample will be placed in a clean
stainless steel tray and the least disturbed portion below the top two inches will be used for
the sample. Each sampling point will be staked and marked for future reference.
The headspace in the sediment sample will be screened using the portable GC
according to procedures in Appendix C. The stream water will be analyzed using the
portable GC following the same protocol as will be used for ground water (Appendix E).
December 1991 21 O'Brien & Gere Engineers

Temperature, pH, specific conductance, and dissolved oxygen will be recorded. A
qualitative physical description of the sediment samples will also be recorded, including
parameters such as color, grain size, and presence of organic matter.
4.08.03. Soil Gas Survey and Water Table Screening
The soil gas/ground water table screening survey will be conducted in areas with
surveyed control points and a gridded system to maintain areal control of survey data. Each
sampling point will be flagged or staked and clearly marked for future reference.
Soil gas samples will be collected in the landfill area and in areas of higher terrain
around the landfill where sufficient vadose zone exists. Soil gas extractions will be collected
according to a regular grid on the landfill at 25 to 35 foot centers, although locations may
be altered somewhat based on in-field results. The soil gas survey will expand on the
previous survey which was limited to the southern half of the landfill. Ground water
headspace screening will be conducted in the marshy area around the unnamed stream.
This survey will be conducted to assess the presence of dissolved VOCs in the water table
zone associated with the marshy area.
The approximate location of the sampling points is shown on Figure 10.
Approximately 20 soil gas samples and approximately 10 ground water samples will be -•
collected. The exact number and location of each may change based upon screening results
obtained in the field. The PID will be used to pre-screen organic vapor concentrations to
identify subsequent sample locations. The sampling grid will be expanded until the total
VOC concentration falls below 100 ppb in each direction. The ground water sampling and
headspace screening will be conducted according to the protocol in Appendix E. The soil
gas screening will be conducted according to the protocol in Appendix F.
A transect will first be established, which will pass directly through the previously
identified "Hot Spot" in a north/south direction. This transect will run from the landfill into
the marshy area as shown on Figure lu. Samples will be spaced at approximately 25 to 35
foot intervals along this transect. Subsequent transects will then be established parallel and
perpendicular to this transect.
December 1991 22 O'Brien & Gere Engineers

4.09. Existing Monitoring Well Evaluation and Analyses
4.09.01. Well Inspections
Existing monitoring wells W-l through 6, W-4D, and W-6D will be inspected to
evaluate their suitability for collecting additional water quality data and physical
measurements of water levels. The seal around the protective casing will be checked for
integrity to minimize infiltration of surface water into the monitoring well. Additionally,
slumping that has occurred around the well, which may indicate improper channelling of
surface or ground water will be assessed. If cracks are observed, they will be repaired with
an appropriate mixture of cement and bentonite. The depth of the well will be checked and
compared to the original depth. Relative plumbness will also be checked. Other than
minor sedimentation, the wells are expected to be usable because they are relatively shallow.
Particular attention will be paid to well W-4D, since it has been reported that the PVC
casing near the surface had cracked due to expansion of water from freezing.
4.09.02. Monitoring Well Re-Development
The wells will be re-developed to enhance the hydraulic connection of the well screen
to the aquifer interval bracketed. The goal of the re-development is to restore the hydraulic
conditions around the well to its natural state, and to minimize chemical alteration of
samples. Wells will be developed using a pre-cleaned stainless steel or disposable high-
density polyethylene (HDPE) bailer or other suitable device, , such as WaterraR hand
operated, positive displacement pump or equivalent. The bailing will cause a steepened
hydraulic gradient near the well which will cause sediment to flow into the well. Methods
to be used are described in the protocol in Appendix G.
Water from wells W-l, W-6 and W-6D will be screened for volatile organics and, if
none are detected, discharged at grade Water from other wells will be contained in five-
gallon buckets and transferred to D.O.T. type 17-E drums in the staging area, which will be
established on a suitable spot on the landfill. The screening and disposal of the
containerized water will be addressed in the Phase 1A RI Work Plan. Well development
will continue until the appropriate criteria are met as described in Appendix G.
December 1991 23 O'Brien & Gere Engineers

4.09.03. In-Situ Hydraulic Conductivity Testing
The in-situ hydraulic conductivity tests will be performed by removing water from the
monitoring well in order to create sufficient hydraulic potential between the monitoring well
and the aquifer. The rate of change will then be analyzed using Bower & Rice or the
Papadopolus method.
If no significant drawdown can be obtained by bailing the monitoring well, an Enviro-
Labs Model DL 120 MCP pressure transducer system, or equivalent, will be utilized. This
test will involve inserting a teflon rod into the well in order to create a positive potential
between the well and aquifer. After the Enviro-Labs system records the response to the
positive potential, the teflon rod will be removed in order to create a negative hydraulic
potential between the well and the aquifer. The rate of the ground water recovery will then
be recorded using the Enviro-Labs system. The data collected from both the positive
displacement and negative displacement will be analyzed and compared to the results
obtained in previous investigations performed by Geraghty & Miller.
All equipment that is placed down the monitoring well will be cleaned with a
phosphate-free detergent wash and a distilled water rinse between each monitoring well.
4.09.04. Ground Water Level Measurements
A measuring point on each well that is not susceptible to the effects of frost heaving
will be identified and marked. These points will be surveyed during development of the site
topographic map to provide updated elevations relative to the USGS datum on Burgess
Road. Additionally, the distance between the well riser and the protective casing will be
checked and recorded to evaluate potential movements.
A minimum of 24 hours after development, water elevations will be measured by a
decontaminated electronic interface probe that senses both water and non-polar liquids i.e.
floating hydrocarbons. The readings will be recorded in a field log and dated. Readings
will be collected to the nearest 0.01 feet.
4.09.05. Ground Water Screening
Similar to screening performed on surface water and the water table zone in the
marshy area, a sample will be collected from each well for GC screening of deeper ground
December 1991 24 O'Brien & Gere Engineers

water. The same protocols will be followed as will be used for other water screening tests.
(See Section 4.08.02 and Appendix E).
4.10. Field Screening of Metals
A semi-quantitative method will be used to screen for two metal ions in ground water
and surface water. E.M. Quant® colorimetric test strips will be used to screen the ground
water and surface water samples for indicator lead and nickel ions. The reported sensitivity
of the strips is in the low parts per million (ppm) range. Screening will be performed in
accordance with the protocols developed by the manufacturer (E. Merck, Dalmstadt,
Germany).
The samples to be screened for these ions include each of those in the following
sections of the LFI Work Plan:
Section 4.08.02 - nine surface water samples
Section 4.08.03 - ten shallow ground water samples (marsh area)
Section 4.09.04 - eight ground water samples from each existing well.
Screening will be performed in accordance with the protocols developed by the
manufacturer (E. Merck, Dalmstadt, Germany).
December 1991 25 O'Brien & Gere Engineers

SECTION 5. INTERIM MEMORANDUM PREPARATION
Following completion of the tasks described in this LFI work plan, O'Brien & Gere
will prepare an interim memorandum. This memorandum will be submitted to the Burgess
Brothers Superfund Site Steering Committee, USEPA, and VTDEC.
The interim memorandum will summarize in narrative and tabular form the results
of the LFI work tasks and an assessment of the attainment of the DQOs. The
memorandum will also include a discussion of the findings of the field program compared
to previous results, any problems associated with the program, and contingencies
implemented to address the problems. A summary of the current environmental conditions
will be presented and significant data gaps will be identified. If necessary, recommendations
will be developed to address the need for emergency response measures or short-term
mitigation activities. Finally, the memorandum will identify the need for short- and long
term data gathering efforts in the form of objectives for Phase 1A of the remedial
investigation. Recommendations for changes in the scoping effort and focus of the remedial
screening will also be provided, if appropriate. The results of the LFI will be included in
the Work Plan for the RL
December 1991 26 O'Brien & Gere Engineers

SECTION 6. SCHEDULE
Upon receipt of written approval by USEPA, efforts associated with the LFI will
begin. It is anticipated that the tasks described herein will be completed in six weeks and
that an interim memorandum will be submitted to USEPA six weeks following completion
of field tasks. The anticipated schedule for the LFI is shown in Figure 11.
Respectfully submitted,
O'BRIEN & GERE ENGINEERS, INC.
Robert C. Ganley, P.E Vice President
djb/wp27
Prepared by: Aamer Raza Richard G. Stromberg S. Edward Wilson, Jr., C.I.H.
Reviewed by: Jeffrey E. Banikowski Cheryl L. Cundall, P.E., Esq. John C. Tomik, C.P.G.
December 1991 27 O'Brien & Gere Engineers

Figures

FIGURE 1
BURGESS BROTHERS
SUPERFUND SITE
WOODFORD AND BENNINGTON, VERMONT
SITE LOCATION MAP FILE No. 6271.001.01P
OrcniENGGERE ENGINEERS. ISJC

8
o Q..UJ ^ tN Z is WF O
OC
TOBE
R
99O(?5vj z o
ID ujt-OQQ mz UJ ec
FO-w§ 03 Z> 8|5BO §s s
m^ o
VE
LU n; o
^ o o o
§1
CO-
If i g A& 0
o
I1!o> o o 0!- <D
CD Q CQZ UJ C3 or CE Sz
(/>§; 03 UJ I
Z) Ek"£ VER
m o goS% O
CDw u. or o
CD 39 e o
o o
*
(*
dVD SSVU8 KLIM !N3hnNOW
iOVHL 30IAW3S !S3yOJ 'S'n jisavw w 9 » u 9
vl ^

FIGURE 4
STUDY AREA—'• LANDFILL AREABURGESS BROTHERS
SUPERFUND SITE
WOODFORD AND BENNINGTON, VERMONT
STUDY AREA MAP •ITt.OOLO

o o
gs 01 o o
i
LU a:
UJ "J2; s* o: LU
00 Ld li o o
Z> o
m o
o z UJ
u. O O o
/
1 \\ ,
4>:
•̂ <&-^x
UJtyUJh U 1
if o u
o 1, < O3
CD 1 dVO SSV8H CD HUM 1N3HONOW
s r u 9 * u 9
L. I { i

z o o
CD O) o
Oc/5 o> I CD Q o
LJ qo: Q
85 i uo: O mID
Z
°ro Q' e O 0 5
omc75 o u_ o oo
Of ol 10 I
I 03 GJ O C
X § >*. 3
V
\ \
o
OJ S o»
£S*"•»>._Hir^Su
JUZ dvo ssvsa HUM !N3^nNOtN
318dVfl W 9 * W 9
0.90
I

CO
O o5u Iff
| 3 *50 "̂ 000 b
O^O Z5-i -j 0> b^> n Z I
OD Q GQ OLU es l l s O)
C£ UJ UJ — fe o; =J(E ^3 o: O 00 OQ LU U. (/>(/) 2_l CNCD z> 10
o e o ino Q O Ol O O)
CO
b o
Q
en en CD
o o_ I— o to
UJ < 3^^: <. Q-
s? I*
Q . O> O liJ
§*: £s
'1 dvo ssvyg HUM !N3|AiniMOIAI
318HVW ^ 9 x U 9 •$• » CD • mmOD
II

O>-_J 2 O
O
2X=r! ZCOLj-LUQ^O
LU o: ID o
3$U-X
Ii 3OIOOD
5 S Q
Oil O a. o
-UJtoiccCDQ
? z
m 2
o Q
O)
CD O
o
Q_
—''
Qi
o (O
Q. 0) O I
O o
o
O O
co.
cc
ct s
$• «
•**
*
CD CD
§to oo
few UJ >o o zz 2 </>
8tr
^
IDVUl 30IAy3S 1S3HOJ 'STI

0
UJ a: rv-
ID 0
O< ^tOLrt
C)O — J
ol tt: <M
Ld UJ ct: ft:JrroW(f)
fl«<
8
2 i^^.
4
9s;
* * N!\ x
N
ssvya VHNO^
10VM1 30IAt)3S 1S3MOJ S n TiBbvnw 9 «w q
II

Oo: £o
•z.o
Q.11 Oo£ •z.
(— O in z O) S§£ ? O a:"' 0) UJ CO 00 Q ̂ £5 I" "S""1 ~z. <
JRG
ESS
PE
RFU
N
CTO
BE
R
sS5i£ a: fi2s I-. CM If}
O
— __J < h- UO -rf Q: _Jo2 < a. 0 (/:
a. §8 <t ° < < £235. u.
ctr o—' QJ CO ̂ 3 I-L. P UJ ^_ Q+ CO O 0
O
O
, 5 *
^ *
o r>
Q CD
IDVdl 30IAM3S

w g, S. Q | S
^ o 1n I
wact
iviti
es i
n t
scri
bes
« »i |j33
t-": 0*
IX (
activ
ities
in
2 ** I S ?V C 1IP i 1 \v c -3 < •->^ E P S •a*" c 5u *~" •9 w-o0 3 OT Q •S3UOT3 •
|| Vi J^H V<4 ao Q a-*CO 00 Pv,
EC. O
H 1 1i—i "S J CO O : ;
i—is i ; Q; ;
I||' ^ !'li—i 1 InP
f ~ i-4 i ;
IGA
TIO
N R
FUN
D
E- w CO III' CL— S'c
S f t\*. 5 *—* •
BR
OTH
ERS
SU
and
Ben
nin
gl
PRO
JECT
SC
HED
} 121 EQ S 1 \A!1 •̂ fc.1 •̂ o
| .* 0) •—i
E «a£ Is0 o
x£—< A08 4> nv *z.O £ f C aj okA
Flow
M
eas.
•—
•tw4
Inve
ntor
yri
eal
Rec
ord
lands
Ass
essm
ent
« is
itiv
e R
ecep
tors
«•••
earn
w| - 3 g i « S i § . c B i ; S « « 3 £ a s - i ? Irtoa ««'5J2-'-> - < ^ W 1 7 3 Q*0,W <s= * * a ^ c « « ^ ^ 0 -i W ' - ' C J o o ^ - j - ?;_
Rev
ie
aiu
re
nevi
ew "
•Q
uali
ty
Su
rvey
—
C C - "*"*E-H
Map
D
evel
opm
ent
o gE- T2 :co C C I) CDSH : <U 1 * * I. »- >>5 > ^ mOT- ^ w , o ( X i n -«̂0} iso
*" >> S (d W Q. S T3 CU
s O : w 5) C Jic o > o £ i C *»t>: t i £ cs 3 O*>"O <0nJ o CO "5 0. t<«O ^ w S , |5*s l
M^ \ n g < > W * - Q 'n
: "̂ => "o o — •£ "̂ P1—) O ^1CQ
m * i i •43 i o — Q c p ° 'D* CD nrt ^i « . ••3 o ; _ ^ H ^ H 2 5 4 > ^ cn 3
1° 0iCO
E^ CO W CO -* i r 3 i Q U 3 i o « D r - c o c o o J C » O J O 9 < O O 0 <3 O O O O O O O O O O O O *»1 c
^,^ ,^ ,^ .^^ .^ .^ ,^^c •* •* ^* •* ^*
w e-o z = a ECO
FIG
UR
E 1
ED
FIEL
D
INV
E
X

APPENDIX A1
DECONTAMINATION PROTOCOL OF SAMPLING EQUIPMENT
Introduction
Decontamination of reusable equipment used to collect samples is essential in order
to maintain chemical data integrity between screening locations. In general,
decontamination should allow for adequate cleaning of the sampling tools for the
contaminants found at the site. Different chemicals or mixtures of chemicals will require
the use of different cleaning methods or compounds. Compounds detected to date at the
Burgess Brothers site include metals and volatile halogenated organics. Screening in the
limited field investigation will include a cleaning method appropriate for these compounds.
Procedure
The method for decontamination will be that which most fully removes site
contaminants from the sampling equipment with least interference to the ultimate screening
procedure.
The general decontamination methods and compounds that will be used to remove
volatile organic compounds are as follows.
Equipment used for collection of samples for volatile organics analysis will be cleaned
by the following steps:
1. Wash equipment with a non-phosphate detergent solution (e.g. Alconox) and
a brush.
2. Rinse with potable tap water.
3. Rinse with reagent grade methanol.
4. Rinse thoroughly with deionized water.
5. For water samples, rinse the equipment at least two times with the media
being sampled before collecting a sample.
Information partially excerpted from "Standard References for Monitoring Wells", Massachusetts Department of Environmental Protection, Publication No. WSC-31091. (1991)
December 1991 i O'Brien & Cere Engineers

6. Repeat this procedure at each location.
7. For field screening, a simple swabbing and rinsing procedure will be sufficient
consisting of the steps noted above.
The source of rinse water is often from nearby public sources. The water used in this
program will be from the Bennington Municipal Supply. This should be noted and water
quality results obtained prior to use. If no volatile organic compound data are available,
a sample will be collected and analyzed by EPA Method 624 for volatile compounds prior
to field activities.
Cleaning fluids will be contained in appropriately sized tubs or buckets and will be
transferred to D.O.T. type 17-E liquid drums which will be stored and labelled in the drum
storage area on-site.
December 1991 ii O'Brien & Gere Engineers

APPENDIX B
SHALLOW SOIL SAMPLING PROTOCOL
Introduction
The purpose of this protocol is to provide methods and procedures for the collection
of soil samples that will reduce variability and encourage continuity in sample collection
protocols by samplers.
This protocol describes sampling devices and procedures for the collection of
disturbed samples at sites that are presumed to be either uncontaminated or contaminated.
The following sections describe various methods and equipment used to obtain
representative samples and some of the constraints upon their use. Samples to be collected
at the Burgess Brothers site will be near surface and will represent disturbed samples.
Method
Soil samples may be either discrete or composite. A discrete sample represents a
single location within the soil column; it must be used for all volatile organic analyses. A
composite sample represents a mixture of soil from more than one discrete location. Such
compositing procedures are not appropriate for samples obtained for analysis for volatile
organic compounds because the agitation of the sample results in a loss of volatiles from the
sample. Discrete soil samples will be collected from near surface soils at locations identified
in the work plan. The sampling device used to collect the soil samples will be either
cleaned or disposable scoops, hand trowels, or shovels. The practical sample depth of
scoops, hand trowels and shovels ranges from the surface to about two feet.
Procedures for Use
1. Carefully remove the top 6-inch layer of soil to the desired sample depth with
a clean tool.
2. If applicable, screen the area to be sampled using an organic vapor analyzer
and record readings in the field log. The PID screen is used as a field safety
procedure as well as for selecting potentially contaminated soil samples. The
December 1991 iii O'Brien & Gere Engineers

soil readings should be compared to action levels presented in the Health and
Safety Plan. The operator of the PID must be experienced in its use and
aware of the effect of factors such as temperature, humidity, or methane
affecting the instrument readings.
3. Using a clean tool, remove and discard a thin layer of soil from the area that
came in contact with the shovel.
4. Obtain a discrete soil sample using a stainless steel lab spoon or its
equivalent. If the sample is to be utilized for headspace screening, fill the
container halfway, leaving a more than adequate volume of headspace for
screening. Place the sample into two 40 ml VOA vials with teflon SEPTA
and screw on cap. In addition to analytical samples, a reference sample
considered representative of the soil may also be collected in a wide mouth
jar and stored for future use.
5. Check that a teflon liner is present in the cap of all analytical sample jars, if
required. Secure the cap tightly. Chemical preservation of solids is generally
not required. The samples will be analyzed according to the method in
Appendix C.
6. Label the sample bottle with the appropriate sample tag. Be sure to label
the tag carefully and clearly using indelible ink. Complete all appropriate
screening forms and record in the field log book. Use of pre-labeled bottles
aids greatly, particularly if gloves are being worn or weather conditions are
adverse.
7. Decontaminate equipment after use and between sample locations. Also
decontaminate sample containers and/or isolate them (such as sealing in
Ziploc bags).
8. Clearly mark each location with a stake or flag displaying the sample number.
December 1991 iv O'Brien & Gere Engineers

APPENDIX C
SOIL & SEDIMENT HEADSPACE PROTOCOL FOR
GAS CHROMATOGRAPH (GO ANALYSIS
Following are the procedures for headspace analysis of soil and sediment samples.
The samples will be analyzed using a Photovac 10S70 portable gas chromatograph (GC)
equipped with a CPSIL-5 capillary column, isothermal column oven, and a 11.7 eV
photoionization detector.
Sample Collection/ Preparation
Soil samples will be collected from a depth of approximately twelve inches below the
ground surface using a steel hand trowel or similar device. The following steps will be taken
to prepare each sample for portable GC analysis:
1. Two 40 ml voa vials equipped with teflon septa, filled halfway with soil, are
placed in a constant temperature bath at approximately 40° Celsius for 15
minutes.
2. The vial is then inverted and shaken thoroughly for 1 minute. The sample
is then allowed to reach thermal and phase equilibrium by standing in the
constant temperature bath for an additional 10 minutes.
4. A precise aliquot (20-100 M!) of headspace is withdrawn from the vial with a
gas-tight syringe and injected into the GC. The second vial serves as a
backup sample should reanalysis be required.
GC Calibration
The GC calibration will consist of: 1) initial calibration, and 2) continuing
calibration.
Initial Calibration: Prior to initiation of field activities, a four point calibration will
be performed for trichloroethene, tetrachloroethene, vinyl chloride, dichloroethene, 1,1
dichloroethane, 1,2-dichloroethane, 1,1,1-trichloroethane, toluene, ethyl benzene, andxylene.
Included will be a zero level standard or method blank and three unique concentration
December 1991 v O'Brien & Gere Engineers

levels. Detection limits are expected to be in the range of 1-25 ppb, with the exception of
1,1-dichloroethane, 1,2-dichloroethane, and 1,1,1-trichloroethane which are expected to be
in the range of 500 ppb due to their high ionization potentials.
A least squares regression will be used to develop an equation, for each calibrant,
relating calibrant peak area and concentration. Results of the sample analyses will be
quantified by comparison to the calibration equations. Sample peaks which are consistent
with a calibrant standard peak (on the basis of retention time) will be quantified using the
corresponding calibration equation. Sample peaks inconsistent with calibrant standards, if
any, will be quantified using the average of all calibrant equations.
Continuing Reference Calibration: During the field investigation, a mid level benzene,
toluene, and xylene (BTX) standard will be run at the start of each day and after every ten
samples to account for variations in instrument performance (e.g. retention time shifts,
detector response) throughout the study period.
The excursion value for retention time shift and response will be 20 percent. A
retention time shift or response variation of greater than 20 percent will facilitate
recalibration of the portable GC. Syringe blanks will be run until instrument response
returns to baseline. Baseline response will be established via the instrument blank run at
the beginning of each day of sampling. Duplicate analyses must agree within 20 percent,
on a total VOC basis, to be valid.
Quality Control
Quality assurance measures will be taken to increase the validity of the data,
including: (1) GC blanks, (2) equipment decontamination, (3) sample collection blanks, (3)
syringe blanks, (5) sampling variability evaluation, and (6) consistent and accurate record
keeping.
1. GC Blanks - GC blanks will be run at the beginning of every day. A GC
blank is a complete run done without injection, performed 10 evaluate
baseline instrument response. As appropriate, instrument response from the
"blank run" is subtracted from subsequent sample and calibrant runs, thereby
minimizing quantification errors associated with integration over baseline
variations.
December 1991 vi O'Brien & Gere Engineers

2. Equipment Decontamination - The hand trowel used to obtain the soil
samples will be decontaminated prior to collection of each sample.
Decontamination will involve a soapy water wash followed by a deionized
water rinse.
3. Sample Collection Blanks - A vial blank will be collected for analysis once per
day to assess the contribution of VOCs from the hand trowel and vial. A
sample collection blank is obtained by transferring one half of a vial worth
of clean sand into a vial using the hand trowel. Sample preparation and
analysis is conducted as described in the sample collection/ preparation
section.
4. Syringe Blanks - A syringe blank will be run after each calibrant run and after
each environmental sample which exhibits detectable levels of VOCs, syringe
blanks will be repeated as necessary until the instrument response returns to
baseline levels.
5. Analytical Variability - In order to assess the variability associated with
analysis of the soil headspace samples at the project site, two sets of duplicate
analyses will be performed.
6 Record Keeping - All chromatograms will be taped into an analytical
notebook. Information detailed on each chromatogram will include: Sample
number, site name, date/time of collection, date/time of analysis, column and
detector type, and gain settings. In addition to the information printed on the
chromatograms, field notes will be added as appropriate.
December 1991 vii O'Brien & Gere Engineers
APPENDIX D
STREAM WATER AND SEDIMENT SAMPLING PROTOCOL
STREAM WATER SAMPLING PROTOCOL
Introduction
The objective of surface water sampling is to collect a representative water sample
of the streams in the vicinity of the Burgess Brothers landfill.
Sample Containers
Place sample containers (40 ml VOA vials) near the sampling location. Label a self
adhesive label with an indelible marker immediately before sampling. Include sample
location, time, date, and sampler's initials. Attach the label to the container. Place clear
polyethylene tape over the completed label to protect it from water and abrasion.
Sample Collection
Sample locations for this project have been identified along streams containing
relatively low flows. It will be assumed that the midpoint of the stream about 6 inches from
the water surface represents an area of equal mixing. Therefore, take samples at this point
at each sampling location. Take the furthest downstream sample first and progress
upstream to minimize the affect from disturbance of the stream bed. Note, sediment
samples as described in the following section will also be collected from these locations at
this time. Water samples will be collected first.
Stand in the water downstream from where the sample containers will be filled. In
slow moving streams, care must be taken not to disturb sediments that may move upstream
to the collection area. Put on a pair of disposable PVC or latex gloves. Submerge the
sampling container and take off the lid. Rinse out the container once with the stream water.
Throw this rinse downstream of the collection area. Fill the container almost to the top.
For those samples to be screened, no preservative is necessary. Fill VOA vials completely,
i.e., do not leave any headspace or bubbles. Check to see that volatile vials are filled
December 1991 viii O'Brien & Gere Engineers

properly by inverting the vials immediately after filling. There should be no air bubbles
visible.
SEDIMENT SAMPLING PROTOCOL
Introduction
The objective of sediment sampling is to collect a representative sediment sample.
It is implicit in these procedures that associated surface water samples will be collected prior
to sediment samples in order to avoid collection of sediment materials which become
dispersed in the water column.
Sample Containers
For sediment samples, use two 40 ml VGA vials that contain a Teflon SEPTA. Fill
out a self-adhesive label using a waterproof marker immediately before sampling. Include
the following information: sample location, time, date, and sampler's initials. Place this
label on the jar and then place clear polyethylene tape over the completed label to protect
it from water and abrasion.
Sample Collection
A stainless steel scoop or spoon will be used to collect sediment samples. For
streams deeper than approximately one foot, attach the scoop to a piece of PVC pipe or
suitable conduit, adjust the angle to minimize spillage, and collect several sediment samples
below the current surface of the sediment. Place these scoops of sediment in a pre-cleaned
glass baking dish. For shallower streams, wade to the same spot the water samples were
collected, put on latex or PVC gloves, and scoop the sediment into the baking dish.
After collecting enough sediment to fill the glass vials, place the sediment in the vials
with a pre-cleaned, stainless steel cooking spoon or kniie to sample taking care to minimize
agitation. Scoop the sediment into the glass jar. Fill the jar half full. Decontaminate the
equipment according to the procedures in Appendix A.
December 1991 ix O'Brien & Gere Engineers

APPENDIX E
GROUND WATER HEADSPACE PROTOCOL FOR GROUND WATER
SAMPLE COLLECTION AND GAS CHROMATOGRAPH (GO ANALYSIS
Following are the procedures for headspace analysis of ground water samples. These
procedures are based upon the method of V.D. Roe, M.J. Lacy, and J.D. Stuart (Anal.
Chem. 1989, 61, 2584-2585).
The samples will be analyzed using a Photovac 10S70 portable gas chromatograph
(GC) equipped with a CPSIL-5 capillary column, isothermal column oven, and either a 10.6
or 11.7 eV photoionization detector.
Sample Collection/ Preparation
Temporary ground water well points, consisting of a slotted aluminum shield point
attached to a length of teflon tubing, will be installed via a hardened steel probe driven by
a hand held impact hammer (Bosch model #11209). Well points will be installed within the
top 2 feet of the first saturated zone if it occurs less than three feet below grade. The exact
depth of each temporary well will depend on the ground water elevation in the area. If
ground water is not encountered at the depth chosen for sampling (3 feet), a soil vapor
sample will be collected at a depth of preferably one to two feet above the water table at
that location. The approximate depth to ground water will be checked at each location by
inferring from water depths in wells. Protocols for the collection and analysis of soil vapor
samples are included as Appendix F.
Prior to collection of the sample, the hardened steel probe will be retracted 3-6
inches leaving the shield point intake slots exposed to ground water. Samples will be
collected in duplicate 40 ml glass vials, equipped with teflon septa, using a peristaltic pump.
Ground water samples collected from monitoring wells for headspace analysis will be
collected in accordance with the following procedures.
Sampling Procedures (BAILER)
Well development (appendix g) can be substituted for purging if done immediately
prior to sampling.
December 1991 x O'Brien & Gere Engineers

1. Identify the well and record the location on the Ground Water Sampling
Field Log.
2. Put on a new pair of disposable latex gloves.
3. Cut a slit in the center of a plastic sheet, and slip it over the well creating a
clean surface onto which the sampling equipment can be positioned.
4. Attach enough polypropylene rope to a bailer to reach the bottom of the
well, and lower the bailer slowly into the well making certain to submerge it
only far enough to fill one-half full. The purpose of this is to recover any oil
film, if one is present on the water table.
5. Pull the bailer out of the well keeping the polypropylene rope on the plastic
sheet or entirely off the ground. Empty the ground water from the bailer
into a clean glass container and observe its appearance.
6. Record the physical appearance of the ground water on the Ground Water
Sampling Field Log.
7. If a floating product is observed, estimate its volume and note this on the
Ground Water Sampling Field Log. Collect the floating product, if present,
into a 40 ml VOA container for volatiles analysis, if required. This sample
may also contain a water phase; however, only the floating phase will be
analyzed for volatiles. After this sample is collected, or if no floating product
is found, proceed to the next.
8. Continue sampling by lowering the bottom loading stainless steel bailer slowly
into the well making certain to submerge it only far enough to fill it
completely. Calculate the volume of water present in the well casing at
stagnant conditions and then bail three to five volumes prior to collecting the
sample.
9. Record the physical appearance of the ground water observed during
sampling on the Ground Water Sampling Field Log and fill the \ OA vials
carefully to minimize agitation. Make sure no air bubbles can be seen in the
vials.
10. Clean the bailer according to procedures in Appendix A. Store the clean
bailer in a fresh plastic bag.
December 1991 xi O'Brien & Gere Engineers

11. Replace the well cap, and lock the well protection assembly before leaving
the well location.
12. Place the polypropylene rope, gloves, and plastic sheeting into a plastic bag
for disposal.
13. Completely fill the 40 ml VOA vials with water from the bailer, taking care
to minimize agitation by pouring carefully along the inside wall of the vial.
14. Seal each vial with a septum and cap, making sure no air bubbles are
entrapped in the vial.
Sample Preparation
The following steps are taken to prepare the sample for headspace analysis:
1. Two 40 ml voa vials equipped with teflon septa, filled completely with
sample, are placed in a constant temperature bath at 40° Celsius for 15
minutes.
2. A syringe needle is placed through the septum of one vial to act as a vent
while 10 ml of the water sample is removed by a 10 ml glass syringe.
3. The vial is then inverted and shaken thoroughly for 1 minute. The sample
is then allowed to reach thermal and phase equilibrium by standing in the
constant temperature bath for an additional 10 minutes.
4. A precise aliquot (20-100 M!) of headspace is withdrawn from the vial with a
gas-tight syringe and injected into the GC. The second vial serves as a
backup sample should reanalysis be required.
GC Calibration
The GC calibration will consist of: 1) initial calibration, and 2) continuing
calibration.
Initial Calibration: Prior to initiation of field activities, a four point calibration will
be performed for trichloroethene, tetrachloroethene, vinyl chloride, dichloroethene, 1,1
dichloroethane, 1,2-dichloroethane, 1,1,1-trichloroethane, toluene, ethyl benzene, andxylene.
Included will be a zero level standard or method blank and three unique concentration
levels. Detection limits are expected to be in the range of 1-25 ppb, with the exception of
December 1991 xii O'Brien & Gere Engineers

1,1-dichloroethane, 1,2-dichloroethane, and 1,1,1-trichloroethane which are expected to be
in the range of 500 ppb due to their high ionization potentials.
A least squares regression will be used to develop an equation, for each calibrant,
relating calibrant peak area and concentration. Results of the sample analyses will be
quantified by comparison to the calibration equations. Sample peaks which are consistent
with a calibrant standard peak (on the basis of retention time) will be quantified using the
corresponding calibration equation. Sample peaks inconsistent with calibrant standards, if
any, will be quantified using the average of all calibrant equations.
Continuing Reference Calibration: During the field investigation, a mid level benzene,
toluene, and xylene (BTX) standard will be run at the start of each day and after every ten
samples to account for variations in instrument performance (e.g. retention time shifts,
detector response) throughout the study period.
Quality Control
Quality assurance measures will be taken to increase the validity of the data,
including: (1) GC blanks, (2) equipment decontamination, (3) sample collection blanks, (3)
syringe blanks, (5) sampling variability evaluation, and (6) consistent and accurate record
keeping.
1. GC Blanks - GC blanks will be run at the beginning of every day. A GC
blank is a complete run done without injection, performed to evaluate
baseline instrument response. As appropriate, instrument response from the
"blank run" is subtracted from subsequent sample and calibrant runs, thereby
minimizing quantification errors associated with integration over baseline
variations.
2. Equipment Decontamination - The peristaltic pump used to obtain the water
samples will be decontaminated prior to collection of each sample.
Decontamination will involve purging the tygon tubing within the pump head
with deionized water.
3. Sample Collection Blanks - A peristaltic pump blank will be collected for
analysis once per day to assess the contribution of VOCs from the collection
mechanism. A sample collection blank is obtained by passing deionized
December 1991 xiii O'Brien & Gere Engineers

water through the peristaltic pump tubing and collecting it in a 40 ml glass
vial. Sample preparation and analysis is conducted as described in the
sample collection/ preparation section.
4. Syringe Blanks - A syringe blank will be run after each calibrant run and after
each environmental sample which exhibits detectable levels of VOCs, syringe
blanks will be repeated as necessary until the instrument response returns to
baseline levels.
5. Sampling and Analytical Variability - In order to assess the variability
associated with collection and analysis of environmental samples at the
project site, two sets of replicate samples will be collected and analyzed and
a two sets of duplicate analyses will be performed.
6. Record Keeping - All chromatograms will be taped into an analytical
notebook. Information detailed on each chromatogram will include: Sample
number, site name, date/time of collection, date/time of analysis, column and
detector type, and gain settings. In addition to the information printed on the
chromatograms, field notes will be added as appropriate.
December 1991 xiv O'Brien & Gere Engineers

APPENDIX F
SOIL GAS PROTOCOL FOR SAMPLE COLLECTION AND
GAS CHROMATOGRAPH (GO ANALYSIS
Following are the procedures for the collection and analysis of soil vapor samples.
The samples will be analyzed using a Photovac 10S70 portable gas chromatograph (GC)
equipped with a CPSIL-5 capillary column, isothermal column oven, and either a 10.6 or
11.7 eV photoionization detector.
Sample Collection
Slotted aluminum shield points attached to a length of teflon tubing will be installed
via hardened steel probes driven by a hand held impact hammer (Bosch model #11209).
Due to the variability in depths to ground water at the site, an attempt will be made to
insert the probe from one to two feet above the water table. Prior to collection of the
sample the hardened steel probe will be retracted 3-6 inches to expose the vapor intake slots
of the shield point. A sample is collected by attaching a 50 ml ground glass syringe to the
installed teflon tubing/shield point assembly and drawing back the plunger. The sample is
secured by closing the stopcock of the syringe until analysis is initiated. A precise aliquot
(20-100 M!) is then drawn from the 50 ml syringe by a graduated, gastight 100 v\ syringe and
injected into the GC.
GC Calibration
The GC calibration will consist of: 1) initial calibration, and 2) continuing
calibration.
Initial Calibration: Prior to initiation of field activities, a four point calibration will
be performed for trichloroethene, tetrachloroethene, vinyl chloride, dichloroethene, 1,1
dichloroethane, 1,2-dichloroethane, 1,1,1-trichloroethane, toluene, ethyl benzene, andxylene.
Included will be a zero level standard or method blank and three unique concentration
levels. Detection limits are expected to be in the range of 1-25 ppb, with the exception of
December 1991 xv O'Brien & Gere Engineers

1,1-dichloroethane, 1,2-dichloroethane, and 1,1,1-trichloroethane which are expected to be
in the range of 500 ppb due to their high ionization potentials.
A least squares regression will be used to develop an equation, for each calibrant,
relating calibrant peak area and concentration. Results of the sample analyses will be
quantified by comparison to the calibration equations. Sample peaks which are consistent
with a calibrant standard peak (on the basis of retention time) will be quantified using the
corresponding calibration equation. Sample peaks inconsistent with calibrant standards, if
any, will be quantified using the average of all calibrant equations.
Continuing Reference Calibration: During the field investigation, a mid level benzene,
toluene, and xylene (BTX) standard will be run at the start of each day and after every ten
samples to account for variations in instrument performance (e.g. retention time shifts,
detector response) throughout the study period.
Quality Control
Quality assurance measures will be taken to increase the validity of the data,
including: (1) GC blanks, (2) equipment decontamination, (3) sample collection blanks, (3)
syringe blanks, (5) sampling variability evaluation, and (6) consistent and accurate record
keeping.
1. GC Blanks - GC blanks will be run at the beginning of every day. A GC
blank is a complete run done without injection, performed to evaluate
baseline instrument response. As appropriate, instrument response from the
"blank run" is subtracted from subsequent sample and calibrant runs, thereby
minimizing quantification errors associated with integration over baseline
variations.
2. Equipment Decontamination - The hardened steel probes used to install the
aluminum shield points will be decontaminated between samples either by
1) wiping down the probe and flushing ambient air through the system, or 2)
ysing a soapy water wash following by a deionized water rinse.
3. Sample Collection Blanks - A sample collection blank will be collected for
analysis once per day to assess the contribution of VOCs from the collection
apparatus. A sample collection blank is obtained by passing ambient air
December 1991 xvi O'Brien & Gere Engineers

through the sample collection apparatus and collecting it in a 50 ml glass
syringe.
4. Syringe Blanks - A syringe blank will be run after each calibrant run and after
each environmental sample which exhibits detectable levels of VOCs, syringe
blanks will be repeated as necessary until the instrument response returns to
baseline levels. Syringe blanks will be run for both the 40 ml ground glass
syringe and the gas-tight 100 ul syringe.
5. Sampling Variability - In order to assess the variability associated with
collection of environmental samples at the project site, two sets of replicate
samples will be collected and analyzed.
6. Record Keeping - All chromatograms will be taped into an analytical
notebook. Information detailed on each chromatogram will include: Sample
number, site name, date/time of collection, date/time of analysis, column and
detector type, and gain settings. In addition to the information printed on the
chromatograms, field notes will be added as appropriate.
December 1991 xvii O'Brien & Gere Engineers

APPENDIX G
WELL DEVELOPMENT
Introduction
Each monitoring well will be developed to remove fine grained materials and
sediments and to allow the screen to transmit representative portions of the ground water
from the entire screened length. Development will be accomplished by bailing from the well
five to ten well volumes of ground water or until it yields stabilized readings of pH,
conductivity, and temperature, which ever occurs first.
Procedure
Removal of five volumes of water from the PVC annulus will be sufficient to replace
two volumes of water from the filter pack. After five volumes are removed, tests of pH,
specific conductance, and temperature will be conducted a minimum of every 1/2 well
volume by use of a Corning series PS portable pH meter or equivalent and a YSI Model
salinity, conductivity, temperature (SCT) meter or equivalent. Readings of pH fluctuating
not more than one-half of one pH unit, specific conductance not more than 25
micromhos, and temperature not more than 2°C for two consecutive events together with
a visual appearance of clear water with little or no suspended particles will constitute
cessation of development. If after 10 volumes the water appears clear but a fluctuation
described above for any or all parameters is exceeded, development will cease.
The meters will be calibrated every morning or as needed by use of pH 4.0 and 10.0
buffer solutions for the pH meter and calibration functions included in the SCT meter.
Ground water will be bailed from the well using a decontaminated stainless steel
bailer or disposable HDPE bailer. Development volumes will be measured by a graduated
containment vessel. A clean plastic sheet will be placed on the ground to avoid
contaminating the bailing equipment with any surface contamination. A new polypropylene
rope will be used on the bailer for each well. Development water from wells W-2, W-3,
W-4, W-4D, W-5, and W-5D will be contained and stored at a drum storage area on site.
Development water at wells W-l, W-6, and W-6D will be screened for volatile organics; if
December 1991 xviii O'Brien & Gere Engineers

none are detected, the development water will be discharged to ground surface away from
the well head at each respective well location and allowed to percolate back to the water
table. Contaminated development water will be properly stored for subsequent disposal.
December 1991 xix O'Brien & Gere Engineers