work study to review the staff strength of sse/elec/power …
TRANSCRIPT
WORK STUDY TO REVIEW
THE STAFF STRENGTH OF
SSE/ELEC/POWER/ALLP,
KTYM, ERS, ERM, IPN &
TCR SECTIONS-
TVC DIVISION
SOUTHERN RAILWAY

SOUTHERN RAILWAY
PLANNING BRANCH
G. 275 / WSSR-481819 / 2019-20
STUDIED BY
WORK STUDY TEAM
OF
PLANNING BRANCH
NOVEMBER 2019
WORK STUDY TO REVIEW
THE STAFF STRENGTH OF
SSE/ELEC/POWER/ALLP, KTYM, ERS,
ERM, IPN & TCR SECTIONS-
TVC DIVISION
SOUTHERN RAILWAY
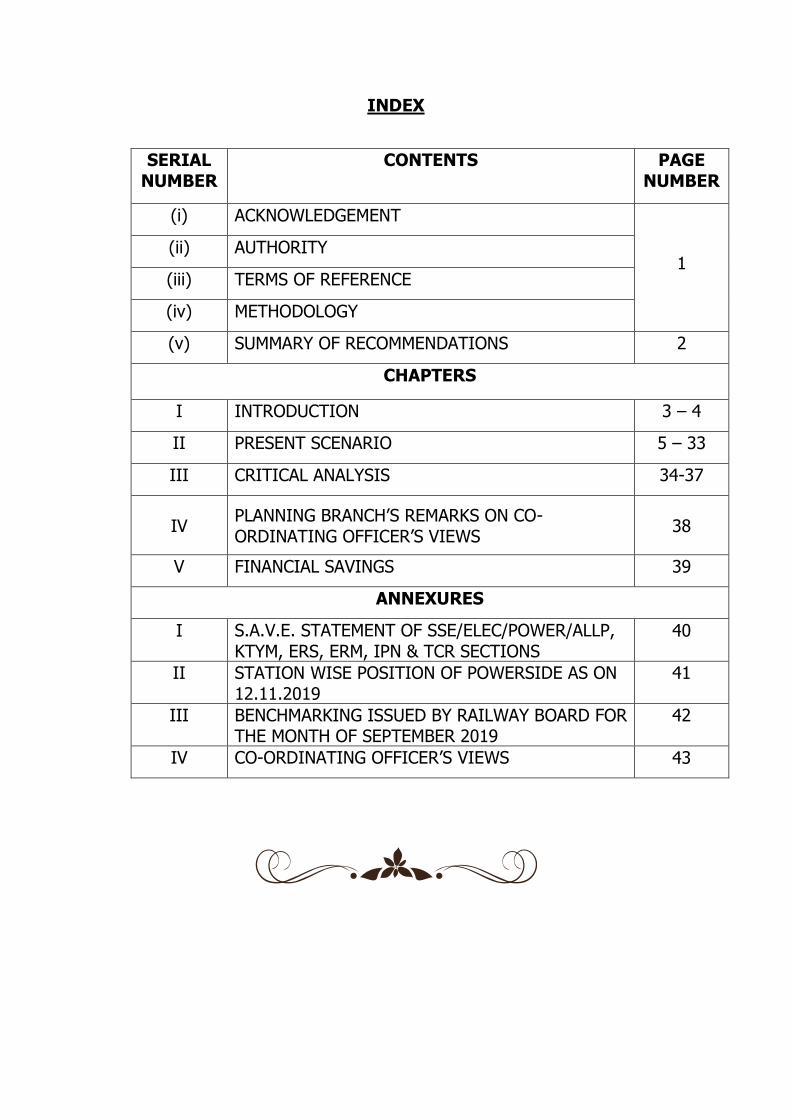
INDEX
SERIAL NUMBER
CONTENTS PAGE NUMBER
(i) ACKNOWLEDGEMENT
1 (ii) AUTHORITY
(iii) TERMS OF REFERENCE
(iv) METHODOLOGY
(v) SUMMARY OF RECOMMENDATIONS 2
CHAPTERS
I INTRODUCTION 3 – 4
II PRESENT SCENARIO 5 – 33
III CRITICAL ANALYSIS 34-37
IV PLANNING BRANCH’S REMARKS ON CO-ORDINATING OFFICER’S VIEWS
38
V FINANCIAL SAVINGS 39
ANNEXURES
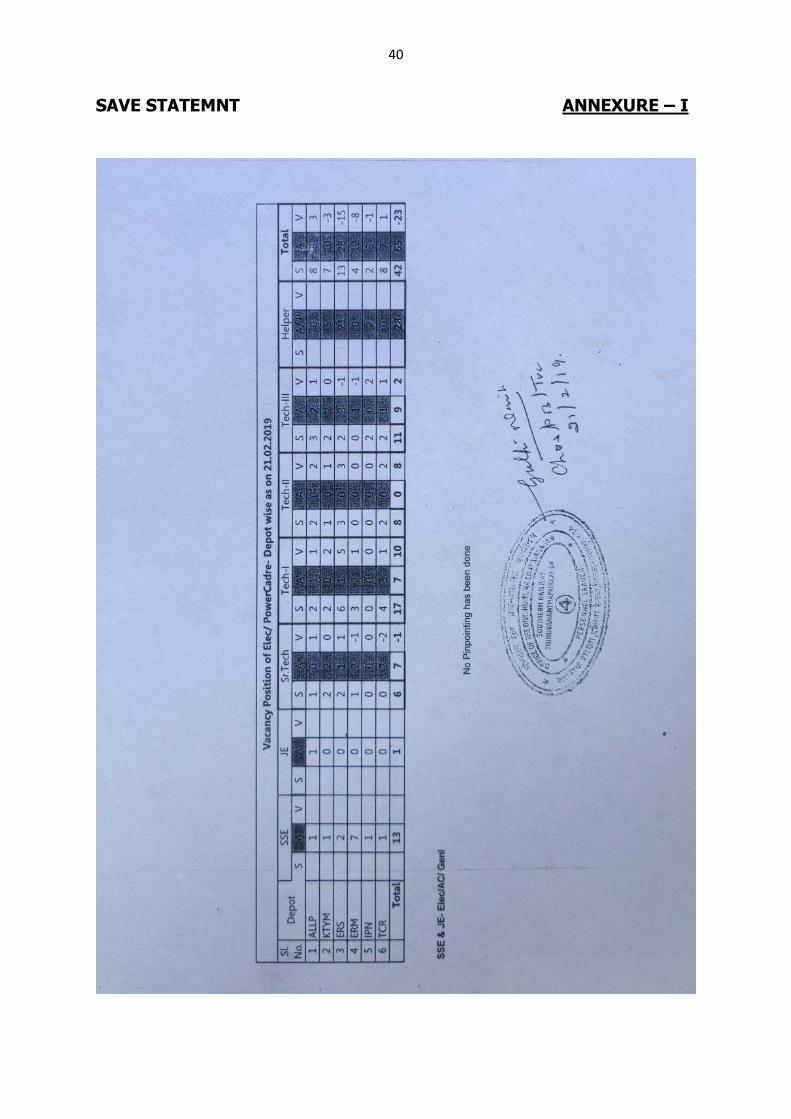
I S.A.V.E. STATEMENT OF SSE/ELEC/POWER/ALLP, KTYM, ERS, ERM, IPN & TCR SECTIONS
40
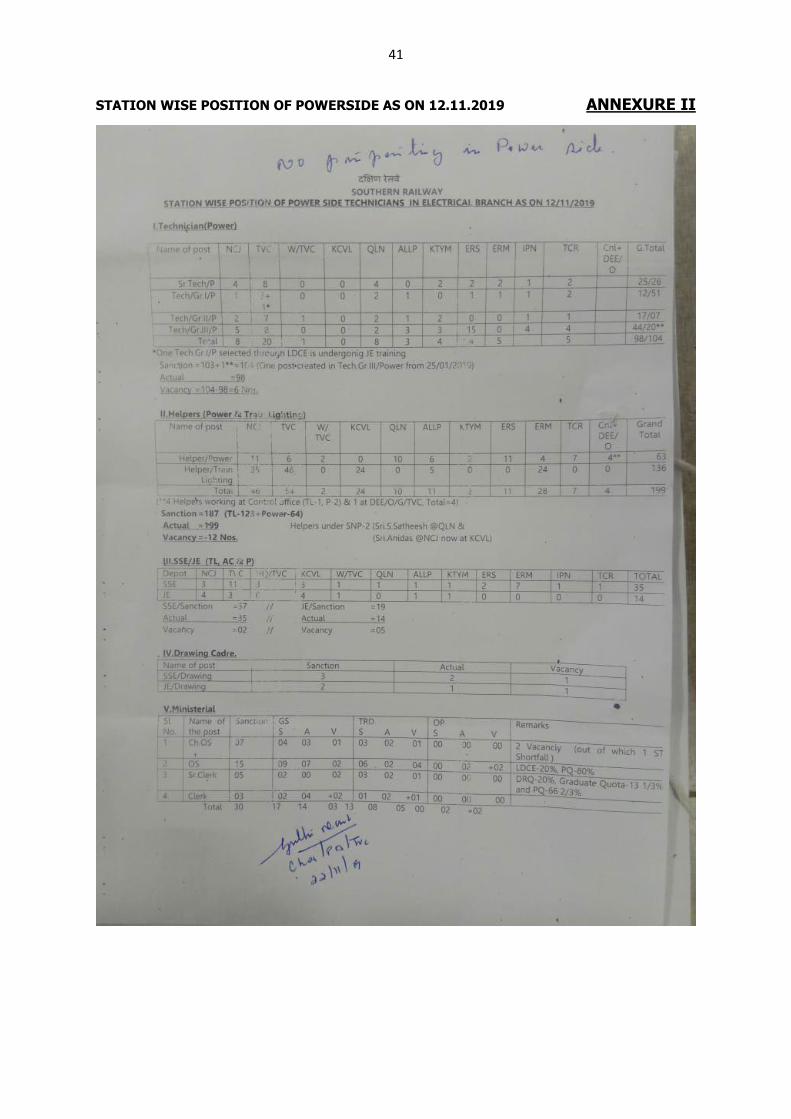
II STATION WISE POSITION OF POWERSIDE AS ON 12.11.2019
41
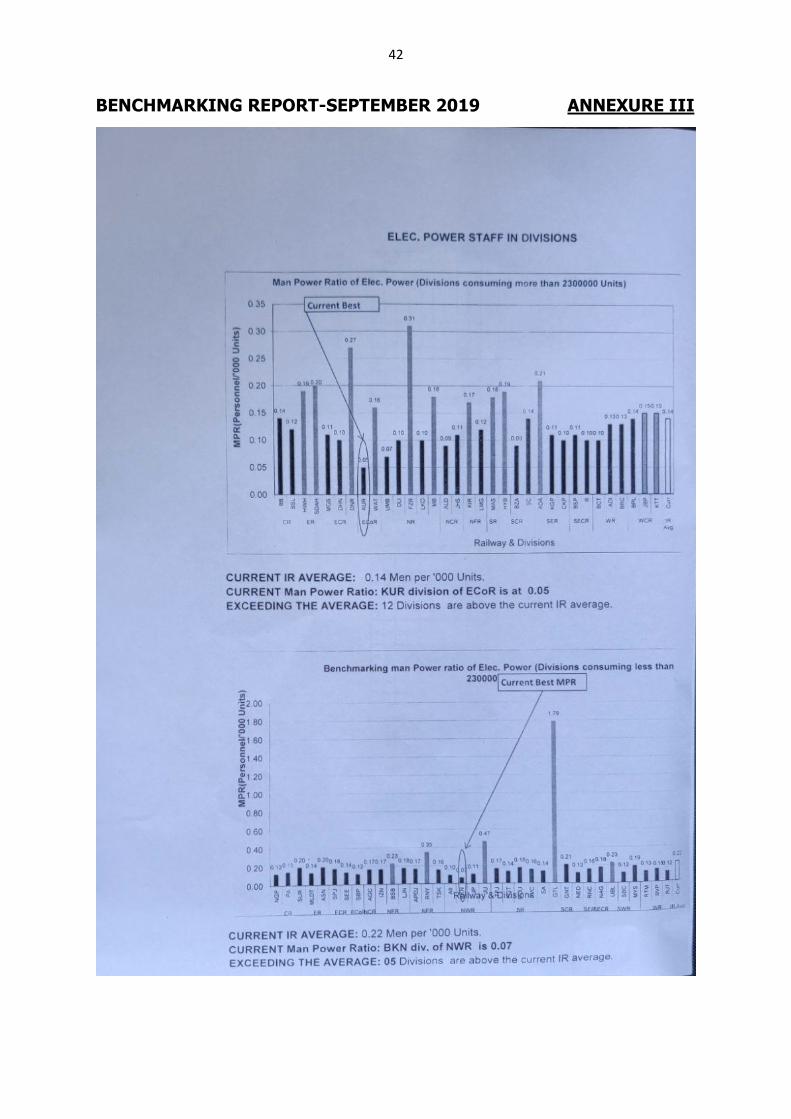
III BENCHMARKING ISSUED BY RAILWAY BOARD FOR THE MONTH OF SEPTEMBER 2019
42
IV CO-ORDINATING OFFICER’S VIEWS 43
1
(i)
ACKNOWLEDGEMENT
The work study team acknowledges its gratitude to DEE/G/TVC, ADEE/G/TVC
(Co-ordinating Officer), SSE/ELEC/HQ/TVC (Co-ordinating Supervisor),
SSE/ELEC/ALLP, KTYM, ERS, ERM, IPN & TCR and all the staff of these sections
for their valuable inputs and guidance in conducting and completing the study
in time.
(ii)
AUTHORITY
Annual programme of work studies, approved by SDGM for the year 2018-19.
(iii)
TERMS OF REFERENCE
To review the staff strength of SSE/POWER/ALLP, KTYM, ERS, ERM, IPN & TCR
sections in Trivandrum Division/S.Rly.
(iv)
METHODOLOGY
The following methodology has been adopted while conducting the study:
1) Collection of data
2) Discussion and interaction with officers of the Division and supervisors
and staff of the unit.
3) Observation at Field Unit.
4) Working out the requirements on need base duly considering
benchmarking, need basis, quantum of outsourcing and
modernization.

2
(V)
SUMMARY OF RECOMMENDATIONS
---NIL----
3
CHAPTER I
1.0 INTRODUCTION
1.1 Electrical Department:
Electrical Department of Indian Railways is responsible for the operation
and maintenance of the Electrical Assets, as well as construction activities
involving electrical installations.
Electrical Rolling Stock: Operation and maintenance of Electrical
Locomotives, Electrical multiple units and Mainline electrical multiple
units.
Electrical Traction Distribution Installations: Operation and Maintenance
of Traction Sub-Stations, Switching stations and Traction overhead power
supply systems and supervisory control and data acquisition systems.
Electrical General Services: Operation and maintenance of Train Lighting
and Air-Conditioning equipment in coaches- Operation and maintenance
of HT & LT Power Distribution, standby generators power backup
systems, lighting, ventilation, Air-Conditioning, Lifts, Escalators and
Pumping in stations, Offices, Workshops, Railway Colonies, Railway
Hospitals, Passenger Reservation Systems, Level Crossings Gates etc.,
In Southern Railway, power supply for Railway Electric Traction is availed
from State Electricity Boards of Tamil Nadu (TANGEDCO), Kerala (KSEB),
Andhra Pradesh (APTRANSCO) and the power supply for General Services
is availed from State Electricity Board of Karnataka (KPTL) also in addition
to the three other State Electricity Boards indicated above.
1.2 One of the main departments of the Indian Railways, Electrical
department shoulders lot of responsibility in proper operation of railway
services. With Railway Electrification on the rise, Electric traction hauls
almost 60% of freight traffic and 48% of passenger traffic.
1.3 The Electrical department is headed Member/Traction (ex officio
Secretary to the Govt. of India) at the Railway Board level. At the Zonal
Level, Principal Chief Electrical Engineer (PCEE) is the Principal Officer of
the Electrical Department. Sr.Divisional Electrical Engineer (Sr.DEE)
heads the organization at the Divisional Level. He is assisted by DEEs
4
(General, Traction Operation, Traction Distribution & Electrical Loco shed)
and ADEEs.
1.4 The department, at the Divisional level is divided into a number of
functional units vested with one or more of the functions of the
department elaborated in the previous paragraphs.
1.5 The units considered for this study, SSE/P/ALLP, KTYM, ERS, ERM, IPN &
TCR of Trivandrum Division, takes care of General Services maintenance
of the assets under its jurisdiction.
1.6 The term Benchmark originates from the chiseled horizonal marks that
surveyors made into which an angle iron could be placed to bracket
(bench) and leveling rod, thus ensuring that the leveling rod can be
repositioned in exactly the same location in future. Bench Marking is also
a point of reference for a measurement. It is the process used in
management in which organization evaluates various aspects of their
process in relation to the best practice usually within their own sector.
1.7 Keeping the above aspects in view, the work study team has made an
attempt to study the present system of working at SSE/POWER/ALLP,
KTYM,ERS, ERM, IPN & TCR Sections of Trivandrum Division, through
Benchmarking and need basis as means of reducing cost and right sizing
the work force. With increased activity of Outsourcing and further growth
of Technology, the work load vs requirement of staff is critically examined
in the ensuing chapters.
5
CHAPTER II
2.0 PRESENT SCENARIO
2.1 Southern Railway has six (6) Divisions namely MAS, MDU, TPJ, PGT, TVC
& SA. Electrical Department of TVC Division is functioning under the
overall control of DEE/G/TVC who is assisted by ADEEs/TVC, SSEs and
Supervisors in extending Co-operation for smooth and efficient
functioning of the Department with sub units/sections. Among the six
Divisions, Trivandrum Division comes under the category of Divisions
consuming less than 23,00,000 Units.
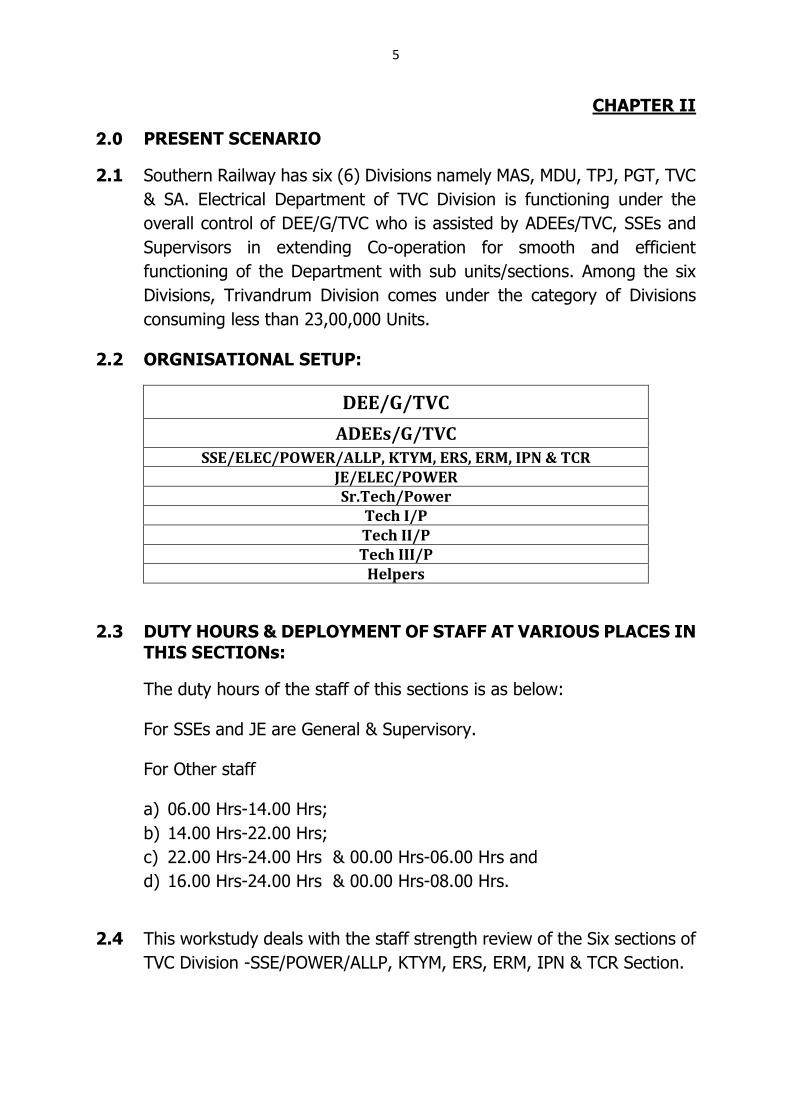
2.2 ORGNISATIONAL SETUP:
DEE/G/TVC
ADEEs/G/TVC SSE/ELEC/POWER/ALLP, KTYM, ERS, ERM, IPN & TCR
JE/ELEC/POWER Sr.Tech/Power
Tech I/P Tech II/P Tech III/P
Helpers
2.3 DUTY HOURS & DEPLOYMENT OF STAFF AT VARIOUS PLACES IN THIS SECTIONs:
The duty hours of the staff of this sections is as below:
For SSEs and JE are General & Supervisory.
For Other staff
a) 06.00 Hrs-14.00 Hrs;
b) 14.00 Hrs-22.00 Hrs;
c) 22.00 Hrs-24.00 Hrs & 00.00 Hrs-06.00 Hrs and
d) 16.00 Hrs-24.00 Hrs & 00.00 Hrs-08.00 Hrs.
2.4 This workstudy deals with the staff strength review of the Six sections of
TVC Division -SSE/POWER/ALLP, KTYM, ERS, ERM, IPN & TCR Section.
6
2.5 SSE/POWER/ALLP SECTION:
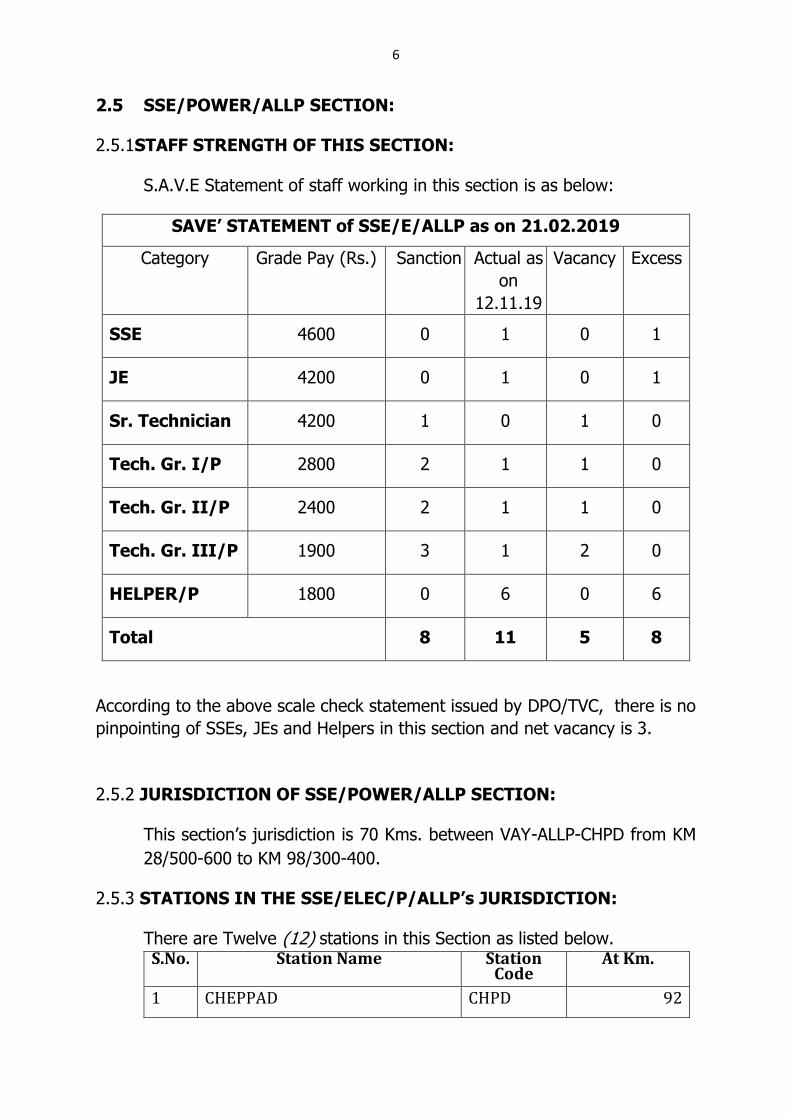
2.5.1STAFF STRENGTH OF THIS SECTION:
S.A.V.E Statement of staff working in this section is as below:
SAVE’ STATEMENT of SSE/E/ALLP as on 21.02.2019
Category Grade Pay (Rs.) Sanction Actual as
on
12.11.19
Vacancy Excess
SSE 4600 0 1 0 1
JE 4200 0 1 0 1
Sr. Technician 4200 1 0 1 0
Tech. Gr. I/P 2800 2 1 1 0
Tech. Gr. II/P 2400 2 1 1 0
Tech. Gr. III/P 1900 3 1 2 0
HELPER/P 1800 0 6 0 6
Total 8 11 5 8
According to the above scale check statement issued by DPO/TVC, there is no
pinpointing of SSEs, JEs and Helpers in this section and net vacancy is 3.
2.5.2 JURISDICTION OF SSE/POWER/ALLP SECTION:
This section’s jurisdiction is 70 Kms. between VAY-ALLP-CHPD from KM
28/500-600 to KM 98/300-400.
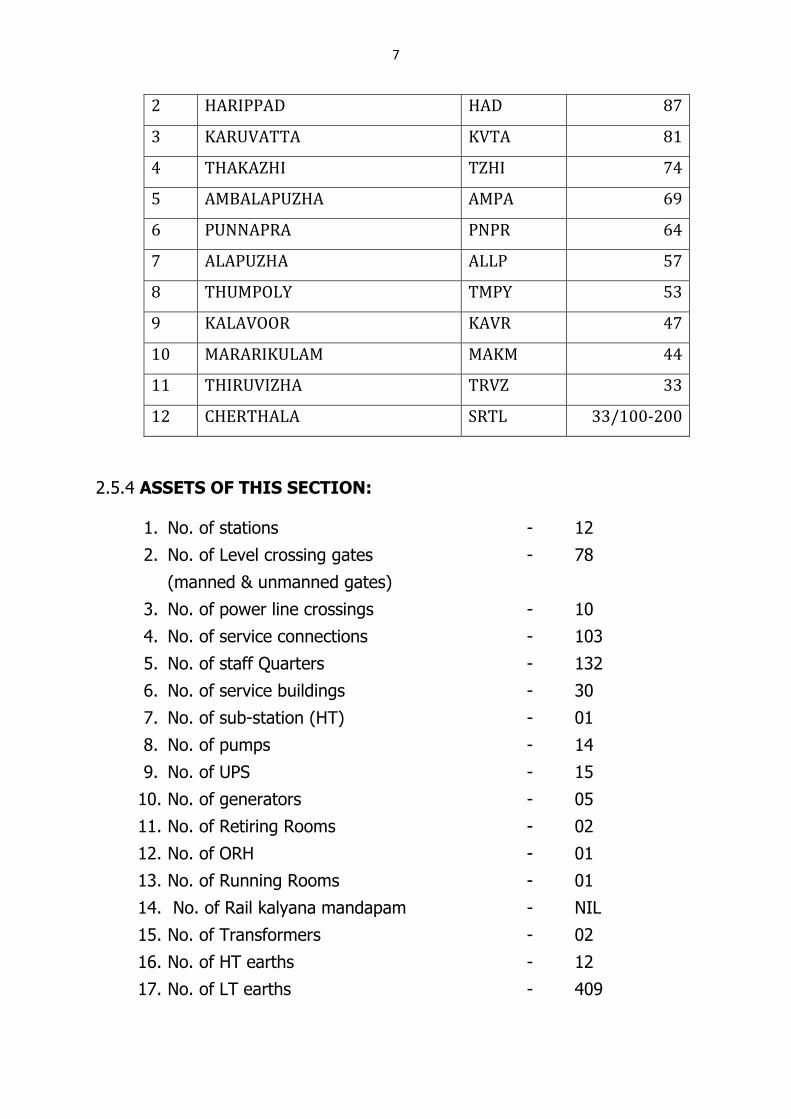
2.5.3 STATIONS IN THE SSE/ELEC/P/ALLP’s JURISDICTION:
There are Twelve (12) stations in this Section as listed below. S.No. Station Name Station
Code At Km.
1 CHEPPAD CHPD 92
7
2 HARIPPAD HAD 87
3 KARUVATTA KVTA 81
4 THAKAZHI TZHI 74
5 AMBALAPUZHA AMPA 69
6 PUNNAPRA PNPR 64
7 ALAPUZHA ALLP 57
8 THUMPOLY TMPY 53
9 KALAVOOR KAVR 47
10 MARARIKULAM MAKM 44
11 THIRUVIZHA TRVZ 33
12 CHERTHALA SRTL 33/100-200
2.5.4 ASSETS OF THIS SECTION:
1. No. of stations - 12
2. No. of Level crossing gates - 78
(manned & unmanned gates)
3. No. of power line crossings - 10
4. No. of service connections - 103
5. No. of staff Quarters - 132
6. No. of service buildings - 30
7. No. of sub-station (HT) - 01
8. No. of pumps - 14
9. No. of UPS - 15
10. No. of generators - 05
11. No. of Retiring Rooms - 02
12. No. of ORH - 01
13. No. of Running Rooms - 01
14. No. of Rail kalyana mandapam - NIL
15. No. of Transformers - 02
16. No. of HT earths - 12
17. No. of LT earths - 409
8
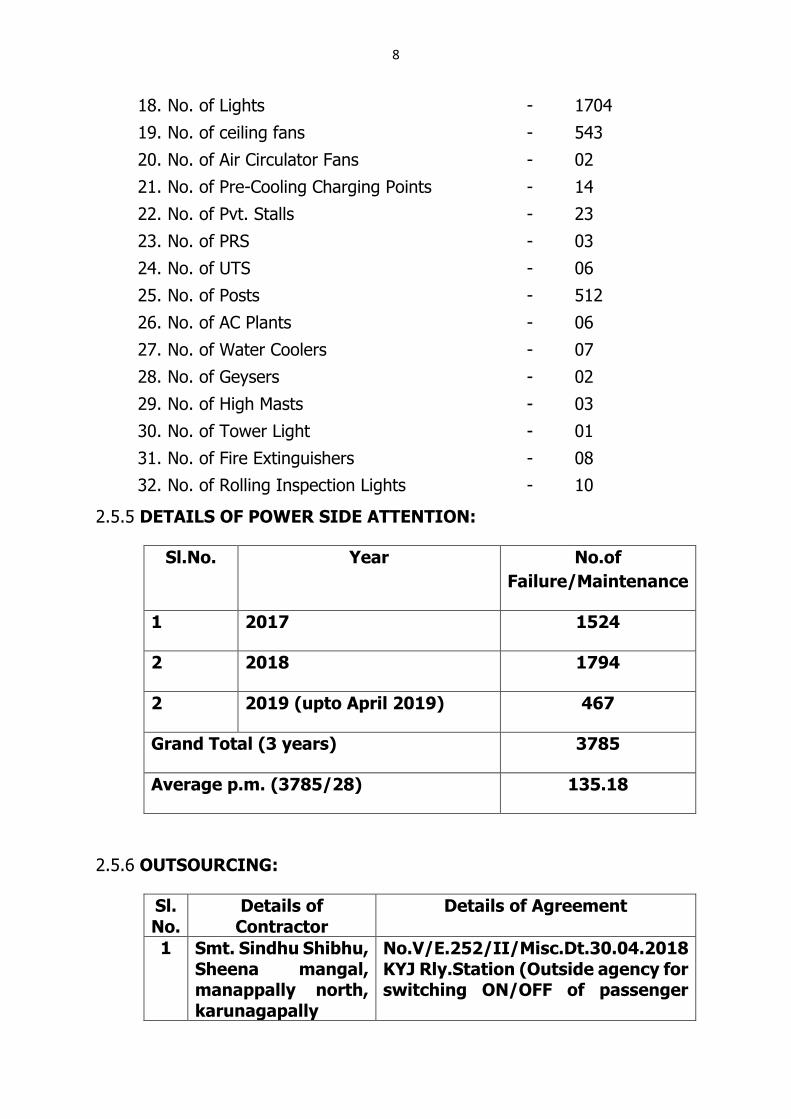
18. No. of Lights - 1704
19. No. of ceiling fans - 543
20. No. of Air Circulator Fans - 02
21. No. of Pre-Cooling Charging Points - 14
22. No. of Pvt. Stalls - 23
23. No. of PRS - 03
24. No. of UTS - 06
25. No. of Posts - 512
26. No. of AC Plants - 06
27. No. of Water Coolers - 07
28. No. of Geysers - 02
29. No. of High Masts - 03
30. No. of Tower Light - 01
31. No. of Fire Extinguishers - 08
32. No. of Rolling Inspection Lights - 10
2.5.5 DETAILS OF POWER SIDE ATTENTION:
Sl.No. Year No.of
Failure/Maintenance
1 2017 1524
2 2018 1794
2 2019 (upto April 2019) 467
Grand Total (3 years) 3785
Average p.m. (3785/28) 135.18
2.5.6 OUTSOURCING:
Sl. No.
Details of Contractor
Details of Agreement
1 Smt. Sindhu Shibhu, Sheena mangal, manappally north, karunagapally
No.V/E.252/II/Misc.Dt.30.04.2018 KYJ Rly.Station (Outside agency for switching ON/OFF of passenger

9
rake originating from KYJ Rly.Station)
2 M/s Diesel Engineering Works, Tripunithura, Eroor South P.O.
No.V/E.29/II/ACM/DG/ERM & ALLP dt. 03.09.2018 (AMC for Diesel Generator Set)
2.6 SSE/POWER/KTYM SECTION:
2.6.1 STAFF STRENGTH OF THIS SECTION:
S.A.V.E Statement of staff working in this section is as below:
SAVE’ STATEMENT of SSE/E/KTYM as on 21.02.2019
Category Grade Pay (Rs.) Sanction Actual as
on
12.11.19
Vacancy Excess
SSE 4600 0 1 0 1
JE 4200 0 1 0 1
Sr. Technician 4200 2 2 0 0
Tech. Gr. I/P 2800 2 0 2 0
Tech. Gr. II/P 2400 1 2 0 1
Tech. Gr. III/P 1900 2 3 0 1
HELPER/P 1800 0 2 0 2
Total 7 11 2 6
According to the above scale check statement issued by DPO/TVC, there
is no pinpointing of SSEs, JEs and Helpers in this section.
2.6.2 JURISDICTION OF SSE/POWER/KTYM SECTION:
This section’s jurisdiction is 72 Kms. between ERS-KTYM-QLN from KM
9/700 to KM 81/800-900.
10
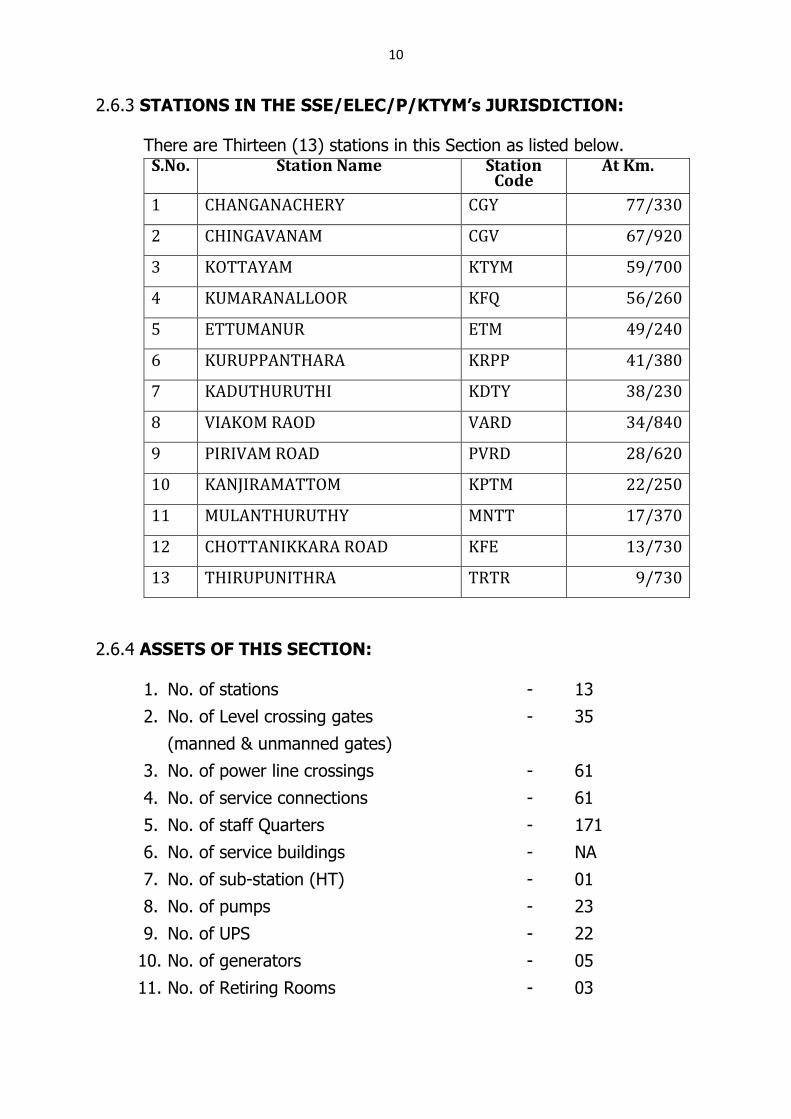
2.6.3 STATIONS IN THE SSE/ELEC/P/KTYM’s JURISDICTION:
There are Thirteen (13) stations in this Section as listed below. S.No. Station Name Station
Code At Km.
1 CHANGANACHERY CGY 77/330
2 CHINGAVANAM CGV 67/920
3 KOTTAYAM KTYM 59/700
4 KUMARANALLOOR KFQ 56/260
5 ETTUMANUR ETM 49/240
6 KURUPPANTHARA KRPP 41/380
7 KADUTHURUTHI KDTY 38/230
8 VIAKOM RAOD VARD 34/840
9 PIRIVAM ROAD PVRD 28/620
10 KANJIRAMATTOM KPTM 22/250
11 MULANTHURUTHY MNTT 17/370
12 CHOTTANIKKARA ROAD KFE 13/730
13 THIRUPUNITHRA TRTR 9/730
2.6.4 ASSETS OF THIS SECTION:
1. No. of stations - 13
2. No. of Level crossing gates - 35
(manned & unmanned gates)
3. No. of power line crossings - 61
4. No. of service connections - 61
5. No. of staff Quarters - 171
6. No. of service buildings - NA
7. No. of sub-station (HT) - 01
8. No. of pumps - 23
9. No. of UPS - 22
10. No. of generators - 05
11. No. of Retiring Rooms - 03
11
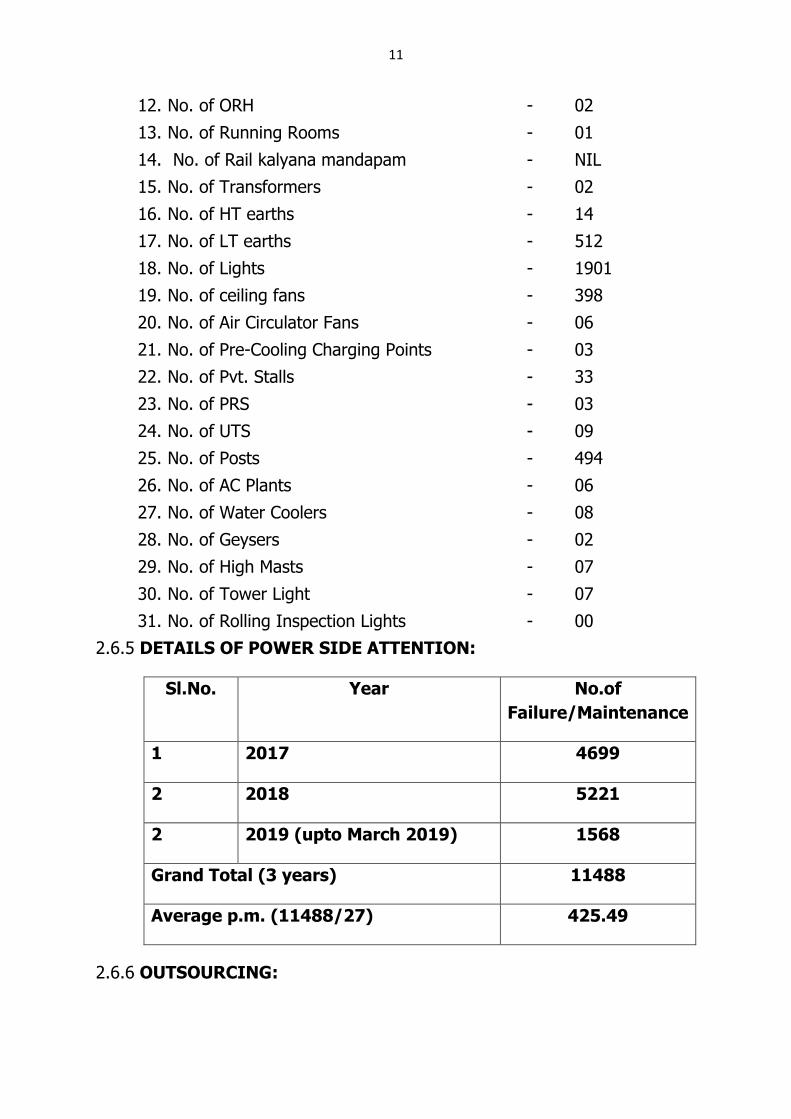
12. No. of ORH - 02
13. No. of Running Rooms - 01
14. No. of Rail kalyana mandapam - NIL
15. No. of Transformers - 02
16. No. of HT earths - 14
17. No. of LT earths - 512
18. No. of Lights - 1901
19. No. of ceiling fans - 398
20. No. of Air Circulator Fans - 06
21. No. of Pre-Cooling Charging Points - 03
22. No. of Pvt. Stalls - 33
23. No. of PRS - 03
24. No. of UTS - 09
25. No. of Posts - 494
26. No. of AC Plants - 06
27. No. of Water Coolers - 08
28. No. of Geysers - 02
29. No. of High Masts - 07
30. No. of Tower Light - 07
31. No. of Rolling Inspection Lights - 00
2.6.5 DETAILS OF POWER SIDE ATTENTION:
Sl.No. Year No.of
Failure/Maintenance
1 2017 4699
2 2018 5221
2 2019 (upto March 2019) 1568
Grand Total (3 years) 11488
Average p.m. (11488/27) 425.49
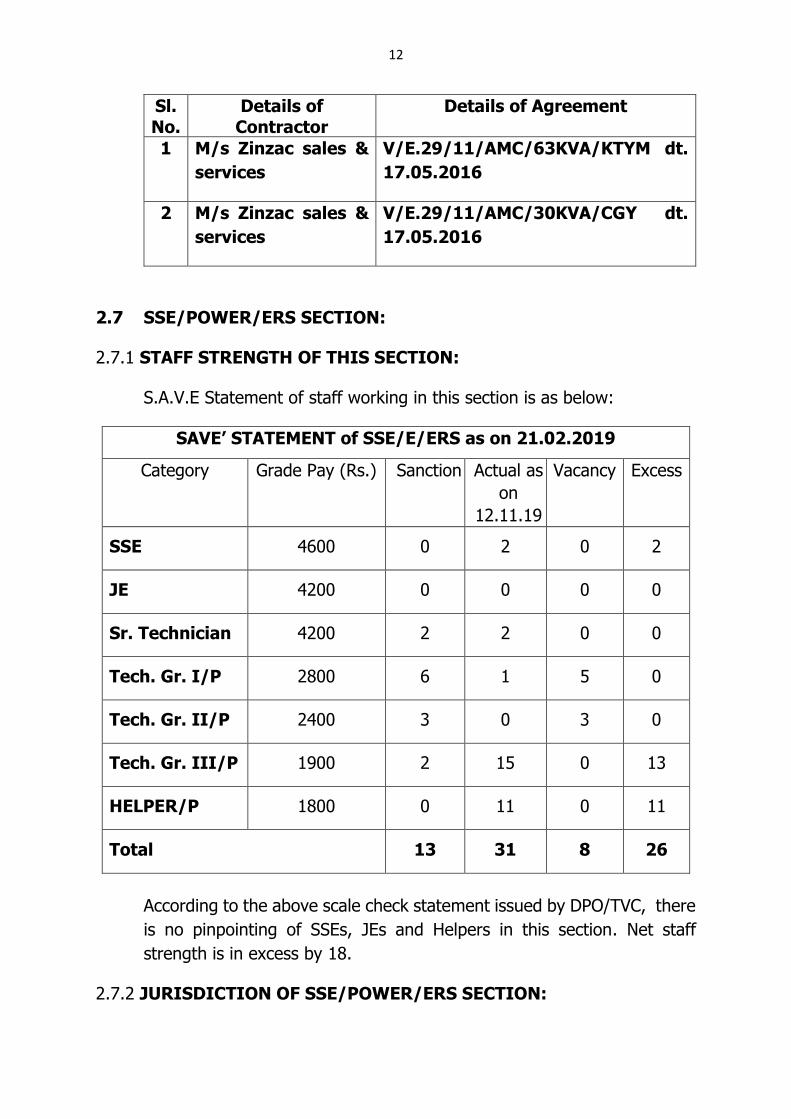
2.6.6 OUTSOURCING:
12
Sl. No.
Details of Contractor
Details of Agreement
1 M/s Zinzac sales &
services
V/E.29/11/AMC/63KVA/KTYM dt.
17.05.2016
2 M/s Zinzac sales &
services
V/E.29/11/AMC/30KVA/CGY dt.
17.05.2016
2.7 SSE/POWER/ERS SECTION:
2.7.1 STAFF STRENGTH OF THIS SECTION:
S.A.V.E Statement of staff working in this section is as below:
SAVE’ STATEMENT of SSE/E/ERS as on 21.02.2019
Category Grade Pay (Rs.) Sanction Actual as
on
12.11.19
Vacancy Excess
SSE 4600 0 2 0 2
JE 4200 0 0 0 0
Sr. Technician 4200 2 2 0 0
Tech. Gr. I/P 2800 6 1 5 0
Tech. Gr. II/P 2400 3 0 3 0
Tech. Gr. III/P 1900 2 15 0 13
HELPER/P 1800 0 11 0 11
Total 13 31 8 26
According to the above scale check statement issued by DPO/TVC, there
is no pinpointing of SSEs, JEs and Helpers in this section. Net staff
strength is in excess by 18.
2.7.2 JURISDICTION OF SSE/POWER/ERS SECTION:
13
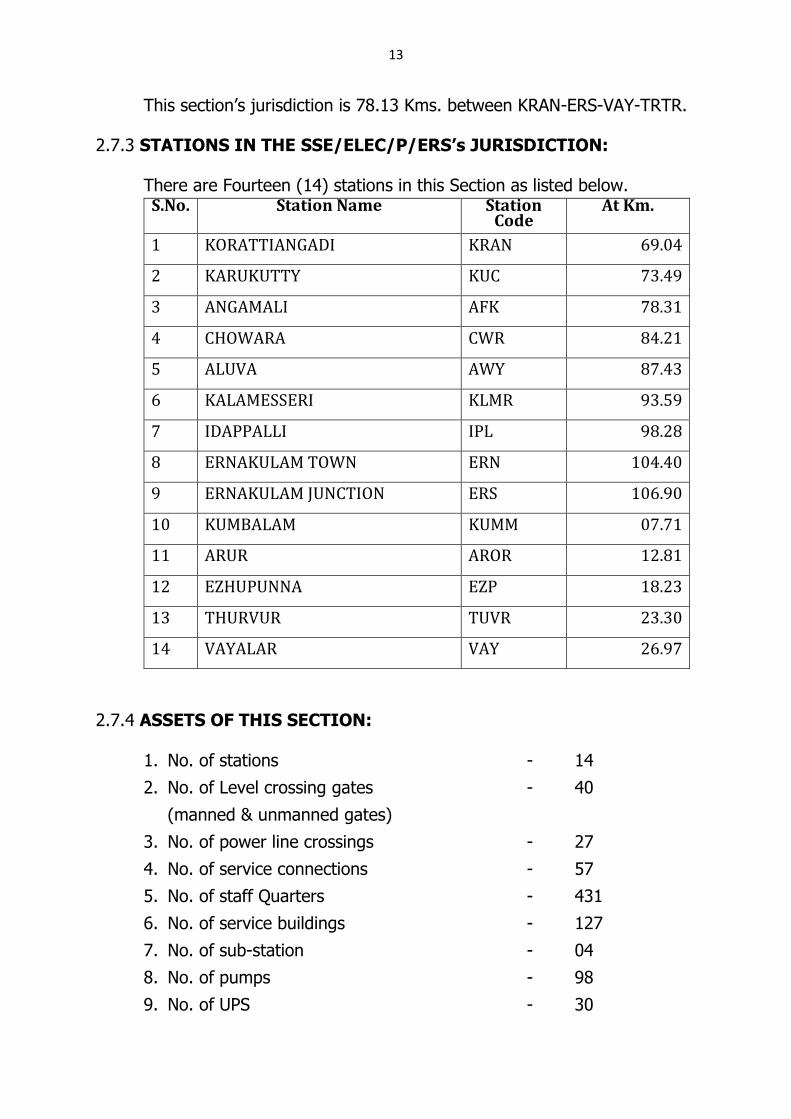
This section’s jurisdiction is 78.13 Kms. between KRAN-ERS-VAY-TRTR.
2.7.3 STATIONS IN THE SSE/ELEC/P/ERS’s JURISDICTION:
There are Fourteen (14) stations in this Section as listed below. S.No. Station Name Station
Code At Km.
1 KORATTIANGADI KRAN 69.04
2 KARUKUTTY KUC 73.49
3 ANGAMALI AFK 78.31
4 CHOWARA CWR 84.21
5 ALUVA AWY 87.43
6 KALAMESSERI KLMR 93.59
7 IDAPPALLI IPL 98.28
8 ERNAKULAM TOWN ERN 104.40
9 ERNAKULAM JUNCTION ERS 106.90
10 KUMBALAM KUMM 07.71
11 ARUR AROR 12.81
12 EZHUPUNNA EZP 18.23
13 THURVUR TUVR 23.30
14 VAYALAR VAY 26.97
2.7.4 ASSETS OF THIS SECTION:
1. No. of stations - 14
2. No. of Level crossing gates - 40
(manned & unmanned gates)
3. No. of power line crossings - 27
4. No. of service connections - 57
5. No. of staff Quarters - 431
6. No. of service buildings - 127
7. No. of sub-station - 04
8. No. of pumps - 98
9. No. of UPS - 30
14
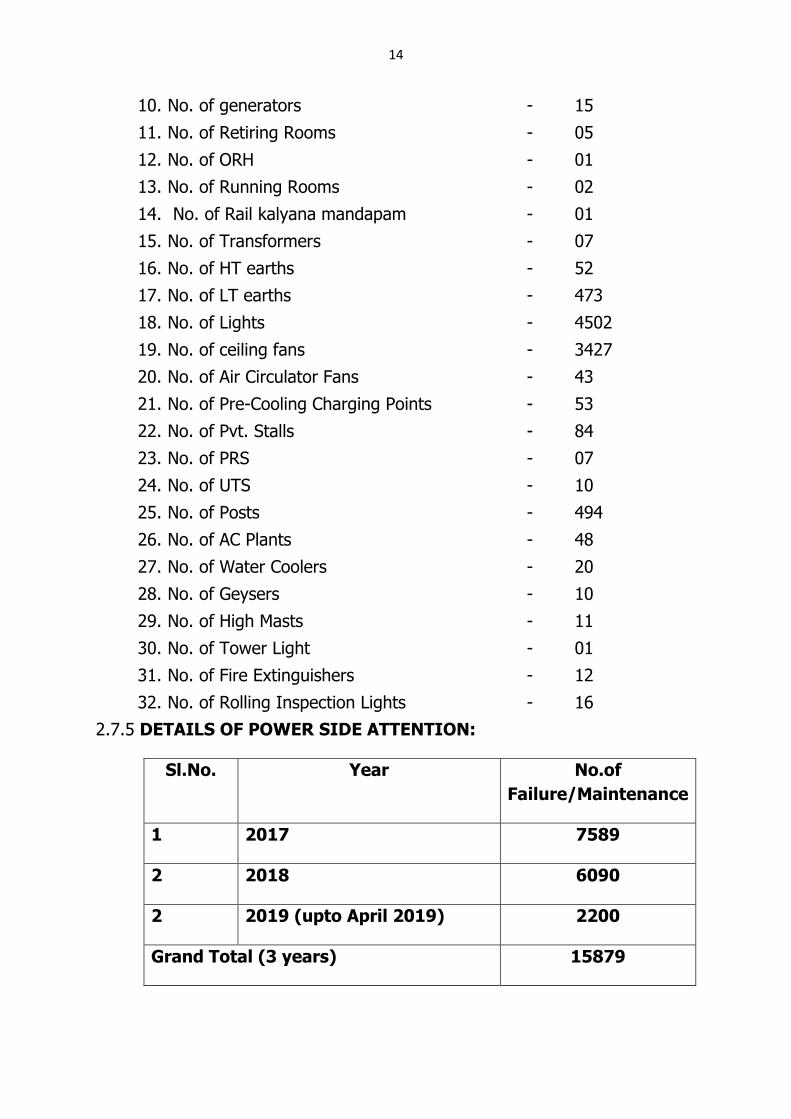
10. No. of generators - 15
11. No. of Retiring Rooms - 05
12. No. of ORH - 01
13. No. of Running Rooms - 02
14. No. of Rail kalyana mandapam - 01
15. No. of Transformers - 07
16. No. of HT earths - 52
17. No. of LT earths - 473
18. No. of Lights - 4502
19. No. of ceiling fans - 3427
20. No. of Air Circulator Fans - 43
21. No. of Pre-Cooling Charging Points - 53
22. No. of Pvt. Stalls - 84
23. No. of PRS - 07
24. No. of UTS - 10
25. No. of Posts - 494
26. No. of AC Plants - 48
27. No. of Water Coolers - 20
28. No. of Geysers - 10
29. No. of High Masts - 11
30. No. of Tower Light - 01
31. No. of Fire Extinguishers - 12
32. No. of Rolling Inspection Lights - 16
2.7.5 DETAILS OF POWER SIDE ATTENTION:
Sl.No. Year No.of
Failure/Maintenance
1 2017 7589
2 2018 6090
2 2019 (upto April 2019) 2200
Grand Total (3 years) 15879
15
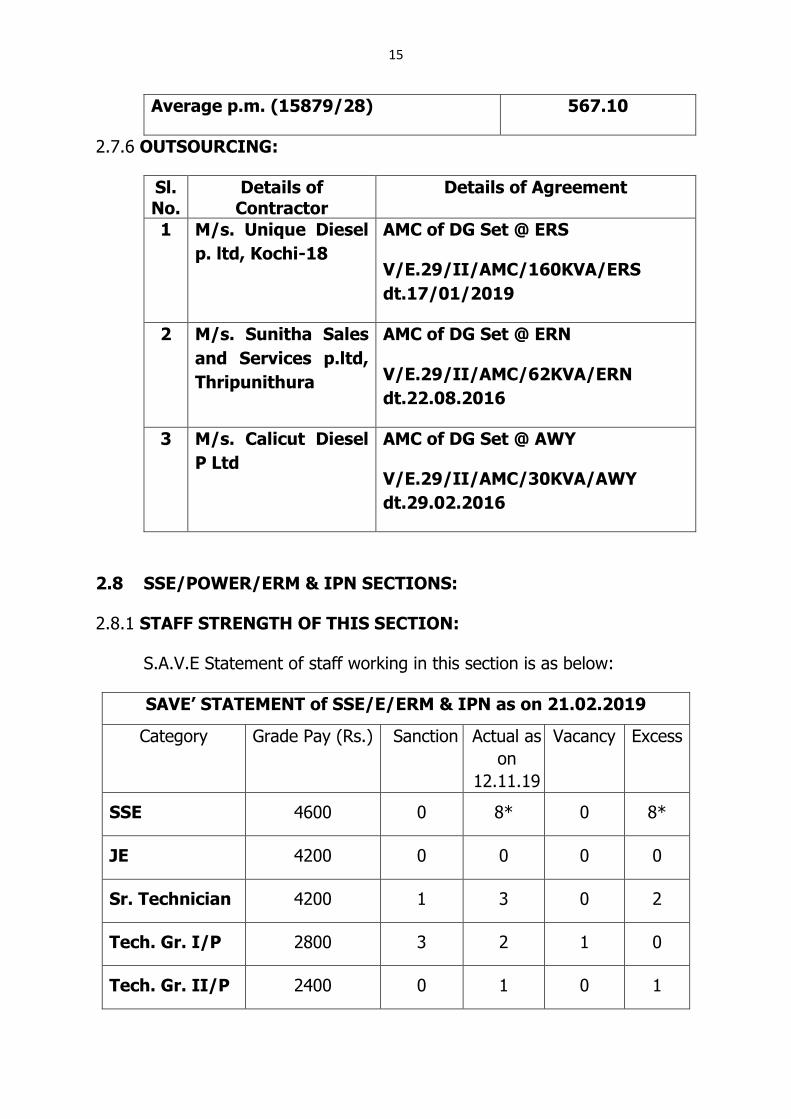
Average p.m. (15879/28) 567.10
2.7.6 OUTSOURCING:
Sl. No.
Details of Contractor
Details of Agreement
1 M/s. Unique Diesel
p. ltd, Kochi-18
AMC of DG Set @ ERS
V/E.29/II/AMC/160KVA/ERS
dt.17/01/2019
2 M/s. Sunitha Sales
and Services p.ltd,
Thripunithura
AMC of DG Set @ ERN
V/E.29/II/AMC/62KVA/ERN
dt.22.08.2016
3 M/s. Calicut Diesel
P Ltd
AMC of DG Set @ AWY
V/E.29/II/AMC/30KVA/AWY
dt.29.02.2016
2.8 SSE/POWER/ERM & IPN SECTIONS:
2.8.1 STAFF STRENGTH OF THIS SECTION:
S.A.V.E Statement of staff working in this section is as below:
SAVE’ STATEMENT of SSE/E/ERM & IPN as on 21.02.2019
Category Grade Pay (Rs.) Sanction Actual as
on
12.11.19
Vacancy Excess
SSE 4600 0 8* 0 8*
JE 4200 0 0 0 0
Sr. Technician 4200 1 3 0 2
Tech. Gr. I/P 2800 3 2 1 0
Tech. Gr. II/P 2400 0 1 0 1
16
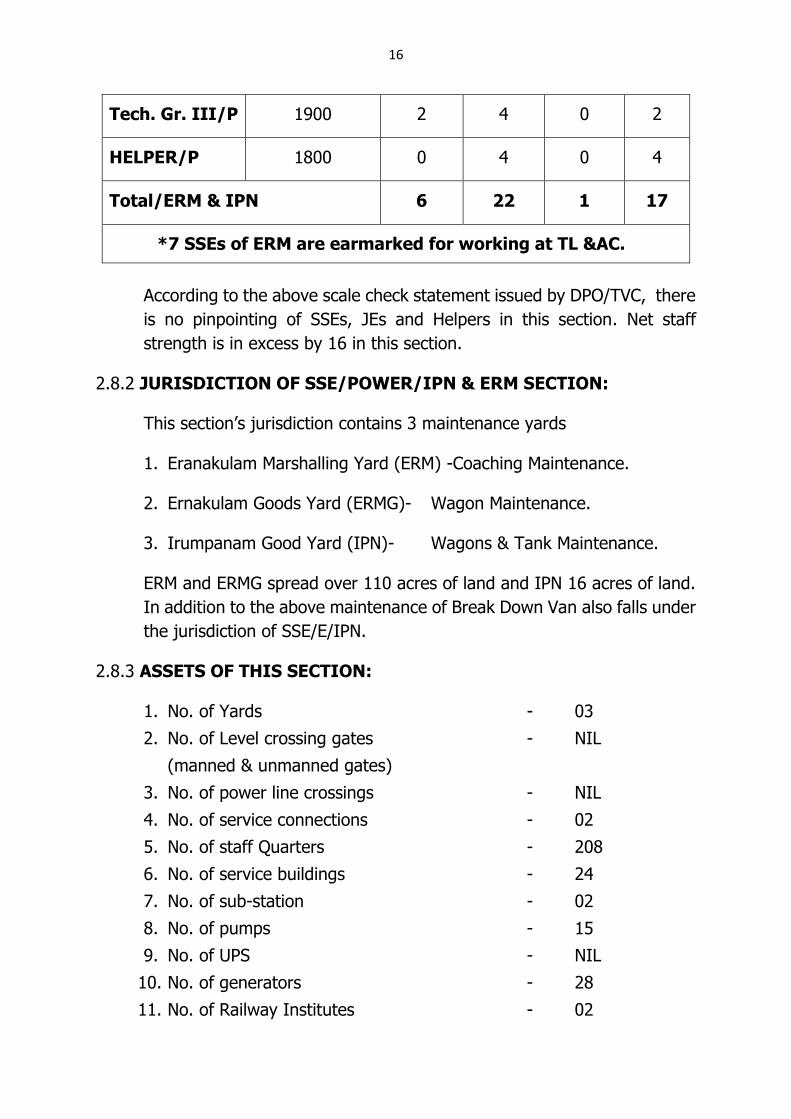
Tech. Gr. III/P 1900 2 4 0 2
HELPER/P 1800 0 4 0 4
Total/ERM & IPN 6 22 1 17
*7 SSEs of ERM are earmarked for working at TL &AC.
According to the above scale check statement issued by DPO/TVC, there
is no pinpointing of SSEs, JEs and Helpers in this section. Net staff
strength is in excess by 16 in this section.
2.8.2 JURISDICTION OF SSE/POWER/IPN & ERM SECTION:
This section’s jurisdiction contains 3 maintenance yards
1. Eranakulam Marshalling Yard (ERM) -Coaching Maintenance.
2. Ernakulam Goods Yard (ERMG)- Wagon Maintenance.
3. Irumpanam Good Yard (IPN)- Wagons & Tank Maintenance.
ERM and ERMG spread over 110 acres of land and IPN 16 acres of land.
In addition to the above maintenance of Break Down Van also falls under
the jurisdiction of SSE/E/IPN.
2.8.3 ASSETS OF THIS SECTION:
1. No. of Yards - 03
2. No. of Level crossing gates - NIL
(manned & unmanned gates)
3. No. of power line crossings - NIL
4. No. of service connections - 02
5. No. of staff Quarters - 208
6. No. of service buildings - 24
7. No. of sub-station - 02
8. No. of pumps - 15
9. No. of UPS - NIL
10. No. of generators - 28
11. No. of Railway Institutes - 02
17
12. No. of Transformers - 04
13. No. of HT earths - 22
14. No. of LT earths - 291
15. No. of Lights - 1851
16. No. of ceiling fans - 717
17. No. of Pre-Cooling Charging Points - 15
18. No. of Battery Chargers - 10
19. No. of Posts - 494
20. No. of AC Plants - nil
21. No. of Water Coolers - 04
22. No. of Geysers - nil
23. No. of High Masts - nil
24. No. of Tower Light - 27
25. No. of Fire Extinguishers - 10
26. No. of Rolling Inspection Lights - nil
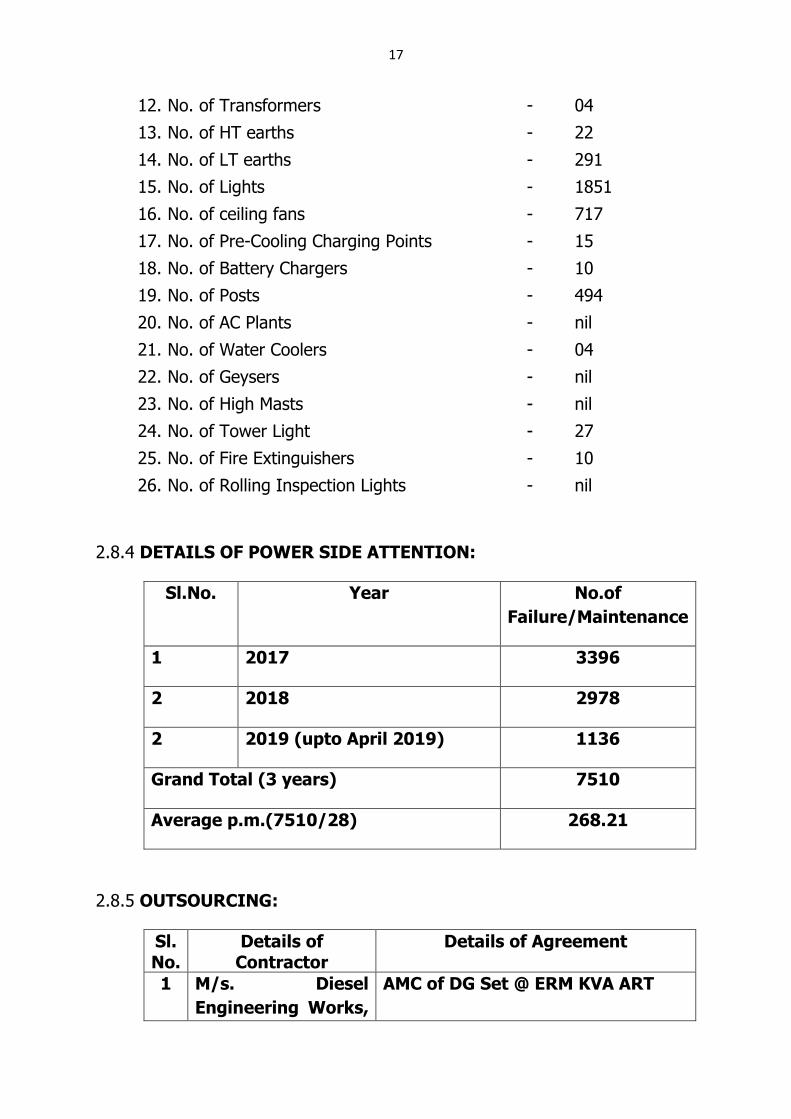
2.8.4 DETAILS OF POWER SIDE ATTENTION:
Sl.No. Year No.of
Failure/Maintenance
1 2017 3396
2 2018 2978
2 2019 (upto April 2019) 1136
Grand Total (3 years) 7510
Average p.m.(7510/28) 268.21
2.8.5 OUTSOURCING:
Sl. No.
Details of Contractor
Details of Agreement
1 M/s. Diesel
Engineering Works,
AMC of DG Set @ ERM KVA ART
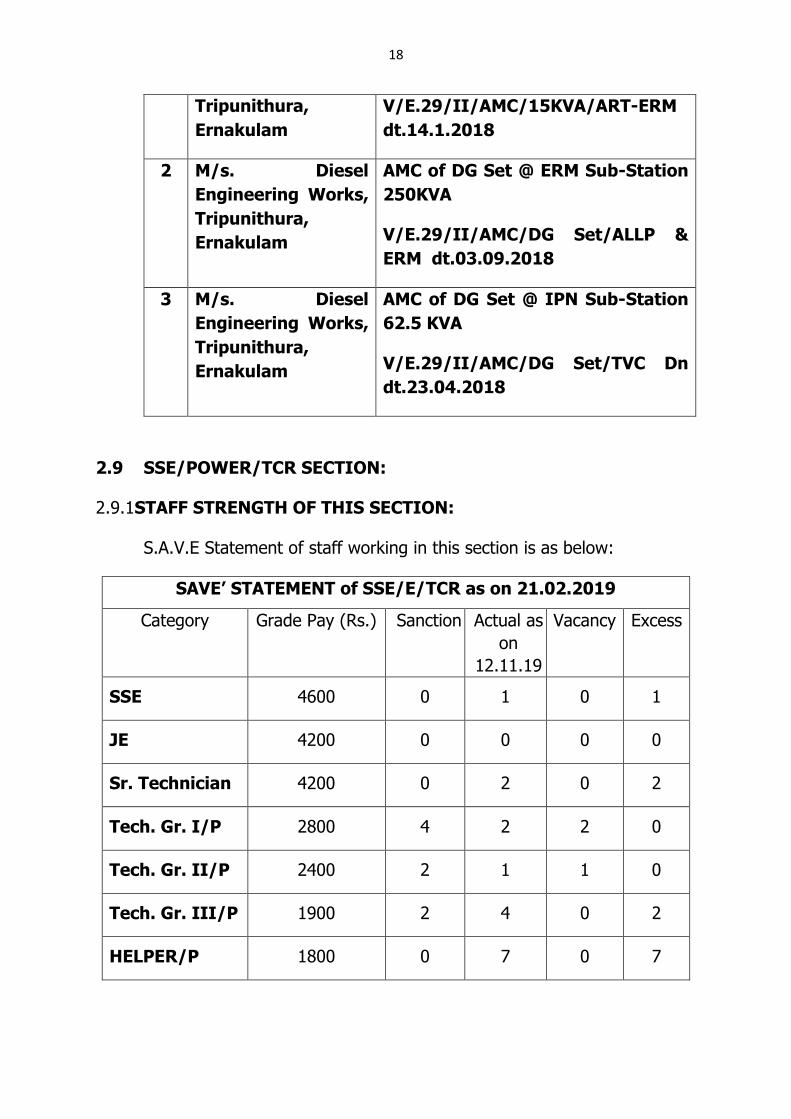
18
Tripunithura,
Ernakulam
V/E.29/II/AMC/15KVA/ART-ERM
dt.14.1.2018
2 M/s. Diesel
Engineering Works,
Tripunithura,
Ernakulam
AMC of DG Set @ ERM Sub-Station
250KVA
V/E.29/II/AMC/DG Set/ALLP &
ERM dt.03.09.2018
3 M/s. Diesel
Engineering Works,
Tripunithura,
Ernakulam
AMC of DG Set @ IPN Sub-Station
62.5 KVA
V/E.29/II/AMC/DG Set/TVC Dn
dt.23.04.2018
2.9 SSE/POWER/TCR SECTION:
2.9.1STAFF STRENGTH OF THIS SECTION:
S.A.V.E Statement of staff working in this section is as below:
SAVE’ STATEMENT of SSE/E/TCR as on 21.02.2019
Category Grade Pay (Rs.) Sanction Actual as
on
12.11.19
Vacancy Excess
SSE 4600 0 1 0 1
JE 4200 0 0 0 0
Sr. Technician 4200 0 2 0 2
Tech. Gr. I/P 2800 4 2 2 0
Tech. Gr. II/P 2400 2 1 1 0
Tech. Gr. III/P 1900 2 4 0 2
HELPER/P 1800 0 7 0 7
19
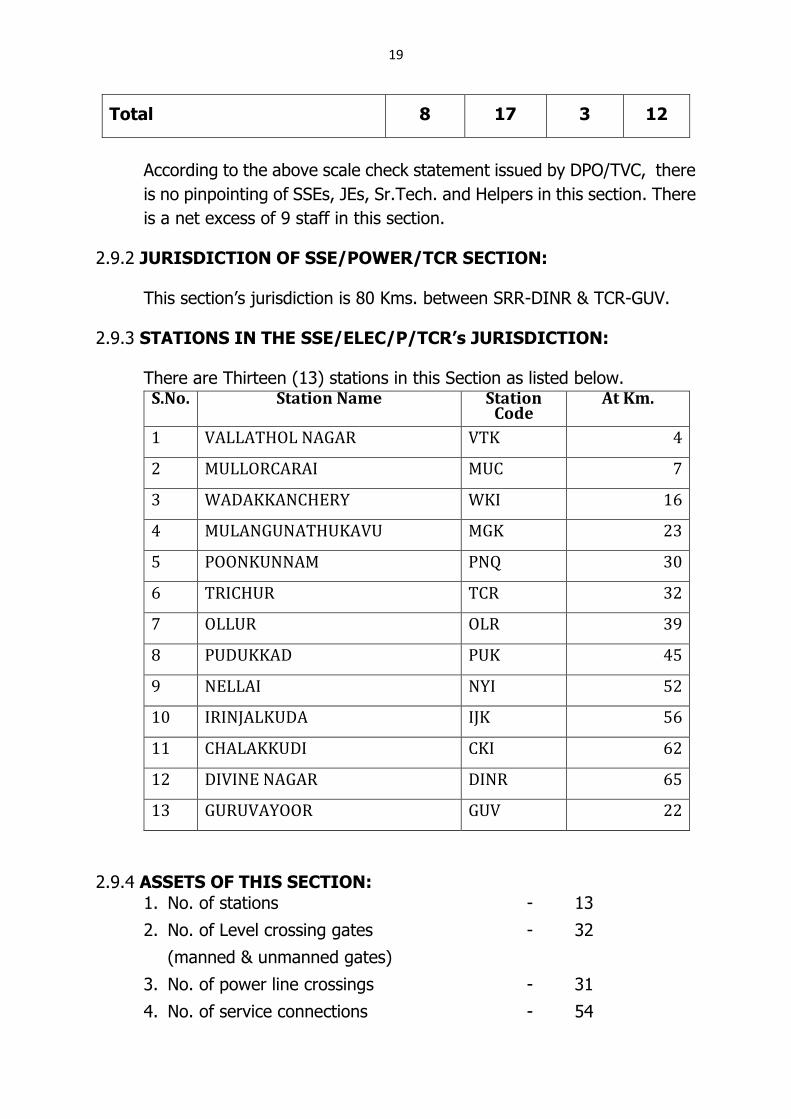
Total 8 17 3 12
According to the above scale check statement issued by DPO/TVC, there
is no pinpointing of SSEs, JEs, Sr.Tech. and Helpers in this section. There
is a net excess of 9 staff in this section.
2.9.2 JURISDICTION OF SSE/POWER/TCR SECTION:
This section’s jurisdiction is 80 Kms. between SRR-DINR & TCR-GUV.
2.9.3 STATIONS IN THE SSE/ELEC/P/TCR’s JURISDICTION:
There are Thirteen (13) stations in this Section as listed below. S.No. Station Name Station
Code At Km.
1 VALLATHOL NAGAR VTK 4
2 MULLORCARAI MUC 7
3 WADAKKANCHERY WKI 16
4 MULANGUNATHUKAVU MGK 23
5 POONKUNNAM PNQ 30
6 TRICHUR TCR 32
7 OLLUR OLR 39
8 PUDUKKAD PUK 45
9 NELLAI NYI 52
10 IRINJALKUDA IJK 56
11 CHALAKKUDI CKI 62
12 DIVINE NAGAR DINR 65
13 GURUVAYOOR GUV 22
2.9.4 ASSETS OF THIS SECTION: 1. No. of stations - 13
2. No. of Level crossing gates - 32
(manned & unmanned gates)
3. No. of power line crossings - 31
4. No. of service connections - 54
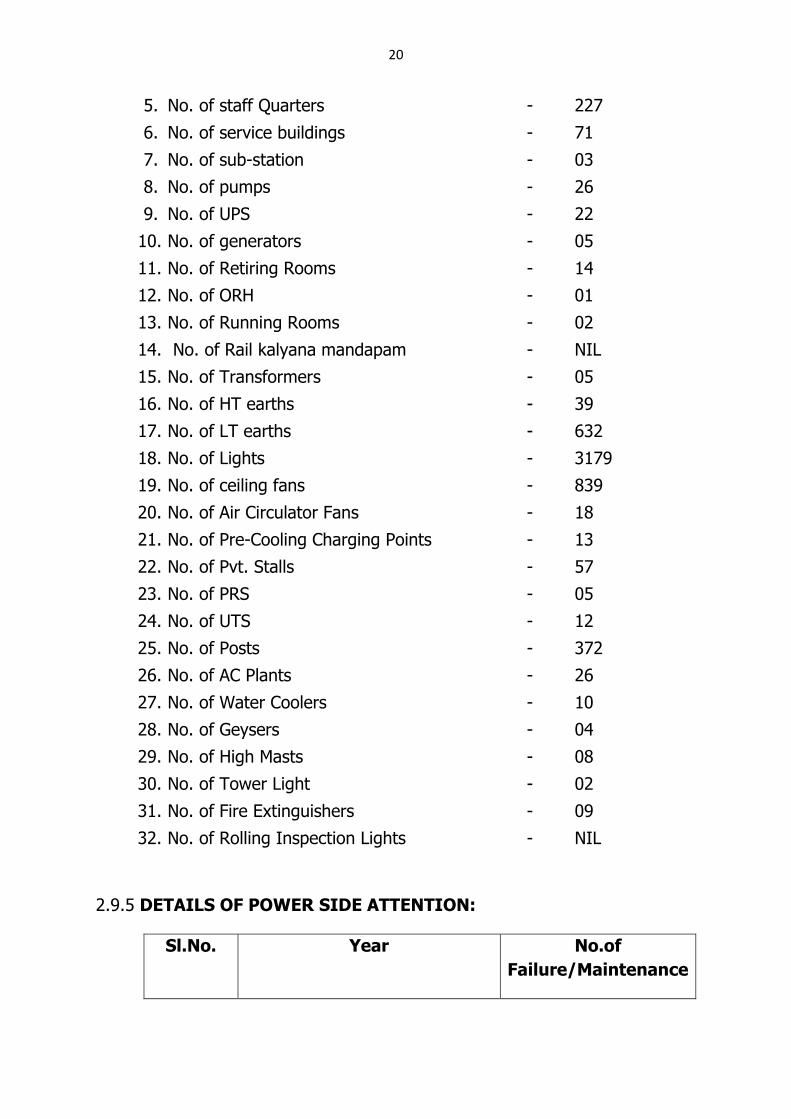
20
5. No. of staff Quarters - 227
6. No. of service buildings - 71
7. No. of sub-station - 03
8. No. of pumps - 26
9. No. of UPS - 22
10. No. of generators - 05
11. No. of Retiring Rooms - 14
12. No. of ORH - 01
13. No. of Running Rooms - 02
14. No. of Rail kalyana mandapam - NIL
15. No. of Transformers - 05
16. No. of HT earths - 39
17. No. of LT earths - 632
18. No. of Lights - 3179
19. No. of ceiling fans - 839
20. No. of Air Circulator Fans - 18
21. No. of Pre-Cooling Charging Points - 13
22. No. of Pvt. Stalls - 57
23. No. of PRS - 05
24. No. of UTS - 12
25. No. of Posts - 372
26. No. of AC Plants - 26
27. No. of Water Coolers - 10
28. No. of Geysers - 04
29. No. of High Masts - 08
30. No. of Tower Light - 02
31. No. of Fire Extinguishers - 09
32. No. of Rolling Inspection Lights - NIL
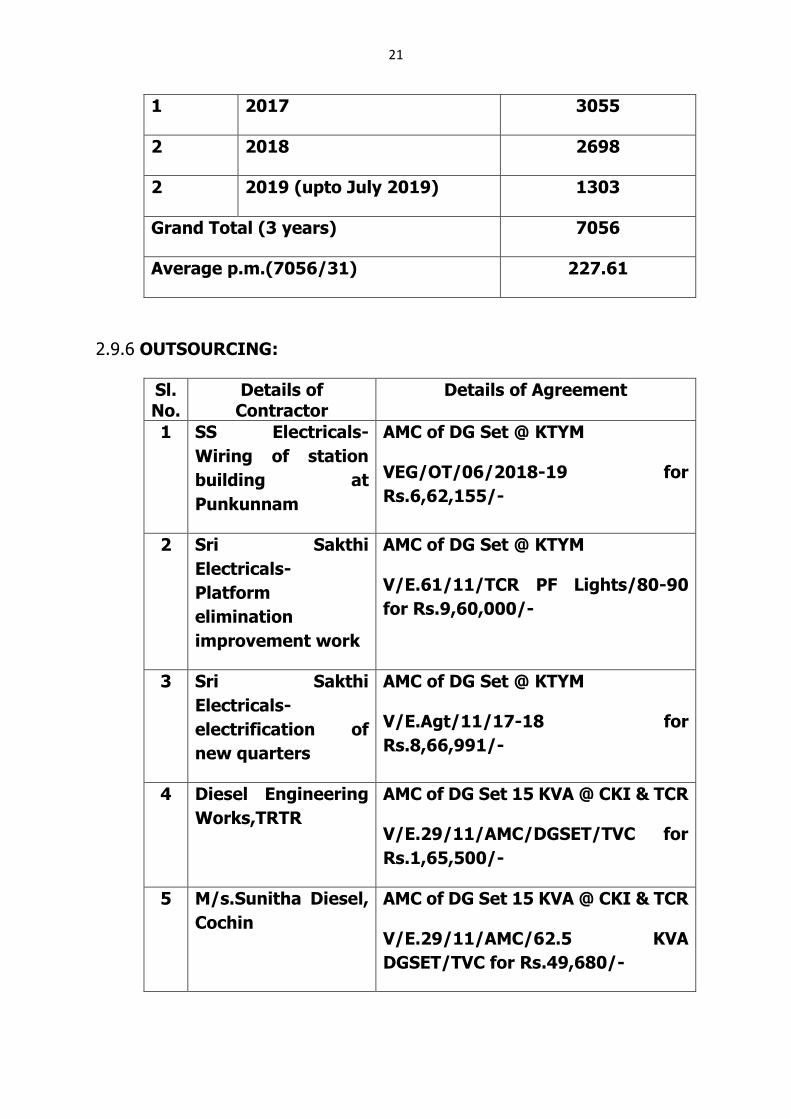
2.9.5 DETAILS OF POWER SIDE ATTENTION:
Sl.No. Year No.of
Failure/Maintenance
21
1 2017 3055
2 2018 2698
2 2019 (upto July 2019) 1303
Grand Total (3 years) 7056
Average p.m.(7056/31) 227.61
2.9.6 OUTSOURCING:
Sl. No.
Details of Contractor
Details of Agreement
1 SS Electricals-
Wiring of station
building at
Punkunnam
AMC of DG Set @ KTYM
VEG/OT/06/2018-19 for
Rs.6,62,155/-
2 Sri Sakthi
Electricals-
Platform
elimination
improvement work
AMC of DG Set @ KTYM
V/E.61/11/TCR PF Lights/80-90
for Rs.9,60,000/-
3 Sri Sakthi
Electricals-
electrification of
new quarters
AMC of DG Set @ KTYM
V/E.Agt/11/17-18 for
Rs.8,66,991/-
4 Diesel Engineering
Works,TRTR
AMC of DG Set 15 KVA @ CKI & TCR
V/E.29/11/AMC/DGSET/TVC for
Rs.1,65,500/-
5 M/s.Sunitha Diesel,
Cochin
AMC of DG Set 15 KVA @ CKI & TCR
V/E.29/11/AMC/62.5 KVA
DGSET/TVC for Rs.49,680/-
22
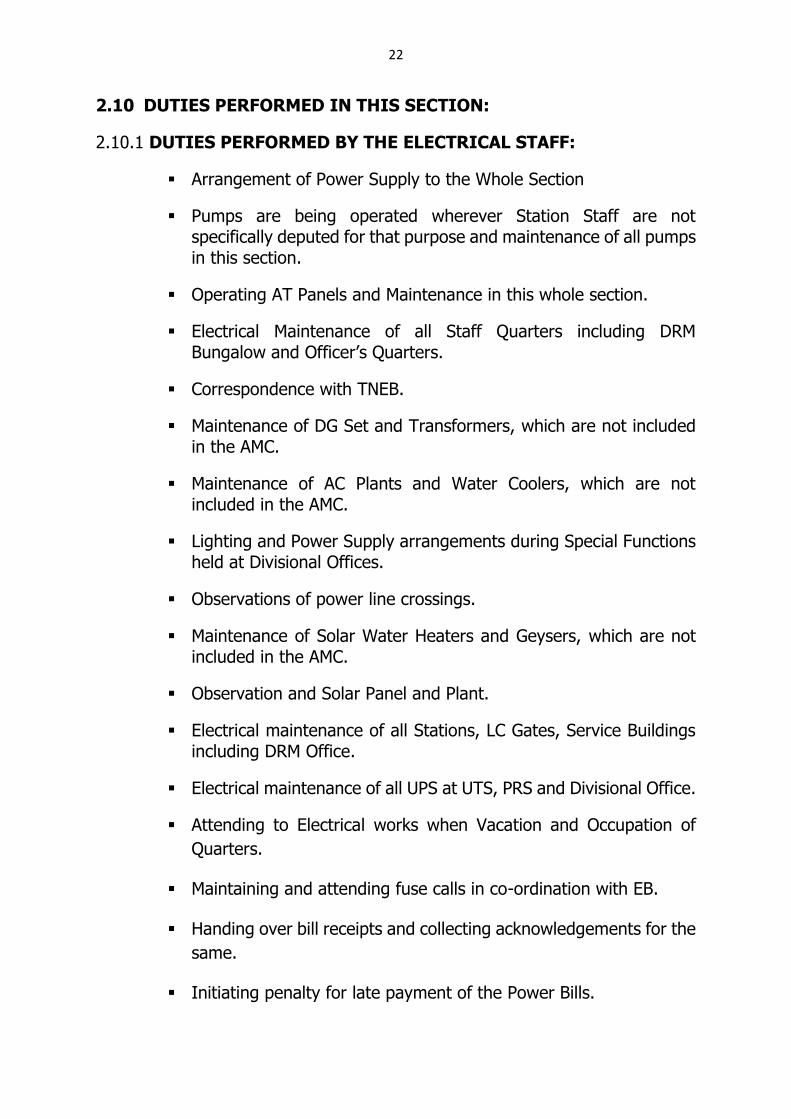
2.10 DUTIES PERFORMED IN THIS SECTION:
2.10.1 DUTIES PERFORMED BY THE ELECTRICAL STAFF:
▪ Arrangement of Power Supply to the Whole Section
▪ Pumps are being operated wherever Station Staff are not specifically deputed for that purpose and maintenance of all pumps in this section.
▪ Operating AT Panels and Maintenance in this whole section.
▪ Electrical Maintenance of all Staff Quarters including DRM
Bungalow and Officer’s Quarters.
▪ Correspondence with TNEB.
▪ Maintenance of DG Set and Transformers, which are not included in the AMC.
▪ Maintenance of AC Plants and Water Coolers, which are not included in the AMC.
▪ Lighting and Power Supply arrangements during Special Functions held at Divisional Offices.
▪ Observations of power line crossings.
▪ Maintenance of Solar Water Heaters and Geysers, which are not included in the AMC.
▪ Observation and Solar Panel and Plant.
▪ Electrical maintenance of all Stations, LC Gates, Service Buildings including DRM Office.
▪ Electrical maintenance of all UPS at UTS, PRS and Divisional Office.
▪ Attending to Electrical works when Vacation and Occupation of
Quarters.
▪ Maintaining and attending fuse calls in co-ordination with EB.
▪ Handing over bill receipts and collecting acknowledgements for the
same.
▪ Initiating penalty for late payment of the Power Bills.
23
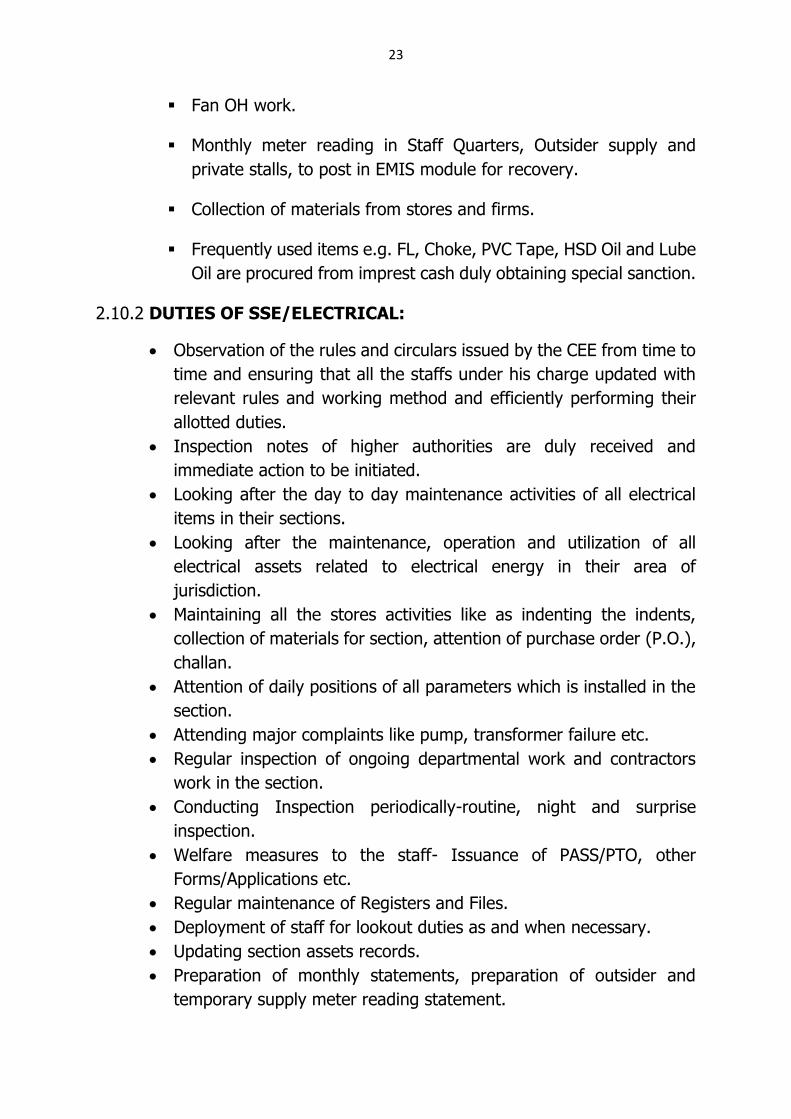
▪ Fan OH work.
▪ Monthly meter reading in Staff Quarters, Outsider supply and
private stalls, to post in EMIS module for recovery.
▪ Collection of materials from stores and firms.
▪ Frequently used items e.g. FL, Choke, PVC Tape, HSD Oil and Lube
Oil are procured from imprest cash duly obtaining special sanction.
2.10.2 DUTIES OF SSE/ELECTRICAL:
• Observation of the rules and circulars issued by the CEE from time to
time and ensuring that all the staffs under his charge updated with
relevant rules and working method and efficiently performing their
allotted duties.
• Inspection notes of higher authorities are duly received and
immediate action to be initiated.
• Looking after the day to day maintenance activities of all electrical
items in their sections.
• Looking after the maintenance, operation and utilization of all
electrical assets related to electrical energy in their area of
jurisdiction.
• Maintaining all the stores activities like as indenting the indents,
collection of materials for section, attention of purchase order (P.O.),
challan.
• Attention of daily positions of all parameters which is installed in the
section.
• Attending major complaints like pump, transformer failure etc.
• Regular inspection of ongoing departmental work and contractors
work in the section.
• Conducting Inspection periodically-routine, night and surprise
inspection.
• Welfare measures to the staff- Issuance of PASS/PTO, other
Forms/Applications etc.
• Regular maintenance of Registers and Files.
• Deployment of staff for lookout duties as and when necessary.
• Updating section assets records.
• Preparation of monthly statements, preparation of outsider and
temporary supply meter reading statement.
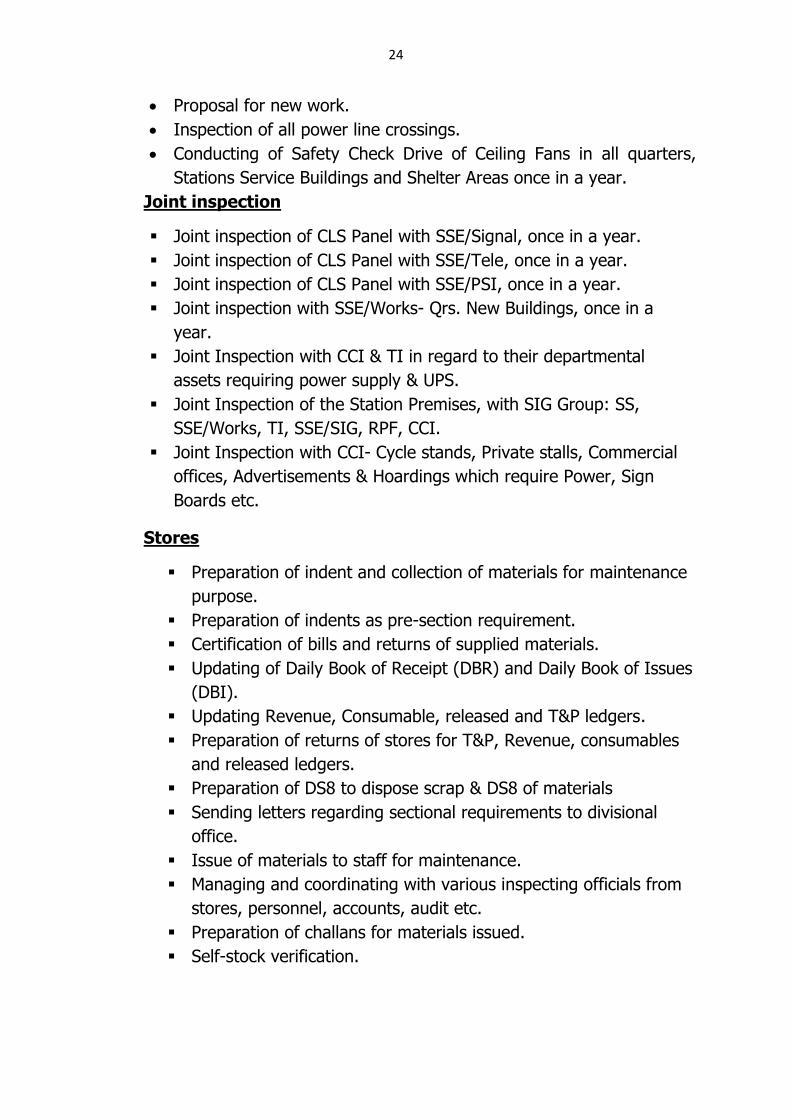
24
• Proposal for new work.
• Inspection of all power line crossings.
• Conducting of Safety Check Drive of Ceiling Fans in all quarters,
Stations Service Buildings and Shelter Areas once in a year.
Joint inspection
▪ Joint inspection of CLS Panel with SSE/Signal, once in a year.
▪ Joint inspection of CLS Panel with SSE/Tele, once in a year.
▪ Joint inspection of CLS Panel with SSE/PSI, once in a year.
▪ Joint inspection with SSE/Works- Qrs. New Buildings, once in a
year.
▪ Joint Inspection with CCI & TI in regard to their departmental
assets requiring power supply & UPS.
▪ Joint Inspection of the Station Premises, with SIG Group: SS,
SSE/Works, TI, SSE/SIG, RPF, CCI.
▪ Joint Inspection with CCI- Cycle stands, Private stalls, Commercial
offices, Advertisements & Hoardings which require Power, Sign
Boards etc.
Stores
▪ Preparation of indent and collection of materials for maintenance
purpose.
▪ Preparation of indents as pre-section requirement.
▪ Certification of bills and returns of supplied materials.
▪ Updating of Daily Book of Receipt (DBR) and Daily Book of Issues
(DBI).
▪ Updating Revenue, Consumable, released and T&P ledgers.
▪ Preparation of returns of stores for T&P, Revenue, consumables
and released ledgers.
▪ Preparation of DS8 to dispose scrap & DS8 of materials
▪ Sending letters regarding sectional requirements to divisional
office.
▪ Issue of materials to staff for maintenance.
▪ Managing and coordinating with various inspecting officials from
stores, personnel, accounts, audit etc.
▪ Preparation of challans for materials issued.
▪ Self-stock verification.
25
2.10.3 DUTIES OF TECHNICIAN/POWER:
(Specific) Looking after the Efficient maintenance of all the existing
installations is in good and working condition and also ensures that all
the safety appliances related to the works spot is in good and working
condition and they work on site with 2 or 3 nos. of Helpers according
to the distribution of work/failure which is distributed by the SSE/JE.
26
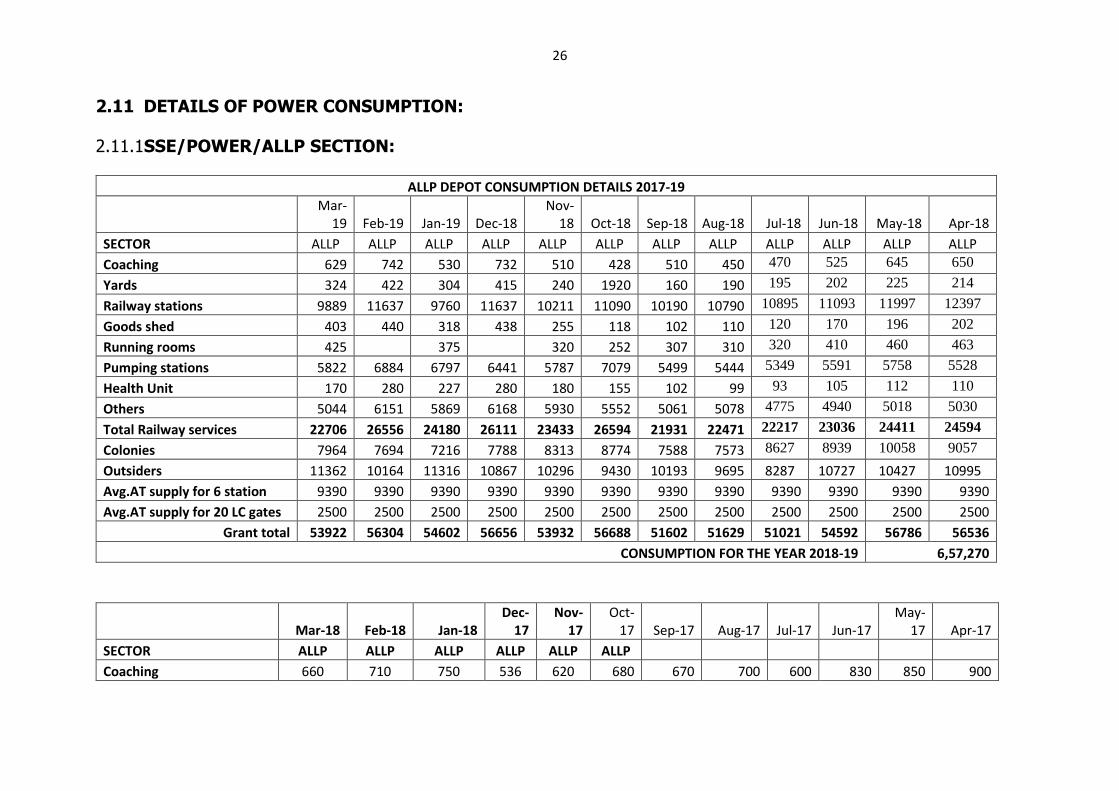
2.11 DETAILS OF POWER CONSUMPTION:
2.11.1SSE/POWER/ALLP SECTION:
ALLP DEPOT CONSUMPTION DETAILS 2017-19
Mar-19 Feb-19 Jan-19 Dec-18
Nov-18 Oct-18 Sep-18 Aug-18 Jul-18 Jun-18 May-18 Apr-18
SECTOR ALLP ALLP ALLP ALLP ALLP ALLP ALLP ALLP ALLP ALLP ALLP ALLP
Coaching 629 742 530 732 510 428 510 450 470 525 645 650
Yards 324 422 304 415 240 1920 160 190 195 202 225 214
Railway stations 9889 11637 9760 11637 10211 11090 10190 10790 10895 11093 11997 12397
Goods shed 403 440 318 438 255 118 102 110 120 170 196 202
Running rooms 425 375 320 252 307 310 320 410 460 463
Pumping stations 5822 6884 6797 6441 5787 7079 5499 5444 5349 5591 5758 5528
Health Unit 170 280 227 280 180 155 102 99 93 105 112 110
Others 5044 6151 5869 6168 5930 5552 5061 5078 4775 4940 5018 5030
Total Railway services 22706 26556 24180 26111 23433 26594 21931 22471 22217 23036 24411 24594
Colonies 7964 7694 7216 7788 8313 8774 7588 7573 8627 8939 10058 9057
Outsiders 11362 10164 11316 10867 10296 9430 10193 9695 8287 10727 10427 10995
Avg.AT supply for 6 station 9390 9390 9390 9390 9390 9390 9390 9390 9390 9390 9390 9390
Avg.AT supply for 20 LC gates 2500 2500 2500 2500 2500 2500 2500 2500 2500 2500 2500 2500
Grant total 53922 56304 54602 56656 53932 56688 51602 51629 51021 54592 56786 56536
CONSUMPTION FOR THE YEAR 2018-19 6,57,270
Mar-18 Feb-18 Jan-18 Dec-
17 Nov-
17 Oct-
17 Sep-17 Aug-17 Jul-17 Jun-17 May-
17 Apr-17
SECTOR ALLP ALLP ALLP ALLP ALLP ALLP
Coaching 660 710 750 536 620 680 670 700 600 830 850 900

27
Yards 205 215 245 150 180 176 150 172 158 167 140 150
Railway stations 13245 11666 13900 12300 13000 13131 10200 12090 11350 13600 10536 15000
Goods shed 190 175 210 180 220 190 190 225 210 220 180 2810
Running rooms 461 435 490 470 580 550 510 610 590 680 670 550
Pumping stations 4549 4418 4935 4268 3954 4943 4630 6284 4455 6701 5222 5685
Health Unit 130 147 190 140 170 250 210 275 250 300 400 430
Others 5263 5133 6313 6265 6480 5889 5290 6109 6904 6977 6590 6259
Total Railway services 24703 22899 27033 24309 25204 25809 21850 26465 24517 29475 24588 31784
Colonies 8038 9826 9298 8297 9852 9126 10649 9787 10164 10695 10980 9718
Outsiders 8634 11768 9397 8148 9970 8659 9264 9071 7811 8300 10431 9138
Avg.AT supply for 6 station 9390 9390 9390 9390 9390 9390 9390 9390 9390 9390 9390 9390
Avg.AT supply for 20 LC gates 2500 2500 2500 2500 2500 2500 2500 2500 2500 2500 2500 2500
Grant total 53265 56383 57618 52644 56916 55484 53653 57213 54382 60360 57889 62530
CONSUMPTION FOR THE YEAR 2017-18 678337
GRAND TOTAL 2017-19 (24 MONTHS) 13,35,607
AVERAGE P.M. 55,650.29
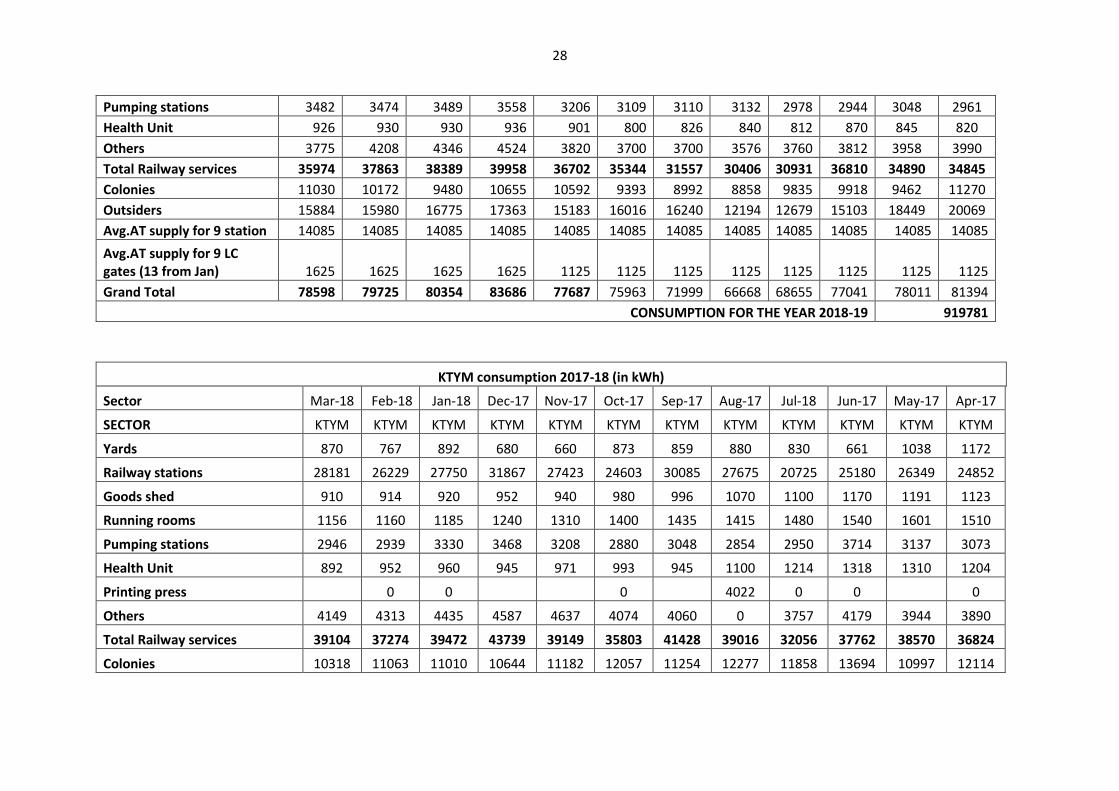
2.11.2 SSE/POWER/KTYM SECTION:
KTYM DEPOT CONSUMPTION DETAILS 2017-19
Sector Mar-19 Feb-19 Jan-19 Dec-18 Nov-18 Oct-18 Sep-18 Aug-18 Jul-18 Jun-18 May-18 Apr-18
SECTOR KTYM KTYM KTYM KTYM KTYM KTYM KTYM KTYM KTYM KTYM KTYM KTYM
Coaching 840 0 0 0 0
Yards 820 890 896 892 871 838 746 810 826 894 903
Railway stations 24876 26331 26688 27985 25799 24650 20921 19940 20461 26128 24153 24202
Goods shed 410 420 440 460 420 635 650 782 800 870 891 900
Running rooms 1685 1610 1600 1603 1685 1610 1512 1390 1310 1360 1101 1069
28
Pumping stations 3482 3474 3489 3558 3206 3109 3110 3132 2978 2944 3048 2961
Health Unit 926 930 930 936 901 800 826 840 812 870 845 820
Others 3775 4208 4346 4524 3820 3700 3700 3576 3760 3812 3958 3990
Total Railway services 35974 37863 38389 39958 36702 35344 31557 30406 30931 36810 34890 34845
Colonies 11030 10172 9480 10655 10592 9393 8992 8858 9835 9918 9462 11270
Outsiders 15884 15980 16775 17363 15183 16016 16240 12194 12679 15103 18449 20069
Avg.AT supply for 9 station 14085 14085 14085 14085 14085 14085 14085 14085 14085 14085 14085 14085
Avg.AT supply for 9 LC gates (13 from Jan) 1625 1625 1625 1625 1125 1125 1125 1125 1125 1125 1125 1125
Grand Total 78598 79725 80354 83686 77687 75963 71999 66668 68655 77041 78011 81394
CONSUMPTION FOR THE YEAR 2018-19 919781
KTYM consumption 2017-18 (in kWh)
Sector Mar-18 Feb-18 Jan-18 Dec-17 Nov-17 Oct-17 Sep-17 Aug-17 Jul-18 Jun-17 May-17 Apr-17
SECTOR KTYM KTYM KTYM KTYM KTYM KTYM KTYM KTYM KTYM KTYM KTYM KTYM
Yards 870 767 892 680 660 873 859 880 830 661 1038 1172
Railway stations 28181 26229 27750 31867 27423 24603 30085 27675 20725 25180 26349 24852
Goods shed 910 914 920 952 940 980 996 1070 1100 1170 1191 1123
Running rooms 1156 1160 1185 1240 1310 1400 1435 1415 1480 1540 1601 1510
Pumping stations 2946 2939 3330 3468 3208 2880 3048 2854 2950 3714 3137 3073
Health Unit 892 952 960 945 971 993 945 1100 1214 1318 1310 1204
Printing press 0 0 0 4022 0 0 0
Others 4149 4313 4435 4587 4637 4074 4060 0 3757 4179 3944 3890
Total Railway services 39104 37274 39472 43739 39149 35803 41428 39016 32056 37762 38570 36824
Colonies 10318 11063 11010 10644 11182 12057 11254 12277 11858 13694 10997 12114
29
Outsiders 15347 18653 18241 16946 15077 14793 15186 16941 16101 19102 19926 20236
Avg.AT supply for 9 station 14085 14085 14085 14085 14085 14085 14085 14085 14085 14085 14085 14085
Avg.AT supply for 9 LC gates 1125 1125 1125 1125 1125 1125 1125 1125 1125 1125 1125 1125
Grand Total 79979 82200 83933 86539 80618 77863 83078 83444 75225 85768 84703 84384
CONSUMPTION FOR THE YEAR 2017-18 987734
GRAND TOTAL 2017-19 (24 MONTHS) 1907515
AVERAGE P.M. 79479.79
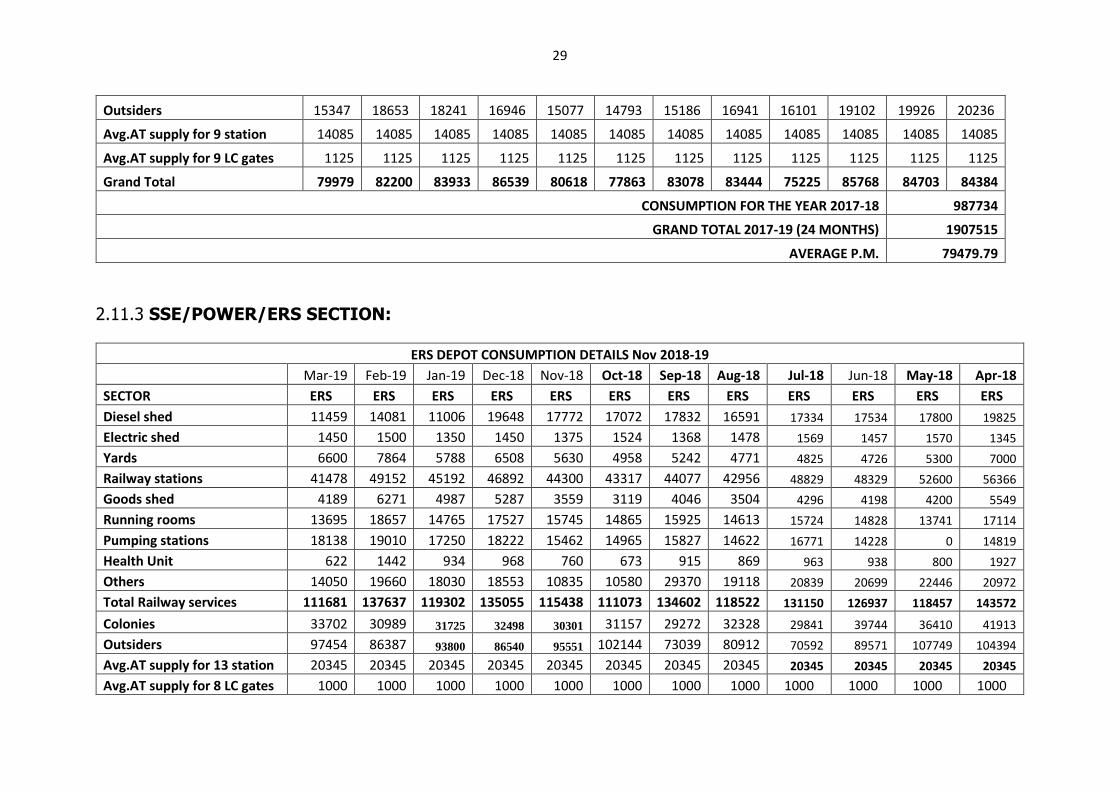
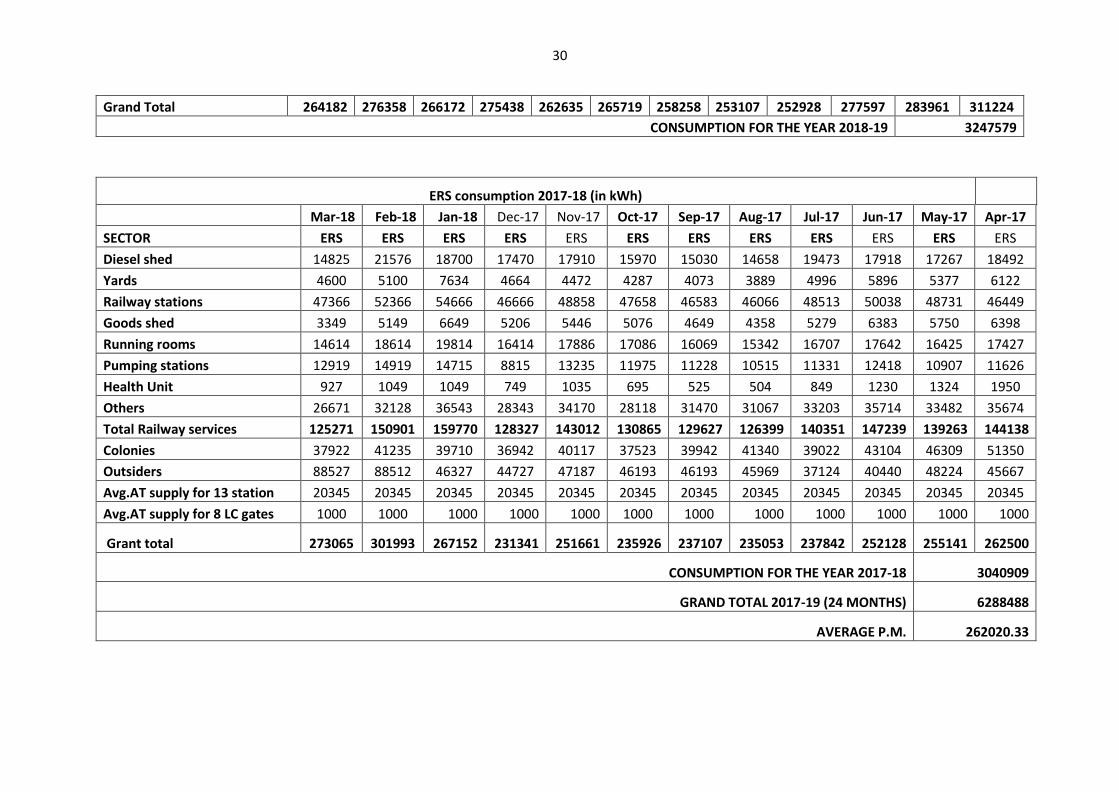
2.11.3 SSE/POWER/ERS SECTION:
ERS DEPOT CONSUMPTION DETAILS Nov 2018-19
Mar-19 Feb-19 Jan-19 Dec-18 Nov-18 Oct-18 Sep-18 Aug-18 Jul-18 Jun-18 May-18 Apr-18
SECTOR ERS ERS ERS ERS ERS ERS ERS ERS ERS ERS ERS ERS
Diesel shed 11459 14081 11006 19648 17772 17072 17832 16591 17334 17534 17800 19825
Electric shed 1450 1500 1350 1450 1375 1524 1368 1478 1569 1457 1570 1345
Yards 6600 7864 5788 6508 5630 4958 5242 4771 4825 4726 5300 7000
Railway stations 41478 49152 45192 46892 44300 43317 44077 42956 48829 48329 52600 56366
Goods shed 4189 6271 4987 5287 3559 3119 4046 3504 4296 4198 4200 5549
Running rooms 13695 18657 14765 17527 15745 14865 15925 14613 15724 14828 13741 17114
Pumping stations 18138 19010 17250 18222 15462 14965 15827 14622 16771 14228 0 14819
Health Unit 622 1442 934 968 760 673 915 869 963 938 800 1927
Others 14050 19660 18030 18553 10835 10580 29370 19118 20839 20699 22446 20972
Total Railway services 111681 137637 119302 135055 115438 111073 134602 118522 131150 126937 118457 143572
Colonies 33702 30989 31725 32498 30301 31157 29272 32328 29841 39744 36410 41913
Outsiders 97454 86387 93800 86540 95551 102144 73039 80912 70592 89571 107749 104394
Avg.AT supply for 13 station 20345 20345 20345 20345 20345 20345 20345 20345 20345 20345 20345 20345
Avg.AT supply for 8 LC gates 1000 1000 1000 1000 1000 1000 1000 1000 1000 1000 1000 1000
30
Grand Total 264182 276358 266172 275438 262635 265719 258258 253107 252928 277597 283961 311224
CONSUMPTION FOR THE YEAR 2018-19 3247579
ERS consumption 2017-18 (in kWh) Mar-18 Feb-18 Jan-18 Dec-17 Nov-17 Oct-17 Sep-17 Aug-17 Jul-17 Jun-17 May-17 Apr-17
SECTOR ERS ERS ERS ERS ERS ERS ERS ERS ERS ERS ERS ERS
Diesel shed 14825 21576 18700 17470 17910 15970 15030 14658 19473 17918 17267 18492
Yards 4600 5100 7634 4664 4472 4287 4073 3889 4996 5896 5377 6122
Railway stations 47366 52366 54666 46666 48858 47658 46583 46066 48513 50038 48731 46449
Goods shed 3349 5149 6649 5206 5446 5076 4649 4358 5279 6383 5750 6398
Running rooms 14614 18614 19814 16414 17886 17086 16069 15342 16707 17642 16425 17427
Pumping stations 12919 14919 14715 8815 13235 11975 11228 10515 11331 12418 10907 11626
Health Unit 927 1049 1049 749 1035 695 525 504 849 1230 1324 1950
Others 26671 32128 36543 28343 34170 28118 31470 31067 33203 35714 33482 35674
Total Railway services 125271 150901 159770 128327 143012 130865 129627 126399 140351 147239 139263 144138
Colonies 37922 41235 39710 36942 40117 37523 39942 41340 39022 43104 46309 51350
Outsiders 88527 88512 46327 44727 47187 46193 46193 45969 37124 40440 48224 45667
Avg.AT supply for 13 station 20345 20345 20345 20345 20345 20345 20345 20345 20345 20345 20345 20345
Avg.AT supply for 8 LC gates 1000 1000 1000 1000 1000 1000 1000 1000 1000 1000 1000 1000
Grant total 273065 301993 267152 231341 251661 235926 237107 235053 237842 252128 255141 262500
CONSUMPTION FOR THE YEAR 2017-18 3040909
GRAND TOTAL 2017-19 (24 MONTHS) 6288488
AVERAGE P.M. 262020.33
31
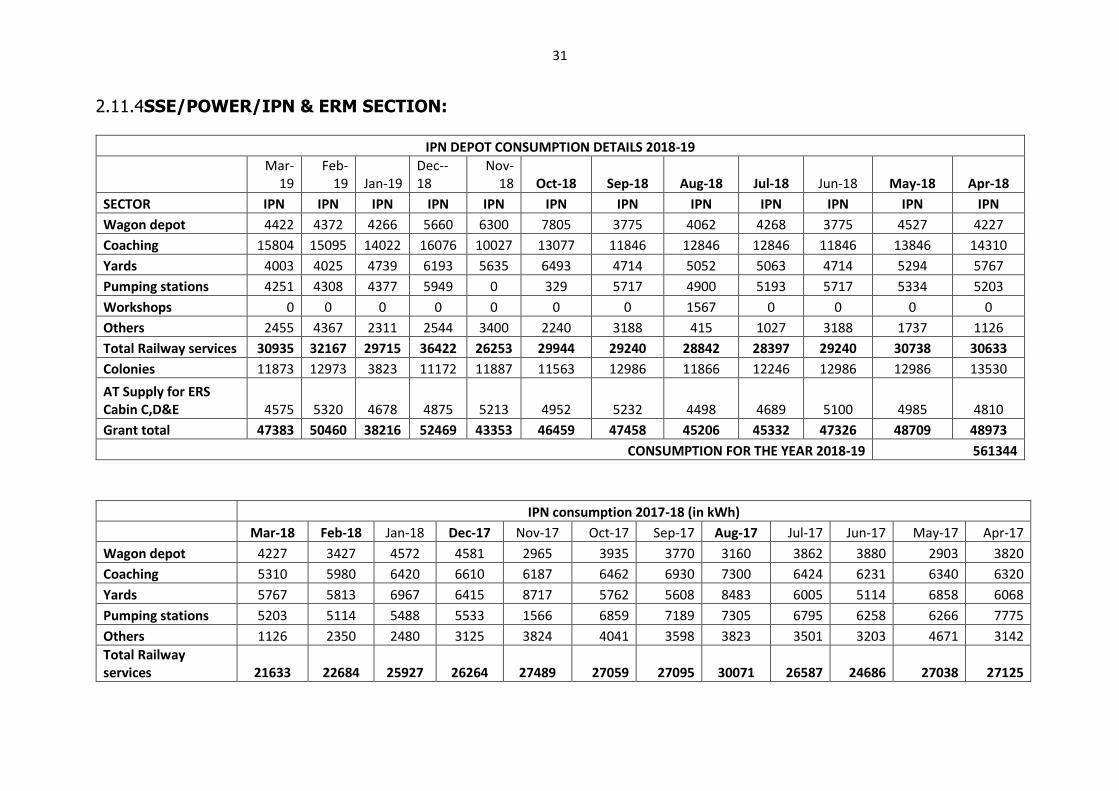
2.11.4SSE/POWER/IPN & ERM SECTION:
IPN DEPOT CONSUMPTION DETAILS 2018-19
Mar-19
Feb-19 Jan-19
Dec--18
Nov-18 Oct-18 Sep-18 Aug-18 Jul-18 Jun-18 May-18 Apr-18
SECTOR IPN IPN IPN IPN IPN IPN IPN IPN IPN IPN IPN IPN
Wagon depot 4422 4372 4266 5660 6300 7805 3775 4062 4268 3775 4527 4227
Coaching 15804 15095 14022 16076 10027 13077 11846 12846 12846 11846 13846 14310
Yards 4003 4025 4739 6193 5635 6493 4714 5052 5063 4714 5294 5767
Pumping stations 4251 4308 4377 5949 0 329 5717 4900 5193 5717 5334 5203
Workshops 0 0 0 0 0 0 0 1567 0 0 0 0
Others 2455 4367 2311 2544 3400 2240 3188 415 1027 3188 1737 1126
Total Railway services 30935 32167 29715 36422 26253 29944 29240 28842 28397 29240 30738 30633
Colonies 11873 12973 3823 11172 11887 11563 12986 11866 12246 12986 12986 13530
AT Supply for ERS Cabin C,D&E 4575 5320 4678 4875 5213 4952 5232 4498 4689 5100 4985 4810
Grant total 47383 50460 38216 52469 43353 46459 47458 45206 45332 47326 48709 48973
CONSUMPTION FOR THE YEAR 2018-19 561344
IPN consumption 2017-18 (in kWh)
Mar-18 Feb-18 Jan-18 Dec-17 Nov-17 Oct-17 Sep-17 Aug-17 Jul-17 Jun-17 May-17 Apr-17
Wagon depot 4227 3427 4572 4581 2965 3935 3770 3160 3862 3880 2903 3820
Coaching 5310 5980 6420 6610 6187 6462 6930 7300 6424 6231 6340 6320
Yards 5767 5813 6967 6415 8717 5762 5608 8483 6005 5114 6858 6068
Pumping stations 5203 5114 5488 5533 1566 6859 7189 7305 6795 6258 6266 7775
Others 1126 2350 2480 3125 3824 4041 3598 3823 3501 3203 4671 3142
Total Railway services 21633 22684 25927 26264 27489 27059 27095 30071 26587 24686 27038 27125
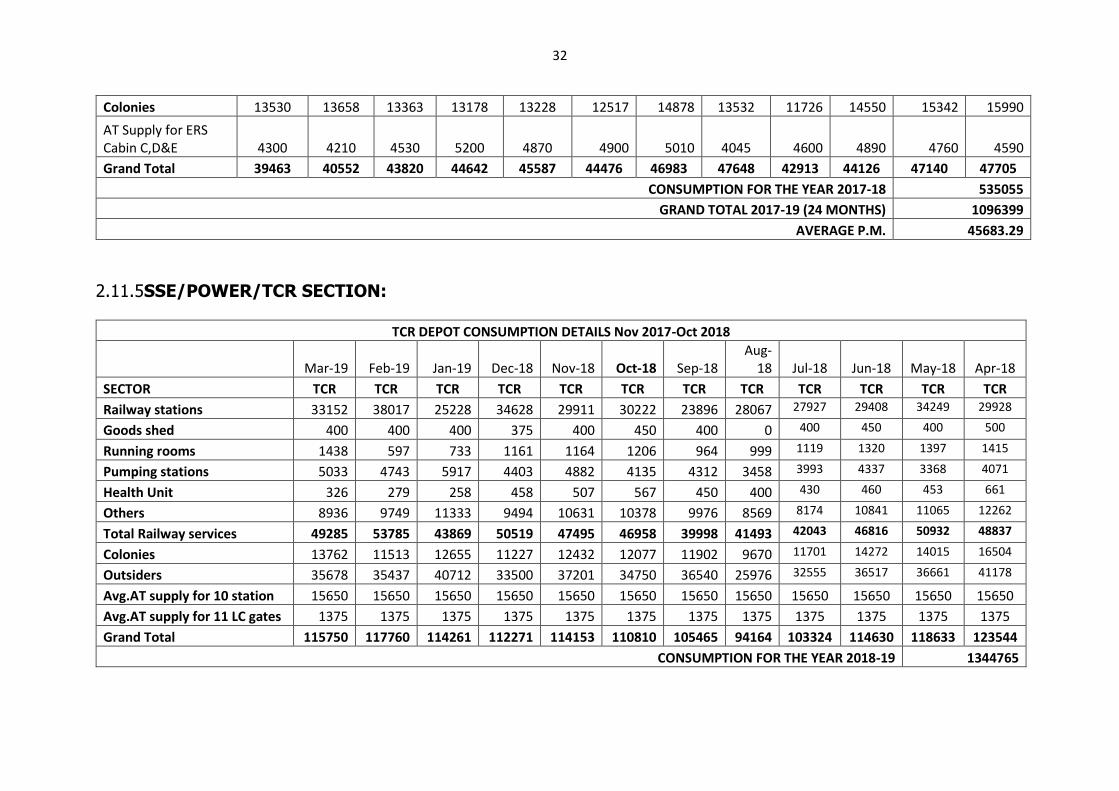
32
Colonies 13530 13658 13363 13178 13228 12517 14878 13532 11726 14550 15342 15990
AT Supply for ERS Cabin C,D&E 4300 4210 4530 5200 4870 4900 5010 4045 4600 4890 4760 4590
Grand Total 39463 40552 43820 44642 45587 44476 46983 47648 42913 44126 47140 47705
CONSUMPTION FOR THE YEAR 2017-18 535055
GRAND TOTAL 2017-19 (24 MONTHS) 1096399
AVERAGE P.M. 45683.29
2.11.5SSE/POWER/TCR SECTION:
TCR DEPOT CONSUMPTION DETAILS Nov 2017-Oct 2018
Mar-19 Feb-19 Jan-19 Dec-18 Nov-18 Oct-18 Sep-18 Aug-
18 Jul-18 Jun-18 May-18 Apr-18
SECTOR TCR TCR TCR TCR TCR TCR TCR TCR TCR TCR TCR TCR
Railway stations 33152 38017 25228 34628 29911 30222 23896 28067 27927 29408 34249 29928
Goods shed 400 400 400 375 400 450 400 0 400 450 400 500
Running rooms 1438 597 733 1161 1164 1206 964 999 1119 1320 1397 1415
Pumping stations 5033 4743 5917 4403 4882 4135 4312 3458 3993 4337 3368 4071
Health Unit 326 279 258 458 507 567 450 400 430 460 453 661
Others 8936 9749 11333 9494 10631 10378 9976 8569 8174 10841 11065 12262
Total Railway services 49285 53785 43869 50519 47495 46958 39998 41493 42043 46816 50932 48837
Colonies 13762 11513 12655 11227 12432 12077 11902 9670 11701 14272 14015 16504
Outsiders 35678 35437 40712 33500 37201 34750 36540 25976 32555 36517 36661 41178
Avg.AT supply for 10 station 15650 15650 15650 15650 15650 15650 15650 15650 15650 15650 15650 15650
Avg.AT supply for 11 LC gates 1375 1375 1375 1375 1375 1375 1375 1375 1375 1375 1375 1375
Grand Total 115750 117760 114261 112271 114153 110810 105465 94164 103324 114630 118633 123544
CONSUMPTION FOR THE YEAR 2018-19 1344765
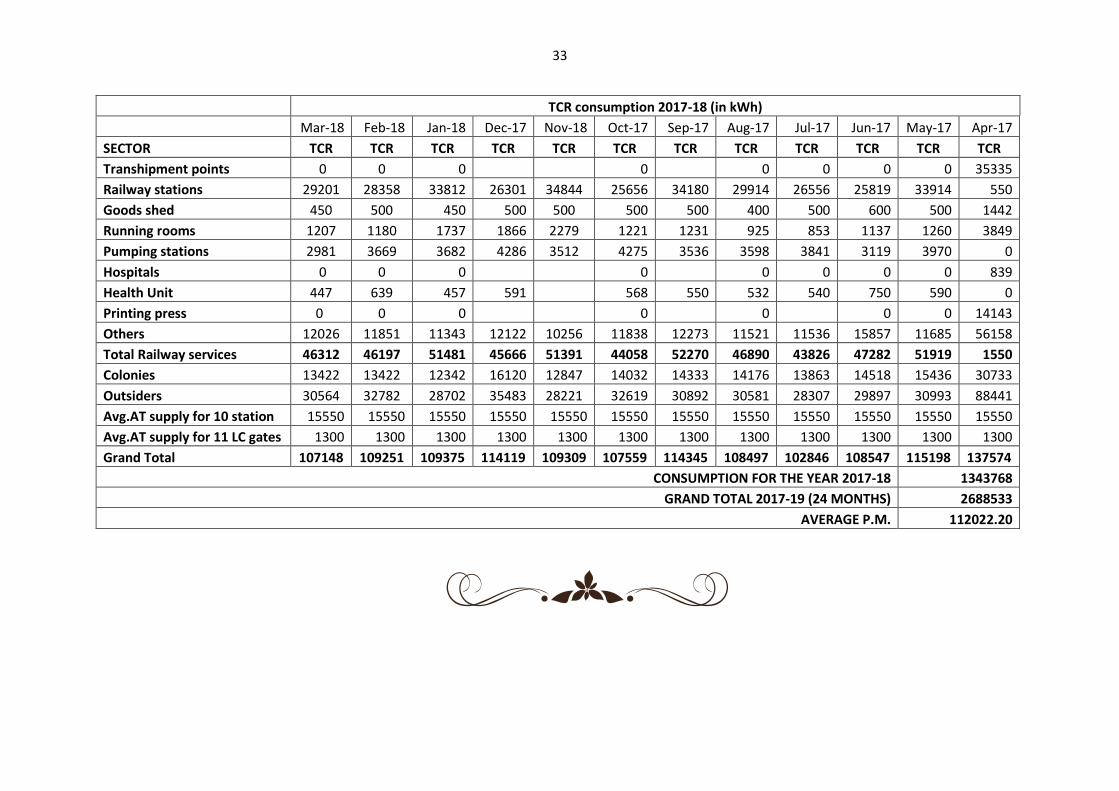
33
TCR consumption 2017-18 (in kWh)
Mar-18 Feb-18 Jan-18 Dec-17 Nov-18 Oct-17 Sep-17 Aug-17 Jul-17 Jun-17 May-17 Apr-17
SECTOR TCR TCR TCR TCR TCR TCR TCR TCR TCR TCR TCR TCR
Transhipment points 0 0 0 0 0 0 0 0 35335
Railway stations 29201 28358 33812 26301 34844 25656 34180 29914 26556 25819 33914 550
Goods shed 450 500 450 500 500 500 500 400 500 600 500 1442
Running rooms 1207 1180 1737 1866 2279 1221 1231 925 853 1137 1260 3849
Pumping stations 2981 3669 3682 4286 3512 4275 3536 3598 3841 3119 3970 0
Hospitals 0 0 0 0 0 0 0 0 839
Health Unit 447 639 457 591 568 550 532 540 750 590 0
Printing press 0 0 0 0 0 0 0 14143
Others 12026 11851 11343 12122 10256 11838 12273 11521 11536 15857 11685 56158
Total Railway services 46312 46197 51481 45666 51391 44058 52270 46890 43826 47282 51919 1550
Colonies 13422 13422 12342 16120 12847 14032 14333 14176 13863 14518 15436 30733
Outsiders 30564 32782 28702 35483 28221 32619 30892 30581 28307 29897 30993 88441
Avg.AT supply for 10 station 15550 15550 15550 15550 15550 15550 15550 15550 15550 15550 15550 15550
Avg.AT supply for 11 LC gates 1300 1300 1300 1300 1300 1300 1300 1300 1300 1300 1300 1300
Grand Total 107148 109251 109375 114119 109309 107559 114345 108497 102846 108547 115198 137574
CONSUMPTION FOR THE YEAR 2017-18 1343768
GRAND TOTAL 2017-19 (24 MONTHS) 2688533
AVERAGE P.M. 112022.20
34
CHAPTER III
3.0 CRITICAL ANALYSIS
3.1 GENERAL ANALYSIS:
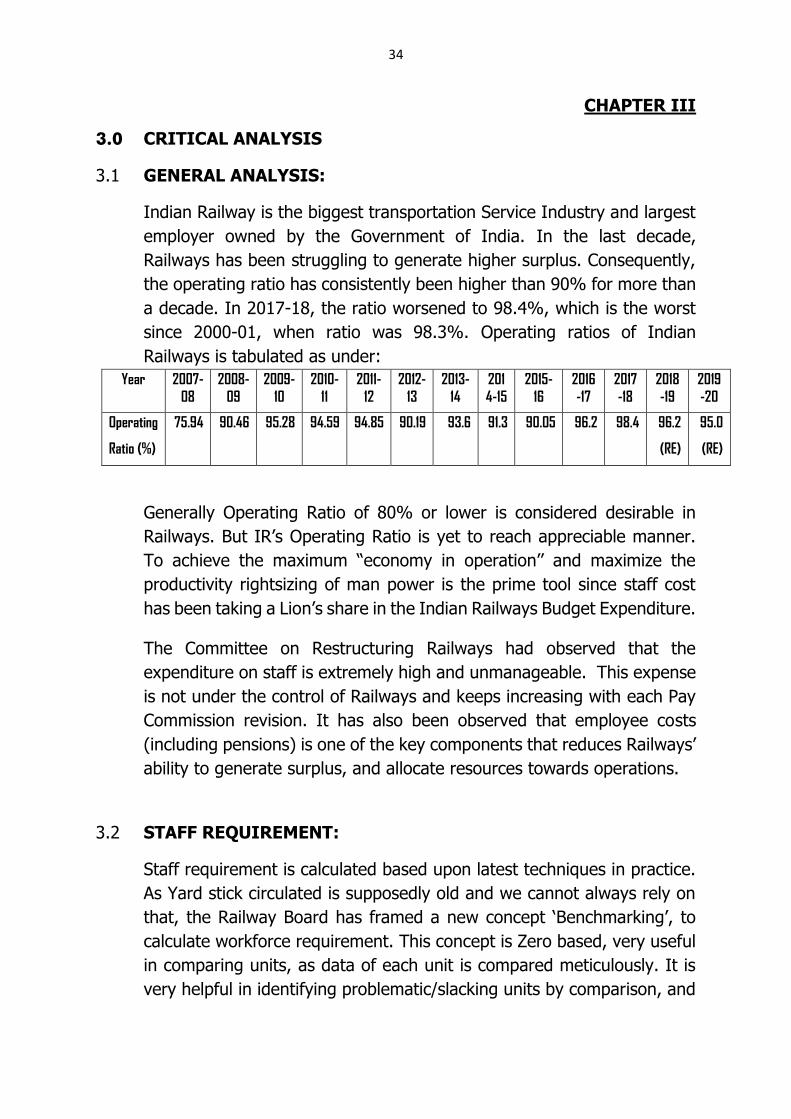
Indian Railway is the biggest transportation Service Industry and largest
employer owned by the Government of India. In the last decade,
Railways has been struggling to generate higher surplus. Consequently,
the operating ratio has consistently been higher than 90% for more than
a decade. In 2017-18, the ratio worsened to 98.4%, which is the worst
since 2000-01, when ratio was 98.3%. Operating ratios of Indian
Railways is tabulated as under:
Year 2007-
08
2008-
09
2009-
10
2010-
11
2011-
12
2012-
13
2013-
14
201
4-15
2015-
16
2016
-17
2017
-18
2018
-19
2019
-20
Operating
Ratio (%)
75.94 90.46 95.28 94.59 94.85 90.19 93.6 91.3 90.05 96.2 98.4 96.2
(RE)
95.0
(RE)
Generally Operating Ratio of 80% or lower is considered desirable in
Railways. But IR’s Operating Ratio is yet to reach appreciable manner.
To achieve the maximum “economy in operation’’ and maximize the
productivity rightsizing of man power is the prime tool since staff cost
has been taking a Lion’s share in the Indian Railways Budget Expenditure.
The Committee on Restructuring Railways had observed that the
expenditure on staff is extremely high and unmanageable. This expense
is not under the control of Railways and keeps increasing with each Pay
Commission revision. It has also been observed that employee costs
(including pensions) is one of the key components that reduces Railways’
ability to generate surplus, and allocate resources towards operations.
3.2 STAFF REQUIREMENT:
Staff requirement is calculated based upon latest techniques in practice.
As Yard stick circulated is supposedly old and we cannot always rely on
that, the Railway Board has framed a new concept ‘Benchmarking’, to
calculate workforce requirement. This concept is Zero based, very useful
in comparing units, as data of each unit is compared meticulously. It is
very helpful in identifying problematic/slacking units by comparison, and
35
allows other units to improve upon their score, with that of best unit in a
phased and planned manner by setting different targets, achieving the
Best Benchmark thereby finally. This work study team has, keeping this
in view, based upon data and field study has arrived at numbers
pertaining to requirement of staff of this section after thorough analysis.
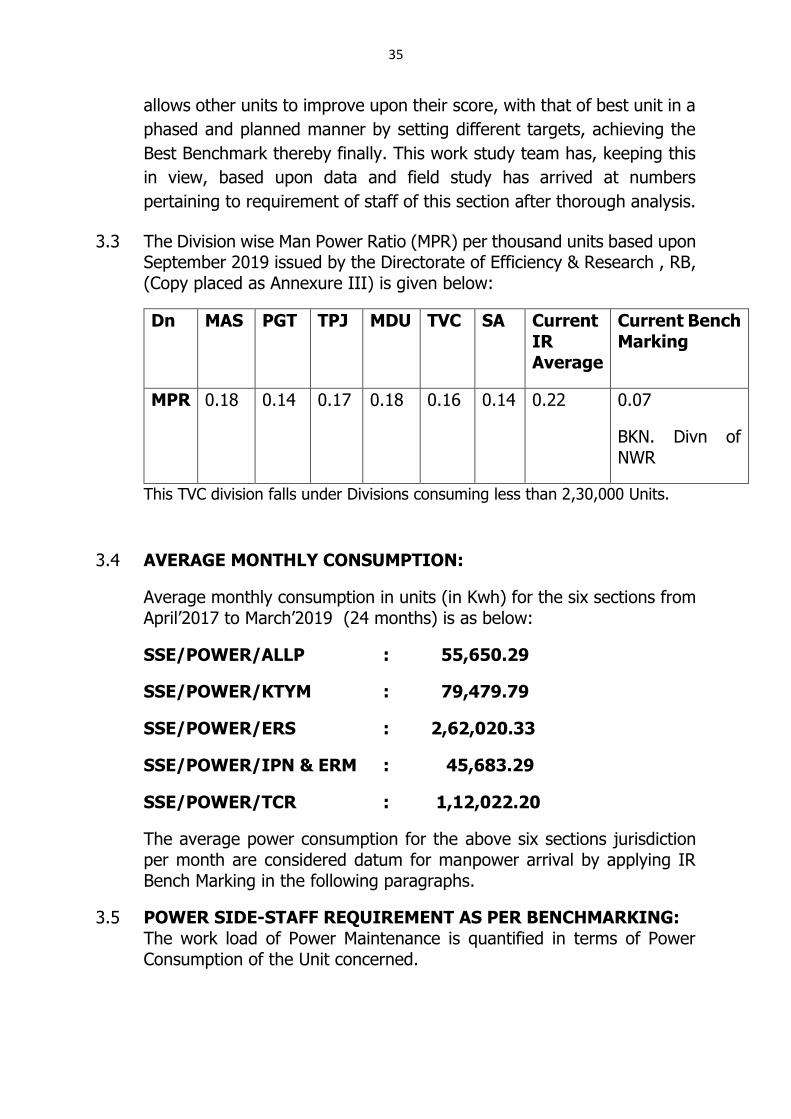
3.3 The Division wise Man Power Ratio (MPR) per thousand units based upon September 2019 issued by the Directorate of Efficiency & Research , RB, (Copy placed as Annexure III) is given below:
Dn MAS PGT TPJ MDU TVC SA Current
IR Average
Current Bench
Marking
MPR 0.18 0.14 0.17 0.18 0.16 0.14 0.22 0.07
BKN. Divn of NWR
This TVC division falls under Divisions consuming less than 2,30,000 Units.
3.4 AVERAGE MONTHLY CONSUMPTION:
Average monthly consumption in units (in Kwh) for the six sections from April’2017 to March’2019 (24 months) is as below:
SSE/POWER/ALLP : 55,650.29
SSE/POWER/KTYM : 79,479.79
SSE/POWER/ERS : 2,62,020.33
SSE/POWER/IPN & ERM : 45,683.29
SSE/POWER/TCR : 1,12,022.20
The average power consumption for the above six sections jurisdiction per month are considered datum for manpower arrival by applying IR Bench Marking in the following paragraphs.
3.5 POWER SIDE-STAFF REQUIREMENT AS PER BENCHMARKING: The work load of Power Maintenance is quantified in terms of Power Consumption of the Unit concerned.
36
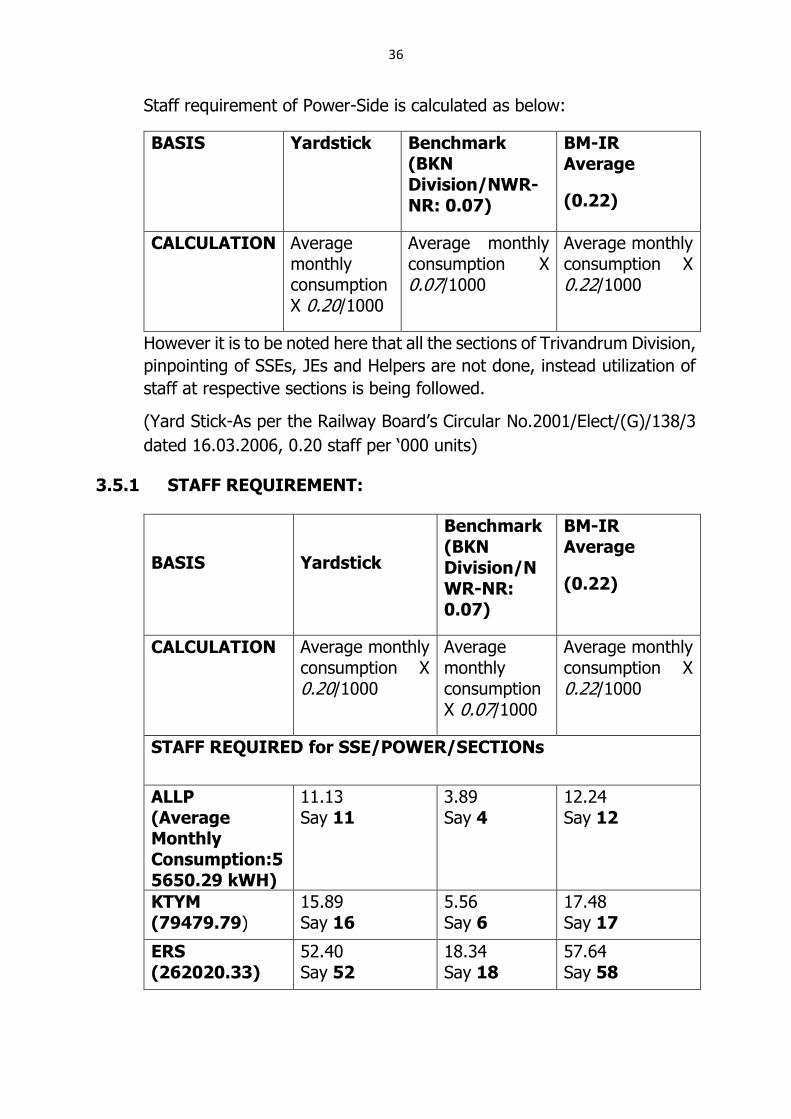
Staff requirement of Power-Side is calculated as below:
BASIS Yardstick Benchmark (BKN Division/NWR-NR: 0.07)
BM-IR Average
(0.22)
CALCULATION Average monthly consumption X 0.20/1000
Average monthly consumption X 0.07/1000
Average monthly consumption X 0.22/1000
However it is to be noted here that all the sections of Trivandrum Division,
pinpointing of SSEs, JEs and Helpers are not done, instead utilization of
staff at respective sections is being followed.
(Yard Stick-As per the Railway Board’s Circular No.2001/Elect/(G)/138/3
dated 16.03.2006, 0.20 staff per ‘000 units)
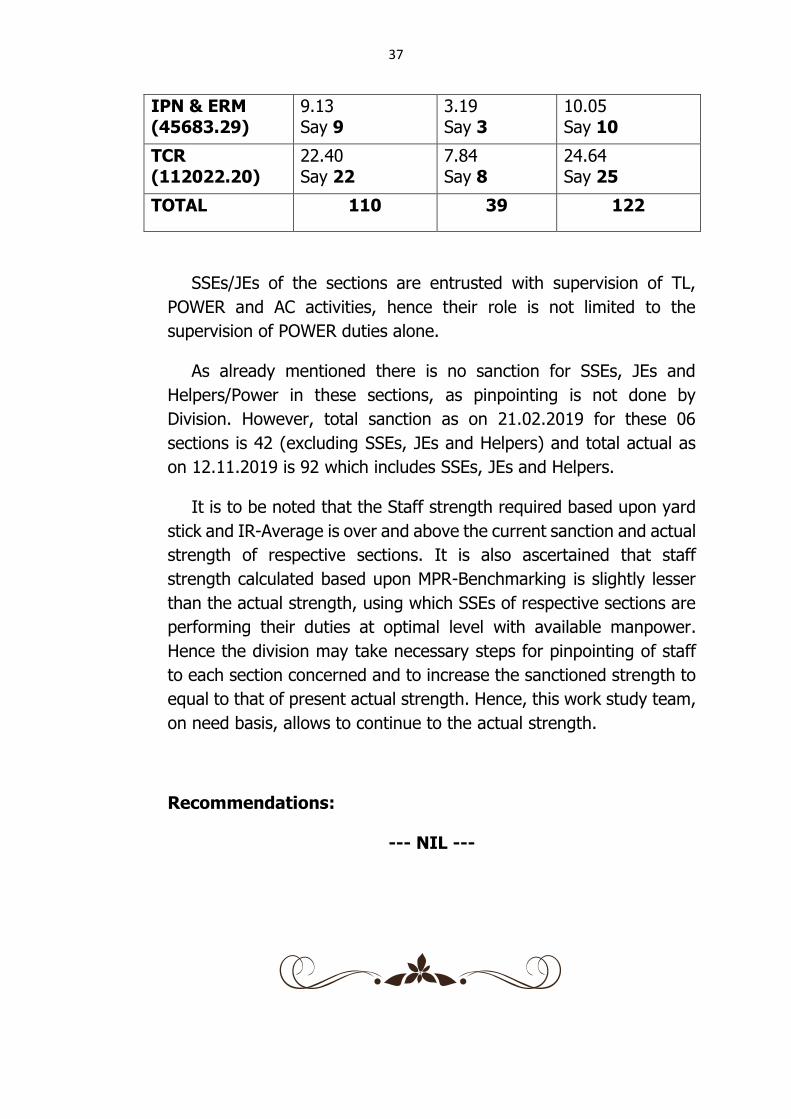
3.5.1 STAFF REQUIREMENT:
BASIS
Yardstick
Benchmark (BKN Division/NWR-NR: 0.07)
BM-IR Average
(0.22)
CALCULATION Average monthly consumption X 0.20/1000
Average monthly consumption X 0.07/1000
Average monthly consumption X 0.22/1000
STAFF REQUIRED for SSE/POWER/SECTIONs
ALLP (Average Monthly Consumption:55650.29 kWH)
11.13 Say 11
3.89 Say 4
12.24 Say 12
KTYM (79479.79)
15.89 Say 16
5.56 Say 6
17.48 Say 17
ERS (262020.33)
52.40 Say 52
18.34 Say 18
57.64 Say 58
37
IPN & ERM (45683.29)
9.13 Say 9
3.19 Say 3
10.05 Say 10
TCR (112022.20)
22.40 Say 22
7.84 Say 8
24.64 Say 25
TOTAL 110 39 122
SSEs/JEs of the sections are entrusted with supervision of TL,
POWER and AC activities, hence their role is not limited to the
supervision of POWER duties alone.
As already mentioned there is no sanction for SSEs, JEs and
Helpers/Power in these sections, as pinpointing is not done by
Division. However, total sanction as on 21.02.2019 for these 06
sections is 42 (excluding SSEs, JEs and Helpers) and total actual as
on 12.11.2019 is 92 which includes SSEs, JEs and Helpers.
It is to be noted that the Staff strength required based upon yard
stick and IR-Average is over and above the current sanction and actual
strength of respective sections. It is also ascertained that staff
strength calculated based upon MPR-Benchmarking is slightly lesser
than the actual strength, using which SSEs of respective sections are
performing their duties at optimal level with available manpower.
Hence the division may take necessary steps for pinpointing of staff
to each section concerned and to increase the sanctioned strength to
equal to that of present actual strength. Hence, this work study team,
on need basis, allows to continue to the actual strength.
Recommendations:
--- NIL ---
38
CHAPTER IV
4.0 PLANNING BRANCH’s REMARKS ON CO-ORDINATING OFFICER’s VIEWS:

39
CHAPTER V
5.0 FINANCIAL SAVINGS:
---NIL---
40
SAVE STATEMNT ANNEXURE – I
41
STATION WISE POSITION OF POWERSIDE AS ON 12.11.2019 ANNEXURE II
42
BENCHMARKING REPORT-SEPTEMBER 2019 ANNEXURE III
43
CO-ORDINATING OFFICER’s VIEWS ANNEXURE III