workforce intelligence london handout jason averbook
TRANSCRIPT

Strategy First, Technology Second March 20, 2013 London © 2013 Appirio, Inc. -‐ Confiden6al
Who Am I?
Jason Averbook Chief Business Innova6on Officer @jasonaverbook hFp://blog.knowledgeinfusion.com

Tradi?onal Approach: Strategy and Technology have been Siloed
“Focus on the strategy first, the technology is just an enabler.”
“This will make us more efficient.” “We can train our people to use the system.”
Strategy
Processes
People Op?miza?on “As long as the system can automate our
processes, what’s the difference?” “We will roll this out to the enterprise.” “We get a maintenance contract, right?”
Technology
Selec?on Deployment Func?onal
Operational Strategy
High cost & risk Low adop?on & sa?sfac?on Poor measurable business results
THE RESULTS

The Best HCM Strategists • 350 global customers
• Consultants with an average of 15 years HR and talent management experience
• Ground breaking thought leaders focused solely on HCM
KI + Appirio: A New Type of Partner
The Best Cloud Innovators • 350 enterprise customers, 2M users moved to the
cloud
• 500 cloud experts, 50,000 strong crowdsourcing community
• World Economic Forum 2013 Technology Pioneer
+
Tran
sforma?
onal
HCM Strategies
Innova?ve Cloud Solu?ons
Alignment of organiza?on, people, and technology to deliver unprecedented execu?on and agility.

Define Strategy HR strategy informed by business and technology
trends
Opera?onalize Strategy
Rapid 6me-‐to-‐value through agile process change
Adapt Strategy Over Time Strategy to execu6on at the
speed of business
KI + Appirio: Strategy and Technology Alignment Results in BETTER OUTCOMES
The Perfect Storm

What is driving this need to transform the way people work?
1. 2. 3. ShiY to the Cloud
Rethinking Talent Management
Workforce 2020
Consumer Grade Expecta?ons
Importance of Individual & Team
Mobile Social
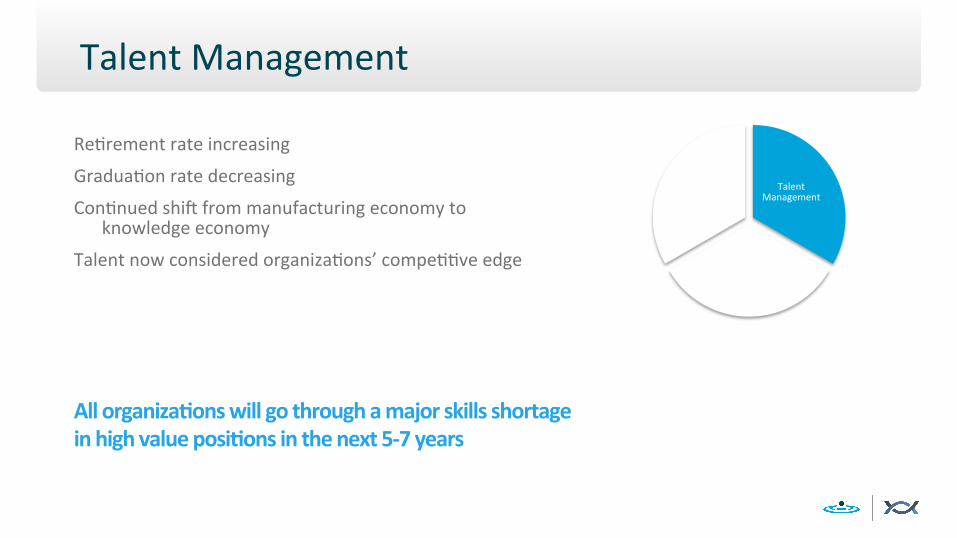
Talent Management
Re6rement rate increasing
Gradua6on rate decreasing
Con6nued shi[ from manufacturing economy to knowledge economy
Talent now considered organiza6ons’ compe66ve edge
Talent Management
Workforce 2020
Pla^orm Shi[ from ERP to
Cloud
All organiza?ons will go through a major skills shortage in high value posi?ons in the next 5-‐7 years

Good News: There’s Buy-‐In… • Only 1 in 8 cited ‘our leaders don’t buy into talent management’ as a show-‐stopper or significant challenge.
• Only 1 in 4 cited ‘not having the money to invest’ as a show stopper or significant challenge.
Bad News: Some Aren’t Quick Fixes… • More than 4 in 5 indicated ‘managers do not know how to manage people’ as being at least a somewhat significant challenge.
• Nearly 4 in 5 pointed to ‘inefficient or an6quated processes’ being at least a somewhat significant challenge.
What’s Stopping Organiza?ons from Managing Talent Effec?vely?

– Talent Profiles have become more common in commercial areas –business, sports, news profiles
– Provides an easy visual and framework for discussing and comparing talent
– LinkedIn and other social networking tools have employees more accustomed to building out their own pages and informa6on
Talent Profiles

Workforce 2020
More social More collabora6ve More connected / devices More 24/7
Major shi[ from full-‐6me to heavy con6ngent workforce
Talent Management
Workforce 2020
Pla^orm Shi[ from ERP to
Cloud
The Workforce of 2020 will be driven by heavy collabora?on, matrix structures and virtual work
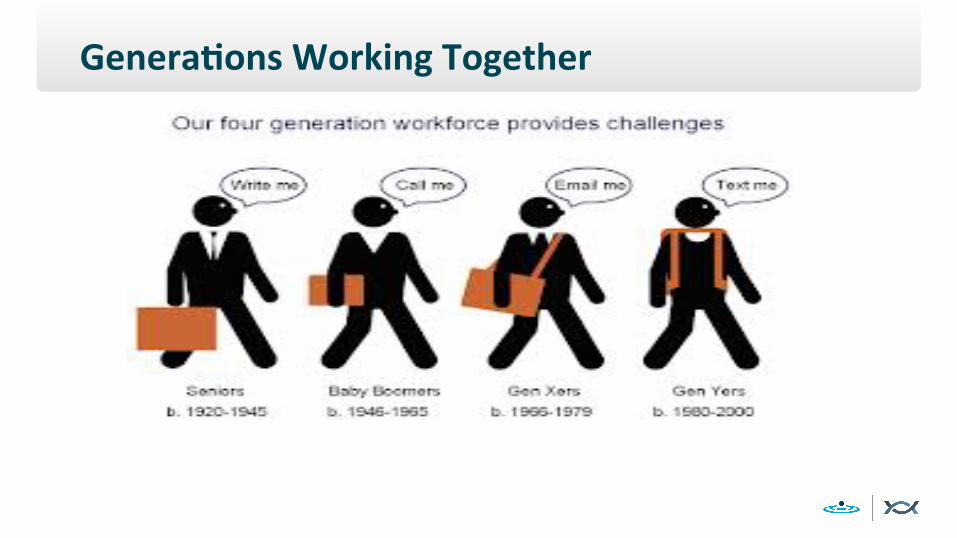
Genera?ons Working Together

Genera?on Z

Mobile / Collabora?on

Pla^orm Shi[ from ERP to Cloud
- Most HR So[ware wriFen before Internet was born
- Designed for HR department – not workforce
- Most systems implemented as payroll solu6on, not human capital management solu6on
- Tremendous cost with liFle value add
Talent Management
Workforce 2020
Pla^orm Shi[ from ERP to
Cloud
All organiza?ons will need to upgrade/ re-‐implement/replace in the next 1-‐4 years

Not Time The Same Old Thinking

Usability Drives New Era Of Business

Applifica?on of HR

So…What Has Changed To Create This Storm?

The Workforce
More Mobile
More Collabora6ve
More Social
More 24/7
More In Need Of Leadership / Direc6on

Your Technographic?

The Business
Demands and Expecta6ons on HR
Ownership of Talent Ini6a6ve
Less Dependency on HR
Ultra Compe66ve Landscape
All Global

The HR Func?on
Business Driven
Need To Rethink Talent – “What We Want To Be Great At”
Focus on Compe66ve Advantage Capabili6es
Desire to be Quan6ta6ve
New Leaders

The Expecta?ons
Consumer Driven
Always On
Easy
In Context Of Work
No Limita6ons

The Technology
Shi[ from HR Focused to Workforce Focused
Subscrip6on vs. Buy
HR Specialized vs. Enterprise Constrained
Configura6on vs. Customiza6on
Part of Overall HR Strategy, Not Separate Piece

The Keys To Success

HR & Talent Process, People & Technology Strategy & Plan
HR & Talent Goals
Corporate Goals, Strategies & Culture
Talent Management: Alignment Drives “Success”

What Usually Happens
Huge Expecta6ons
Great Demo
Expecta6ons Lower
Implementa6on
What Happened?
Go-‐Live
Now What?

Why?
1. Lack of planning (people, process, technology) 2. PuKng too much weight on the soLware and vendor 3. Focusing on the configuraOon first 4. Making Phase 1 tacOcal and not value add 5. Not considering workforce experience
Huge Expecta6ons
Great Demo
Expecta6ons Lower
Implementa6on
What Happened?
Go-‐Live
29

Process

Process Calibra?on

1. Perfect Storm
2. World Is Changing Rapidly
3. We Cannot Waste Another Opportunity To “Reimagine”
In Summary
Workforce Intelligence

– Provide an overview and defini6on of Talent Intelligence – People, Process & Technology.
– Review different stages of Talent Intelligence Maturity and discuss where Company X currently stands.
– Establish a strategic approach to iden6fying and delivering metrics & analy6cs to the business.
– Review systems & data roadmap example of workforce analy6cs.
– Review sample project plan & roadmap for implementa6on of workforce analy6cs.
Workshop Objec?ves

KEY CONCEPTS Workforce Analy6cs

What is Talent Intelligence? Managing workforce and other business informaOon to drive smart talent decisions in support of short-‐ and long-‐term organizaOonal goals.
Source: Talent Intelligence – BeZer Management through Measurement, Knowledge Infusion, 2009
People- Organization
- Competencies
Technology- Systems & Tools
-Interfaces
Process- Client Service
- Data Mgmt
40%
40% 20%

Founda?on: Workforce Technology Footprint
HR Portal Single User Experience Designed for Role & Relevance
Analytics & Transactions Case Management, ESS, MSS, Data &
Dashboards
Knowledge & Collaboration Knowledgebase, Communications,
Collaboration
Core HR Foundation People Structure, Job Structure,
Organization Structure
Talent Management Workforce Planning, Competency Mgmt, Talent Acquisition, Learning Mgmt,
Performance Mgmt, Compensation, Succession & Career Planning
Workforce Intelligence Reporting, Metrics, Analytics, KPIs
Workforce, Operational, Talent Mgmt, Biz Intelligence
Workforce Management Time & Attendance, Absence & Leave
Mgmt, Benefits, Payroll HR Service Delivery Core Founda?on Strategic HR
Infrastructure S
ecurity, Data, Integration, W
orkflow
Infrastructure

Workforce Intelligence is About Answering Ques?ons
Ques?ons Asked by the Business*
– Are our managers capable of managing talent?
– Who’s on the bench? Who is our top talent?
– Are we developing future leaders?
– Do we have the talent in place to execute on our business plans?
– Do employees feel supported by the culture? How can we do a beFer job of suppor6ng them?
– Why do good employees leave? Who’s poaching from us?
* Ques&ons asked by these 2 cons&tuencies are not mutually exclusive.
Ques?ons Asked by HR*
– Are we aFrac6ng the right talent to the organiza6on?
– Do we have the right people in the right roles? Do we have enough of them?
– What is the growth and movement of our talent?
– Are higher paid employees beFer performers ?
– Is HR suppor6ng the talent management needs of our employees and managers? What can we do to beFer support them?
– What is the ROI on our training investments?

What Types of Talent Intelligence Exist?
§ Metrics § Analy6cs § Predic6ve Modeling
§ Reports § Scorecards § Dashboards

What is a Measure? A Metric? Analy?c? KPI?
Measure: Single data point indica6ng the 6ming or order of magnitude of a transac6on or process.
– Example: Date of hire
Metric: Meaningful informa6on, derived from data, that answers a basic ques6on about a process(s) or event(s); some metrics may be key performance indicators (KPIs).
– Example: Number of new hires in 2012
Analy?c: Ac6onable informa6on that enables business leaders to arrive at a realis6c and/ or op6mal decision based on rela6onships among metrics and/or measures.
– Example: Total cost of regreZable turnover among the class of 2012

Report: specific set of sta6c data; statement describing what has happened or the state of the organiza6on at a point in 6me
• Data may not be immediately ac6onable; o[en informa6ve • Limited to 1-‐3 measures / metrics, o[en segmented
– Example: Q3 Sales Turnover Report tells you only what turnover is for that Ome period, not whether the numbers are good, bad, require acOon, etc.
Scorecard: management tool to measure performance • Typically uses metrics from different func6ons to evaluate organiza6on or work processes • Requires an objec6ve standard against which scores can be measured • Limited to 3 – 7 measures / metrics
– Example: If the scorecard goal is 10 and you have "scored" 15, you know you are "winning" -‐ at least in regard to that metric.
Dashboard: source of business intelligence • Enables the organiza6on to monitor trends and risks • May include "thresholds" for acceptable results • Should be limited to 8-‐12 measurements.
– Example: Dashboards have measures that, taken in context, tell a story but on their own are not immediately acOonable.
Report? Scorecard? Dashboard?

Other Key Terms
Workforce Analy6cs – What happened? – What is happening? – What are the best ways to improve
performance? Workforce Planning
– What is our an6cipated demand for labor in different markets?
– Number of resources? Skills and abili6es needed?
– What is our strategy to fill the gap? – What will likely happen if we invest in “x”?

…Understand and Make Decisions.
3 Workstreams to Drive Bejer Decisions
What do We Need to Know? About Whom? Why? When?
Manage the Data and Perform the Analytics…
Strategic
Opera6onal
Technical
Design the Deliverable…
Package & Communicate…
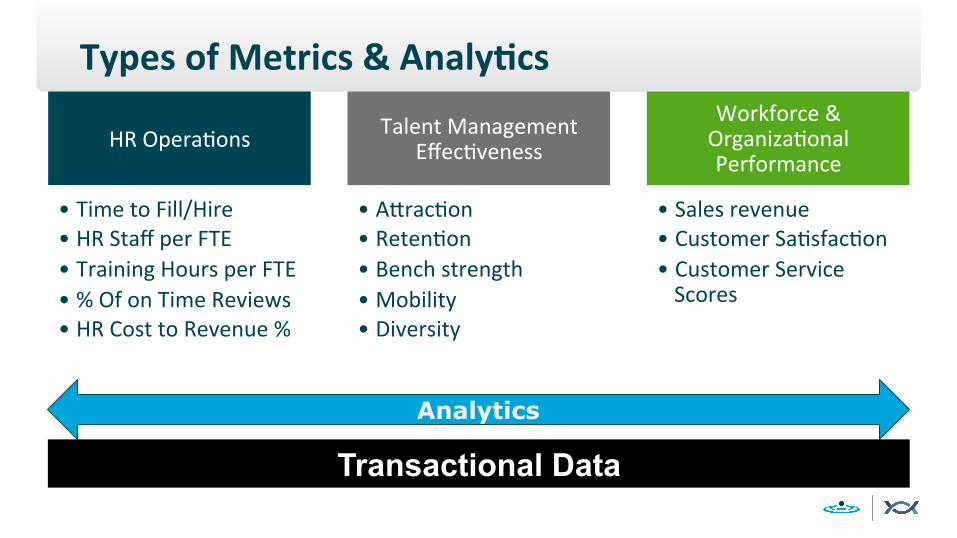
Types of Metrics & Analy?cs
HR Opera6ons
• Time to Fill/Hire • HR Staff per FTE • Training Hours per FTE • % Of on Time Reviews • HR Cost to Revenue %
Talent Management Effec6veness
• AFrac6on • Reten6on • Bench strength • Mobility • Diversity
Workforce & Organiza6onal Performance
• Sales revenue • Customer Sa6sfac6on • Customer Service Scores
Analytics
Transactional Data

What are Your Peers Measuring?
83.1% 71.2% 66.2% 61.6%
53.4% 52.5% 46.1%
32.9% 32.0%
16.0%
0%
20%
40%
60%
80%
100%
Employee reten6on/ turnover
Total compensa6on Recrui6ng efficiency (e.g., 6me-‐to-‐hire, cost per hire)
Workforce diversity Workforce demographics/
aging
Workforce skills & competencies
Employee engagement
Bench strength Workforce produc6vity
Workforce mobility
Please indicate whether your organiza?on measures or plans to automate the measurement of the following HR metrics.
Source: 2010 Knowledge Infusion & IHRIM HR Technology Survey N = 259
Knowledge Infusion Proprietary and Confiden6al, Copyright 2012

TALENT INTELLIGENCE MATURITY MODEL Workforce Analy6cs

Maturity Assessment Strategy will aim to advance forward on the maturity con?nuum.
• Process enabled by technology
• Disaggregate user experience
• Limited integra6on with other process/technology
• Some ability for holis6c repor6ng
• Processes unified from end-‐to-‐end but presented as independent
• Consistent user experience • Integra6on with other process/technology
• Ability for holis6c repor6ng
• Manual or paper based business process
• Disaggregate user experience
• Limited integra6on with other process/technology
• Limited ability to report data
• Process is fully unified and presented as a holis6c capability
• Seamless user experience
• Fully integrated with other technology
• Ability to report data holis6cally and delivery via drillable dashboards
Lagging
Performing Leading
Transforming
Drivers| Metrics
Governance| Capabili?es
Service Delivery Process & Data Efficiency &
Quality Technology

Talent Intelligence Maturity
Lagging • Compliance repor6ng • HR opera6onal repor6ng
Transforming • Talent mgmt effec6veness • Business impact of talent
Drivers| Metrics Governance| Capabili?es
Service Delivery
Process & Data Efficiency & Quality
Technology
• No center of excellence • Analysts run reports
• Shared resources / COE • HRGs partner with analysts
• Reac6ve; ad hoc • Sr. HR preFy much only ‘client’ facing
• Formalized service • Embedded in consul6ng
• Few standard defini6ons • Minimal standard processes
• Standard defini6ons • Shared, repeatable processes
• Limited automa6on • Limited quality tool sets
• Automated • Extensive quality tool sets
• Silo’d mul6ple databases • Spreadsheets
• Single data store • Standard toolset

10 Poten?al KPIs Name and Purpose Defined Equa?on
Workforce Produc?vity
1. Return on Human Capital Investment: Demonstrates the value of organiza6on’s investment in people (i.e., labor cost).
(Opera6ng Profit for Period / Total Employee Compensa6on & Benefits for Period) * 100
2. Opera6ng Profit per Employee: Links the 6me and effort of the workforce to produce a profit.
Opera6ng Profit for Period / Average Headcount for Period
3. Revenue per Employee: Links the 6me and effort of the workforce to produce revenue.
Revenue for Period / Average Headcount for Period
Staffing / Talent Management Effec?veness
4. Turnover Rate: As a lagging indicator, it links talent management prac6ces to quality of both people hired into specific roles and talent prac6ces, par6cularly when examining turnover reasons and; serves as a useful predic6ve metric for workforce planning; serves as a leading indicator of produc6vity.
(Total # of Separa6ons During Period / (Average Headcount for Period) * 100

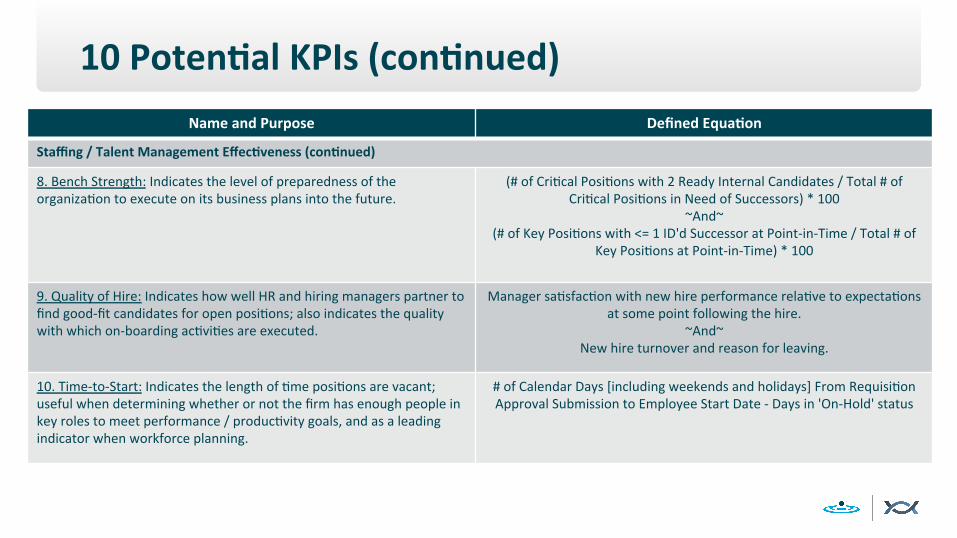
10 Poten?al KPIs (con?nued)
Name and Purpose Defined Equa?on
Staffing / Talent Management Effec?veness (con?nued)
5. Employee Engagement: Indicates the percentage of employees who like their jobs, appreciate the organiza6on’s value proposi6on, and feel their managers are effec6ve; serves as a useful leading indicator of turnover.
Periodic Survey Results
6. Average Total Compensa6on by Performance Ra6ng: Isolates considera6on of employee performance as factor on the value assigned to employee.
For Each Headcount Assigned a Ra6ng During Period: (Total Dollars Salary + Total Incen6ve Dollars + Total Dollar Value of Shares /
Average Headcount for Period) * 100
7. Internal Mobility: Reflects the extent to which employer value proposi6ons of employee career development and career advancement are realized.
(Total # Internal Advancements / Average Headcount for Period) * 100
~ And ~ (Total # Transfers that are Lateral Moves / Average Headcount for
Period) * 100
10 Poten?al KPIs (con?nued) Name and Purpose Defined Equa?on
Staffing / Talent Management Effec?veness (con?nued)
8. Bench Strength: Indicates the level of preparedness of the organiza6on to execute on its business plans into the future.
(# of Cri6cal Posi6ons with 2 Ready Internal Candidates / Total # of Cri6cal Posi6ons in Need of Successors) * 100
~And~ (# of Key Posi6ons with <= 1 ID'd Successor at Point-‐in-‐Time / Total # of
Key Posi6ons at Point-‐in-‐Time) * 100
9. Quality of Hire: Indicates how well HR and hiring managers partner to find good-‐fit candidates for open posi6ons; also indicates the quality with which on-‐boarding ac6vi6es are executed.
Manager sa6sfac6on with new hire performance rela6ve to expecta6ons at some point following the hire.
~And~ New hire turnover and reason for leaving.
10. Time-‐to-‐Start: Indicates the length of 6me posi6ons are vacant; useful when determining whether or not the firm has enough people in key roles to meet performance / produc6vity goals, and as a leading indicator when workforce planning.
# of Calendar Days [including weekends and holidays] From Requisi6on Approval Submission to Employee Start Date -‐ Days in 'On-‐Hold' status

Metric Decision Tree
Retain? Drop metric.
No
Yes
•Does it provide meaningful and actionable data?•Have or could we utilize this data to make decisions?
Adopt metric and plan for dev’t, delivery & change. Weigh the costs and benefits,
Do we currently track & deliver this metric?
Reconsider metric or approach.Weigh the costs and benefits.
Reconsider metric or approach.
Yes No
Yes No Yes
Do we have a precise objective for how this metric will be used and what decisions it will support?
Yes
No
Can we obtain the data to support this metric? Source system(s) defined? Data defined? Etc.?
YesNo
Is the process for obtaining and preparing the metric
overly burdensome?
No
Can we define [and agree on]a valid formula for this metric? Drop metric.
SYSTEMS & DATA ROADMAP EXAMPLE Workforce Analy6cs

SAMPLE PROJECT & ROADMAP Workforce Analy6cs

What Might a 3-‐Year Plan Look Like? How About a 1-‐Year Plan?

Guiding Principles One of Our Clients Used When Refocusing its Talent Intelligence Mission through an Implementa?on
1. Each measure, metric and analy6c must be linked to a business driver provide meaningful informaOon about how we leverage people, resources and capital to improve enterprise performance.
2. We will iden6fy and measure what is ‘important to measure’ as opposed to measuring what is ‘easy to measure.’
3. We will iniOate a consistent and disciplined data collecOon methodology that includes standard definiOons for measures, metrics and analy6cs.
4. We will provide business users – our customers – with direct access to the data, metrics and analyOcs they need to make smart decisions about people.
5. We must understand upfront that due to technology constraints, it may not be possible to obtain reliable data on all desired measures. We will start small with a few criOcal measures that can be collected and add measures over Ome.

Sample Ac6on Plan – Year 1 ReporOng – Provide Clarity
Recommendations • Define responsibility for metrics / reporting / analytics within HR • Create a list of standard reports & align on terminology • Develop intake strategy for report requests
Actions: • Establish clear divisions of labor and formal roles & responsibilities for tracking,
analyzing and reporting on various workforce metrics • Align on common definitions (headcount, turnover, absenteeism) • Create centralized data model • Take ownership of HR data • Streamline current report creation, (e.g. Talent Pipeline report) • Declaration from Leadership to support designation of standard reports and
common definitions of key HR metrics • Conversations with partners (e.g. Finance, business leaders) to update their
definitions • HR Reporting builds a core set of the most frequently requested standard reports
for business leaders to access via self-service, reducing manual efforts to provide customized reports
• Train HRBPs to interpret
Resources / Participants • Sponsor(s): Carrie Blair • Owner(s): Leslie Michener • Resources: N/A Timeline: • 9 Months – Implementation • 9 Months – Maintenance Estimated Cost: Vendor Costs – N/A • Implementation Internal Resources – N/A • Implementation External Resources – N/A • Maintenance Resources – N/A Value Generated: • Perception that HR has taken ownership & control of its data • Less duplication of effort trying to track numbers and generate reports within HR
and between HR & Finance • Appropriate expectation setting for HR’s partners
Risks & Dependencies: • Disagreements between HR and Finance about what constitutes headcount, turnover, absenteeism, etc. not being resolved • Inability of HR reporting team to combine data effectively in order to generate standard reports that meet partners’ demands
CY 2012 CY 2013 Q3 Q4 Q1 Q2 Q3 Q4
People/Process Technology
Declaration from Leadership to Support Designation of Standard Reports Conversa6ons with partners to update defini6ons
Develop Intake Strategy for Report Requests Create List of Standard Reports
Define responsibility for Metrics/Analytics/ Reporting within HR

Discussion
Jason Averbook Chief Business Innova6on Officer @jasonaverbook hFp://blog.knowledgeinfusion.com